1. Introduction
With the increasing importance of alternative powertrains, non-exhaust emissions are becoming more relevant. This is reflected in mitigation strategies through the new Euro 7 emissions standard, which, for the first time, includes non-exhaust emissions. A detailed investigation of brake and tire wear particles is necessary for the continued reduction of traffic-related emissions and the assessment of future risks to health [
1,
2,
3,
4]. Early studies on car brakes revealed that particles are emitted in two size modes (based on particle mass) within the braking process [
5]. This proved that particle emissions from brakes are not limited to mechanical abrasion but are also a source of ultrafine/fine particles (UFP).
The health risks related to airborne particles from traffic have been extensively studied. Ultrafine particles with a diameter of less than 100 nm are the focus of current epidemiological research. These particles can reach the distal areas of the human lung and therefore represent a severe health hazard [
6,
7]. In addition to their physical properties, the chemical composition of airborne particles has health implications [
8]. Although systematic studies identifying the impact of non-exhaust emissions on public health are lacking, many experiments have indicated that airborne brake wear particles have negative impacts on health [
9,
10,
11]. A study by Dällenbach et al. showed that non-exhaust emissions were the dominant source of oxidative potential in densely populated areas [
12]. Consequently, they suggested that the sources of airborne particles should be subject to regulation.
Standardized test procedures for the measurement of brake wear emissions are currently under development by the Particle Measurement Program (PMP) as a basis for future regulation [
13,
14,
15,
16,
17]. The PMP is an informal working group of the United Nations Working Party on Pollution and Energy (GRPE). The work includes defined component test bench setups and test procedures as well as specific driving cycles, e.g., the WLTC Brake cycle [
18]. Component tests enable investigation of brake discs under reproducible conditions and the comparison of different brake systems. Its various investigations have already provided valuable insights, such as the influence of bedding-in new brakes [
19] and brake temperature [
20,
21] on emissions.
Conditions on the component test bench are very different to those on the vehicle and do not reflect the complexity of the system. Furthermore, new emission reduction technologies such as regenerative braking and brake wear collection systems can only be evaluated through vehicle-level investigations. Therefore, vehicle testing is a key method for the validation of non-exhaust emissions in realistic scenarios.
To date, published on-vehicle studies have only been carried out using combustion vehicles. However, electrification obviously affects particulate emissions and the exact extent of the impact remains to be researched. The key countervailing factors in this regard are increasing vehicle weight, which generally leads to higher braking emissions [
5,
22], and recuperation, which reduces brake wear [
23]. There is a lack of experimental data for both factors, which leads to substantial uncertainties in modeled predictions [
22,
24,
25,
26,
27]. A recent study by Beddow et al. predicted a reduction in PM2.5 emissions of up to 27% for a purely battery-powered fleet of electric cars, based on emission inventories [
28].
Early chassis dynamometer and on-road studies mainly focused on particulate matter (PM) measurements and fine particles in the micrometer range [
29,
30]. More recent studies have also included particle number and size distributions [
31,
32,
33]. Chasapidis et al. used an open measurement system by adding a pipe probe behind the brake disc, whereas Mathissen et al. designed a semi-closed setup for vehicle studies. In both cases, the main challenges were high particle losses due to non-isokinetic sampling, together with the identification of brake emissions due to tire wear and the ambient background concentration. A patent by Augsburg et al. describes a device for measuring and qualifying particle emissions, which includes a full housing for the brake on the vehicle [
34].
The measurement of non-exhaust particulate matter is an emerging technological challenge. The reason for this lies in the complexity of the vehicle as a whole and the difficulty of dynamically measuring wear particles. To counter this difficulty, a new measuring system was developed and two approaches, recuperation and brake discs coating, for reducing particle emissions were tested. The aim of this study was to realistically determine and characterize the airborne brake wear particle emissions from a battery-powered electric city car in a real operational scenario. We present a closed, onboard measurement setup for the investigation of ultrafine/fine brake emissions under realistic conditions but without the external influences of tire- or road-wear particles. Measurements of the particulate emissions of the test vehicle were performed using a chassis dynamometer. In addition, the influences of regenerative braking (recuperation), brake disc temperature, and brake disc coating were investigated.
2. Materials and Methods
A BMW i3 was chosen for the tests as an example of an electric vehicle that is in use in urban areas. The vehicle used was first registered in September 2015. It had a vehicle weight of 1228 kg and a battery capacity of 60 Ah.
The road resistances force of the test vehicle is determined as an effective force F (in N) and is described for the road simulation on the roller test bench as a function of the driving speed v by a second-degree curve fit as shown in Equation (1):
Thereby, constant A represents with 129.04 N/(km/h) the coefficient of friction and rolling resistance, B represents with 0.58 N the part of the rolling resistance coefficient that is linearly dependent on the speed, and C represents with 0.02886 N/(km/h)2 the air resistance coefficient.
The testing vehicle was modified to enable the separate measurement of airborne brake- and tire-wear particles. The onboard particle sampling setup was implemented on the left-hand side of the rear axle of the vehicle. The wheel was driven, non-steered, and contained a disc brake.
Many vehicle parameters were recorded via a central onboard data logger that was adapted for this application. These parameters included the driving route, vehicle speed, lateral and longitudinal accelerations, wheel torque, and the power of the drive unit. Multiple sensors were integrated for these tasks, including a torque measurement wheel, acceleration sensors, and a GPS module.
The brake consisted of a floating brake calliper with one piston and a cast-iron disc without internal ventilation. It was comparable to many brake systems currently used on the road.
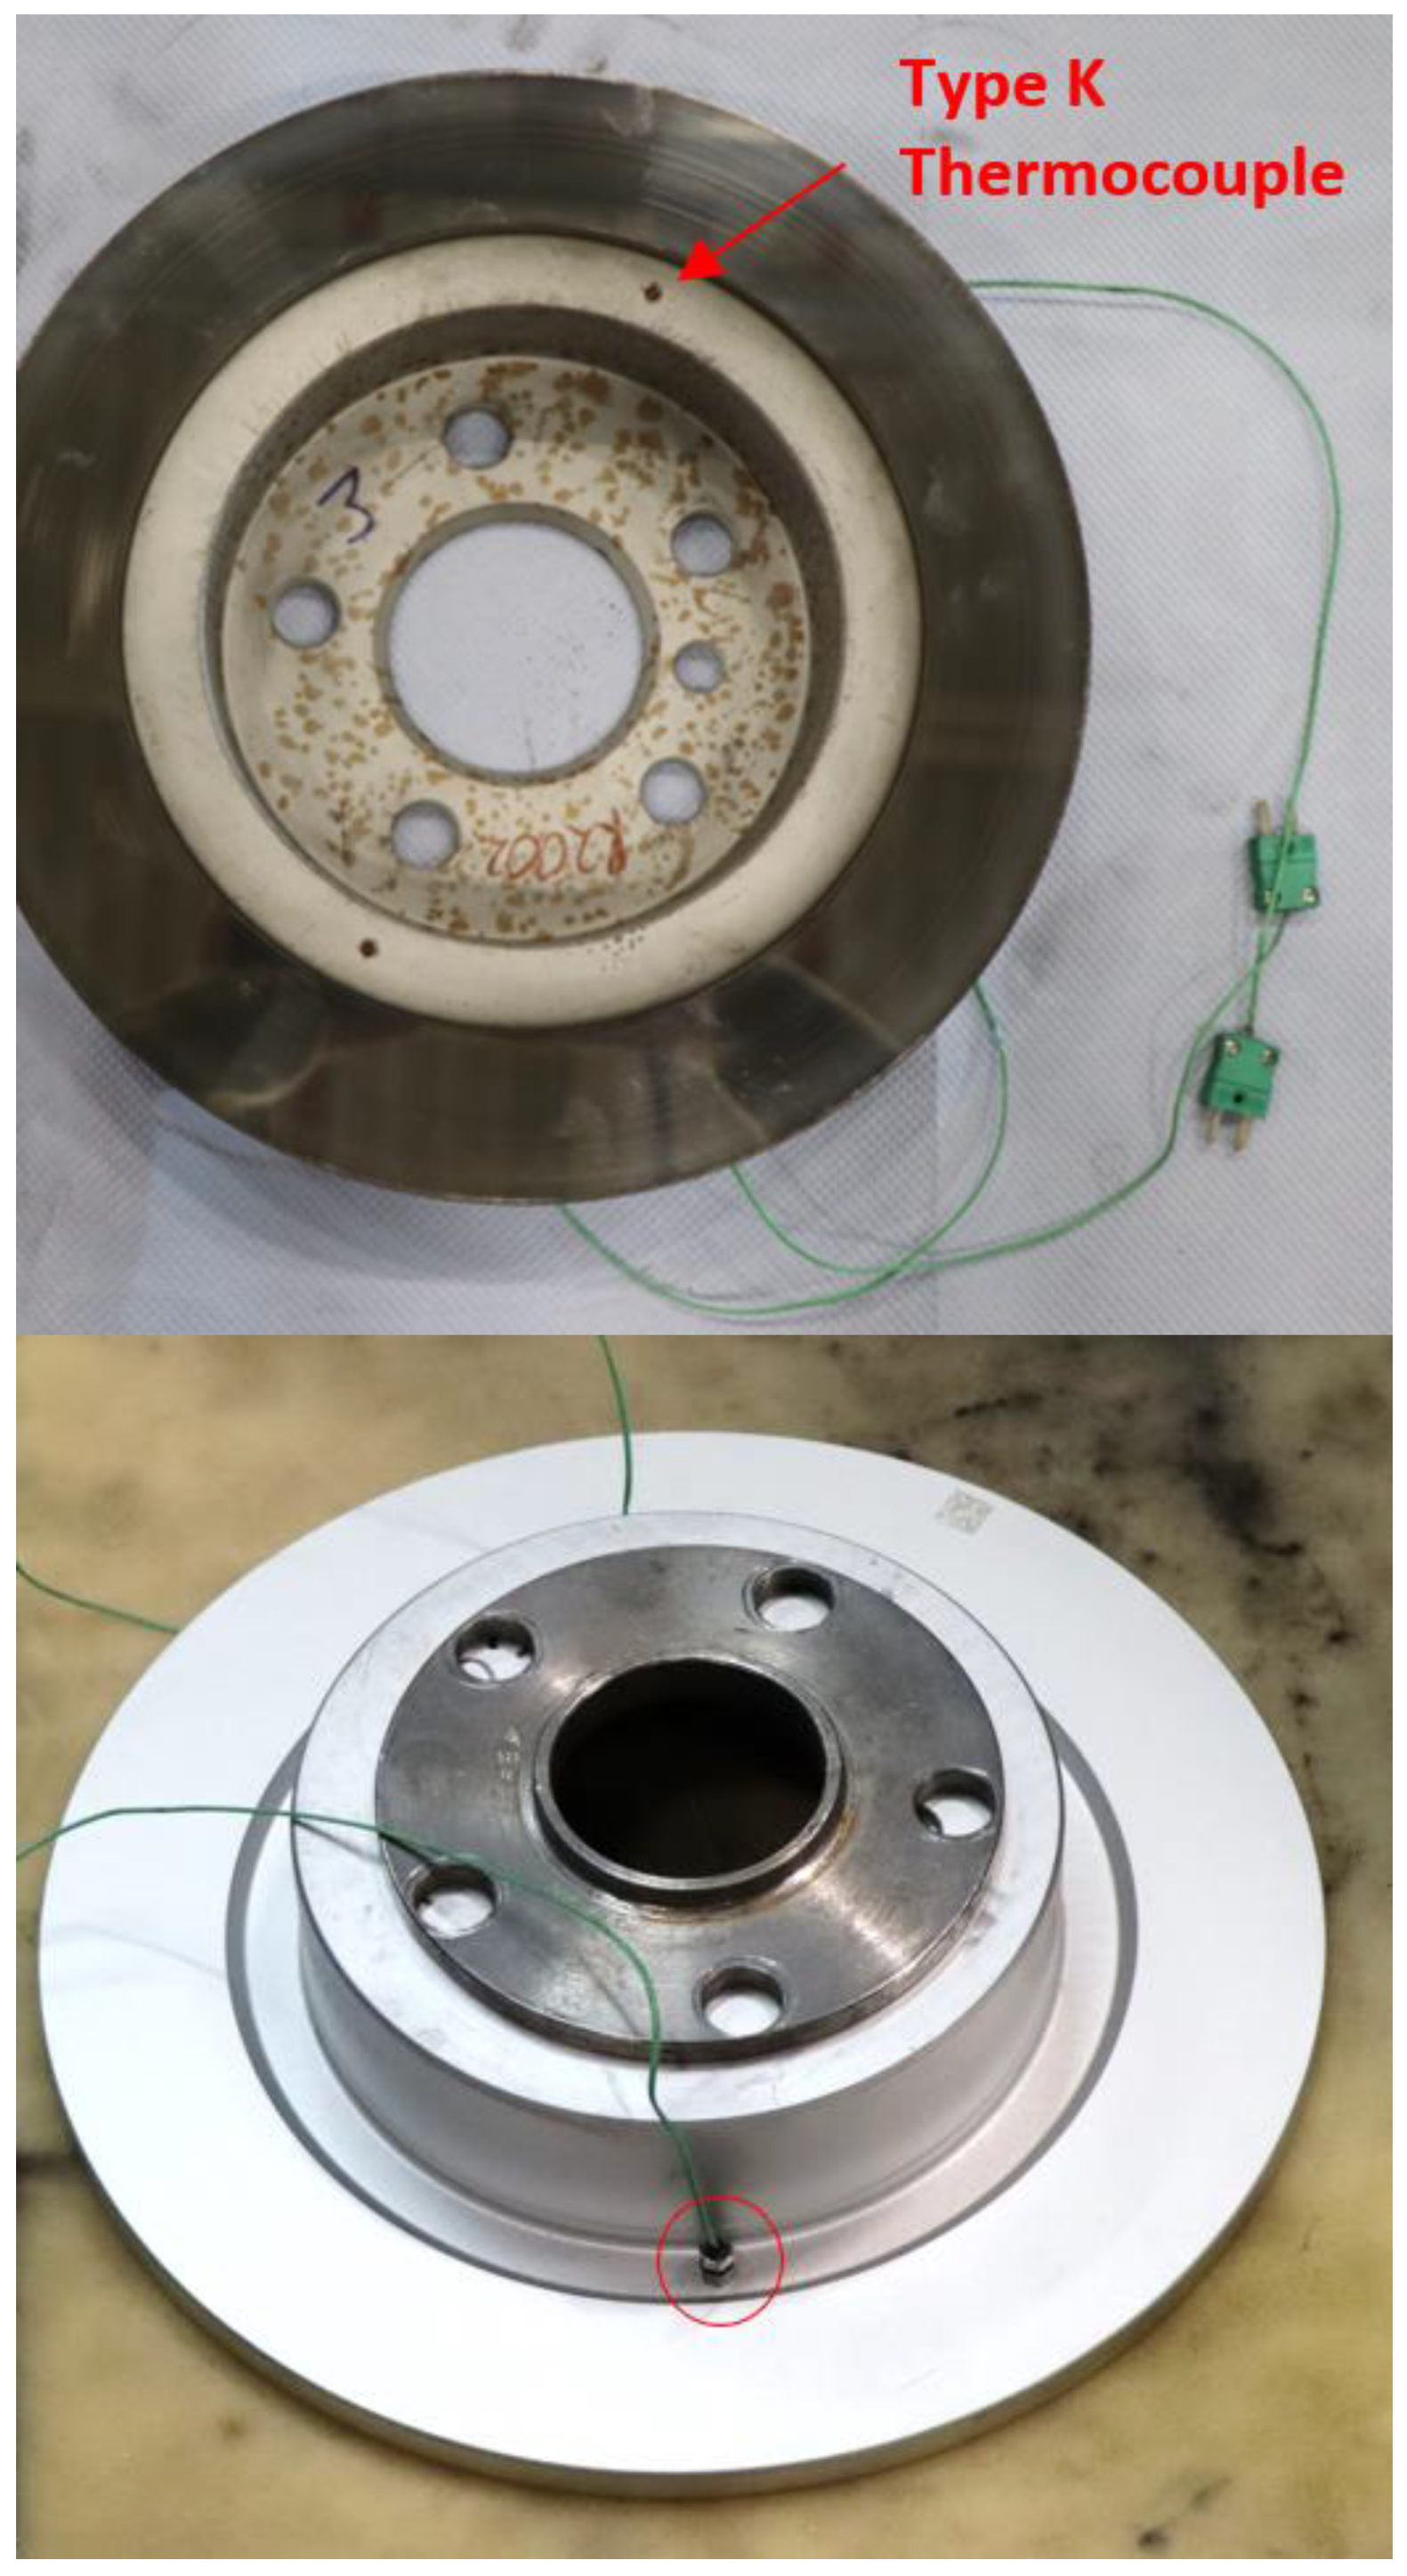
To obtain more information about the condition of the brake system, the hydraulic pressure and the temperatures in various locations were measured. Therefore, type K thermocouples of class 1, IEC 584-3 K-NiCr/Ni with a tolerance of ±1.5 °C between −40 and 1000 °C and 1 Hz resolution were integrated into the brake calliper, brake pads, and brake disc.
Figure A1 shows the integration of two thermocouples into the brake disc. The thermocouples were integrated at a distance of 180 degrees in the inner area of the brake disc and screwed in with a maximum depth of 2 mm to the surface. The temperature measurement used was different from the test method described in GRPE 2023/4 V6. Although the measured temperature did not correspond to the temperature at the contact surface between brake disc and brake pad, it is an important indicator for mechanical contact and braking events. In addition, it was used for the adjustment of the volume flow in the measurement setup.
Like most other EVs, the BMW i3 features regenerative braking using its electric drive system. The vehicle control unit always attempts to recuperate as much of the brake power as possible. Therefore, the hydraulic brake system is only activated if the requested brake power comes close to or exceeds the maximum possible regenerative brake power. To investigate the influence of regenerative braking on particle emissions, the recuperation was deactivated for several of the tests. This was done via the error mode of the dynamic stability control (DSC). Recuperation was switched off after disconnecting the signal cable from the sensor on the right rear wheel to prevent the vehicle from skidding because of the uncontrolled braking torque on the rear axle.
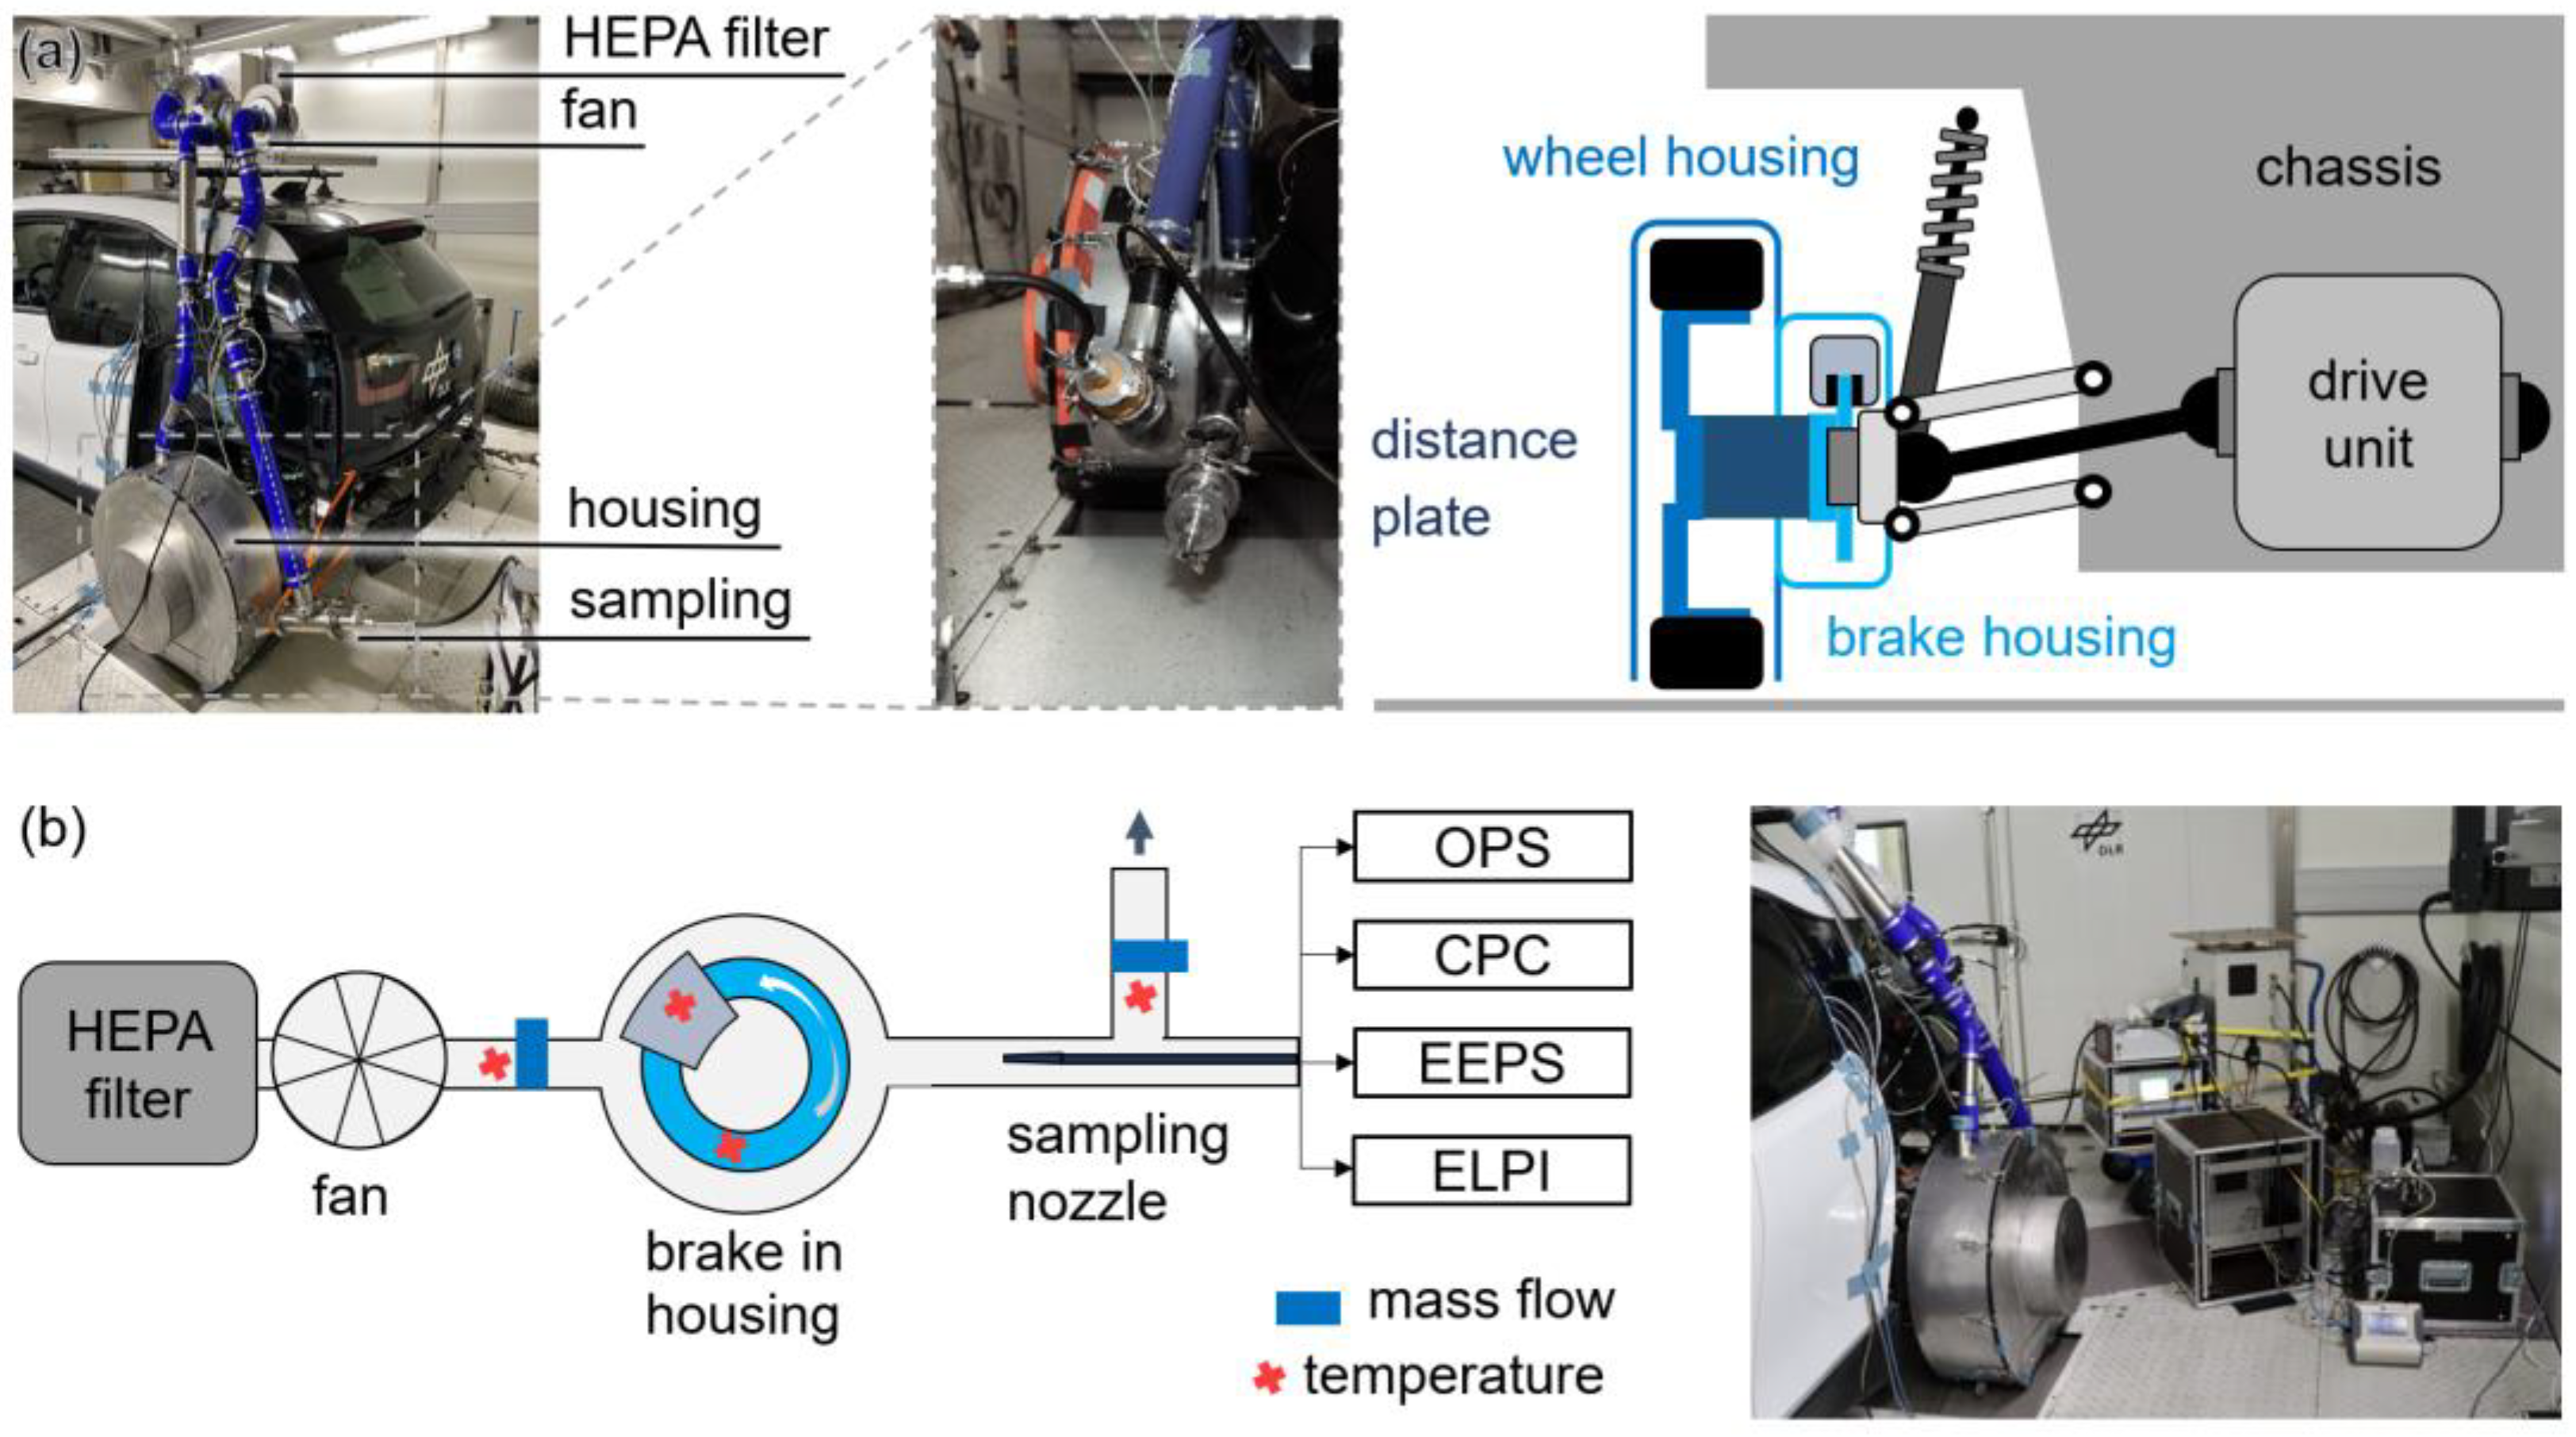
For selective investigation of brake and tire wear particles, the two components were separated from each other by an offset plate.
Figure 1a shows the tailor-made housings with an air inlet and outlet designed around the brake and tire. The results of the tire measurements do not form part of this study and will be published elsewhere.
The ventilation system features air channels leading to electric blowers and can be connected to either housing. The filter and other components of the air path are connected with flexible tubes and are located on the vehicle roof. For the closed sampling system around the disc brake, the air intake is connected to a multistage H 13/F7 filter system which ensures a particle background concentration below . The flow rate and pressure inside the housing can be adjusted. The air mass flow, temperature, and pressure of the ventilation system are determined by integrated sensors (Bosch HFM 5, Type K, AMS 4712-1200-B, AMS 4712-0020-D-B).
In this setup, the ventilation of the brake deviates from realistic conditions because the brake is enclosed and artificially ventilated with HEPA air. Earlier studies showed that ventilation systems at the brake influence the brake temperature and, thus, the release of particles [
32,
33]. To ensure realistic brake ventilation despite the enclosure, the brake temperatures were determined via a reference measurement on the roads around Stuttgart [
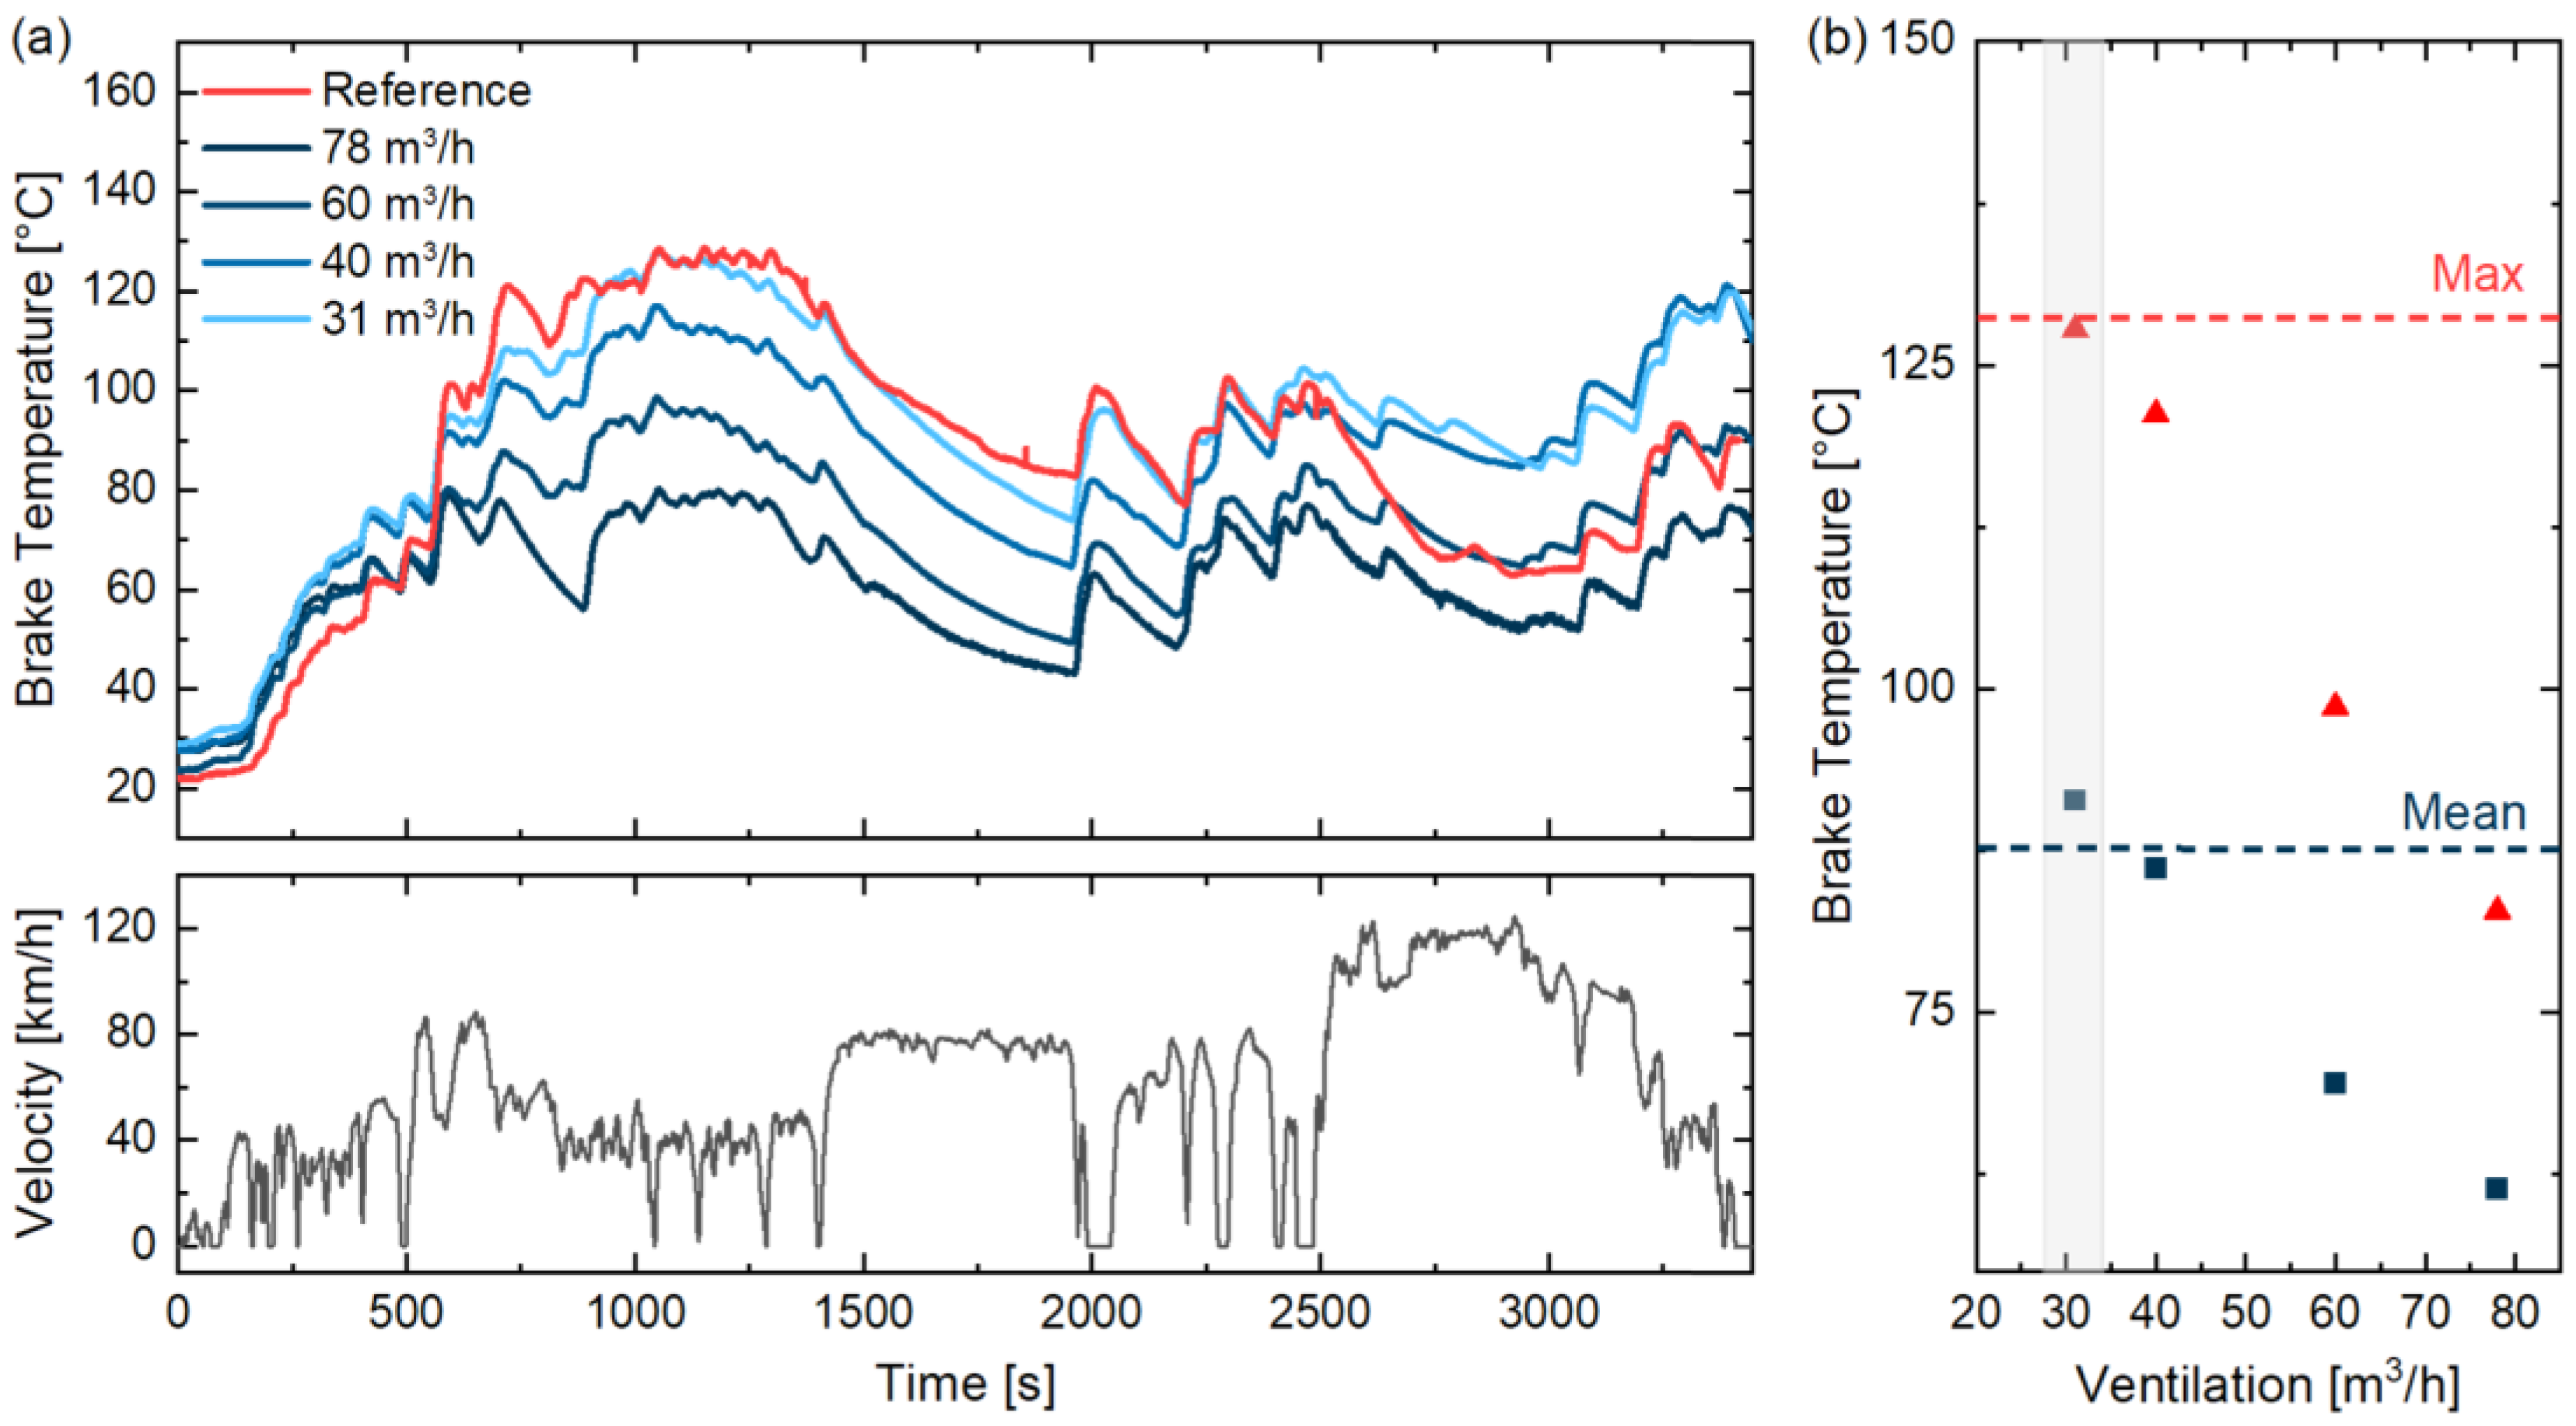
35] with the test vehicle in its original condition. The recorded driving profile was replicated in the onboard measurement setup of the chassis dynamometer. In four runs the constant ventilation flow varied between 31 and 78
.
Figure 2 shows the measured brake temperature profile of the on-road reference and repetition runs. The brake temperature of the on-road reference depends on the use of the brakes and the degree of brake ventilation, which increases with the speed of the vehicle. In urban traffic, the brake temperature increases due to numerous braking events and low brake ventilation. At high vehicle speeds, the brake temperature decreases again due to fewer braking events and strong ventilation. In the repetition runs, brake ventilation is independent of vehicle speed and remains constant. This leads to a deviation of the temperature profile. A high ventilation flow can reproduce the disk temperatures of a high vehicle speed but leads to overcooling results for a low vehicle speed. The lowest ventilation level of 31
could reproduce the maximum temperature from the on-road test and was therefore selected for the emission measurements. The diameter of the sampling nozzle was chosen so that the flow velocity of the sampling line matched the velocity inside the housing in order to achieve representative, isokinetic sampling.
2.1. Aerosol Measurement Equipment
As displayed in
Figure 1b, particle sampling was undertaken in the channel close to the air outlet of the housing. Airborne particle sampling was performed in-line and isokinetically by adapting the sampling nozzle diameter to the chosen air flow. The sampled air was divided using flow splitters and connected to particle measurement instrumentation inlets using carbonised tubes. The measurement equipment used is regularly subjected to calibration at the manufacturer. The conformity of the measurement devices before each measurement campaign was tested with an aerosol generator. Losses inside the sampling system were determined size-dependently using sodium chloride salt (NaCl) particles produced by a portable test aerosol generator (TSI, Model 3073) and taken into account. The background concentration was monitored before and after each measurement. Due to the customized enclosure and the ventilation of the brake with filtered air, the background particle number concentration is below
and can be neglected.
Three particle measurement devices from TSI GmbH were used in combination to measure particle number concentration (PNC) and the size distribution of airborne particles (PSD): A TSI 3752 Condensation Particle Counter (CPC) to measure the PNC of particles between 4 nm (D50) and 3 μm; a TSI 3090 Engine Exhaust Particle Sizer (EEPS) for measuring PSD ranging from 5.6 to 560 nm simultaneously in 32 channels; and a TSI 3330 Optical Particle Sizer (OPS) for measuring the PSD ranging from 300 nm to 10 μm in 16 channels. All instruments were operated at 1 Hz.
Airborne particles detected by the CPC can be assigned to the size range of ultrafine/fine particles by the continuous size-selective measurement of the EEPS. In this article, the airborne particles measured by the CPC are referred to as ultrafine/fine particles, and those measured by the OPS are referred to as coarse particles. (The size ranges detected by the CPC and the OPS overlap and do not correspond to the common definition of coarse, fine, and ultrafine airborne particles. The designation used here is simplified to improve readability.) For some experiments, a catalytic stripper (CS10) from Catalytic Instruments with a 10 l flow at 350 °C was used upstream of the EEPS to determine the fraction of nonvolatile brake abrasion particles. Losses inside the catalytic stripper were corrected according to the penetration curve shown in
Figure A2, which was determined using solid graphite particles. In addition, for offline REM-EDX analysis, particles were collected size-selectively on aluminum and polycarbonate substrate using an electric low-pressure impactor (ELPI+) from DEKATI.
2.2. Testing Environment and Driving Cycles
The experiments took place on an air-conditioned four-wheel dynamometer test stand at the DLR-Institute of Vehicle Concepts in Stuttgart. The dynamometer independently drove 48″ rollers, each with a continuous power of 100 kW.
After load balancing of the test vehicle, the drag coefficients of the chassis dynamometer test stand were 21.85, −0.9376, and 0.03683, respectively. By comparing the force at the wheel, the distribution of the braking force can be determined. In case of the WLTC Brake Part 10 without recuperation, the front-rear distribution of the braking force is 30.8% at the rear and 69.2% at the front.
Three different driving scenarios were used to investigate the braking emissions of the test vehicle (
Table 1): WLTC Class 3b, designed for measurement of combustion emissions, WLTC Brake (Part 10) developed for brake emission measurements on a component test bench, and a real driving cycle including urban, rural, and motorway sections (
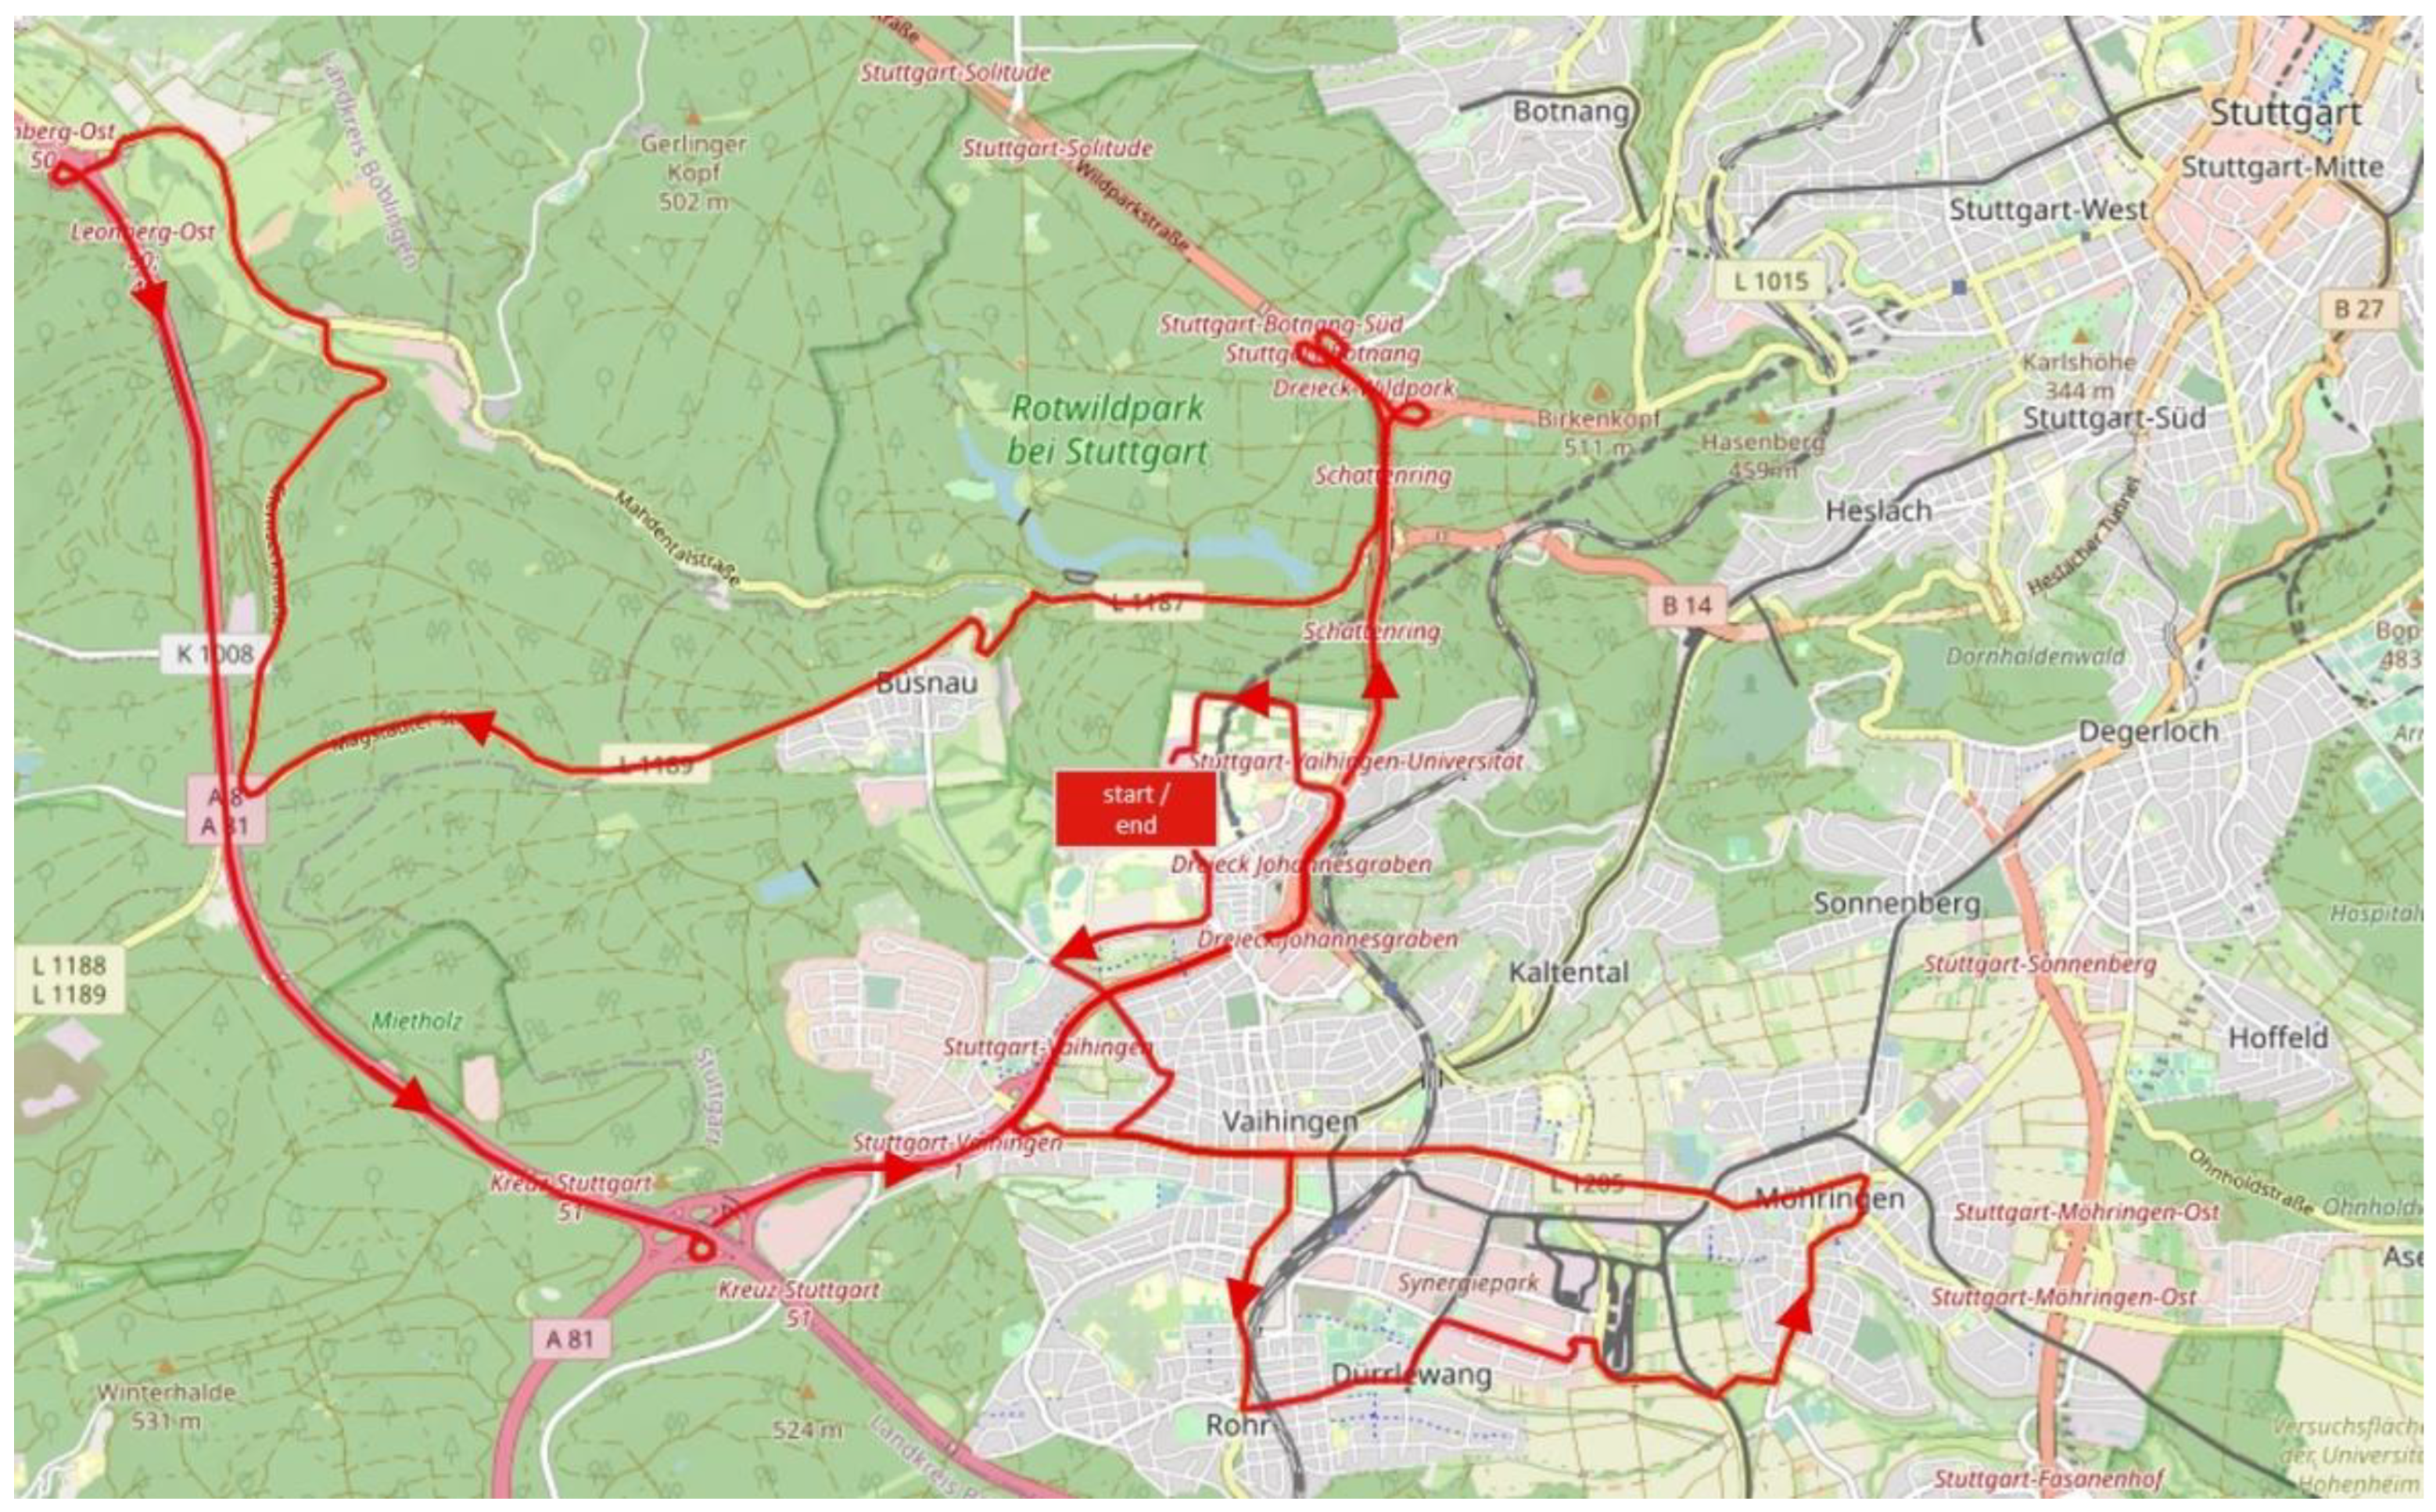
Table A2). The real driving cycle was based on a real drive of the BMWi3 around Stuttgart during which the speed and gradient were recorded. This trip is shown in
Figure A3. The cycles could then be repeated under reproducible conditions on the chassis dynamometer. As shown in
Table 1, the parameters of the investigated driving cycles varied in length and distance, which influence the heating of the brake over time. Furthermore, they include a variety of velocities and braking events.
In addition, to understand the mechanism of particle generation and characterize the size distribution, two simple test cycles were designed. The ZEDU Accelerate Cycle consisted of defined acceleration from 0 to 30, 60, 90, and 120 k/h with a subsequent phase of constant driving and braking. The ZEDU Brake Cycle consisted of different strengths of braking at the same speed from 80 to 0 km/h. Both are described in
Table A1.
3. Results and Discussion
3.1. Characterization of Airborne Brake Wear Emissions
3.1.1. Particle Size Distribution
Brake particle emissions were examined in a simple test cycle to determine the size distribution of emitted airborne particles. The results in
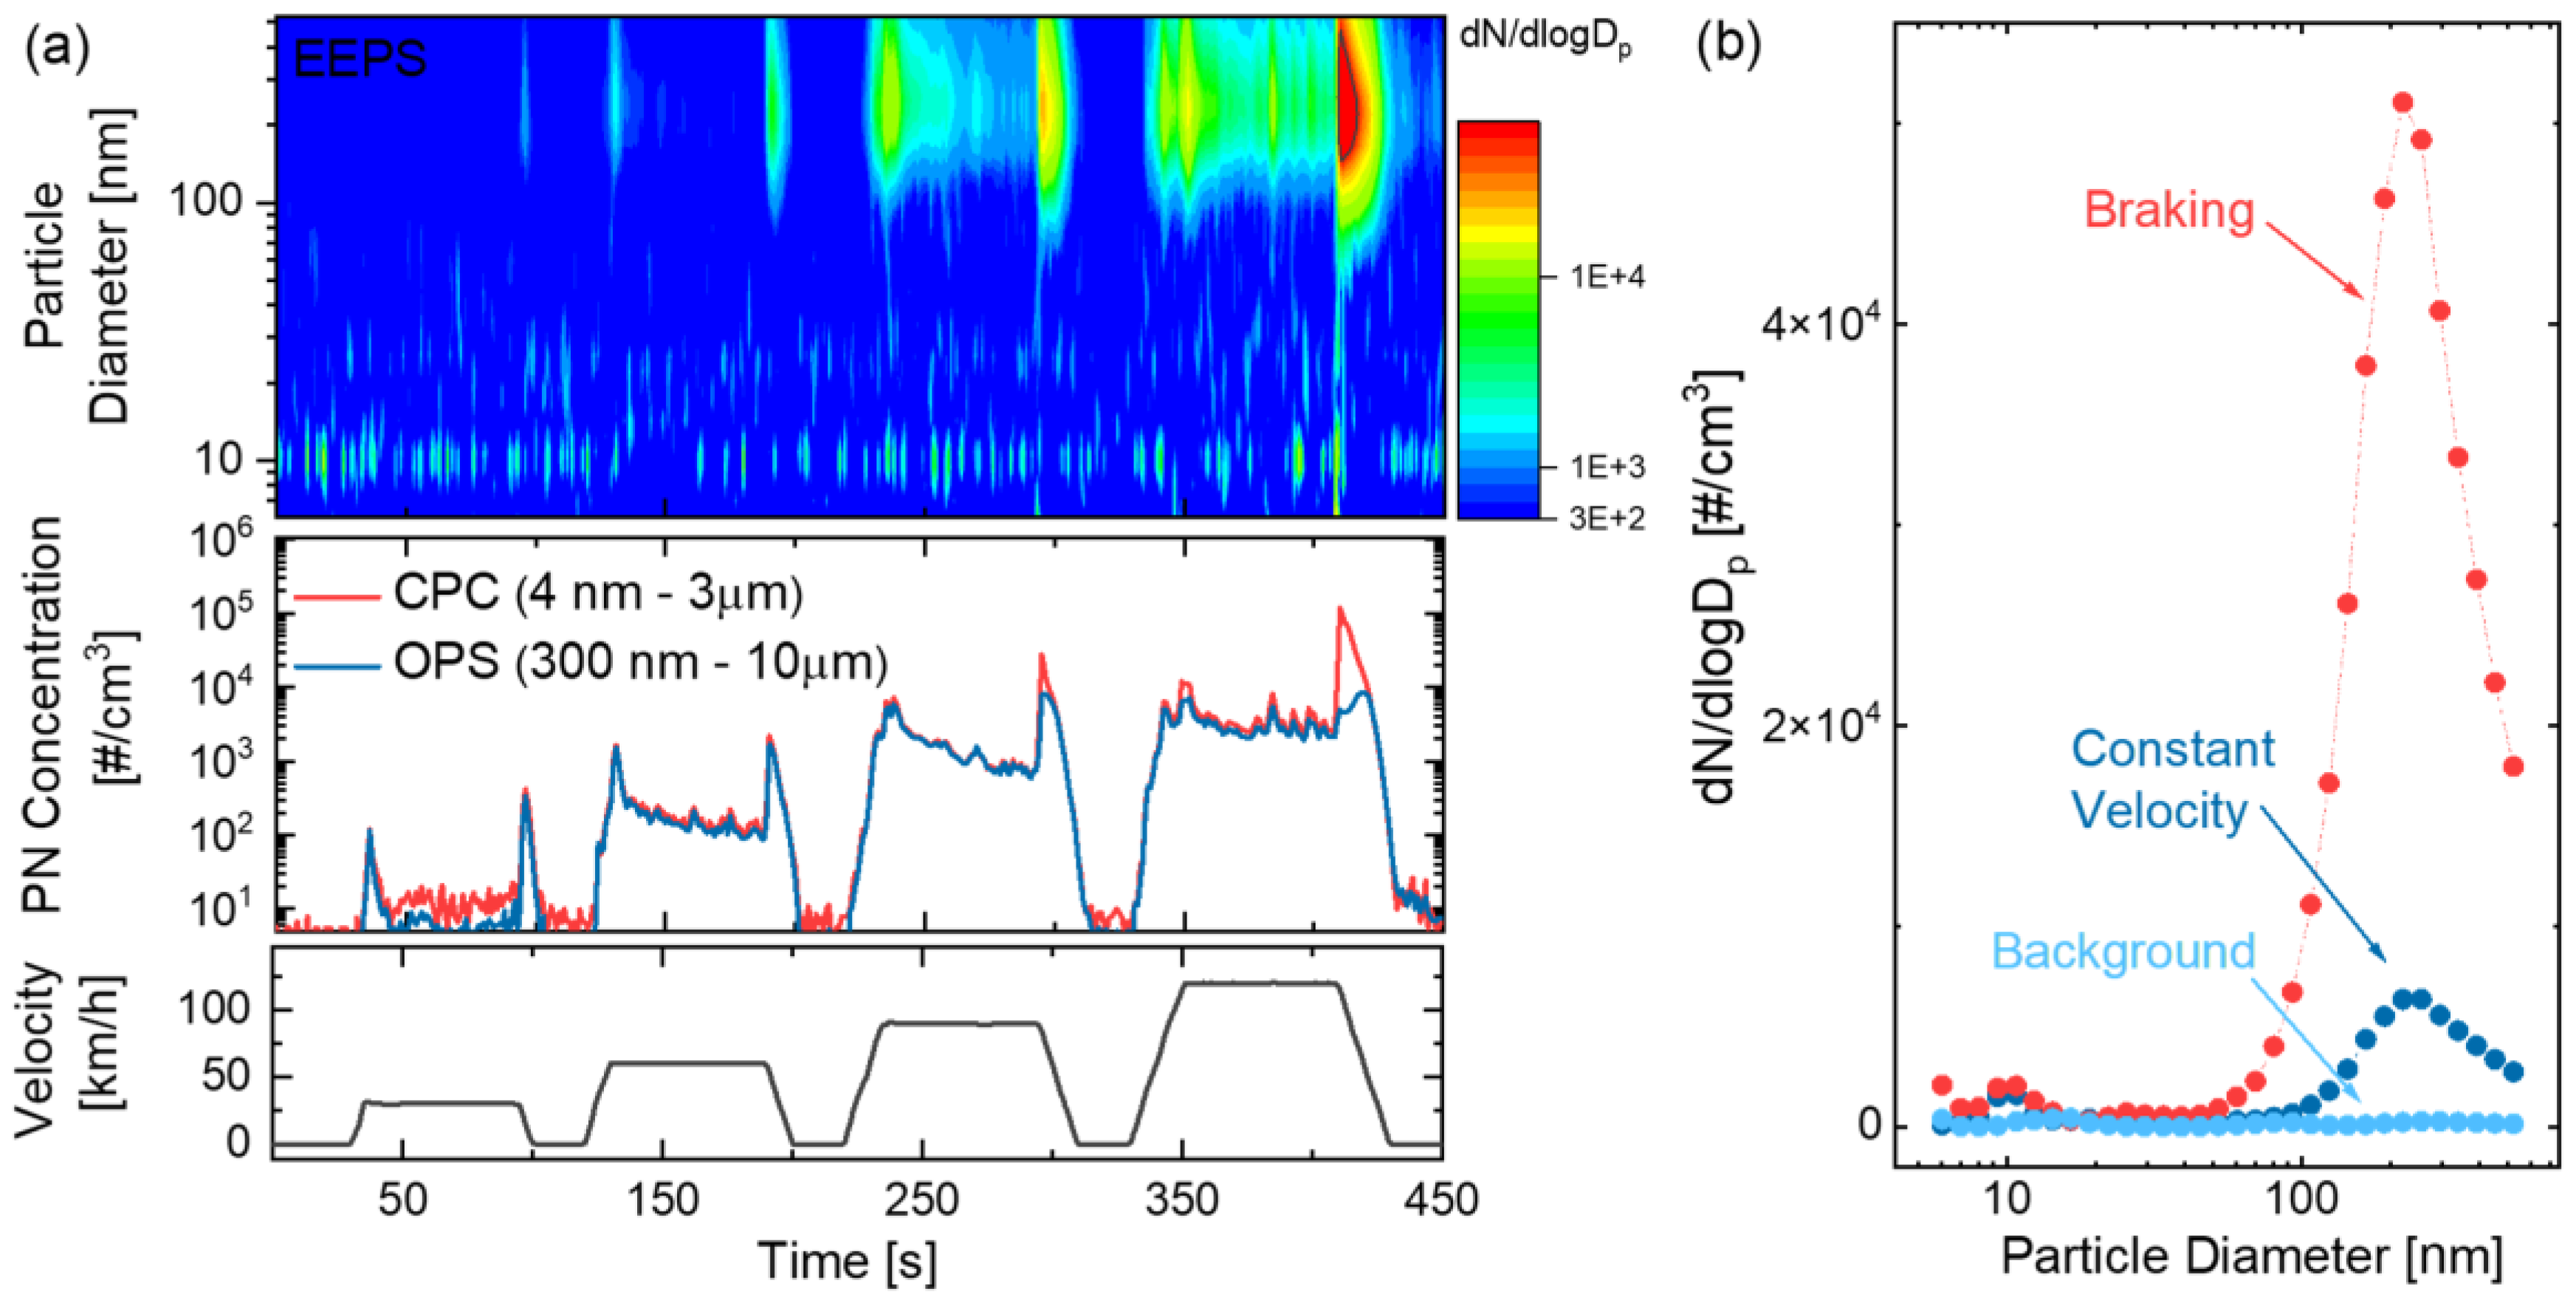
Figure 3a show that braking emissions arose not only during the actual braking but also when accelerating and driving at a constant speed. The measured particle concentration increased with increasing velocity. Two particle size modes were observed (
Figure 3b): first, a dominating particle mode with a maximum size of 220 nm (±34 nm), a lower limit of approximately 50 nm in the ultrafine range, and an upper limit outside the particle size measuring range of the EEPS (560 nm), and second, ultrafine particles with a diameter of approximately 10 nm.
The particle emissions detected in the 220 nm mode were the result of abrasion caused by mechanical processes on the friction surface between the brake pad and the brake disc. The ultrafine particles in the 10 nm range were produced by thermal processes, as described in the next section.
The combined use of CPC and OPS makes it possible to monitor particle emissions across a wide size range from 4 nm up to 10 μm. Because particle concentrations are often at the lower detection limit, the EEPS can only reproducibly measure the number of particles and their size distribution for relatively high emission events, e.g., during heavy braking and at high speeds. The CPC optically measures particle concentration in the ultrafine and fine ranges between 4 nm (D50) and 3 μm, which includes both emission modes. The OPS detects particles in the coarse mode between 300 nm and 10 μm, and even though its cut off is above the maximum of the 220 nm mode, it is capable of detecting a relevant number of particles of the broad mode.
In general, very different size distributions were measured in previous studies. In different test scenarios (pin-on-disc, brake dynamometer, and real driving), uni-, bi-, and multimodal distributions were measured with maxima between 0.01 and 2 μm [
36]. The reasons for these differences were the significant variability in driving conditions, braking systems, and measurement techniques [
37]. Despite the large variability, the measured results were consistent with two recent component studies using the same measurement technique. In investigations using an EEPS at the brake dynamometer, Mamakos et al. [
16] measured a unimodal distribution of brake emissions with a maximum at 140 nm. At higher temperatures, additional particles in the 10 nm range were observed here, with increasing size. In the test bench investigation performed by Vojtisek-Lom et al. [
17], the EEPS electromobility diameter showed a consistent peak at 200–250 nm, with an additional emission peak at 10 nm during heavy braking. In our study, a similar size distribution was observed for the determined aerodynamic diameter using the ELPI+.
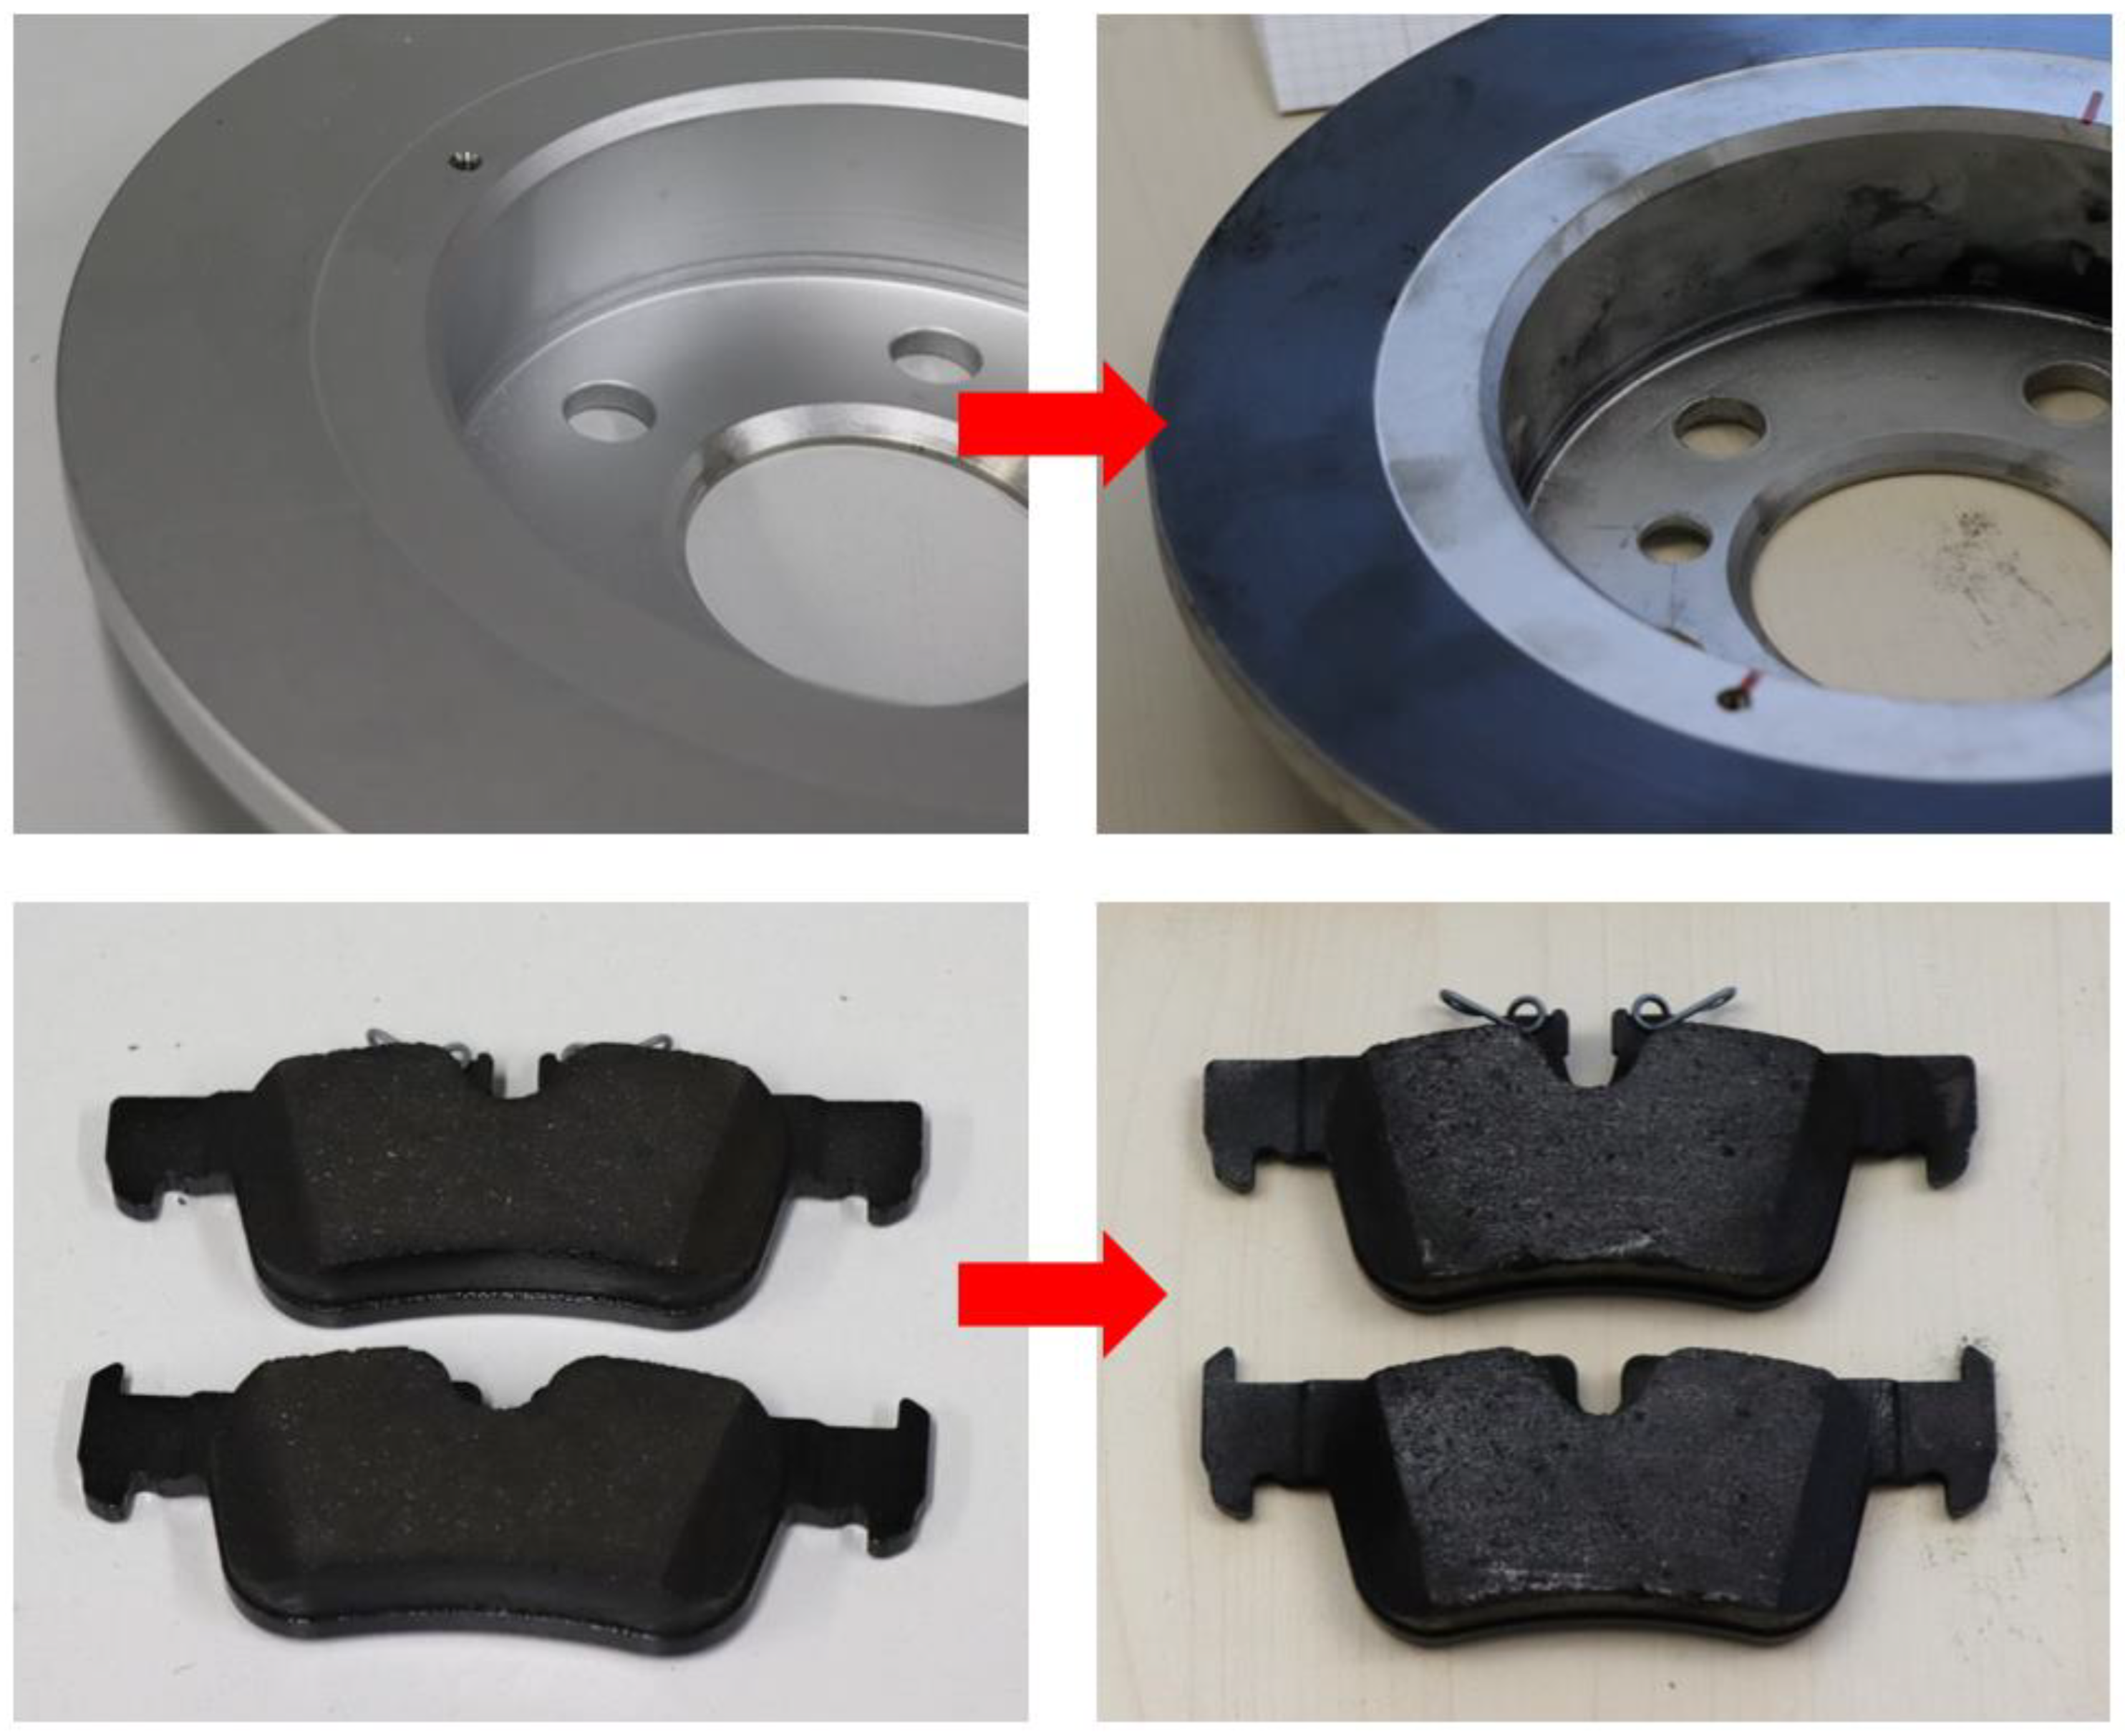
Particle emissions in the size range of 220 nm are likely caused by mechanical friction processes between the brake disc and the brake pad and the ultrafine particles in the 10 nm range were produced by thermal processes. Both brake components show an external change of the surface due to the braking tests, as shown in
Figure A5.
3.1.2. Temperature Dependency
Emission measurements of a driving profile with repeated ZEDU Brake Cycles on the chassis dynamometer showed the influence of temperature on the size and amount of airborne brake wear. Particulate emissions remained almost constant in the temperature range between 200 and 245 °C. Above the so-called critical braking temperature [
37,
38,
39], as shown in
Figure 4, there was an exponential increase in particle number concentration. The CPC reached its upper detection limit at
#/cm³, but the EEPS could detect a continuing increase in particle emissions. The particle size distribution showed the release of particles with a maximum diameter of 220 nm and a second particle mode in the ultrafine range, which occurred with a time shift. The exponential increase in total particle concentration was driven by the release of ultrafine particles. These were initially visible as a sharp peak at 10 nm, which then spread to a broader distribution up to 100 nm with increasing concentration. A concentration of
is close to the upper detection limit of the EEPS, and thus it cannot be said whether this was a real increase in particle size or an instrument feature.
The amount of non-volatile particle fraction can be measured using a catalytic stripper upstream of the EEPS. In this experiment, after correction for penetration losses, the quantity of ultrafine particles was significantly reduced (see
Figure A4). Thus, the ultrafine particles emitted above the critical temperature were not solid but mainly volatile or semi-volatile in nature.
The determined critical temperature of 200 to 245 °C was in the range of the results from previous studies which observed values between 120 and 300 °C [
14,
21,
37,
38,
40,
41]. As summarized by Ma et al. and Wang et al. [
41,
42], various factors can influence the critical temperature: the brake system, brake pad materials, the running-in process, temperature hotspots, and uncertainties in the temperature measurement [
38,
39].
Above the critical temperature, it is suspected that the emitted particles originate from the degradation and combustion of resins. Volatile particles are formed through evaporation and subsequent nucleation of the organic components in brake pad binders [
38]. The determined particle size of a few nanometers and the volatile nature of the emissions in the investigated brake system support this hypothesis regarding the formation process. Furthermore, the findings agree with earlier studies which revealed the volatile nature of nanoparticle emissions from brakes [
14,
32].
3.2. Emissions from the Electric Vehicle with Regenerative Braking
The numbers of coarse and ultrafine/fine particle emissions from the electric vehicle were determined during three driving cycles on the chassis dynamometer with the standard recuperation.
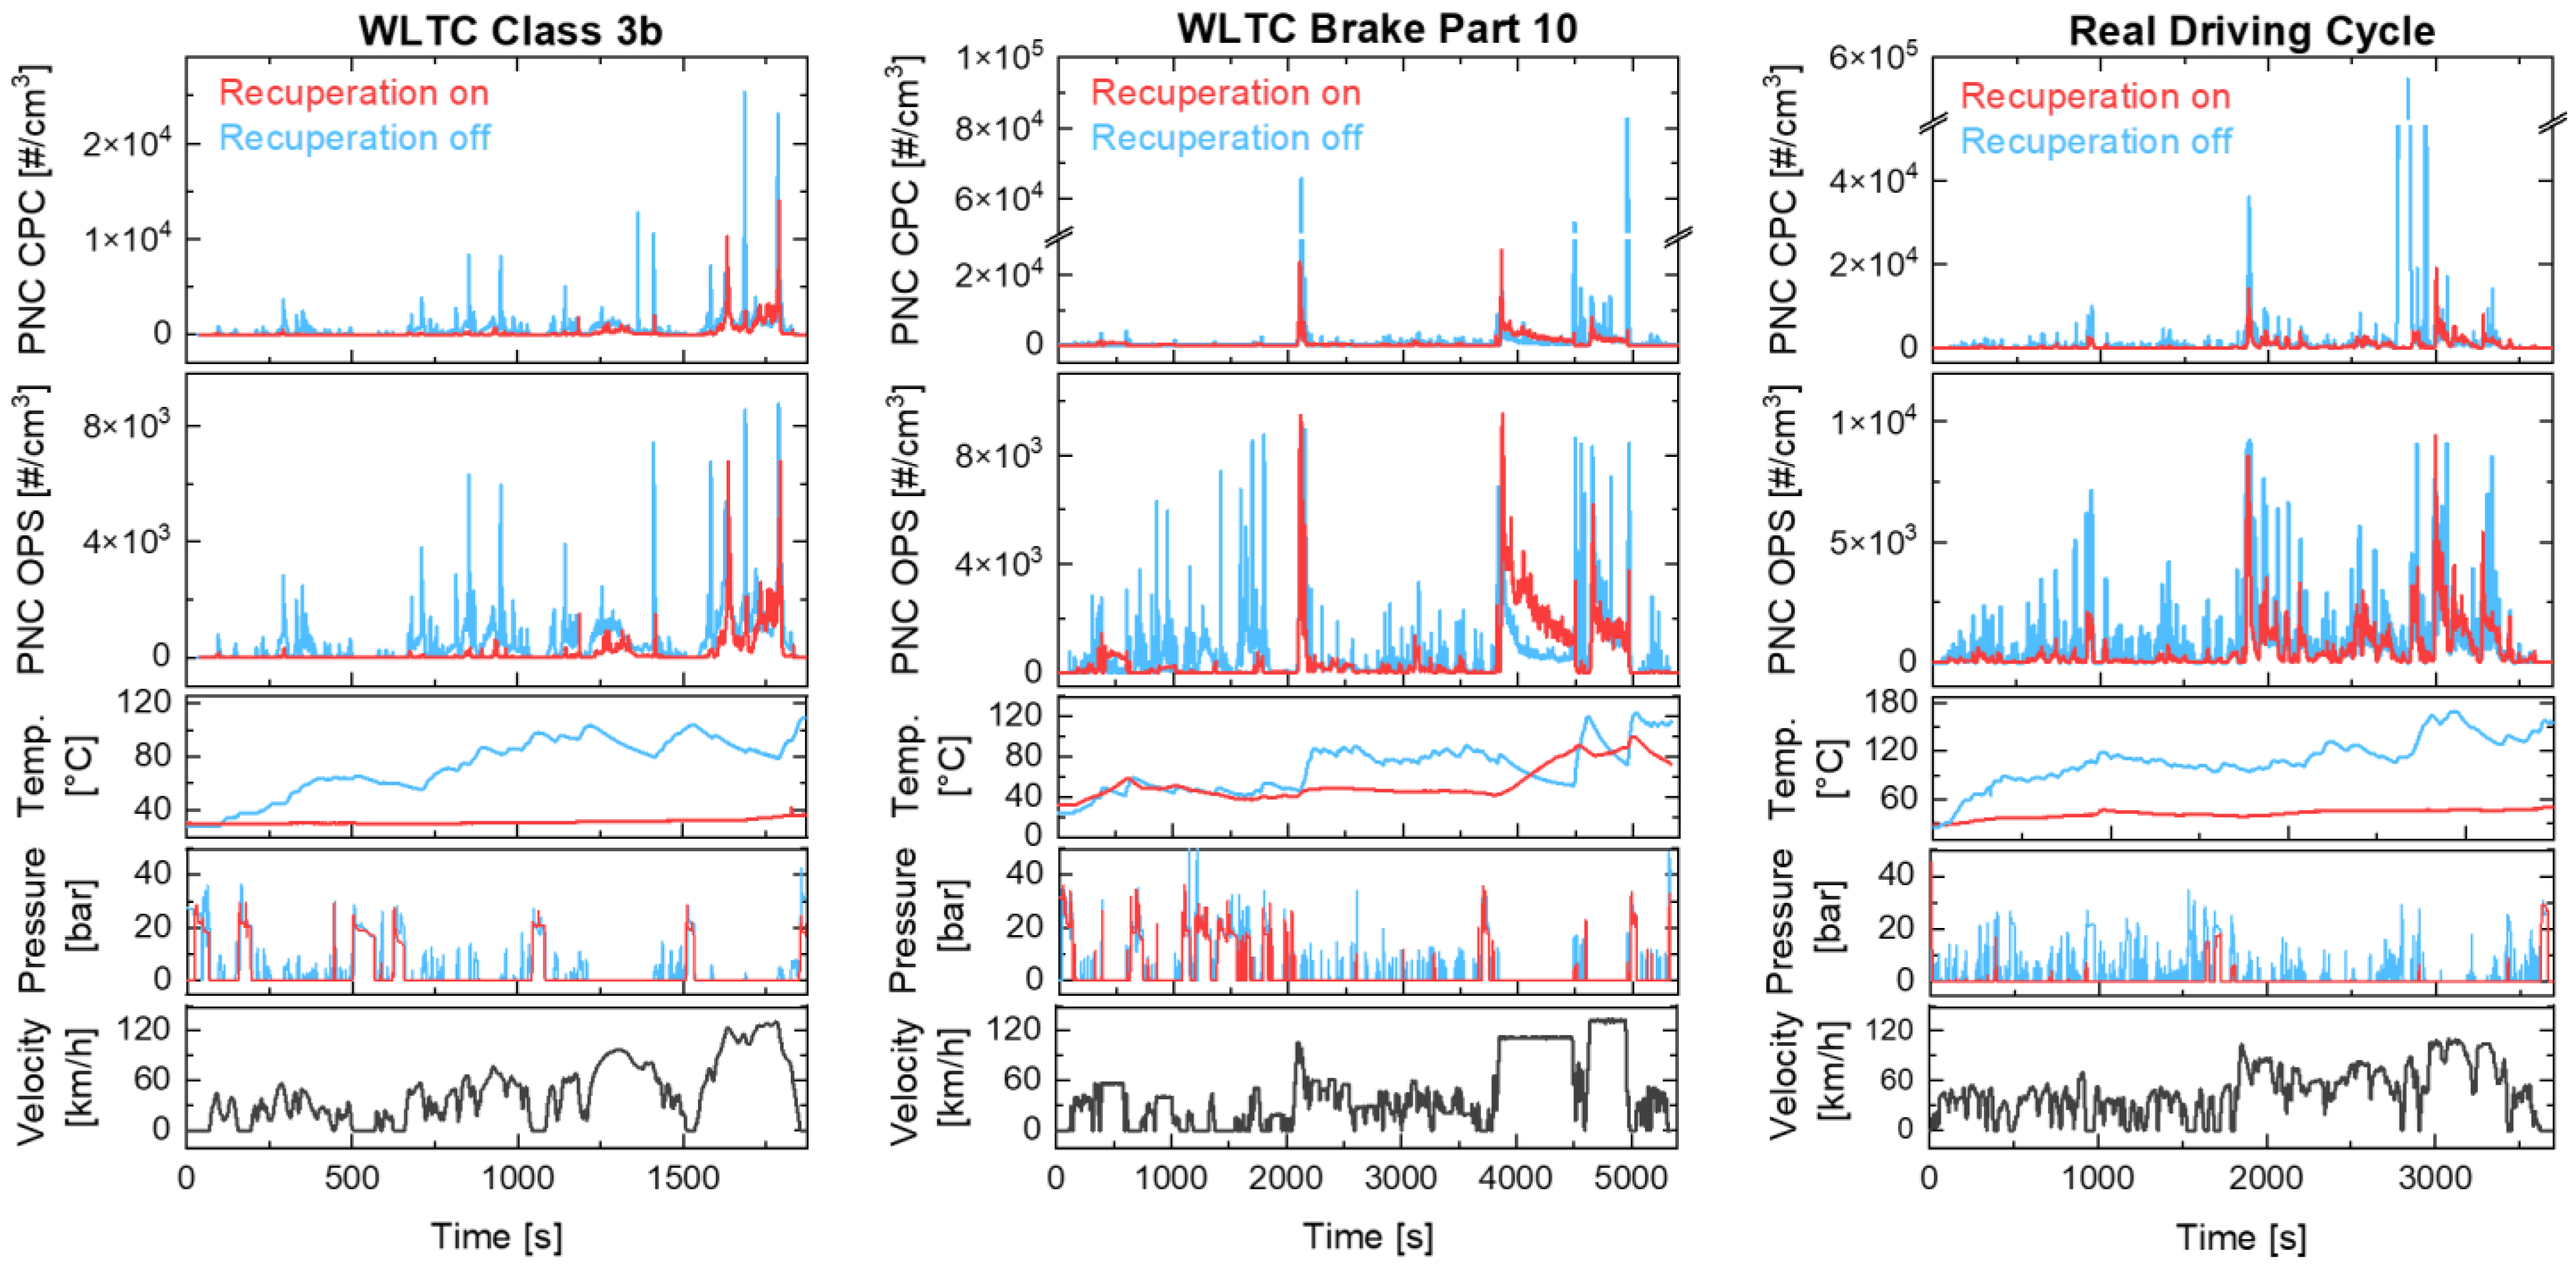
Figure 5 presents the measured particle concentration and the relevant vehicle parameters, such as brake temperature, brake pressure, and velocity, for each driving cycle. For the WLTC Class 3b driving cycle, only two mechanical braking events occurred due to recuperation and, at the same time, the temperature remained very low, with a maximum of 36.5 °C. Nevertheless, airborne particulate emissions were measurable: for coarse and ultrafine/fine particles, a similar temporal course of emissions depending on speed could be observed. In addition, individual, high emission peaks occurred, which contributed significantly to the total emissions. The WLTC Brake Part 10 driving cycle included significantly more mechanical braking than the WLTC Class 3b cycle. With time, a temperature increase up to the maximum of 99.8 °C was visible not only as a result of mechanical braking but also during constant driving. The temperature increase during constant travel indicated mechanical contact between the brake pad and the disc. During real driving, it was noticeable in comparison to the other driving cycles that hydraulic braking occurred in all speed ranges and significant emission peaks occurred. In urban areas, the emissions were significantly lower than in rural and motorway environments. The braking temperature fell between the other measured cycles with a maximum of 47 °C.
Emission indices were defined as the number of emitted particles per kilometer for one rear-axle disc brake of the test vehicle. They were determined from the measured particle number concentration obtained from the CPC or OPS and the measured total flow through the brake housing. The emission indices were in the magnitude of /km. The WLTC Class 3b driving cycle exhibited the lowest emission indices of for ultrafine/fine and for coarse particles, followed by the real driving cycle with for ultrafine/fine and for coarse particles. The highest emission indices were observed for the WLTC Brake Part 10 cycle with for ultrafine/fine and for coarse particles.
All three driving cycles were repeated with recuperation deactivated in order to determine the influence of regenerative braking on brake wear emissions. The corresponding results are shown in
Figure 5 (blue line). Driving without recuperation required significantly more hydraulic braking for all three driving cycles. Most braking events occurred in the real driving cycle. The significant increase in emission peaks reflected an increasing number of braking operations, particularly in low- and medium-speed ranges. Compared to regenerative braking, there was a greater increase in brake temperature during each driving cycle. In all tests involving the WLTC Class 3b, WLTC Part 10 and real driving cycle, with and without recuperation, the brake remained below the critical temperature. Consequently, particles in the 220 nm mode were generally to be expected during the driving cycles.
Table 2 shows the reduction in hydraulic braking for each drive cycle. A hydraulic braking event was defined as follows: braking pressure above 1 bar; wheel speed above 20 rpm, and time since the last braking over 1 s. The reduction in braking events was lowest for the real driving cycle at 87% and highest for the WLTC Class 3b driving cycle at 95.8%. The reduction in particulate emissions due to recuperation is considerably more variable. For the WLTC Brake Class 3b driving cycle, the decreases in particle emissions in the ultrafine/fine and coarse ranges were 65.4% and 67.9%, respectively. A significant reduction was also measured for the real driving cycle, which was 89.8% for the ultrafine/fine and 34.6% for the coarse emissions. The magnitude of the difference here can be explained by the very significant peak in ultrafine/fine emissions observed when recuperation was switched off (see
Figure 5). For the WLTC Brake Part 10 driving cycle, there was only a modest reduction of 4.3% in ultrafine/fine emissions, and the particle count measured for the coarse size was even 15.2% lower without recuperation.
Figure 5 shows that this was due to constant driving at 110 km/h. The simultaneous increase in temperature indicated continuous mechanical contact between the brake disc and brake pad.
Recuperation led to a significant reduction in particle emissions from the brake. The reduction in emissions for regenerative braking is due to the reduced number of braking events and the lower overall power transmission via the brake disc. Although the relative reduction in the number of braking operations was similar for all the driving cycles, the strength of the emission reduction was strongly dependent on the driving cycle. It was highest for the real driving cycle, at 89.8% for ultrafine/fine particles. For the WLTC Brake Part 10 driving cycle, little or no reduction in emissions was observed for all measured particle sizes. The reason for this could have been a failure in the brake pad reset mechanism. In some cases, this can cause the brake pads to drag while the car is driven and leads to additional wear. Under ideal conditions, recuperation leads to a significant reduction in airborne particulates, but the magnitude of the reduction is highly dependent on the driving cycle and can be negated by the lack of a brake pad reset mechanism.
3.3. Emission Reduction through Brake Coating
The application of a hard coating to brake discs is a proven reduction technique for brake wear emissions [
42]. We investigated the effect of brake coating for a battery-powered electric vehicle via tests on the chassis dynamometer. For comparison, the tests included the WLTC Class 3b, WLTC Brake Part 10, and real driving cycle with regenerative braking.
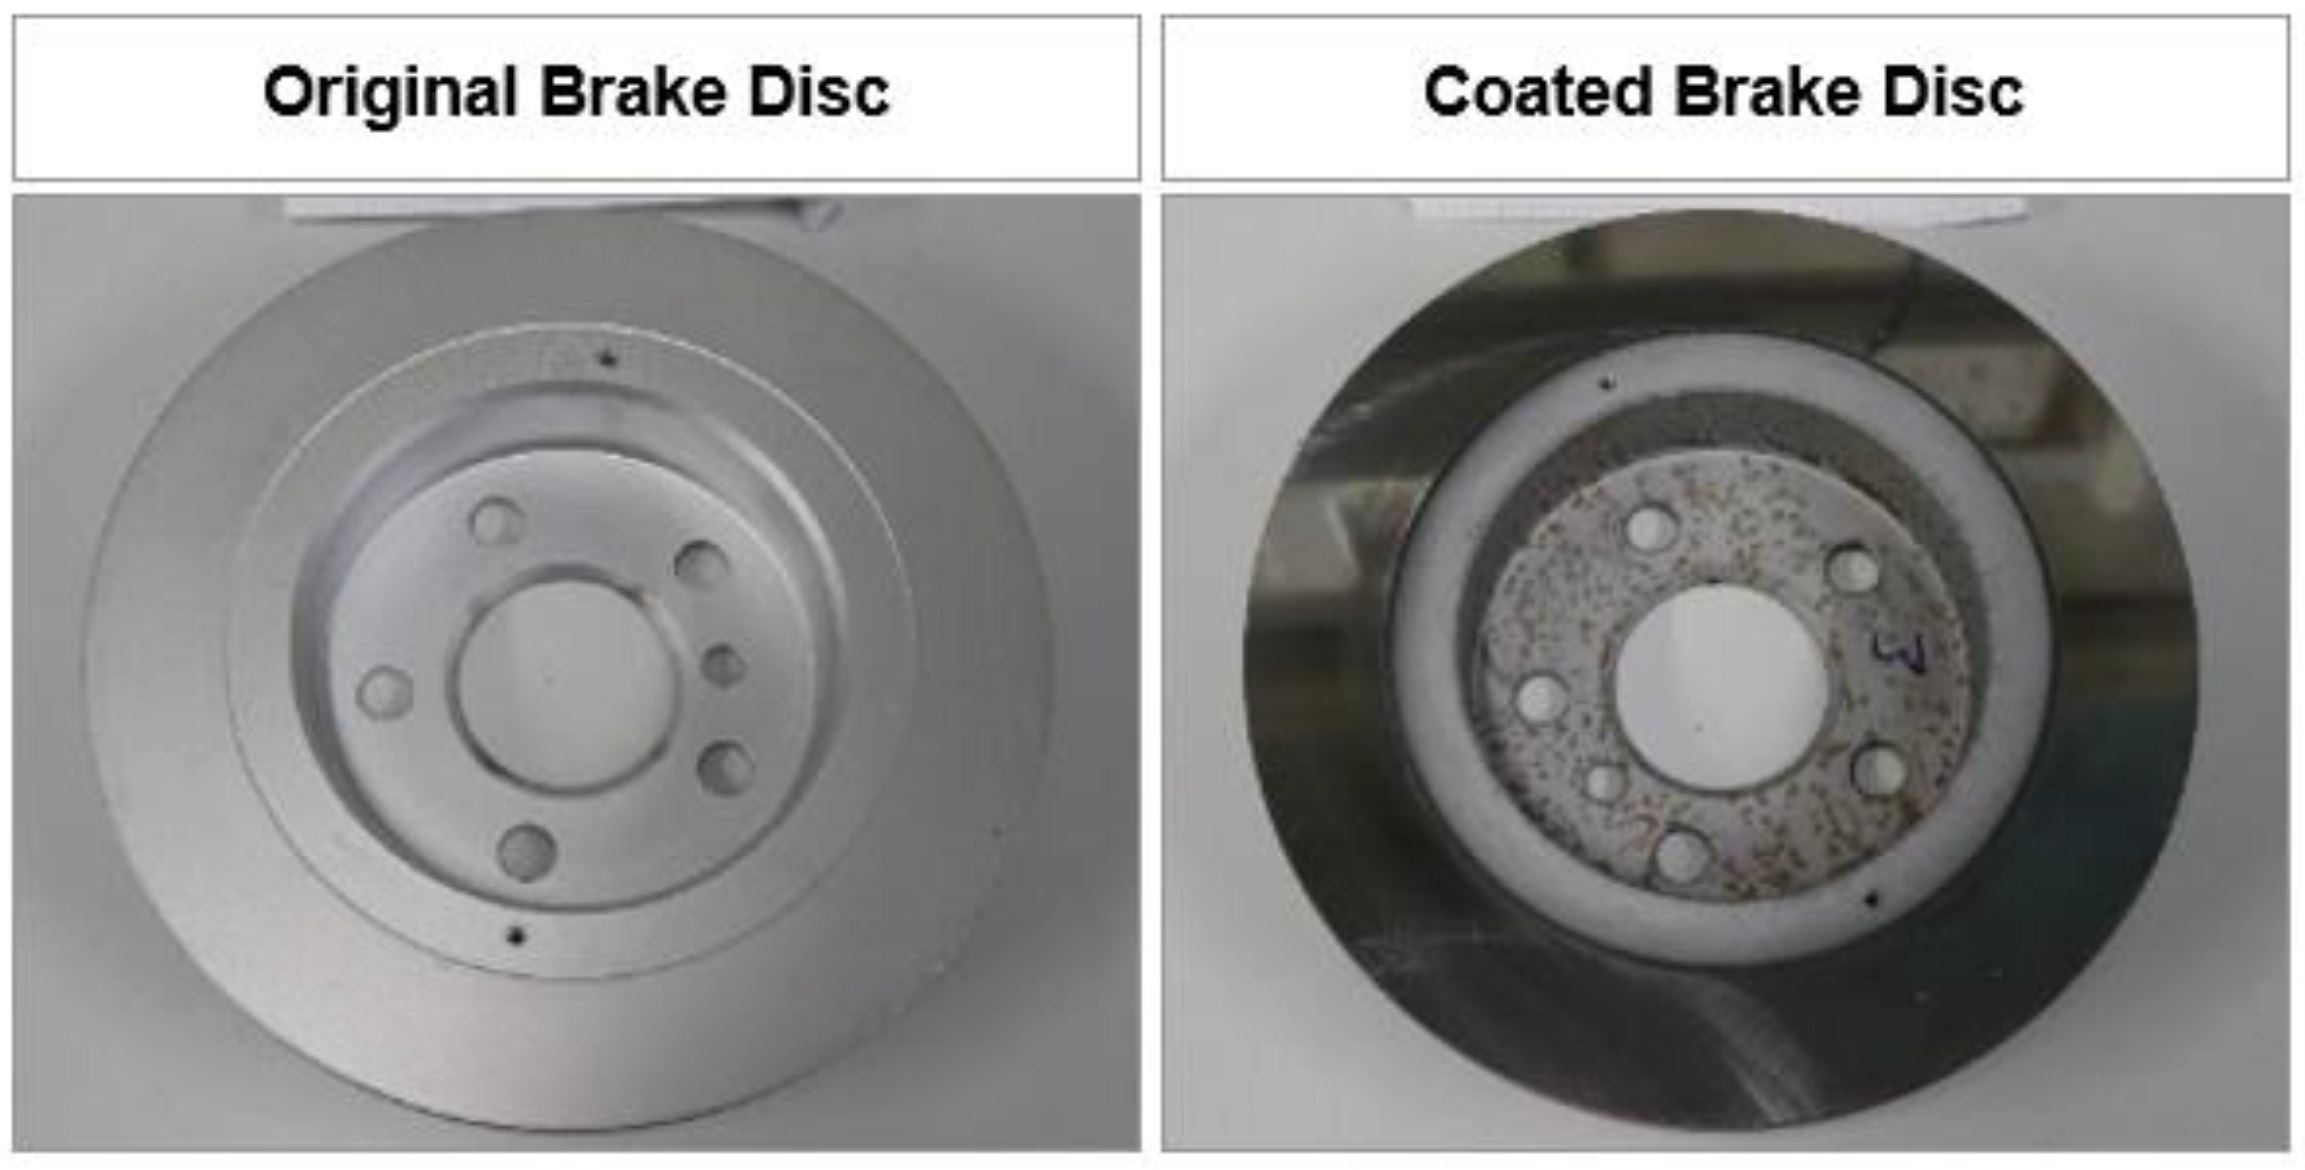
The brake discs used, original and coated, are shown in
Figure 6. The cast-iron brake was coated with a two-layer system by ARS Autoteile GmbH (now FRENOZA GmbH). Firstly, the stainless-steel adhesive layer was applied directly to the base material of the component. Its relative similarity to the base material ensured optimum adhesion between the two layers. Secondly, the carbide layer, consisting of 20% tungsten carbide with 30% titanium carbide in a 50% ductile matrix of stainless steel, was applied to the adhesive layer. The coating was applied using High-Velocity Oxy Fuel coating and was then given a plain finish.
Figure 7 shows that the temperature of the brake with the coating was generally higher than that of the original brake without the coating. The measured temperature difference could be caused by metrological influences such as a slight deviation in the positioning of the temperature sensor and a different thermal conductivity due to the brake lining, or by a change in the friction behavior. The analysis of the force on the tire and the brake pressure shows that the coefficient of friction is significantly higher for the coated brake. This indicates a change in friction behavior and could thus explain the higher temperatures at the coated brake disc. Despite the higher temperatures, a strong reduction was evident in the emissions. The individual emission peaks of ultrafine/fine and coarse particles, which occurred with the original brake, were not visible in the coated brake. For all brake events, the individual emission peaks were significantly lower.
These findings were replicated for the emission indices on the coated brake on the rear axle, shown in
Table 3. The indices were significantly lower than those of the original brake. In the case of the WLTC Class 3b driving cycle, they were
for ultrafine/fine particles and
for coarse particles, corresponding to a reduction in airborne particulate emissions of 18.5% and 33.9%, respectively.
The emission indices for ultrafine/fine and coarse particles in the WLTC Brake driving cycle were similar, at and , respectively. However, the emission abatement in this case was significantly higher than for the WLTC Class 3b driving cycle, at 71.7% and 78%, respectively. The real driving cycle had the lowest emission indices, at and because of the significant emission savings of 78.9% and 83%, respectively.
Despite the low number of braking operations as a consequence of regenerative braking, the coating of the brake disc can lead to a further significant reduction in airborne particulate emissions. The highest emission savings were observed for the real driving cycle, with 78.9% and 83% measured by the CPC and the OPS, respectively. Thus, the emission indices were already in the range of . The relative emission reduction differed between driving cycles. A correlation with the number of hydraulic braking operations can be noted here: The higher the number of braking operations (despite recuperation), the greater the relative savings potential through the brake coating.
The reduction in emissions is due to the changed properties of the brake disc as a result of the coating. These determine the friction behavior, which is visible through increased friction coefficients. Other properties such as the firmness and resistance of the surface directly ensure lower emissions for the same braking force.
4. Conclusions
Using the onboard test setup presented in this paper, it is possible to measure the particulate emissions of vehicle brakes under realistic conditions and independently of the tire emissions. The integrated ventilation with HEPA air enables the successful identification of particle emissions in the low concentration ranges of and . With constant ventilation, it is possible to realize both isokinetic sampling and realistic brake temperatures on the vehicle. In addition, the combined use of CPC, OPS, and EEPS makes it possible to monitor and characterize particle emissions across a wide size range, from 4 nm up to 10 μm.
The brake particle emissions observed had a main mode with a maximum diameter of 220 nm. In addition, volatile particles with a diameter of approximately 10 nm were generated at high temperatures and increased in size over time. For real-world operation, the 220 nm mode was of primary importance as the temperature remained well below the critical temperature in all the driving cycles tested.
Emission measurements for the three cycles showed that regenerative braking could lead to a significant reduction in the particle number concentration. Under realistic conditions, up to 89.9% of emissions could be saved in the ultrafine/fine range (CPC). It should be noted, however, that the extent of the reduction depended strongly on the driving cycle and could be nullified by the absence of a brake pad reset mechanism.
Application of a hard metal coating to the brake disc also led to a further significant reduction in the emitted particle number concentration under recuperation. The highest emission savings were achieved in the real driving cycle, with a saving of 78.9% in the ultrafine/fine range and 83% in the coarse particle emissions.
The investigations showed that the choice of driving cycle significantly defined the measured total brake particle emissions and the emission reduction potential. Furthermore, the amount of recuperation and the reset mechanism of the brake pad influence the amount of braking emissions from a battery electric vehicle. Both underscore the need for emission testing of vehicles under realistic driving conditions. Thus, in addition to component tests, methods for RDE investigation of non-exhaust emissions should also be further developed.
The types of electric vehicle in use vary significantly in terms of weight, driving behavior, and recuperation settings. Consequently, comparative studies of several vehicles are necessary in order to estimate the brake emissions of the entire fleet.


 ,
, 


