Article

Assessment of Climate Indices over the Carpathian Basin Based on ALADIN5.2 and REMO2015 Regional Climate Model Simulations

by
Otília A. Megyeri-Korotaj
*,
Beatrix Bán
,
Réka Suga
,
Gabriella Allaga-Zsebeházi
and
Gabriella Szépszó
Hungarian Meteorological Service, H-1024 Budapest, Hungary
*
Author to whom correspondence should be addressed.
Atmosphere 2023, 14(3), 448; https://doi.org/10.3390/atmos14030448
Submission received: 20 January 2023 / Revised: 10 February 2023 / Accepted: 13 February 2023 / Published: 23 February 2023
(This article belongs to the Special Issue Climate Extremes in the Pannonian Basin (2nd Edition))

Abstract

:
The Hungarian Meteorological Service has been conducting climate model simulations in order to assess the effects of climate change in the Carpathian Basin and provide data for impact research and stakeholders. Two regional climate models are used: ALADIN-Climate 5.2 (hereafter ALADIN5.2) and REMO2015. They were tested for the past when the lateral boundary conditions were taken from two sources. ERA-Interim reanalysis was used in the evaluation experiment, while the CNRM-CM5 and the MPI-ESM-LR global climate models (GCM) provided the forcings in the control experiments. The model outputs were compared with the CarpatClim-HU observational dataset for the 1981–2000 period. Future projections were carried out with the RCP4.5 and RCP8.5 scenarios, and the results were analyzed for 2021–2050 and 2071–2100. The evaluation of the results focused mainly on climate indices calculated from temperature and precipitation. The validation results showed that REMO2015 assessed the mean temperature well, but the indices based on the minimum and maximum temperature had a significant bias which has to be taken into account when interpreting future changes. The model overestimated the minimum temperature in summer, which might affect the number of tropical nights. Moreover, the maximum temperature was underestimated; thus, the derived indices, such as the occurrence of summer days and hot days, were profoundly underestimated. In comparison, ALADIN5.2 had smaller biases for the high temperature indices; moreover, the number of hot days and extremely cold days was overestimated. Taking future projections into account, we can clearly see that the results of REMO2015 show a much more moderate increase in temperature than ALADIN5.2. The reasons are yet unknown and require further investigation. In spring and summer, the number of wet days was slightly overestimated, while the number of heavy precipitation days was marginally underestimated. The projections showed the highest uncertainty in the changes in mean summer precipitation and other precipitation indices. Although the REMO2015 model assessed a decrease in precipitation, ALADIN5.2 projected an increase in precipitation with a similar magnitude.

1. Introduction

The changing climate has affected the Carpathian Basin and Hungary more and more, as well as other parts of the world. Observations show that mean temperature increased by 1.2 °C between 1901 and 2020 in Hungary, which is 0.1 °C higher than the global average [1]. According to the measurements of the Hungarian Meteorological Service, the summer of 2022, with several heat waves, was the hottest summer in Hungary since 1901 [2]. The number of summer days and hot days (Tmax > 25 °C and Tmax ≥ 30 °C, respectively) increased annually in 1961–2010 by 3.7 and 2.5 days per decade, respectively, [3]. In winter, extremely cold days (i.e., severely cold days) decreased by 1.4 days per decade, while frost days decreased by 2.5 days per decade. The number of tropical nights is increasing, especially in cities and around Lake Balaton, where, between 1901 and 2021, it increased by 7–15 days [4]. Precipitation is a temporally and spatially variable parameter. While in Northern and Western Europe, more annual precipitation has been detected, in the Carpathian Basin, we experience somewhat smaller amounts, similar to the Mediterranean region [5]. In 1901–2020, the number of consecutive dry days increased by 4 days [1]. The most pronounced observed change is the distribution of precipitation in time, as flash floods and droughts occur more and more often. The region faced one of the most severe droughts in 2021–2022, causing great losses in agriculture, especially in food production and animal husbandry in the Great Plain. The secondary annual precipitation maximum shifted from November to September–October. The number of wet days has decreased by 17 days since 1901, while the number of days with at least 20 mm of precipitation has increased by 1–2 days across Hungary. This underlines the unbalanced temporal precipitation pattern, leading to the alternation of long dry periods and heavy rainfall.
The annual mean temperature is likely to increase in the future over most of Europe by more than the global average [6]. Studies agree that in Southern and Central-Europe, summer maximum temperatures will increase to a greater degree than the average temperature in the same region associated with a decrease in maximum precipitation. This will lead to higher numbers of heat extremes and a reduced number of cold and extremely cold events [7]. Over the northern regions, an increase in annual precipitation is projected, while decrease is foreseen over Southern Europe [8,9,10,11]. In addition, extreme precipitation events will become more frequent [10,12,13], while a small annual increase in the occurrence of dry days is expected in Central Europe.
Early research [6] has already indicated that the projections of precipitation for Hungary have high uncertainty, as the country is situated in a special area in Europe. This is a transition zone between the northern regions with an increase in annual precipitation and the southern ones with a decrease. Szabó and Szépszó [14] and Szabó [15] found, on the basis of global and regional climate model (RCM) simulations, that the most dominant factor in the uncertainty of projected precipitation in the Carpathian Basin was the internal variability, especially in winter, in connection with cyclone activity. The temperature change signal exceeded the degree of natural variability between 2020 and 2045, but the projected precipitation signal did not reach it until 2100. The choice of scenario affected the temperature projections in this region for the second part of the century, while it had little or no effect on precipitation. At the same time, the role of model uncertainty gradually increased up to 2100.
The common study of the Hungarian Meteorological Service and the Eötvös Loránd University in Budapest [16] examined a four-member RCM ensemble with ALADIN-Climate, PRECIS, RegCM and REMO models at a 10–25 km resolution with the SRES [17] scenarios. They concluded that the GCM-driven REMO showed the smallest bias in temperature. It was also found that the models slightly overestimated the precipitation, especially ALADIN-Climate in summer. The mean and extreme temperatures may increase drastically in 2021–2050 and 2071–2100. The amount of precipitation in autumn and winter is projected to increase with the uncertainty in the direction of winter changes. In summer, a decrease in precipitation was expected, though this is no longer confirmed by most of the new RCM simulations [15,18].
In this study, we present the findings of our two-member RCM ensemble consisting of the ALADIN-Climate and REMO simulations. Preliminary analyses of the ALADIN-Climate model simulations with a comparison with Euro-CORDEX [19] simulation results have been carried out by [18]. The previous study highlighted the main characteristics of the projections, namely the definite increase in precipitation in all seasons. Moreover, the analyzed Euro-CORDEX simulations projected extra precipitation in winter and spring for both periods, and by the end of the century in autumn. According to the ensemble, the direction of summer changes is uncertain and independent from the scenarios. The change in the annual mean temperature of ALADIN is at the median of the Euro-CORDEX simulations. Higher temperature changes are connected to the RCP8.5 scenario.
In this study, firstly, a short overview of the model experiments and evaluation methods is presented in Section 2. Next, in Section 3.1, the validation of four simulations is shown, and an analysis of the model projections is detailed in Section 3.2. Finally, a summary is given in Section 4.

2. Data and Methodology

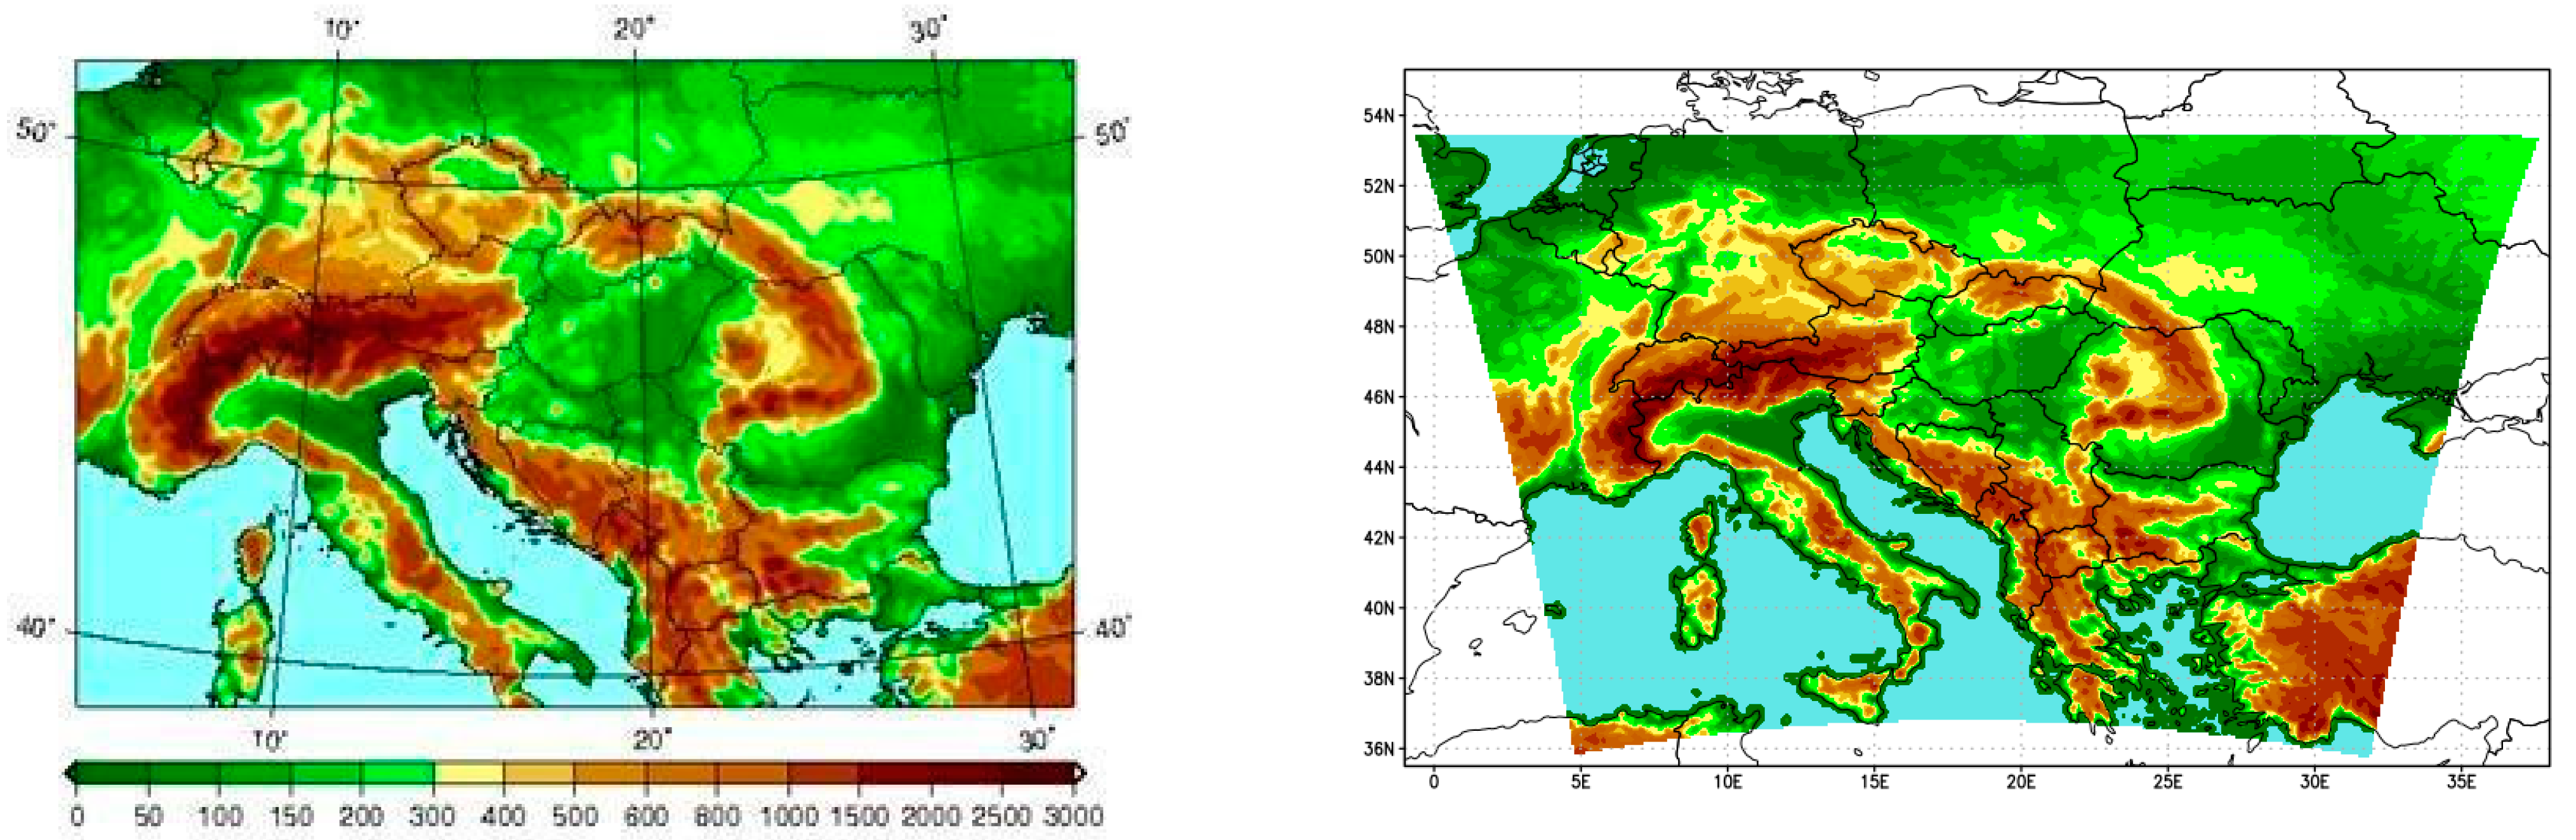
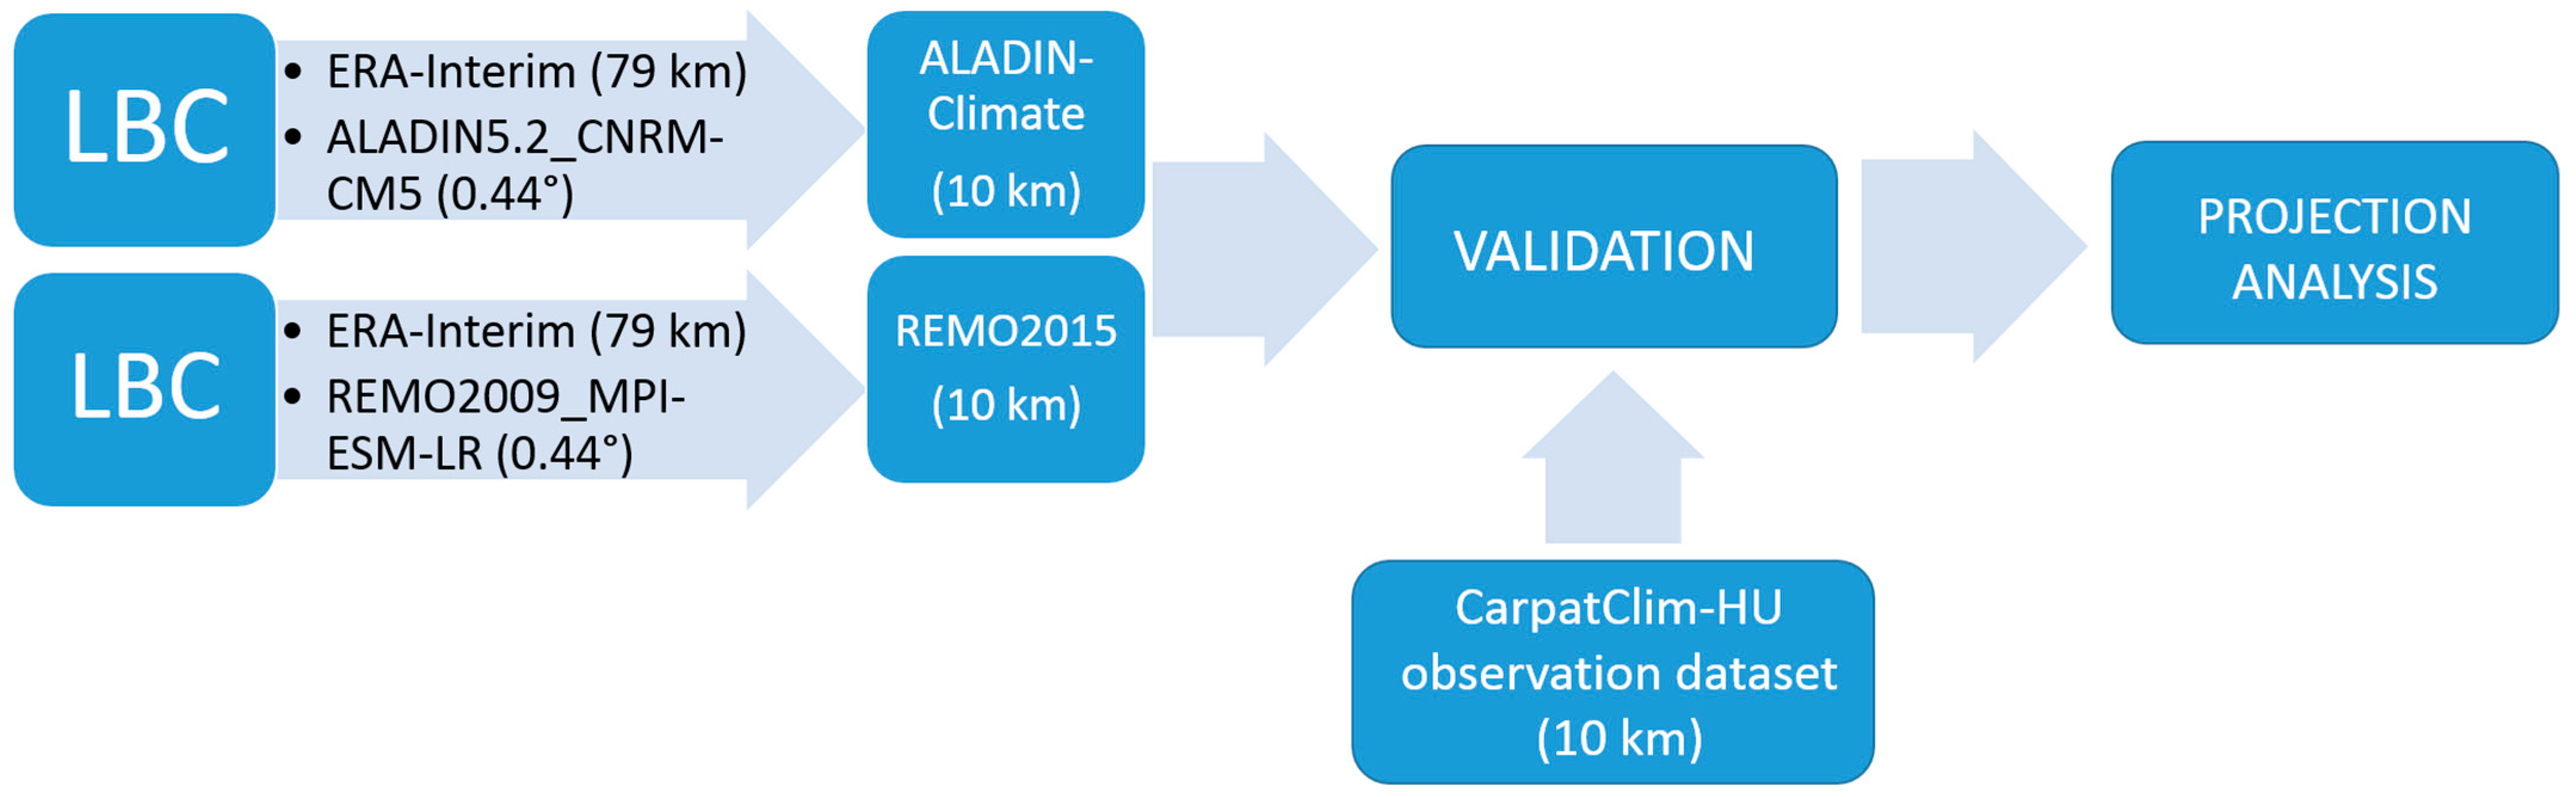
2.1. Regional Climate Model Experiments

In this research, the ALADIN-Climate and REMO regional climate models (RCM) were used to carry out simulations over Central and Southeast Europe (Figure 1) with a horizontal resolution of 10 km.
ALADIN-Climate is a spectral, hydrostatic regional climate model and its 5.2 version [20] (hereafter ALADIN5.2) is currently applied by the Hungarian Meteorological Service. The dynamic core is based on cycle 32 of the ALADIN numerical weather prediction model, while the physical parameterization package originated from the fifth version of the ARPEGE-Climat global atmospheric general circulation model (AGCM). Its horizontal grid type is a Lambert conformal conic projection, while the model applies the hybrid (terrainfollowing near the surface that continuously turns into pressure levels at higher altitudes) coordinates in the vertical. The impact of human activity is considered through the annual global means of the atmospheric concentrations of greenhouse gases (CO2, CH4, N2O, CFC-11, and CFC-12) and the monthly averages of certain aerosols (black coal, organic aerosol, sulfate, sea salt, and desert dust), given for 10-year periods according to Tegen et al. [21] for the historical period and according to Szopa et al. [22] for the scenario periods.
REMO (REgional MOdel) [23,24] is a hydrostatic, gridpoint RCM, which was originally developed by the Max Planck Institute for Meteorology in Hamburg. The model’s dynamics originated from the German Weather Service’s (DWD’s) former weather forecasting model, the Europa-Model [25], while the physical parameterization was derived from the ECHAM4 [26] atmospheric general circulation model. At the Hungarian Meteorological Service, we are currently using the 2015 version of REMO (hereafter referred to as REMO2015) developed at the Climate Service Center Germany (GERICS). The model solves the equations in a rotated spherical coordinate system and uses hybrid vertical coordinates. The prognostic variables are calculated in an Arakawa-C grid [27], i.e., in the middle of the grid cell, with the exception of the wind components, which are calculated at the cells’ boundaries. Similar to ALADIN, the annual global means of five greenhouse gases (CO2, CH4, N2O, CFC-11, CFC-12) are considered, although the aerosols are treated more simply, according to Tanré et al. [28]. Different sources of aerosols are considered (from seas, land, desert, cities and the stratosphere), but neither their seasonal cycle nor their tendency has been taken into account. More features of the models and the main physical parameterization schemes are summarized in Table 1. Further details on ALADIN5.2 and REMO2015 can be found in Bán et al. [18] and Suga et al. [29], respectively.
The characteristics of the models’ integrations (i.e., integration domains) were set up for the period of 1971–1980 [29,44]. To thoroughly validate the RCMs, two pairs of simulations were conducted for the past. On the one hand, the ERA-Interim reanalysis dataset [45] of ECMWF was used as a lateral boundary condition (LBC) in the evaluation runs. The reanalysis dataset contains 6-hourly three-dimensional global meteorological gridded data created from observations and short-term weather forecasts using data assimilation methods. These fields are the best possible representations of the state of the three-dimensional atmosphere; therefore, the LBCs constructed from them are considered to be nearly perfect. Hence, the reanalysis-driven experiment can reveal the weaknesses of the regional model itself. These experiments were initialized in 1980 due to the availability of the ERA-Interim dataset at the time of the simulations.
On the other hand, the control simulations were achieved by using the results of the global climate model (GCM) as LBCs to reveal the joint error of the global and the regional models. The experiments covered the period of 1950–2005. The validation of these simulations is important, since only the results of the global climate model can be considered as boundary conditions for the future. In case of ALADIN, the CNRM-CM5 [46] Earth system model was used, while in the case of REMO, the MPI-ESM-LR [47] Earth system model was downscaled. Both GCMs have a relatively coarse horizontal resolution (1.4° for CNRM-CM5 and 1.9° for MPI-ESM-LR); therefore, an intermittent downscaling step to 0.44° resolution over Europe and North-Africa was performed in the framework of the Euro-CORDEX program (note that this simulation with REMO was performed by GERICS [48]). These results were used as boundary conditions for our simulations with a 10 km resolution using 31 and 27 vertical levels in the case of ALADIN and REMO, respectively, and were updated with a temporal frequency of 6 h. The domains of these and the ERA-Interim driven simulations are identical (Figure 1).
The control runs were continued to 2100 using the high-emission RCP8.5 and the intermediate emission RCP4.5 scenarios [49] from 2006 onwards. The characteristics of the experiments are shown in Table 2, and a flowchart of the methodology is shown in Figure 2.

2.2. Observational Dataset: CarpatClim-HU

Gridded datasets are widely used in the evaluation of RCMs because their resolution is closer to that of the grid applied in recent RCMs. During the validation process, we used the CarpatClim-HU [50] observation database as a reference. This is based on a time series of daily surface observations homogenized with MASH software [51,52] and interpolated to a grid with a 0.1-degree (10 km) resolution over Hungary by the MISH method [53,54] that was specially developed for meteorological purposes. The dataset has been widely used in climate studies for Hungary, since it provides the most accurate information about the past climate because, for the development of CarpatClim-HU, most of the stations’ data were used: 58 stations for temperature after 1971 and 461 stations after 1951 for precipitation. The performance of the interpolation using MISH was quantified with the root mean square error (RMSE) by Hoffmann et al. [55]: it ranged from 0.18 to 0.26 °C (depending on the season, with a peak in summer) for temperature and from 3.6 to 4.84 mm (depending on the season) for precipitation.

2.3. Evaluation Methods

The evaluation focused on temperature and precipitation. Firstly, a general overview was presented for the mean characteristics over Hungary in the 1981–2000 period. The model results were compared with the abovementioned observation database (Section 2.2). Based on the monthly averages of the simulation results and the measurements, statistical measures (such as the normalized root mean square error, correlations and ratio of the standard deviations) were depicted in a Taylor diagram [56]. We showed the validation results of three temperature and three precipitation climate indices (Table 3) on scatterplots, where the spatial characteristics of the modeled and measured indices were compared; hence, in the plots, each dot represents a grid point over Hungary. For temperature indices, the 20-year mean annual averages were presented; for precipitation indices the results for summer and winter results were presented. Additionally, to underpin our findings for the indices, the annual means of minimum and maximum temperatures are shown. To indicate the differences in the distribution of annual precipitation, quantile–quantile (Q-Q) plots were made for two locations (Budapest and Szeged) by choosing the closest gridpoints in the model simulations and observations. In these plots, we can see the percentiles of the daily means. Budapest, which is the capital and home to nearly 2 million people, and Szeged, which is the third biggest city in Hungary and situated in the Great Plain were selected for these investigations.
The projection results were assessed in the form of changes, where the 1971–2000 period was considered as the reference. Two periods were investigated in more detail: 2021–2050 and 2071–2100. Similar to the validation, first, we obtained a general overview of the changes in temperature and precipitation by finding the 30-year moving averages for Hungary for 2000–2100. Next, the changes in the distribution of daily precipitation were shown in histograms in the winter (January) and summer (July) months of both investigation periods in order to explain the changes in the precipitation indices. The list of the climate indices was extended with extremely hot days, tropical nights and extremely cold days (Table 3), and their mean changes were shown in maps and bar plots. The significance of future changes was evaluated using a two-tailed Welch’s t-test with a 0.05 significance level; the significant changes were marked with black dots on the maps. In case of frost days and extremely cold days, the relative changes are shown on the maps to emphasize the order of the decrease in the region.

3. Results

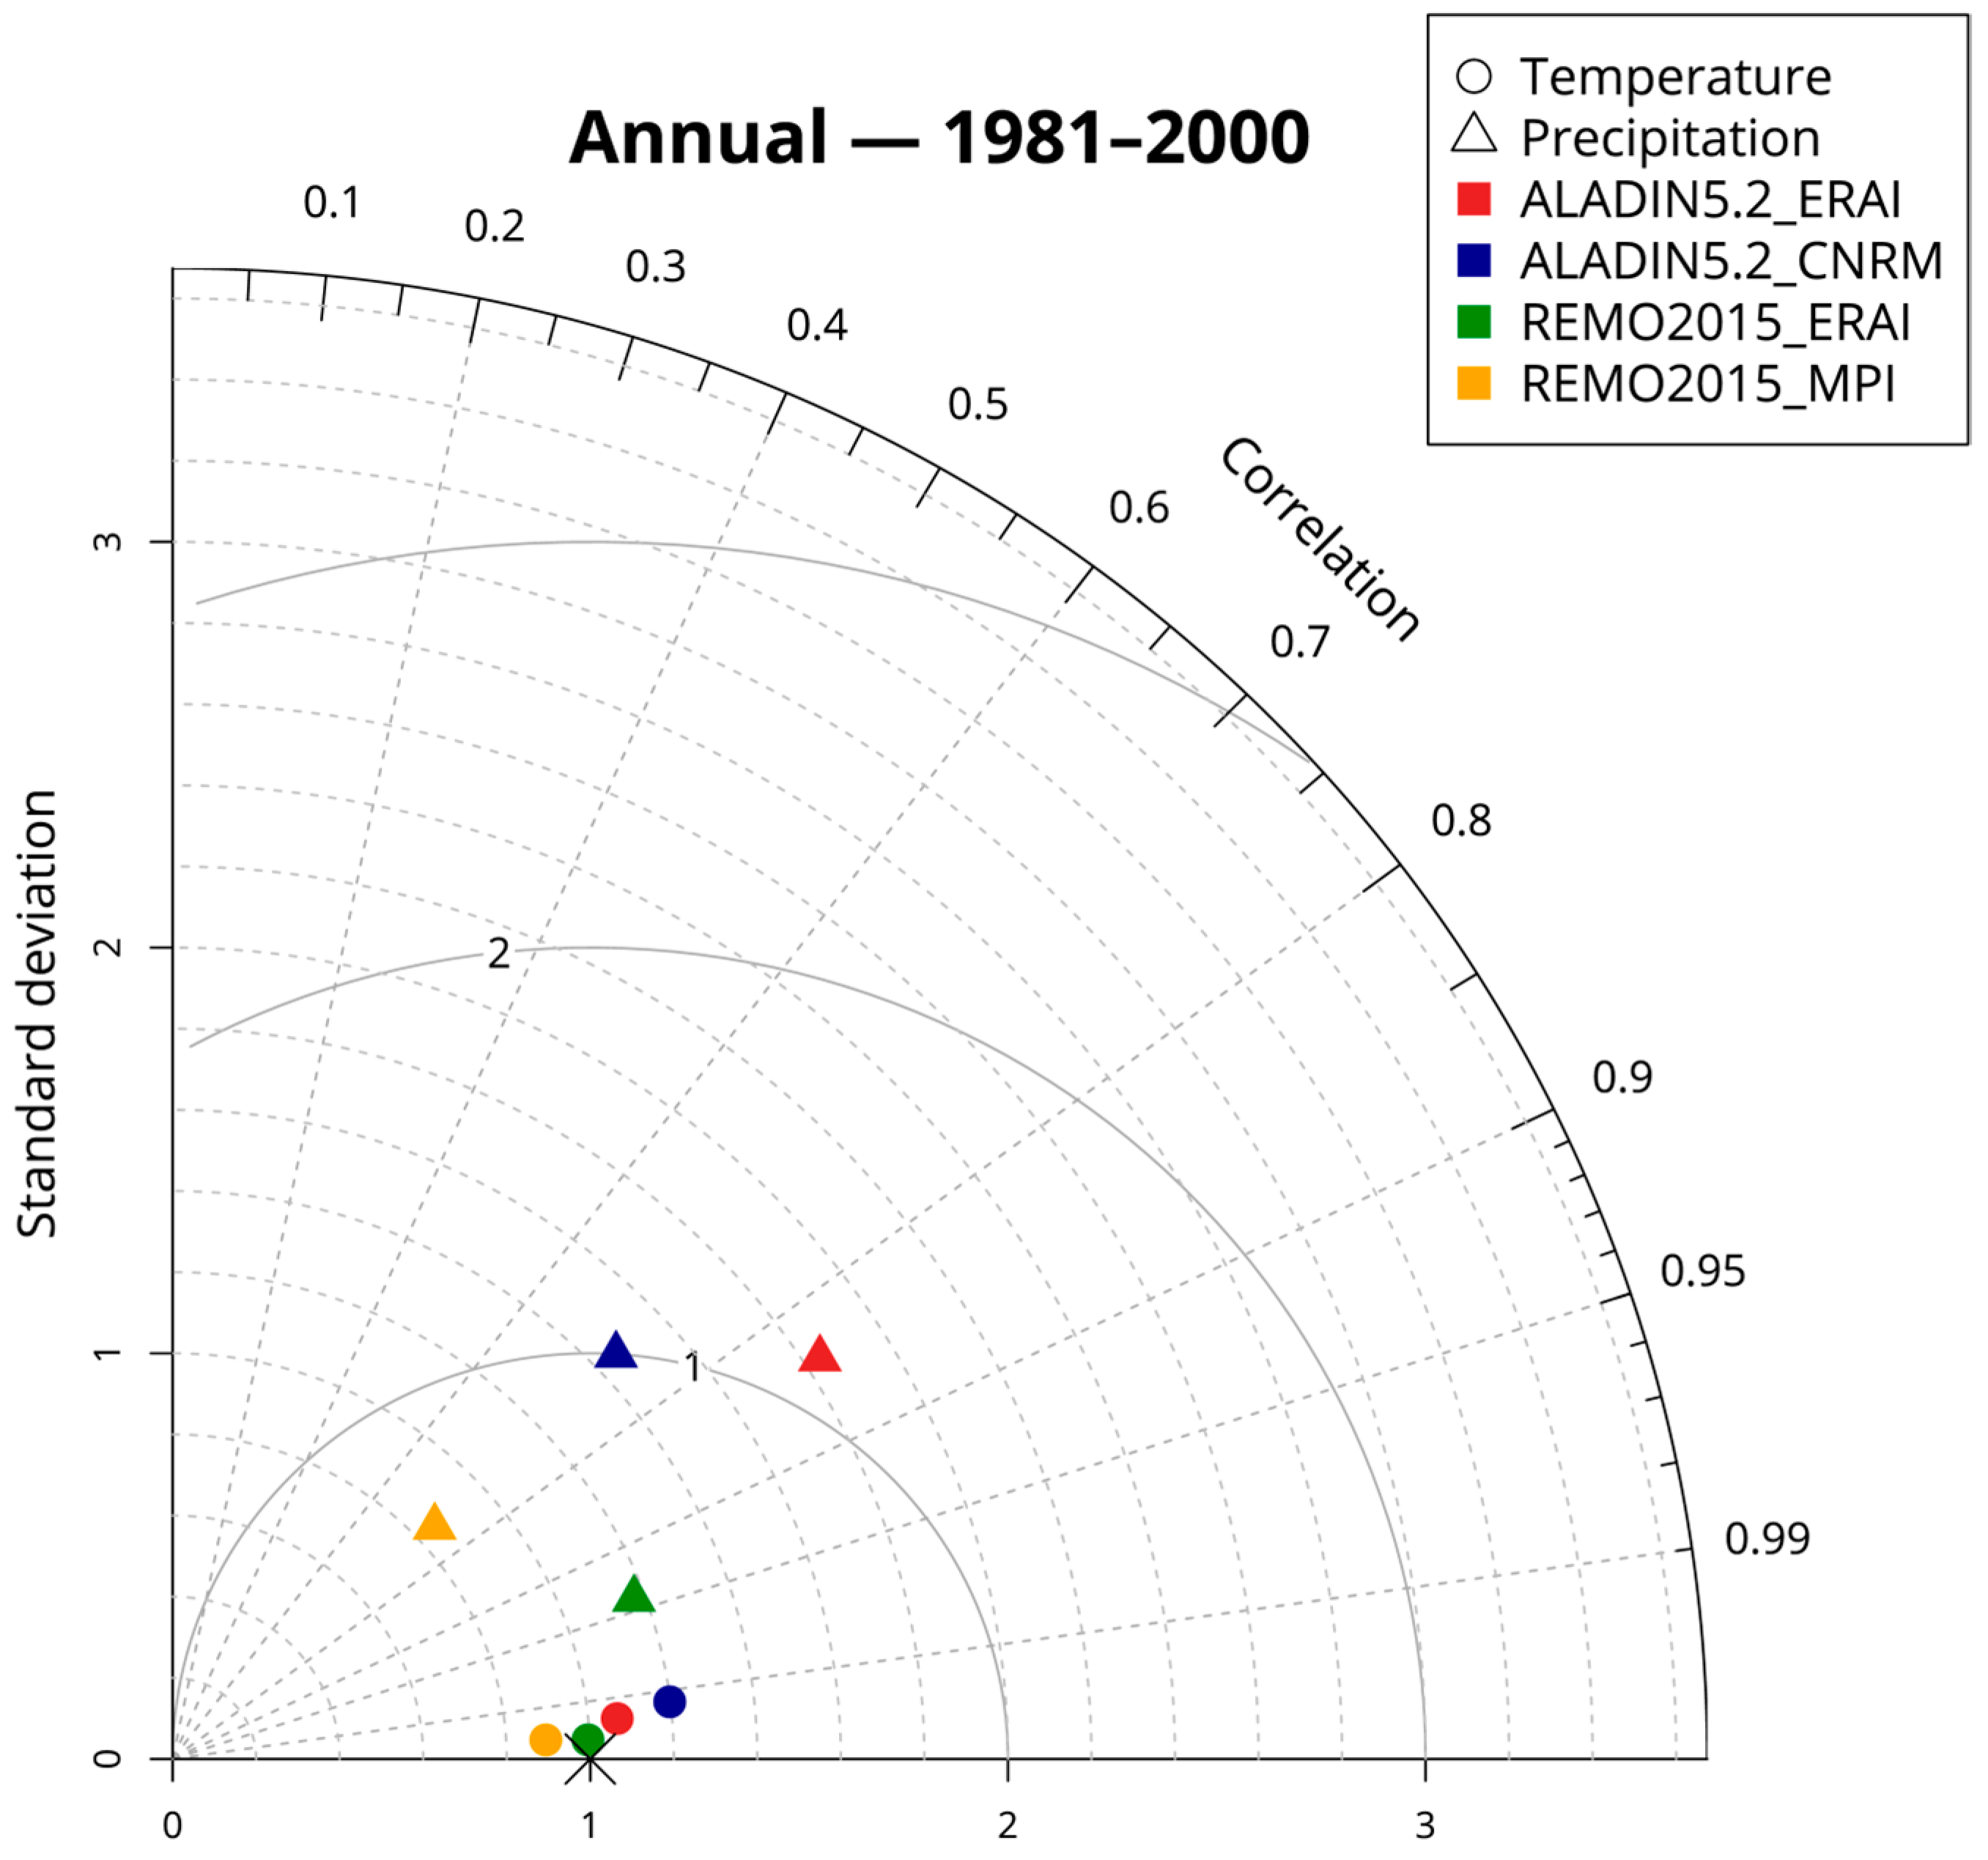
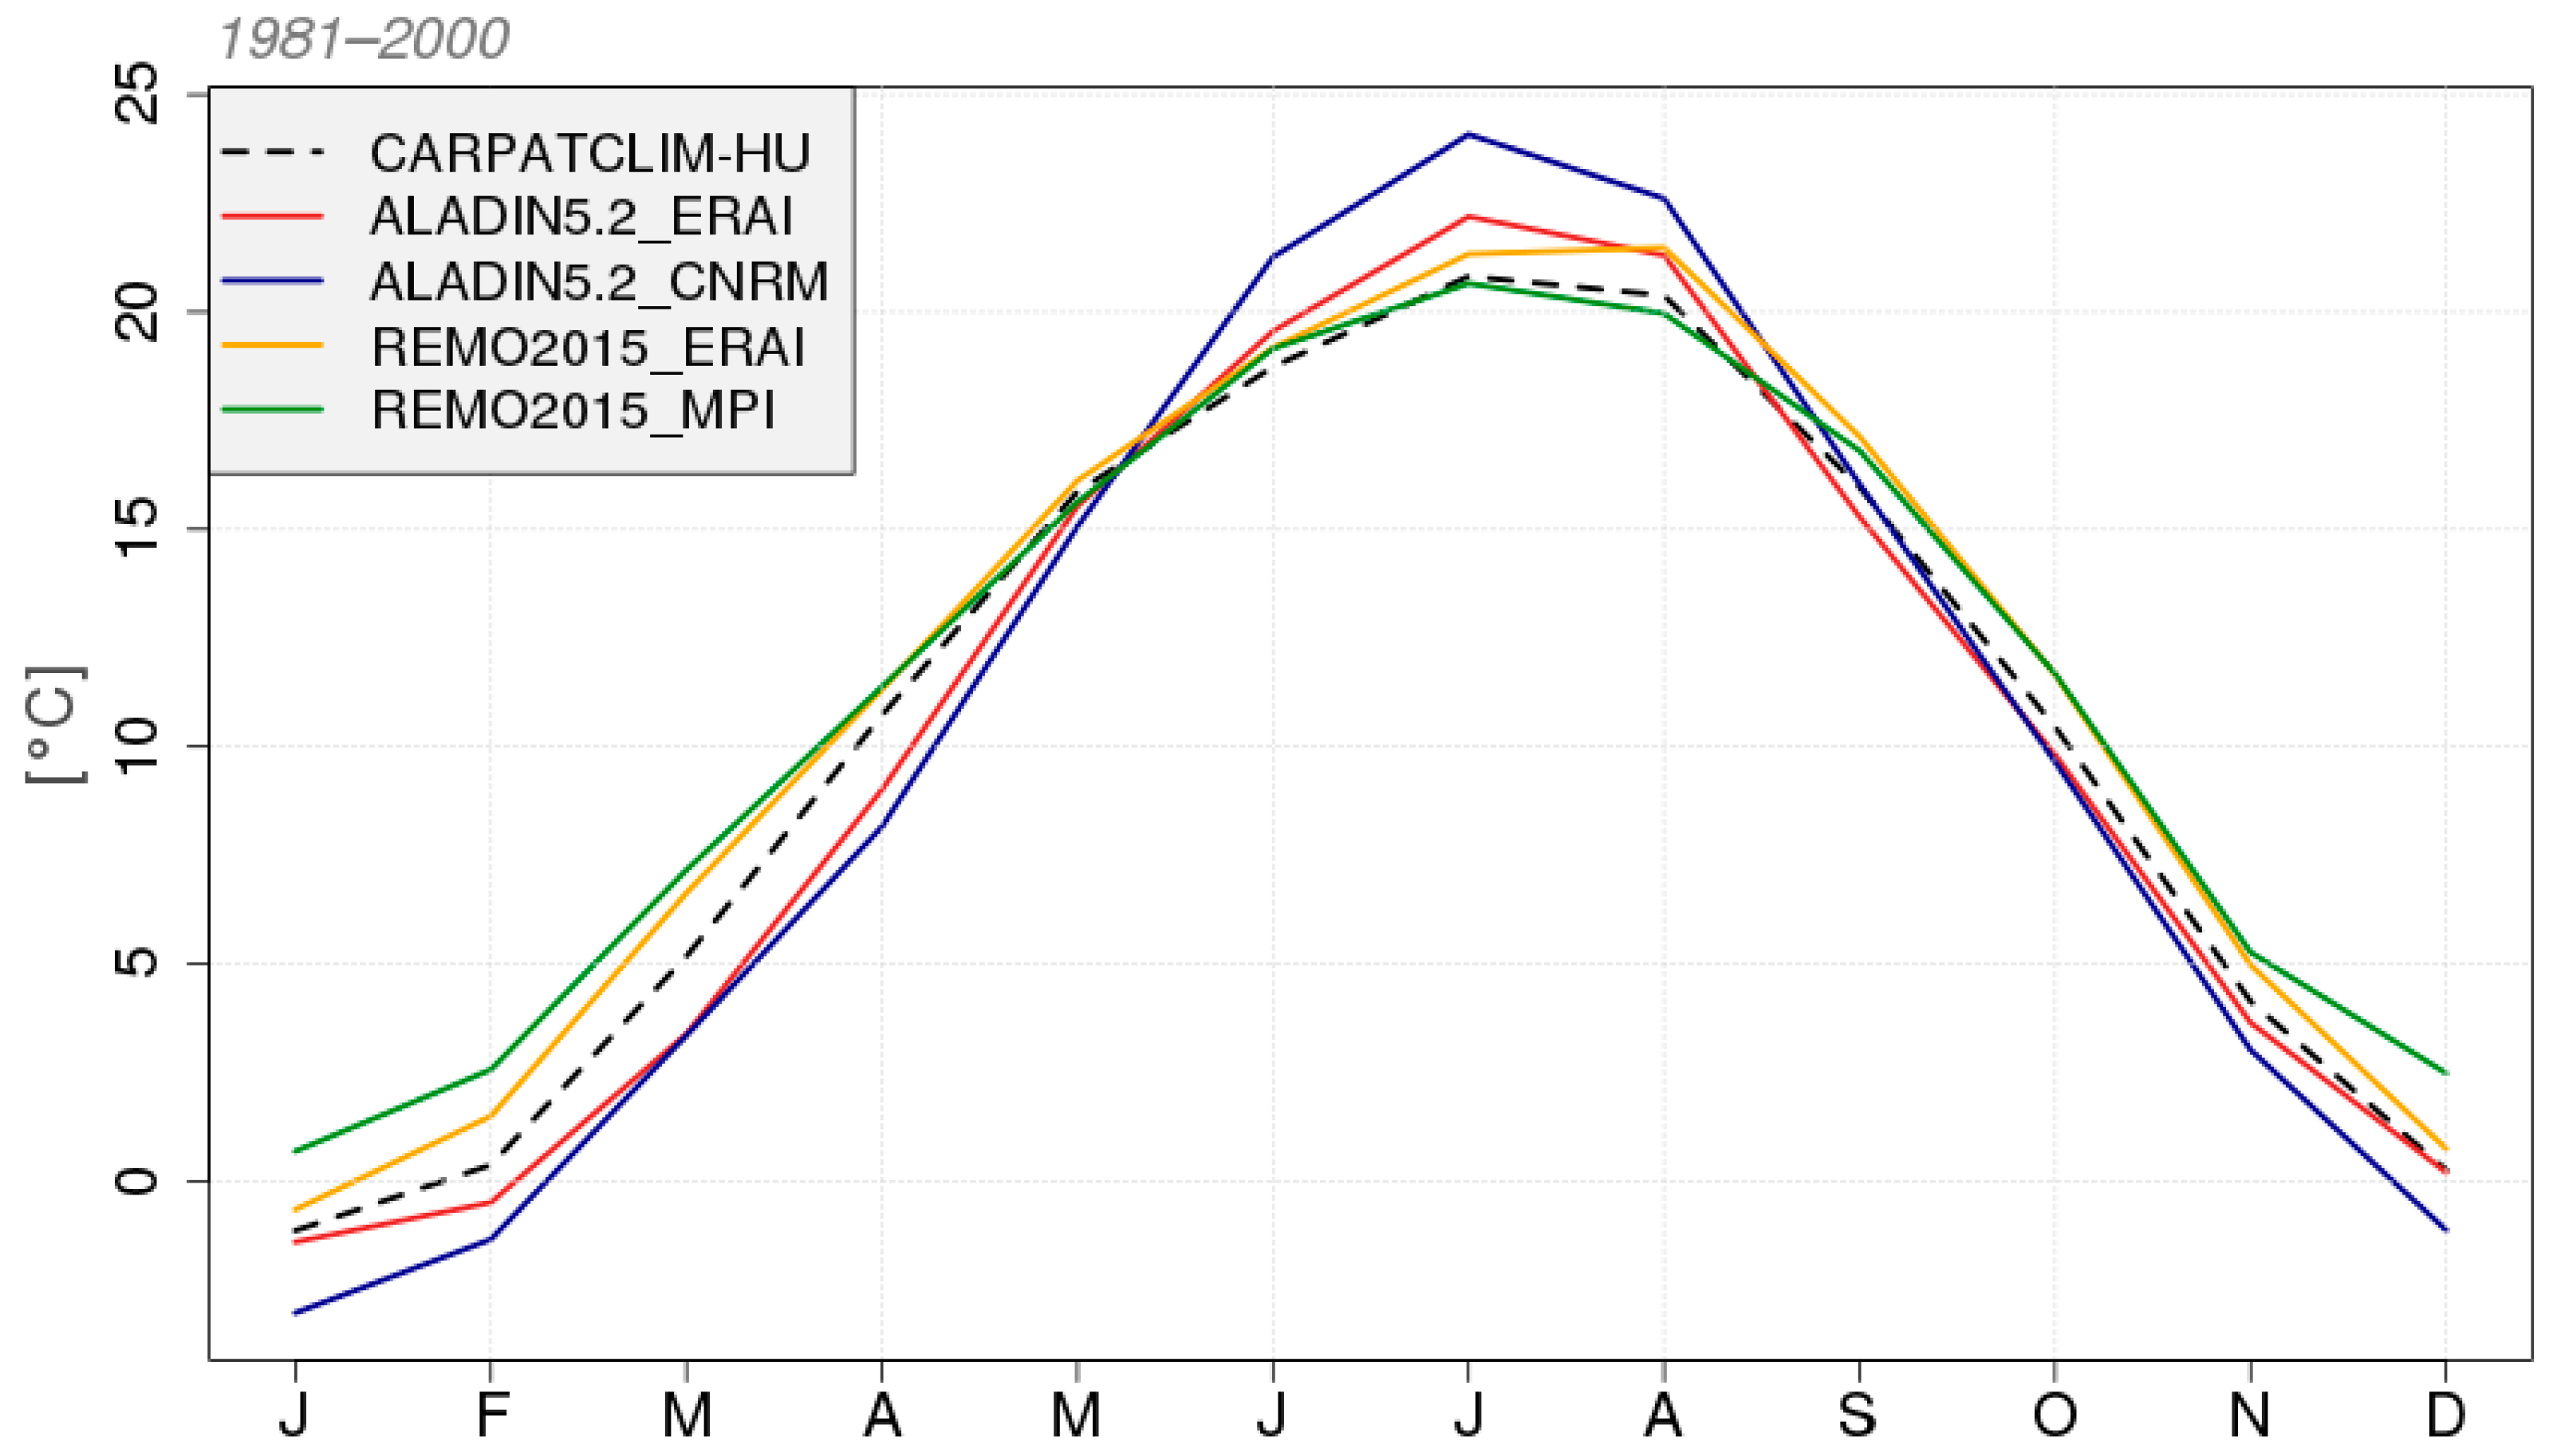
3.1. Validation for 1981–2000
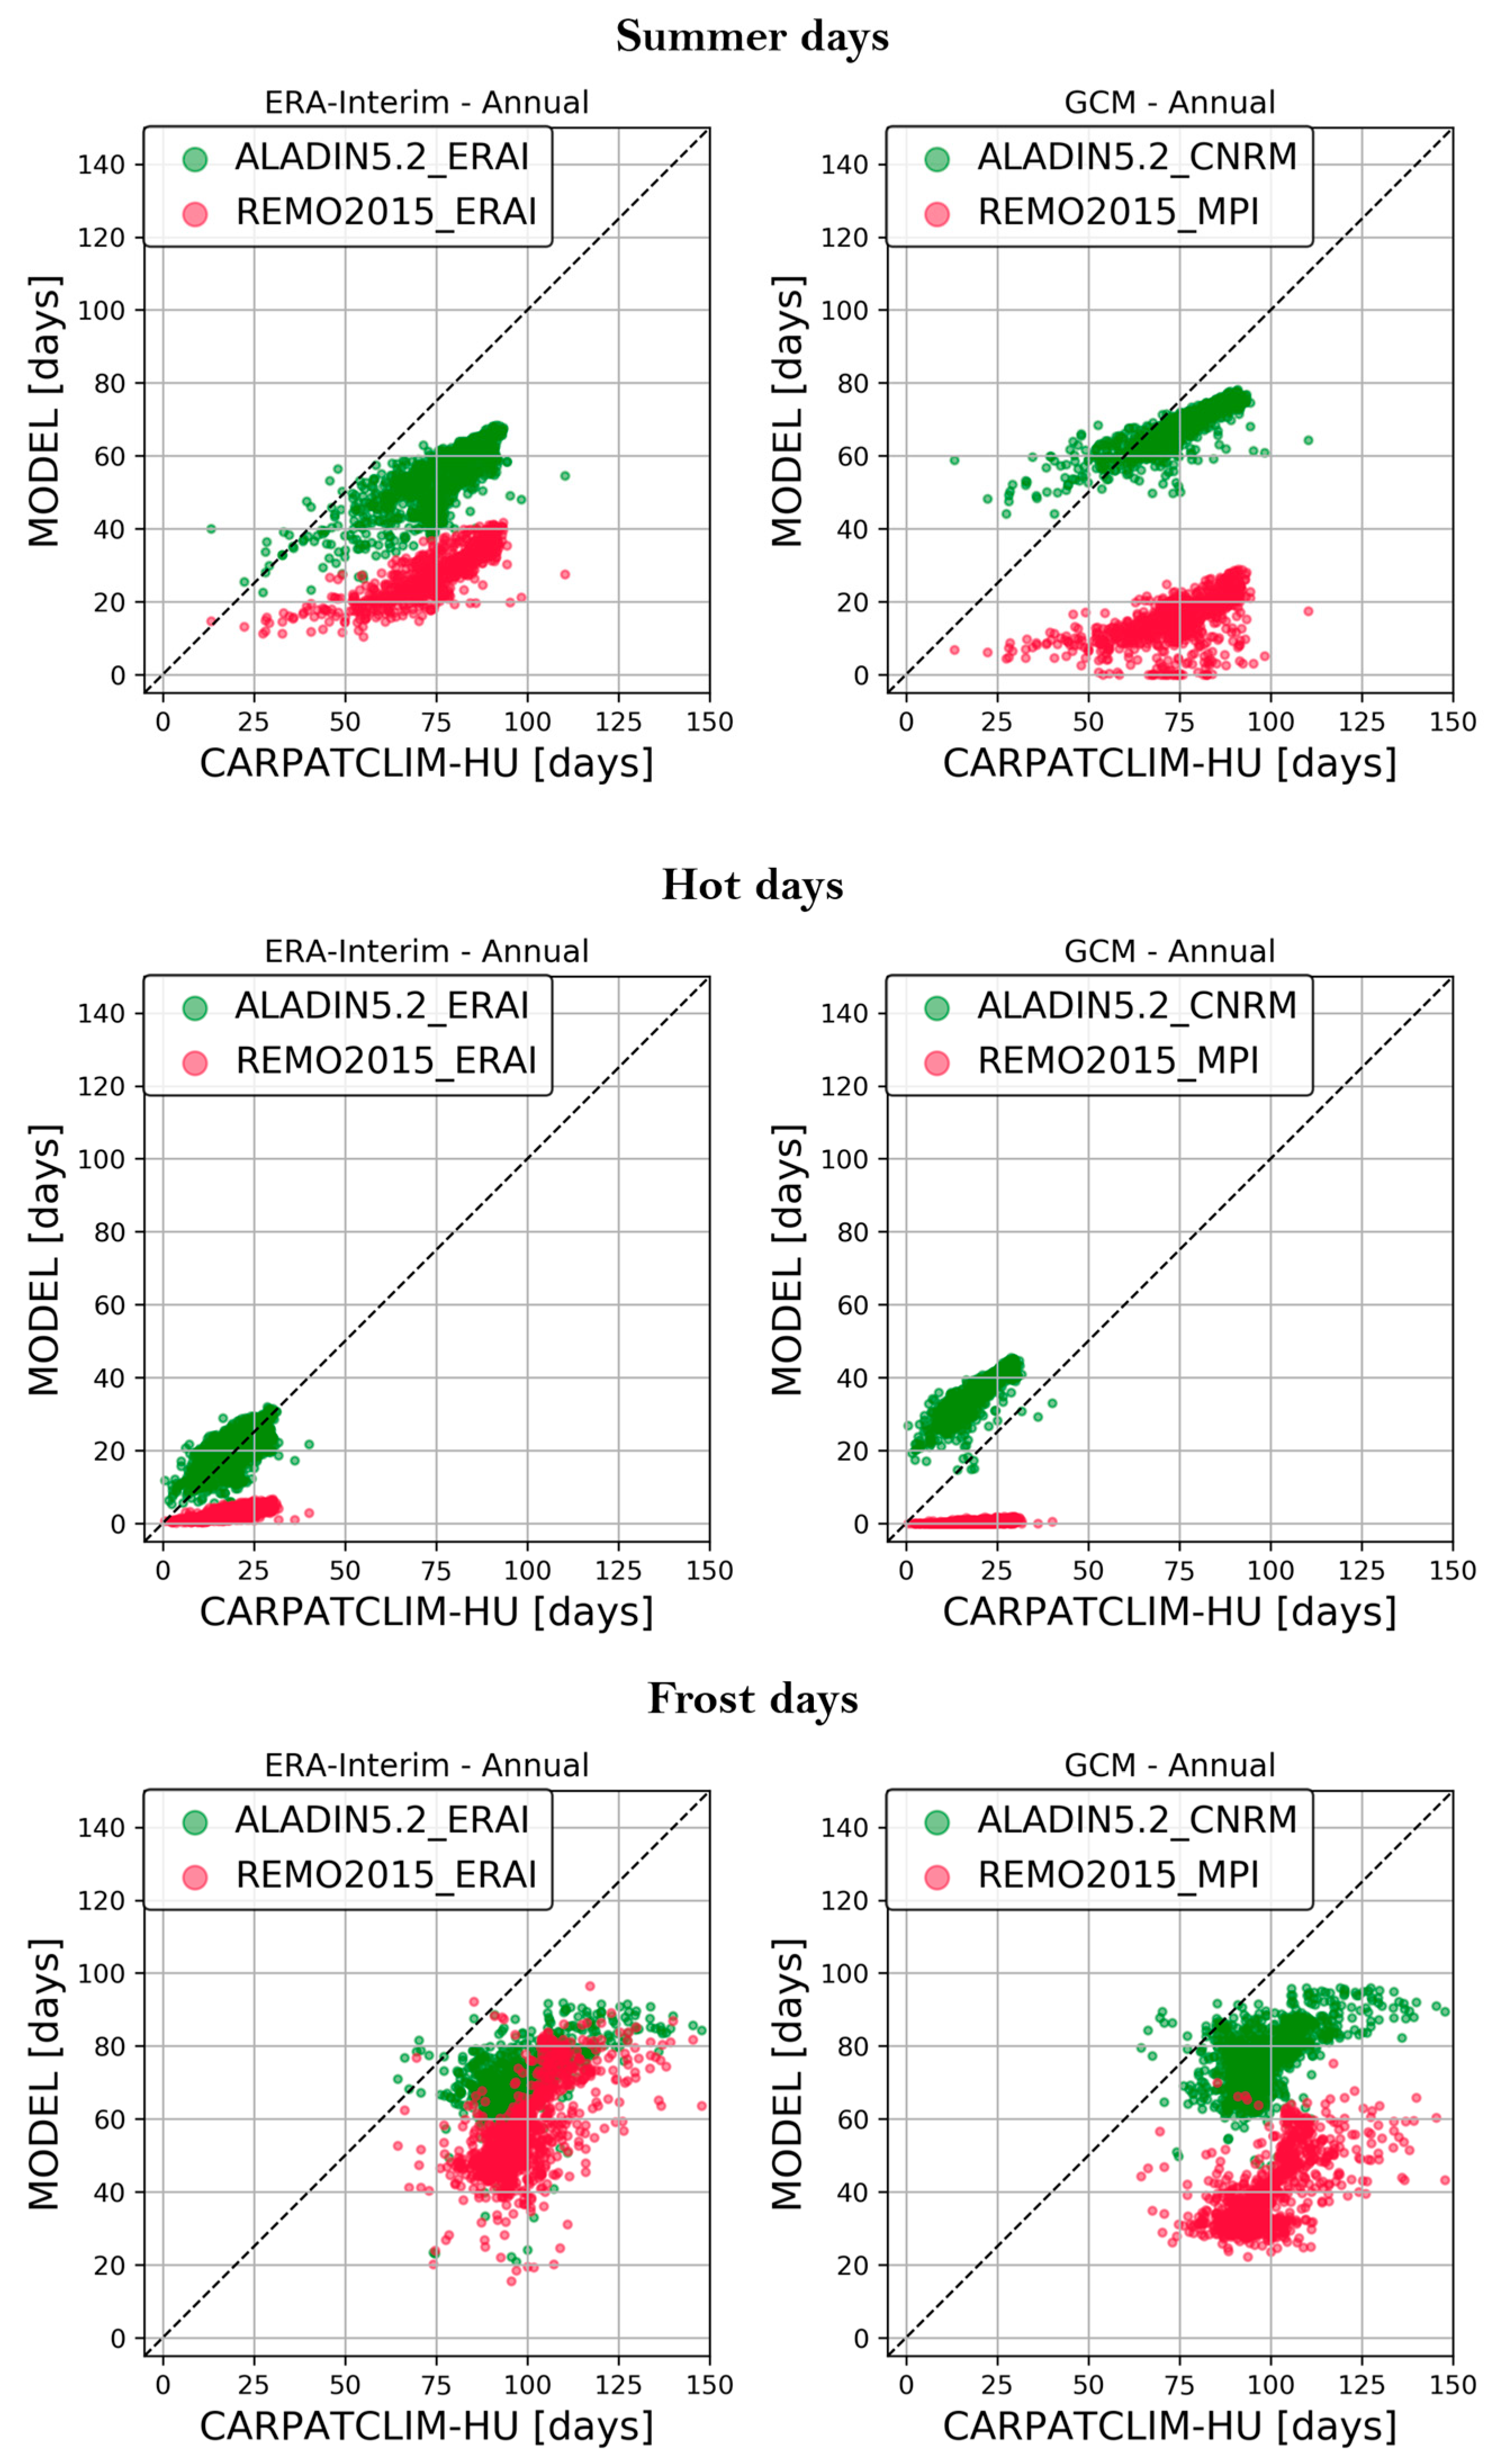
3.1.1. Temperature

In general, all model simulations represented the mean temperature well (Figure 3) and could reproduce the annual cycle: the coldest month was January and the warmest was July (Figure 4). Table 4 shows the bias in the seasonal mean temperature of the four model simulations over Hungary. As we can see, the ALADIN5.2 model simulations had a negative bias in every season except summer, while REMO2015 simulations generally overestimate the temperature. Despite the highest seasonal biases being found for the ALADIN5.2 (in absolute terms, these were 1.5 and 2.5 °C in the evaluation and control simulations, respectively), the annual mean bias was slightly smaller than that of REMO2015 because of the balancing of the positive bias for summer.
The temperature indices, though, showed a more scattered result. In Figure 5, we can see the scatterplots of the annual temperature indices according to the model simulations in comparison with the CarpatClim-HU observation dataset. The ALADIN5.2 model’s simulations showed smaller biases than REMO2015. Summer days were underestimated, which could reach 20–40 days, but overall, the GCM-driven ALADIN5.2 simulation gave better results, where bias in both directions appeared. In the latter case, an overestimation of around 20 days is visible in connection with mountainous areas (not shown), while in the rest of the country, an underestimation of 1–10 days was shown, with higher values in the southern part of the Great Plain. The bias of frost days was −10 to −40 days for ALADIN5.2, and in the mountains, there was also overestimation (5–10 days). REMO2015 substantially underestimated summer days by 40–80 days and hot days by 10–40 days. The GCM-driven ALADIN5.2 overestimated the number of hot days by 10–30 days. In the case of frost days, a negative bias was present as well, which was highest in the southwestern region of Hungary (60–80 days) for REMO2015 (not shown). To investigate the cause of the biases in more detail, we analyzed the minimum and maximum temperatures as well. We found that, in accordance with the expectations, the maximum temperature was underestimated by the REMO2015 model (Table 5), which led to the underestimation of summer days and hot days. The reason for the low number of frost days may be that the minimum temperature was overestimated. This opposite effect led to the generally good results for mean temperature. These findings are in accordance with [57]. Examining a large ensemble of Euro-CORDEX simulation results, they found that in case of maximum temperature, the main causes were the GCM models themselves bringing this characteristic into the RCMs. At night, when the atmospheric conditions are stratified, the RCM parameterizations (boundary layer, turbulence and low-level clouds) play crucial roles in defining the minimum temperature, especially in summer. This also suggests a connection with the bias of tropical nights. In addition, proper definition of land surfaces is also important for both minimum and maximum temperature to improve the results [58].

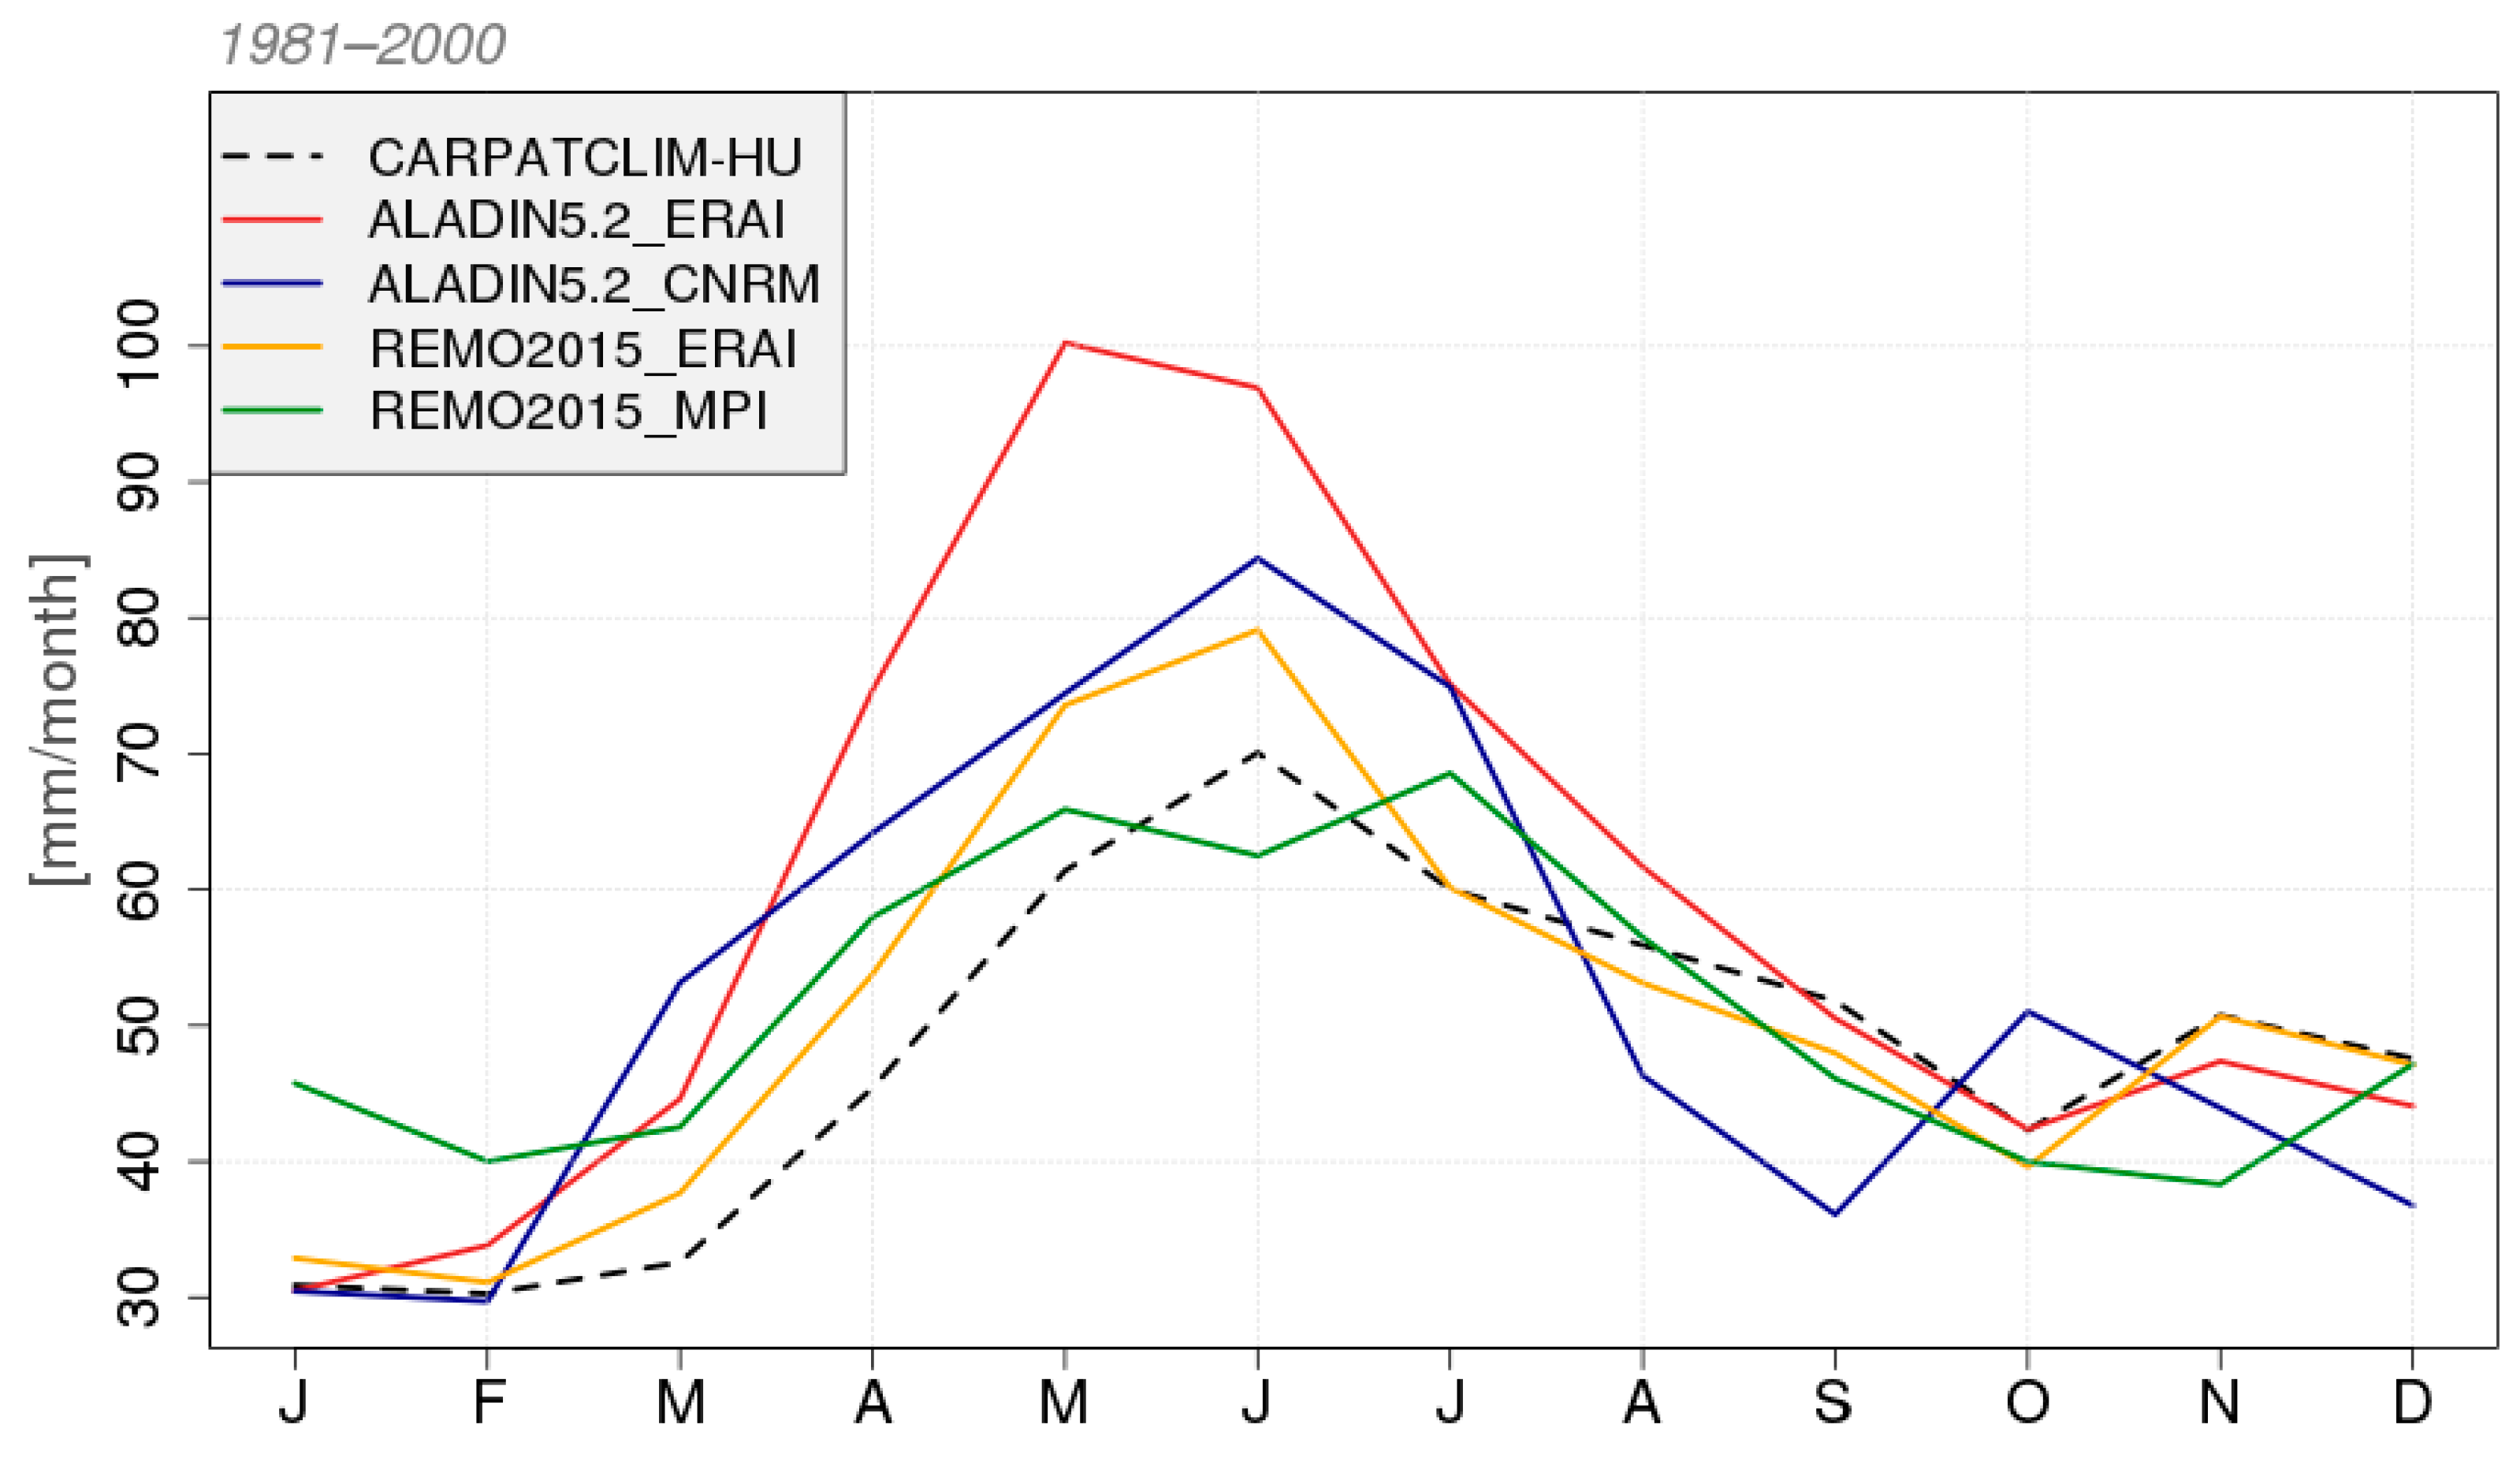
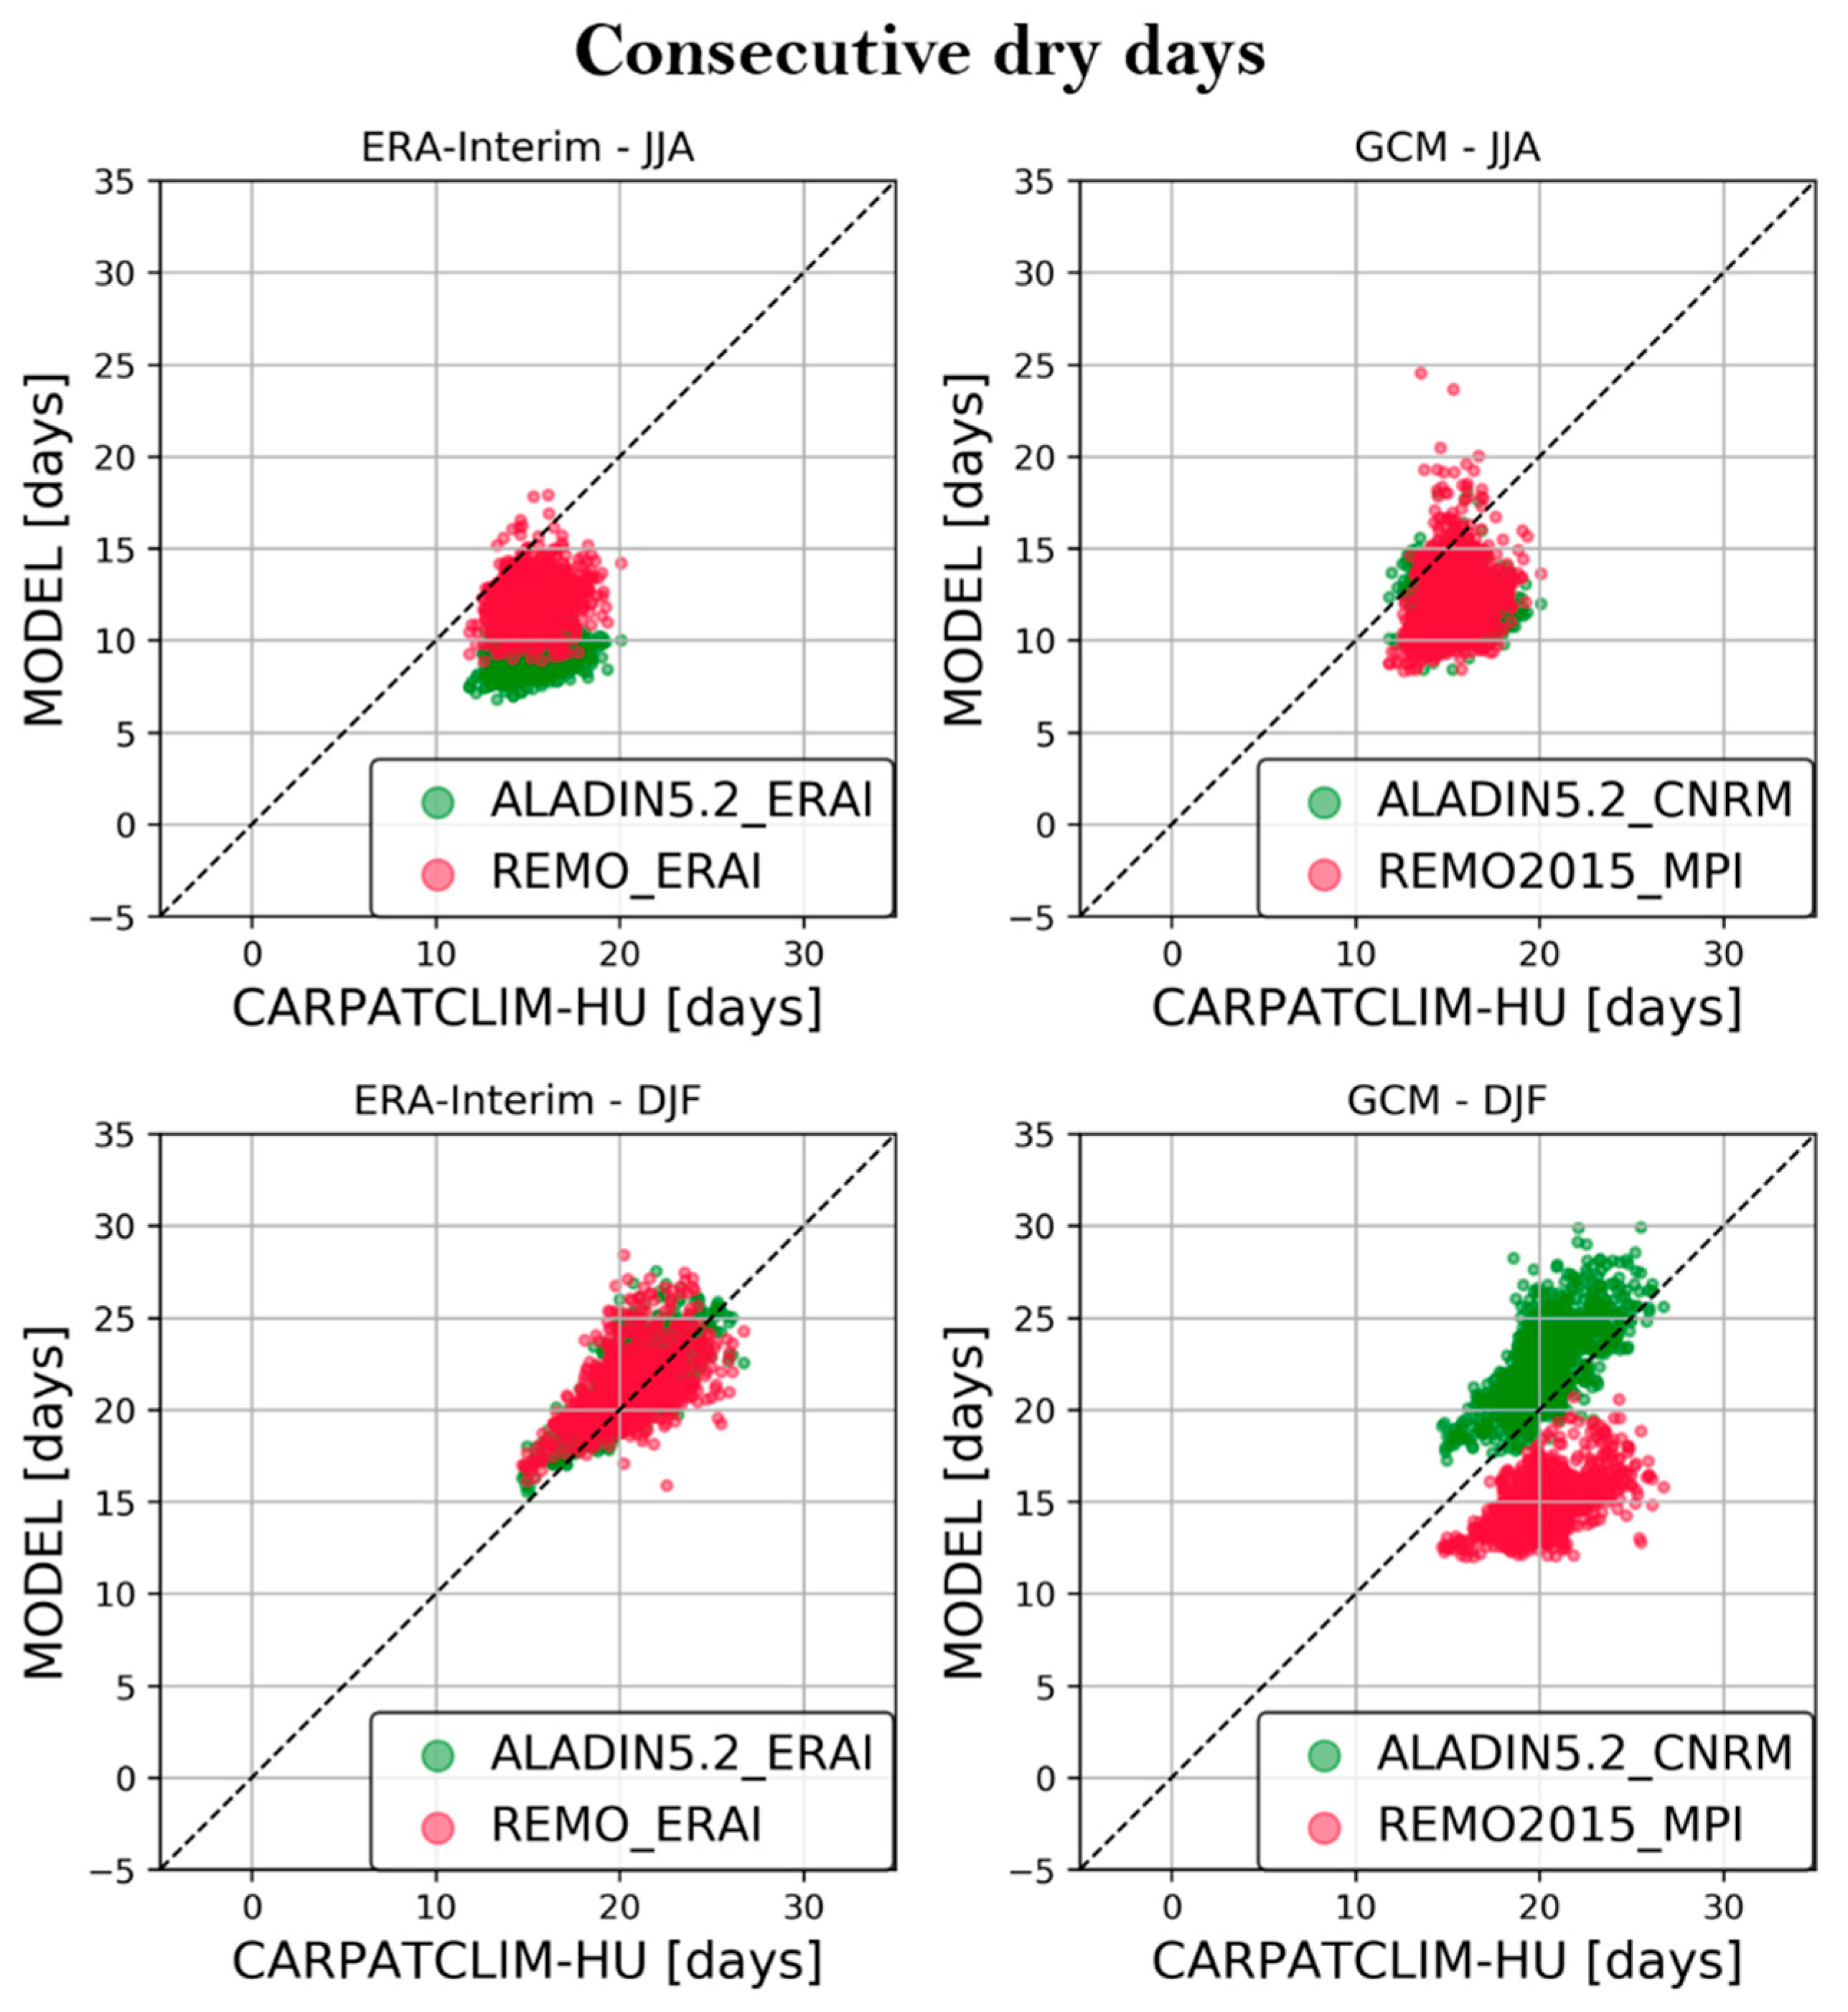
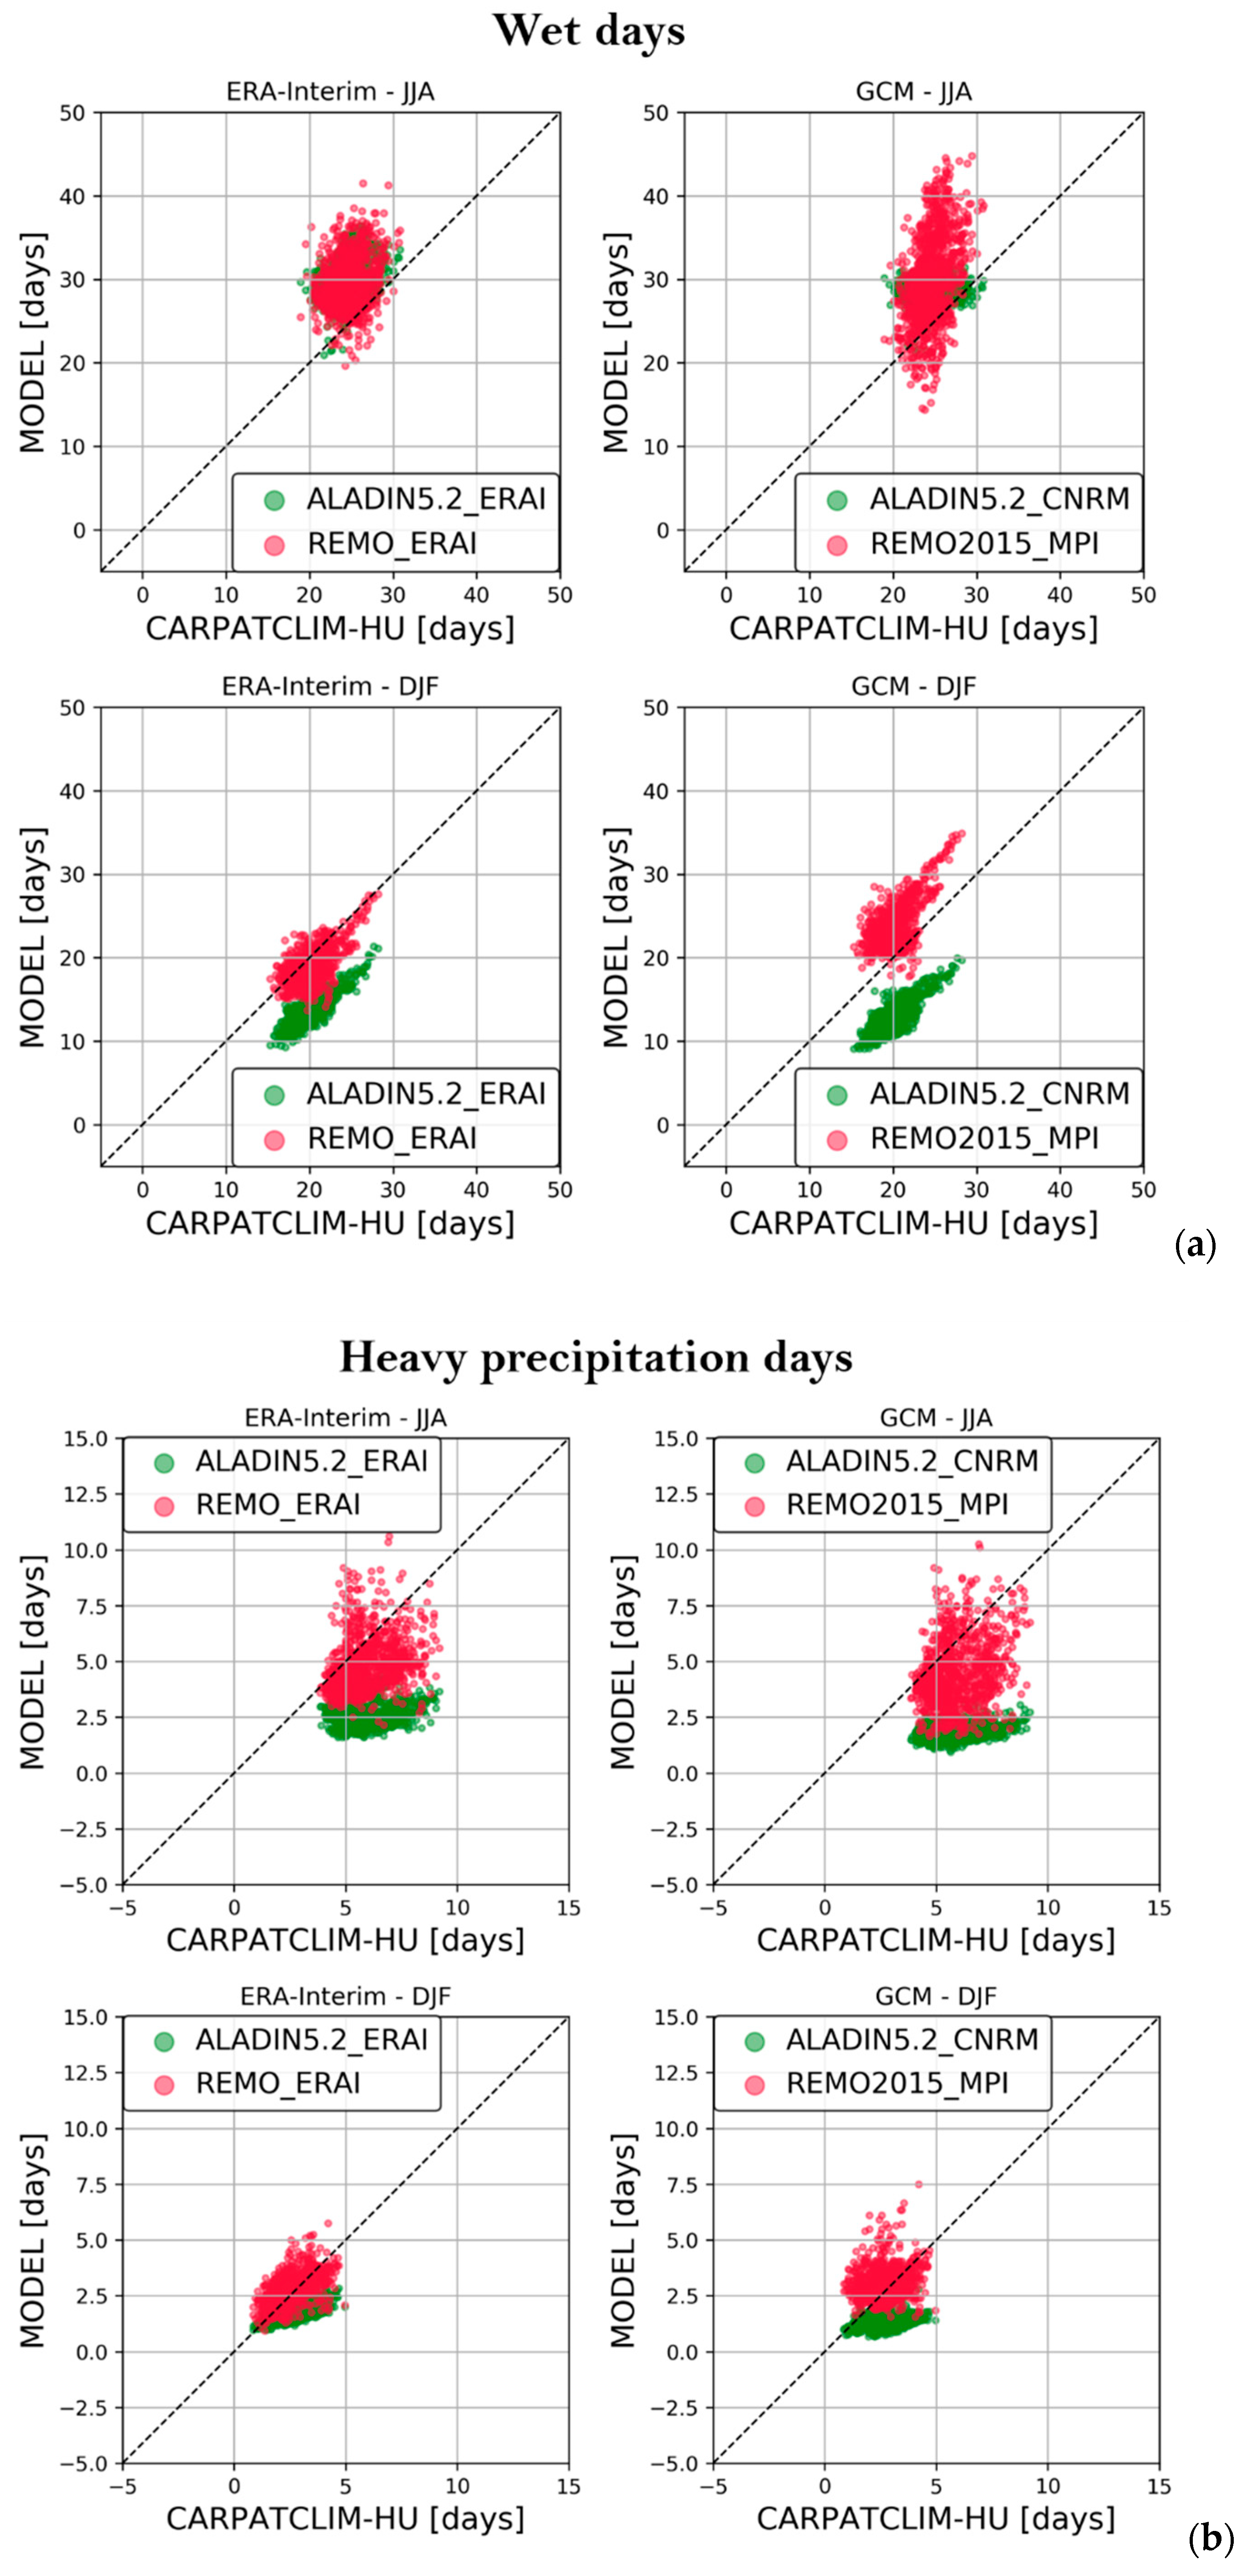
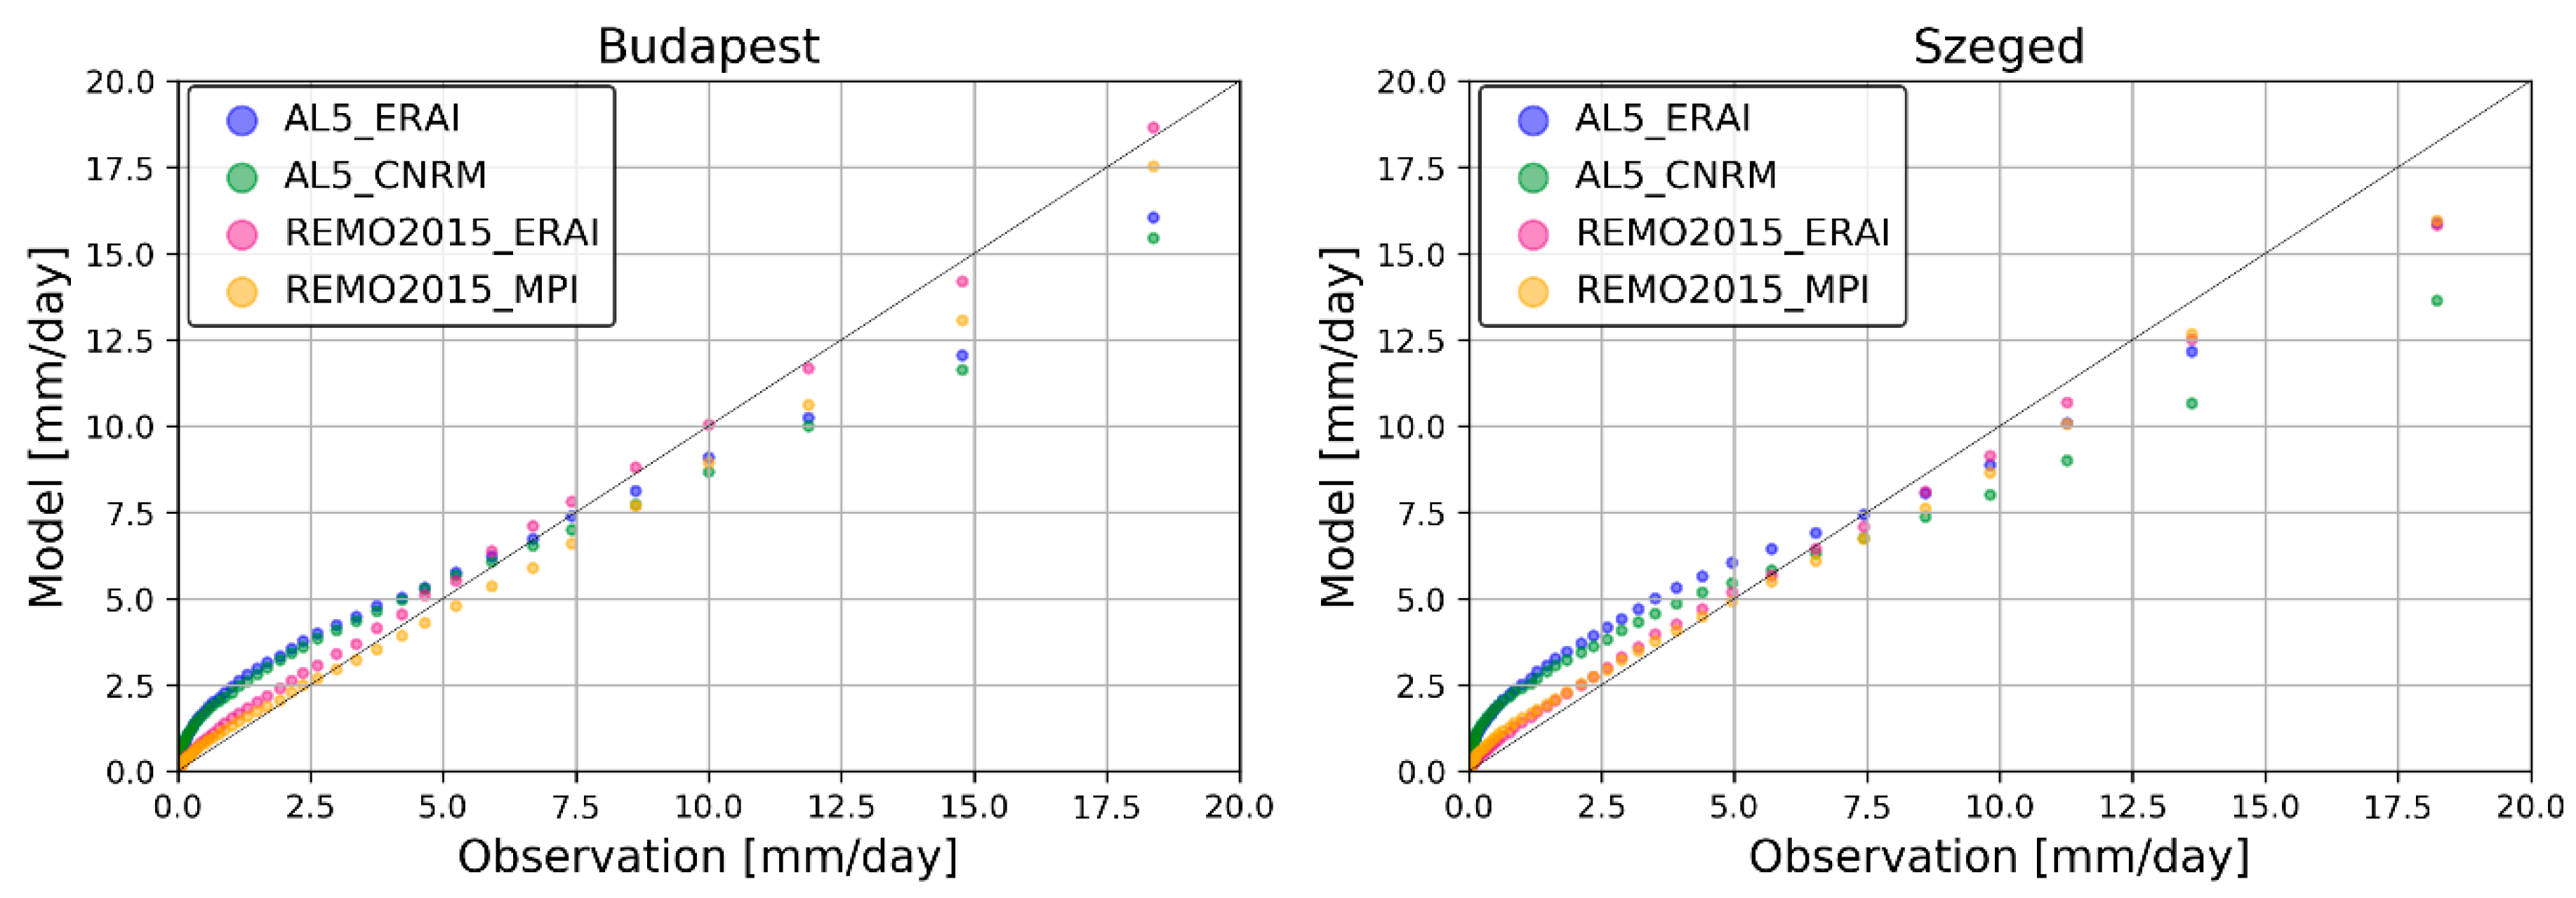
3.1.2. Precipitation

For mean precipitation, the best performance was for the REMO2015 simulations, especially the reanalysis-driven REMO2015 (Table 6), where the correlation between the simulated and observed monthly mean values was between 0.75 and 0.95, the normalized root mean square error was around 0.5, and the ratio of the standard deviations of the modeled and observed data was below 1.2 (Figure 3). The ratio of the standard deviations was over 1 (between 1.4 and 1.8) in the case of ALADIN5.2 as well, caused mainly by the overestimation of spring and summer precipitation, especially for the ERA-Interim driven ALADIN5.2 results (Figure 6). In autumn and winter, we found an underestimation of precipitation in the case of three simulations. The correlation values presented in the Taylor diagrams were lower in case of GCM-driven simulations, which is mainly explained by the disposition of the annual maximum or minimum. This conclusion was also supported by other RCM results (e.g., [16]) and derives from the nature of the lateral boundary conditions. While reanalyses are prepared by involving as many measurements as possible and the LBCs of reanalysis-driven simulations are in good agreement (correlation) with the observed climate, some driving GCMs are not able to capture the details of the regional climate (due to their coarse resolution, insufficient surface representation, etc.) and this weakness is inherited by the RCM results.
For July, REMO2015_MPI gave a local minimum for the summer precipitation instead of the observed maximum. The maximum autumn precipitation in November did not appear in this simulation at all; what is more, it had a negative bias of 12 mm. ALADIN5.2_CNRM shifted the autumn maximum from November to October, which was preceded by an underestimation of precipitation in August–September.
The number of consecutive dry days in winter (Figure 7) was fairly well represented by the reanalysis-driven simulations. The two GCM-driven models had bias with the opposite signs: while REMO2015 slightly underestimated it, ALADIN5.2 slightly overestimated this index. At the same time, the opposite performance was found for wet days in winter (Figure 8a), i.e., REMO2015 simulated too many and ALADIN5.2 simulated too few such days. All four simulations slightly underestimated the dry periods of summer and overestimated wet days. This is clearly connected to the differences in the annual precipitation cycle, i.e., the positive bias in spring and summer and the negative bias in autumn and winter. For the number of days of heavy precipitation (Figure 8b), we can see that the values of the REMO2015 model’s simulations are scattered, especially in summer. The values of ALADIN5.2 are concentrated between 1 and 3 days, leading to some negative bias. Figure 9 (Q-Q plot) underlines that the model simulations overestimated small precipitation events and slightly underestimated high precipitation events. This is a general handicap of today’s regional climate models, which can be attributed partly to the deficiencies of the parameterization of convection and partly to the relatively coarse (10–25 km) resolution (e.g., [59]). It has been proven by many studies that the horizontal resolution of the Convection Permitting Regional Climate Models (2–4 km), which resolve deep convection, largely improved the distribution of daily precipitation by producing less frequent weak precipitation and more frequent and more intense heavy precipitation [60].

3.2. Projections for 2021–2050 and 2071–2100
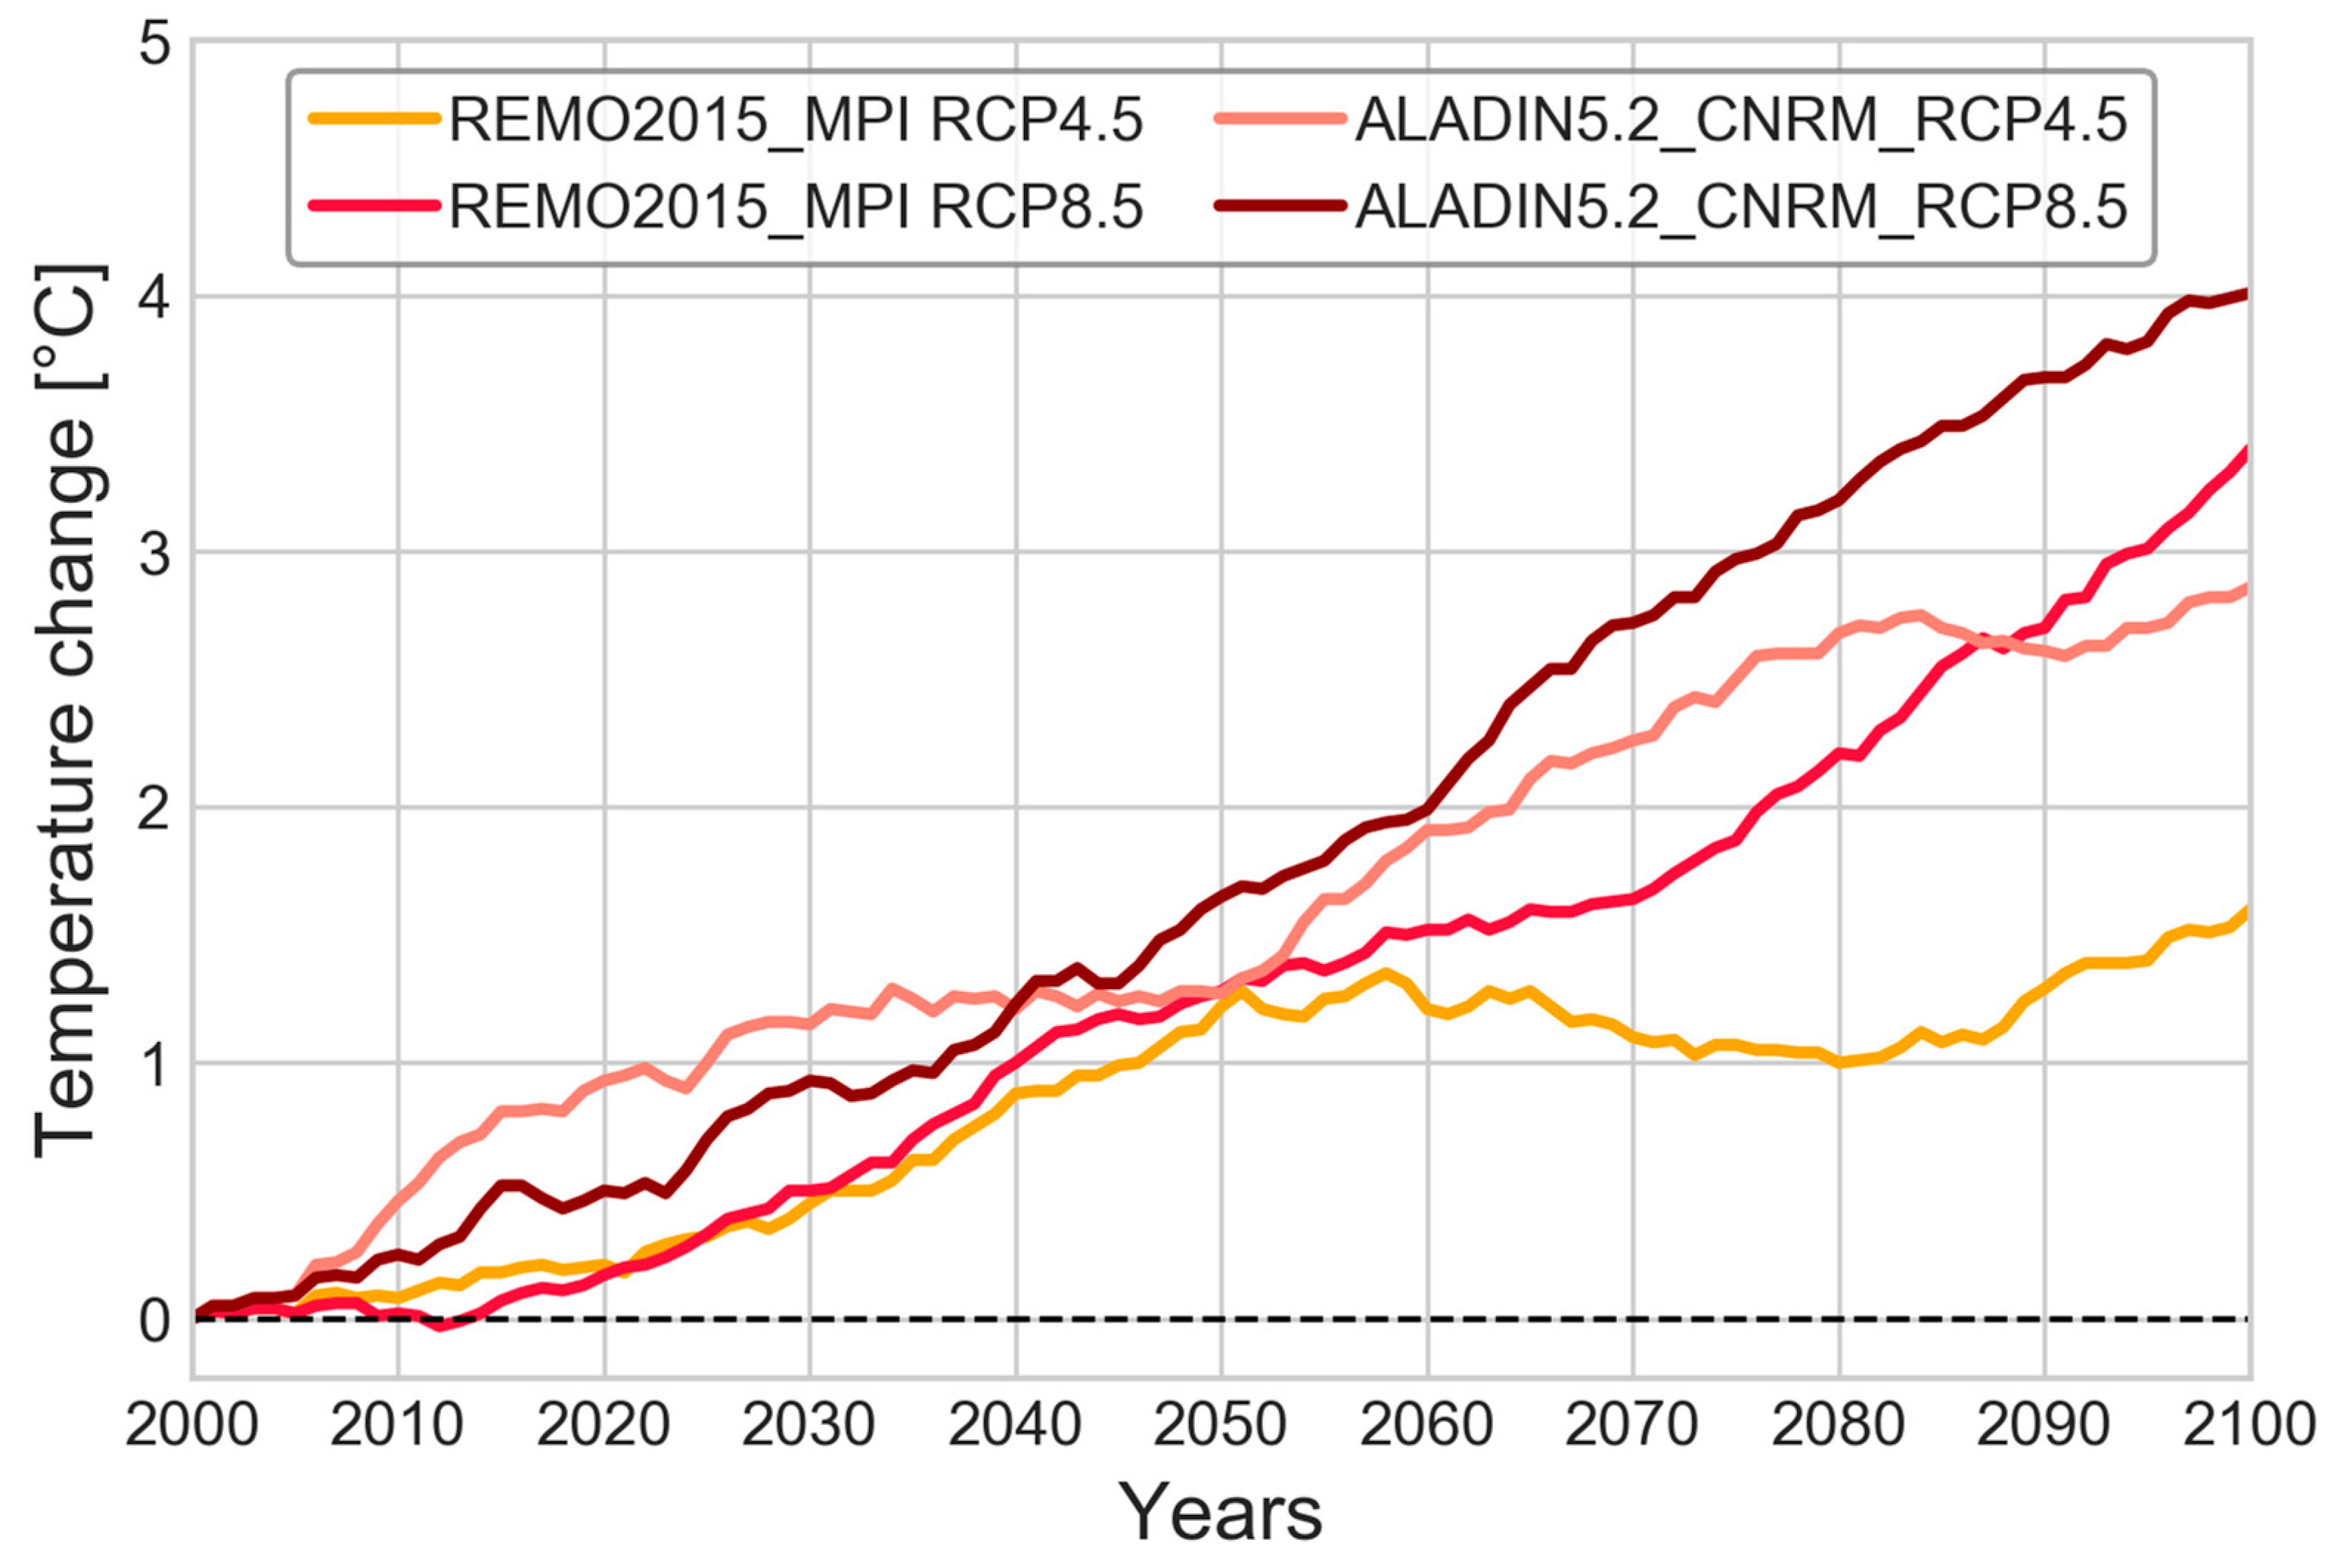
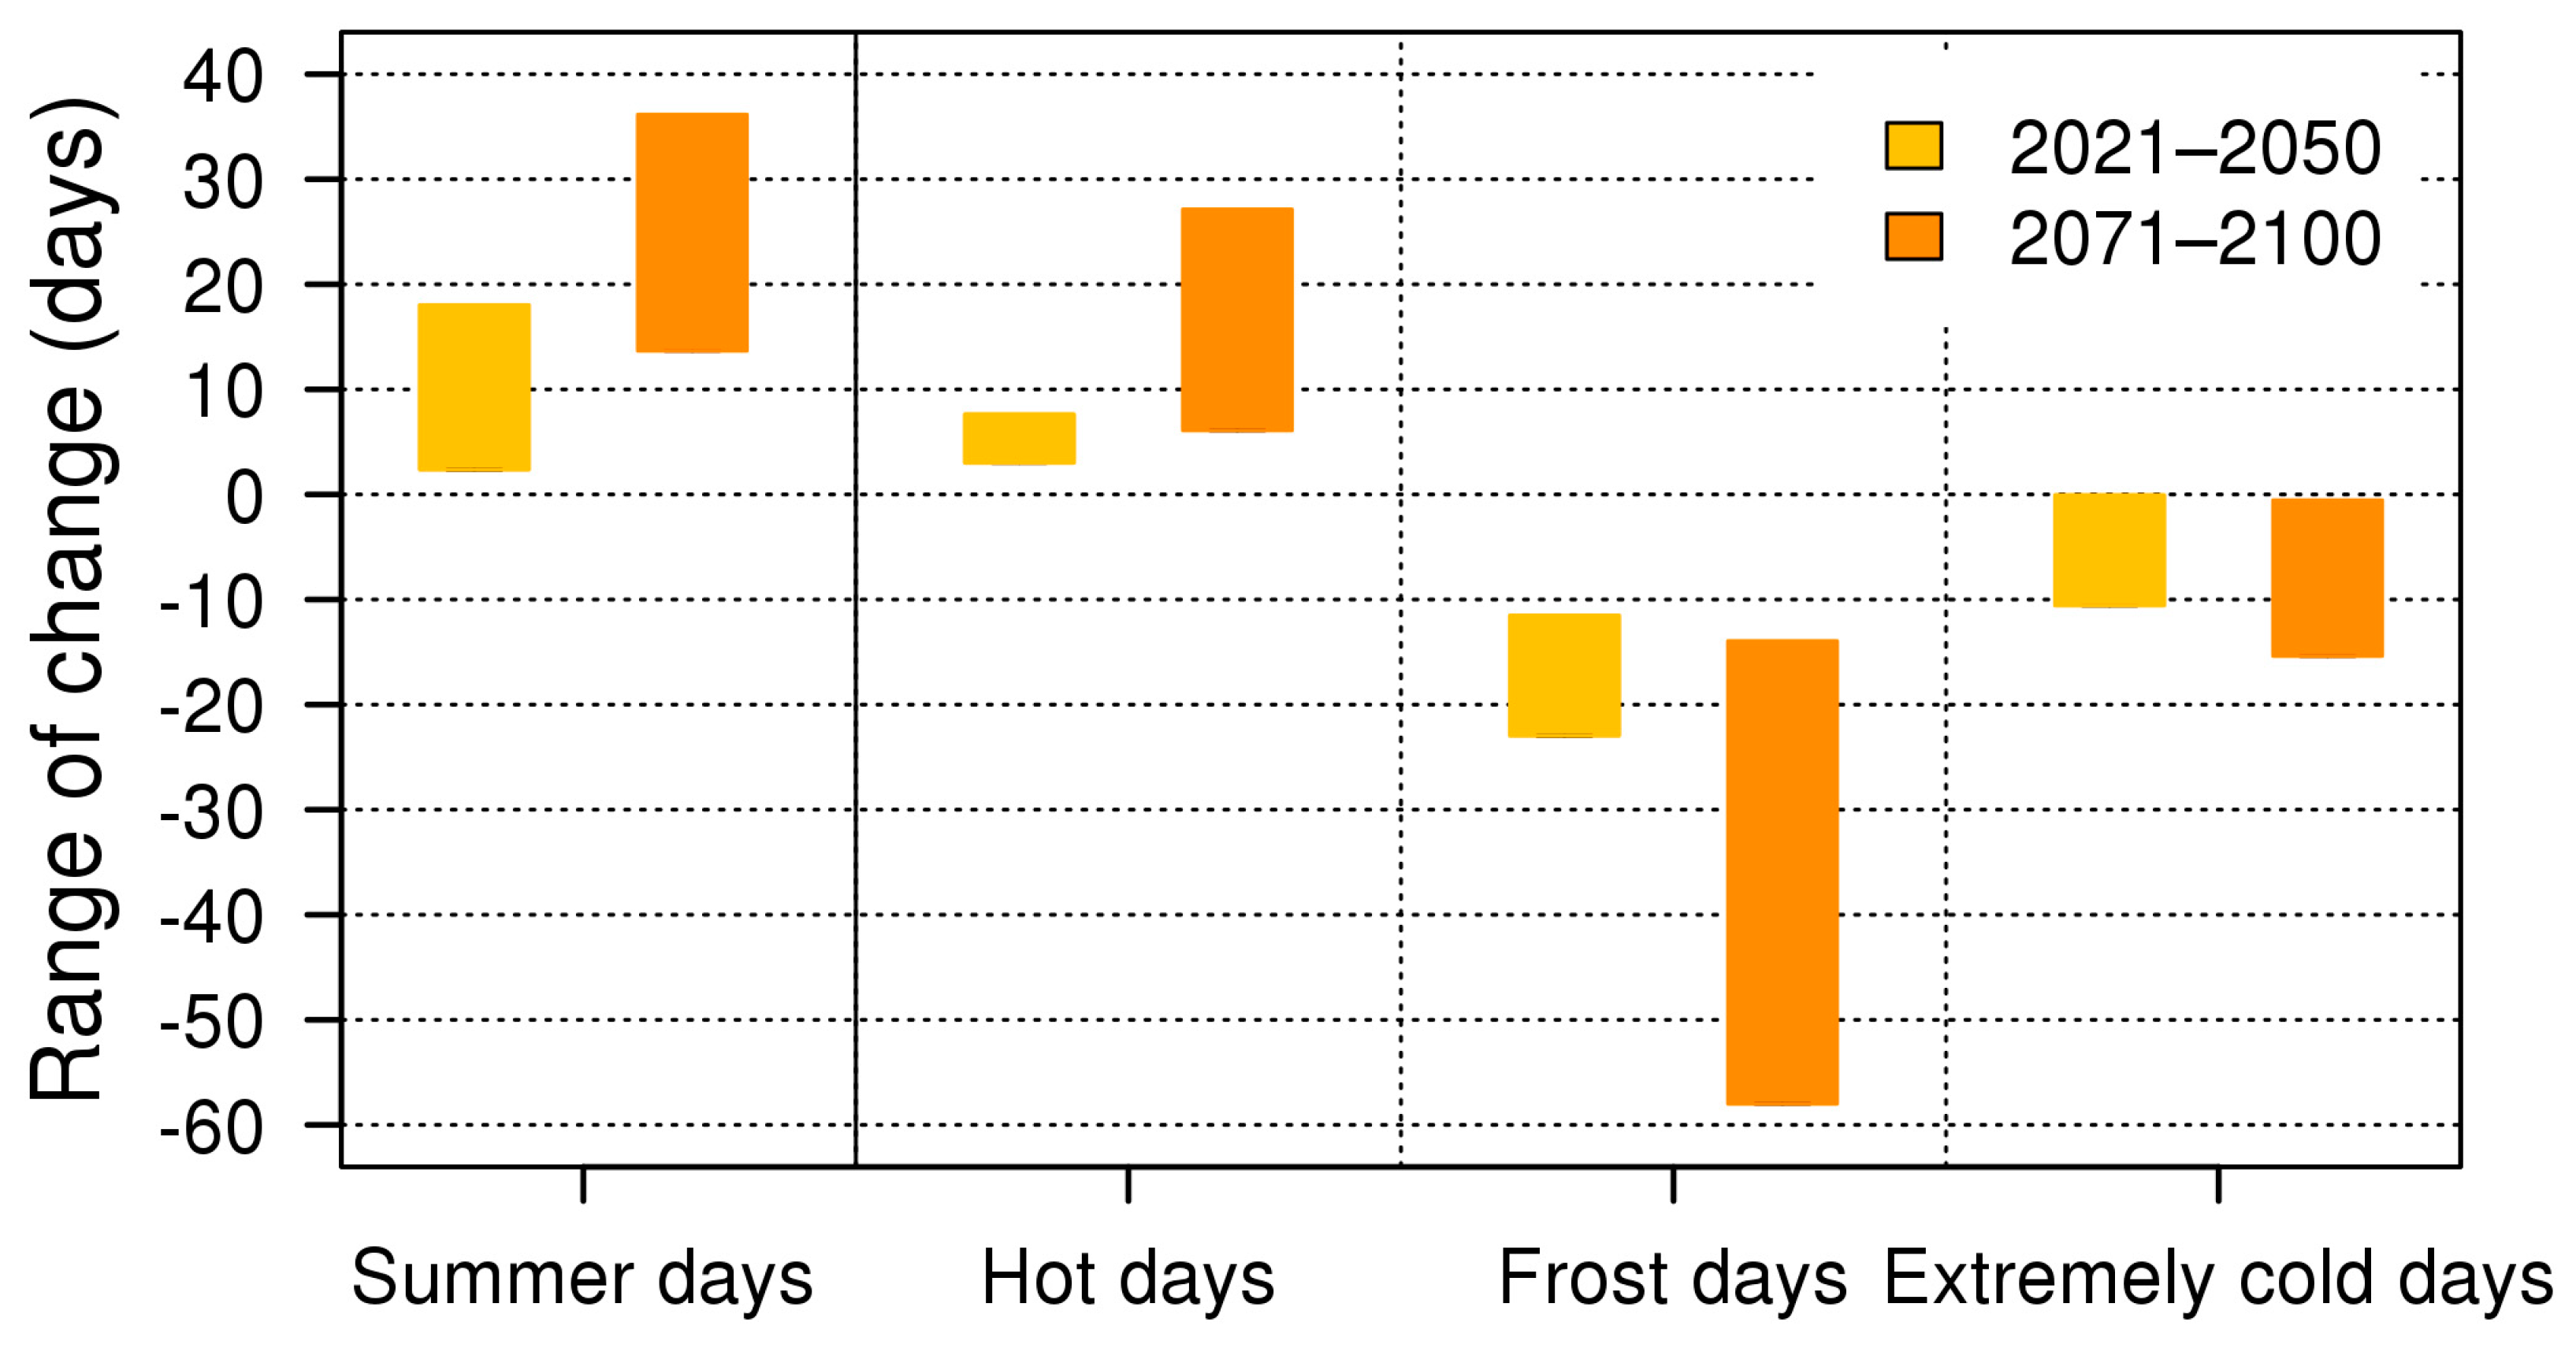
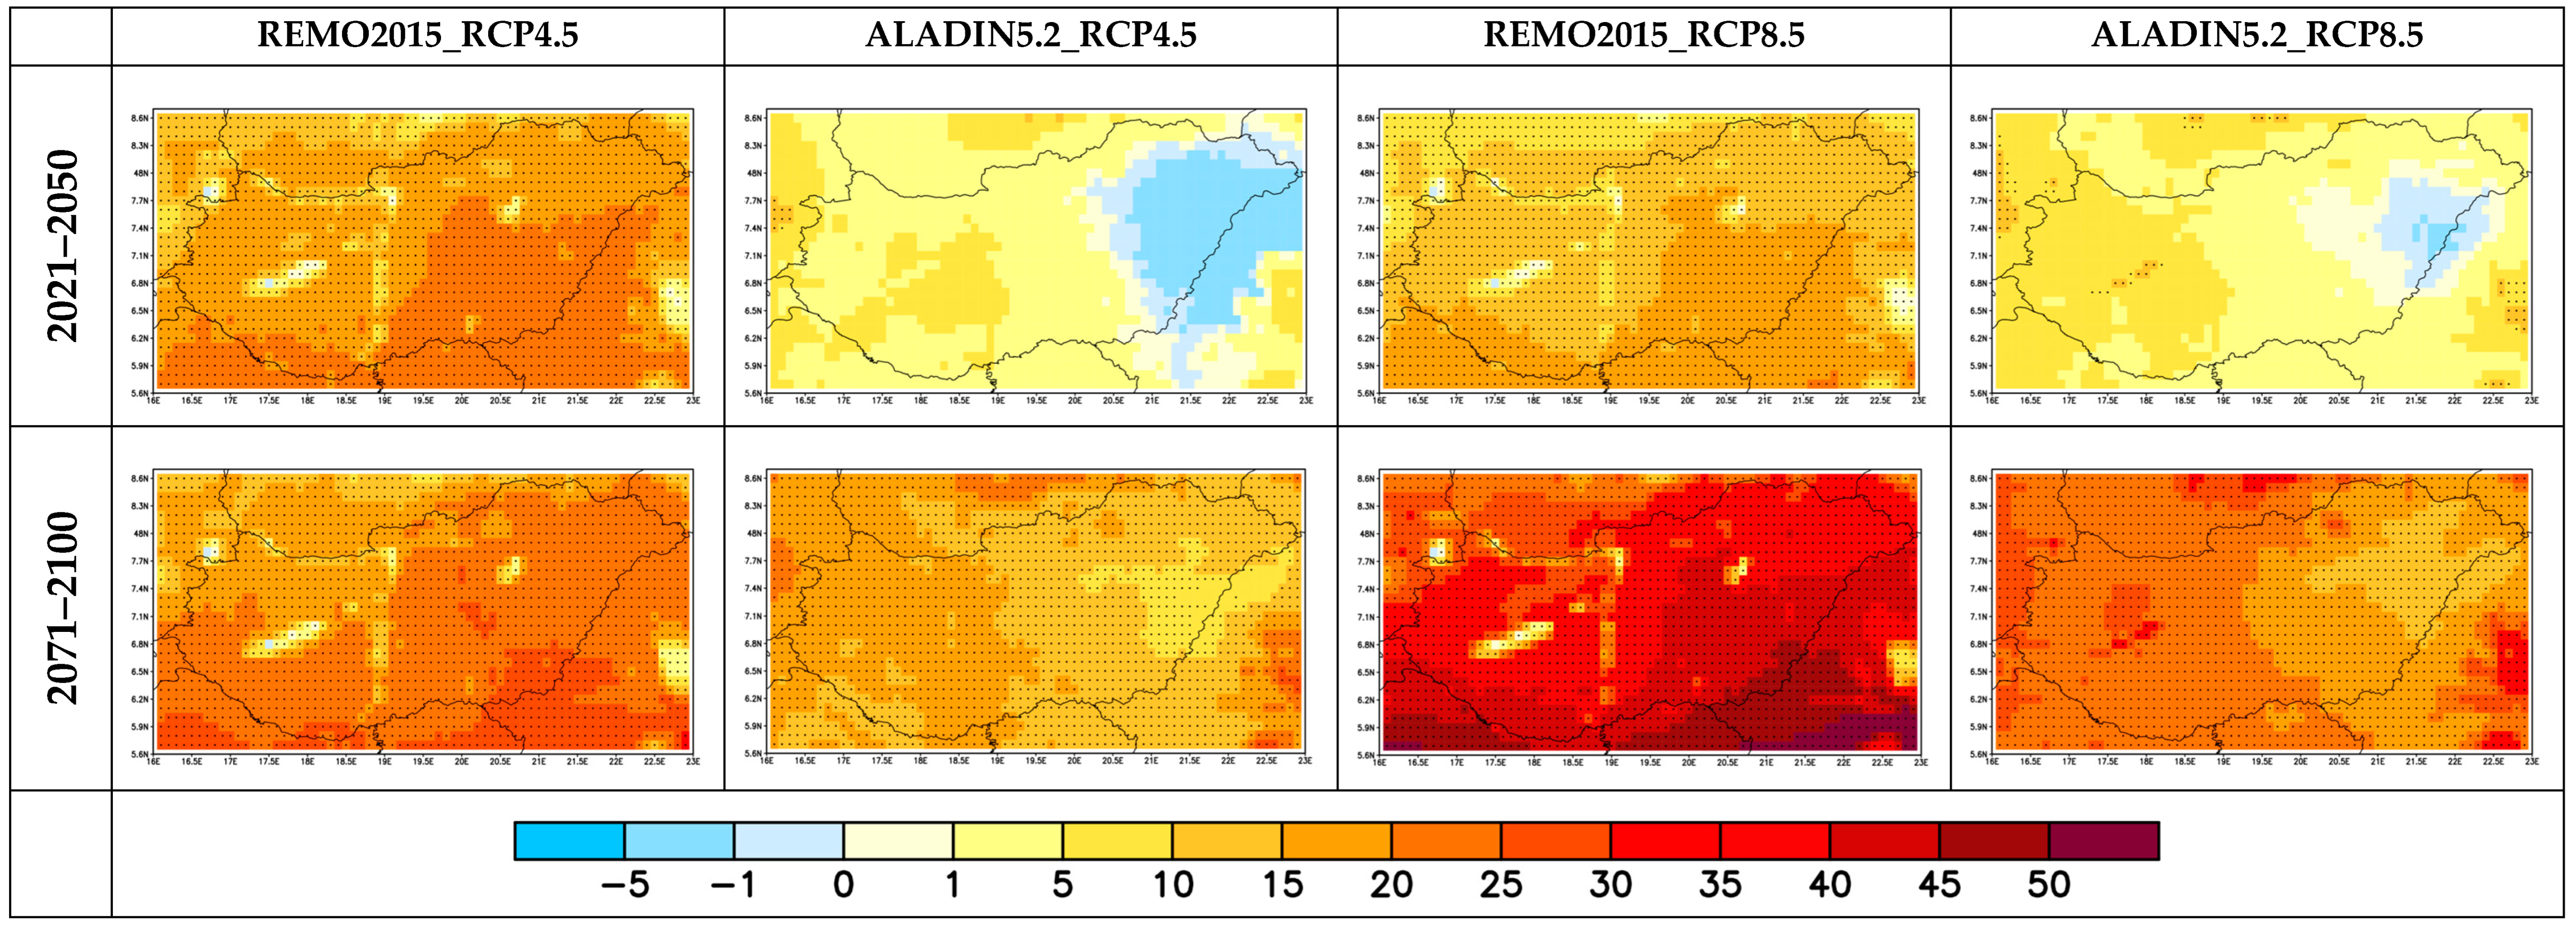
3.2.1. Temperature

First of all, we assessed the change in mean temperature in Hungary. In Figure 10, one can see the evolution of the change in annual mean temperature for the period of 2000–2100 with respect to the 1971–2000 reference period. In the first part of the century the simulations of the same models formed groups caused by the small difference in the radiative forcings of the different scenarios up to 2040. In these decades, the highest temperature was not necessarily given by the high-emission scenario, and warming remained moderate (1.1–1.7 °C in 2021–2050) until the middle of the century. For instance, REMO2015_RCP4.5 showed a higher increase in summer and autumn than REMO2015_RCP8.5 in 2021–2050 (not shown) as well as the annual (and most of the seasonal) results of ALADIN5.2_RCP4.5 (Figure 10). After 2040, the simulations were rearranged according to the scenarios applied. The simulations under the RCP8.5 scenario followed a steep increasing pathway, resulting in a 3.6–4 °C rise by 2071–2100. At the same time, the simulations under the RCP4.5 scenario showed moderate warming after some stagnation around 2050 for ALADIN5.2 or until the mid-2080s for REMO2015, and the change did not exceed 3 °C even by 2071–2100. The more moderate warming in the REMO2015 simulations in summer (which largely contributed to the annual averages; not shown) compared with the results of ALADIN5.2 might be explained by the evolution of the different aerosols. This was based on the findings of Boé et al. [61], i.e., if the future trend of anthropogenic aerosols is not taken into account in the RCMs, it might lead to smaller increases in summer temperatures (other seasons were not investigated).
The number of summer days and hot days is likely to increase in accordance with the mean temperature. In average, over Hungary, the annual number of summer days may increase by 2–18 days in 2021–2050 (Figure 11), which will expand to 14–36 days by the end of the century. REMO2015 shows a greater change than ALADIN5.2, especially over the southeast, where the change exceeded 25–40 days by 2071–2100 (Figure 12). We saw a slight and non-significant decrease in the number of summer days projected by the ALADIN5.2 model only in the eastern part of Hungary for 2021–2050, which then disappeared (turned to increase) by 2071–2100. In the case of hot days (Figure 13) both models showed significant increases, especially in 2071–2100, with the highest increases simulated by ALADIN5.2. The results of extremely hot days (Figure 14) are not unequivocal. The ALADIN5.2 model simulations project increase over the Carpathian-Basin, while REMO2015 results show just slight increase with scattered significance on the southern part of Hungary. Some non-significant reduction can be seen over North-Hungary in the case of REMO2015_RCP4.5 simulation. Considering the negative bias of REMO2015 in the temperature indices and the maximum temperature that we indicated in Section 3.1.1, the projections of REMO2015 might have underestimated the magnitude of the changes in these indices. There was an increase in the number of tropical nights as well (Figure 15), most definitely in REMO2015_RCP8.5 (where the change could exceed 20–50 days, depending on the scenario chosen), which might be related to the overestimation of summer minimum temperatures (cf. Section 3.1.1). For REMO2015, the changes were higher for all indices in the south-southeast part of Hungary, while for ALADIN5.2, no clear spatial trend could be detected.
The number of frost days (Figure 16) is likely to decrease by 10–40% in 2021–2050, with small differences between the scenarios. For 2071–2100, the RCP4.5 scenario showed decrease with a similar scale, while for the RCP8.5 scenario, the reduction could reach 40–90%. These significant changes were stronger in the western and southern parts of Hungary, especially with the REMO2015 model. Extremely cold days (Figure 17) might reduce by 70–90% by 2100 in the western part of Hungary according to ALADIN5.2 simulations. Between 2021 and 2050, one can see a 40–80% decrease, and the simulations disagreed about the spatial pattern. The REMO2015 results have a non-significant increasing pattern for both future periods with the RCP4.5 scenario, and for 2021–2050 with the RCP8.5 scenario.
We add that over lakes and rivers, the magnitude of the change in the indices sharply differed from that of the neighbouring areas (much smaller changes or changes with the opposite sign), which might be explained by the lack of a lake module in REMO2015. It considers water surface temperatures by applying the nearest sea surface temperature to all inland water surface points. This topic was covered earlier by Suga et al. [29].

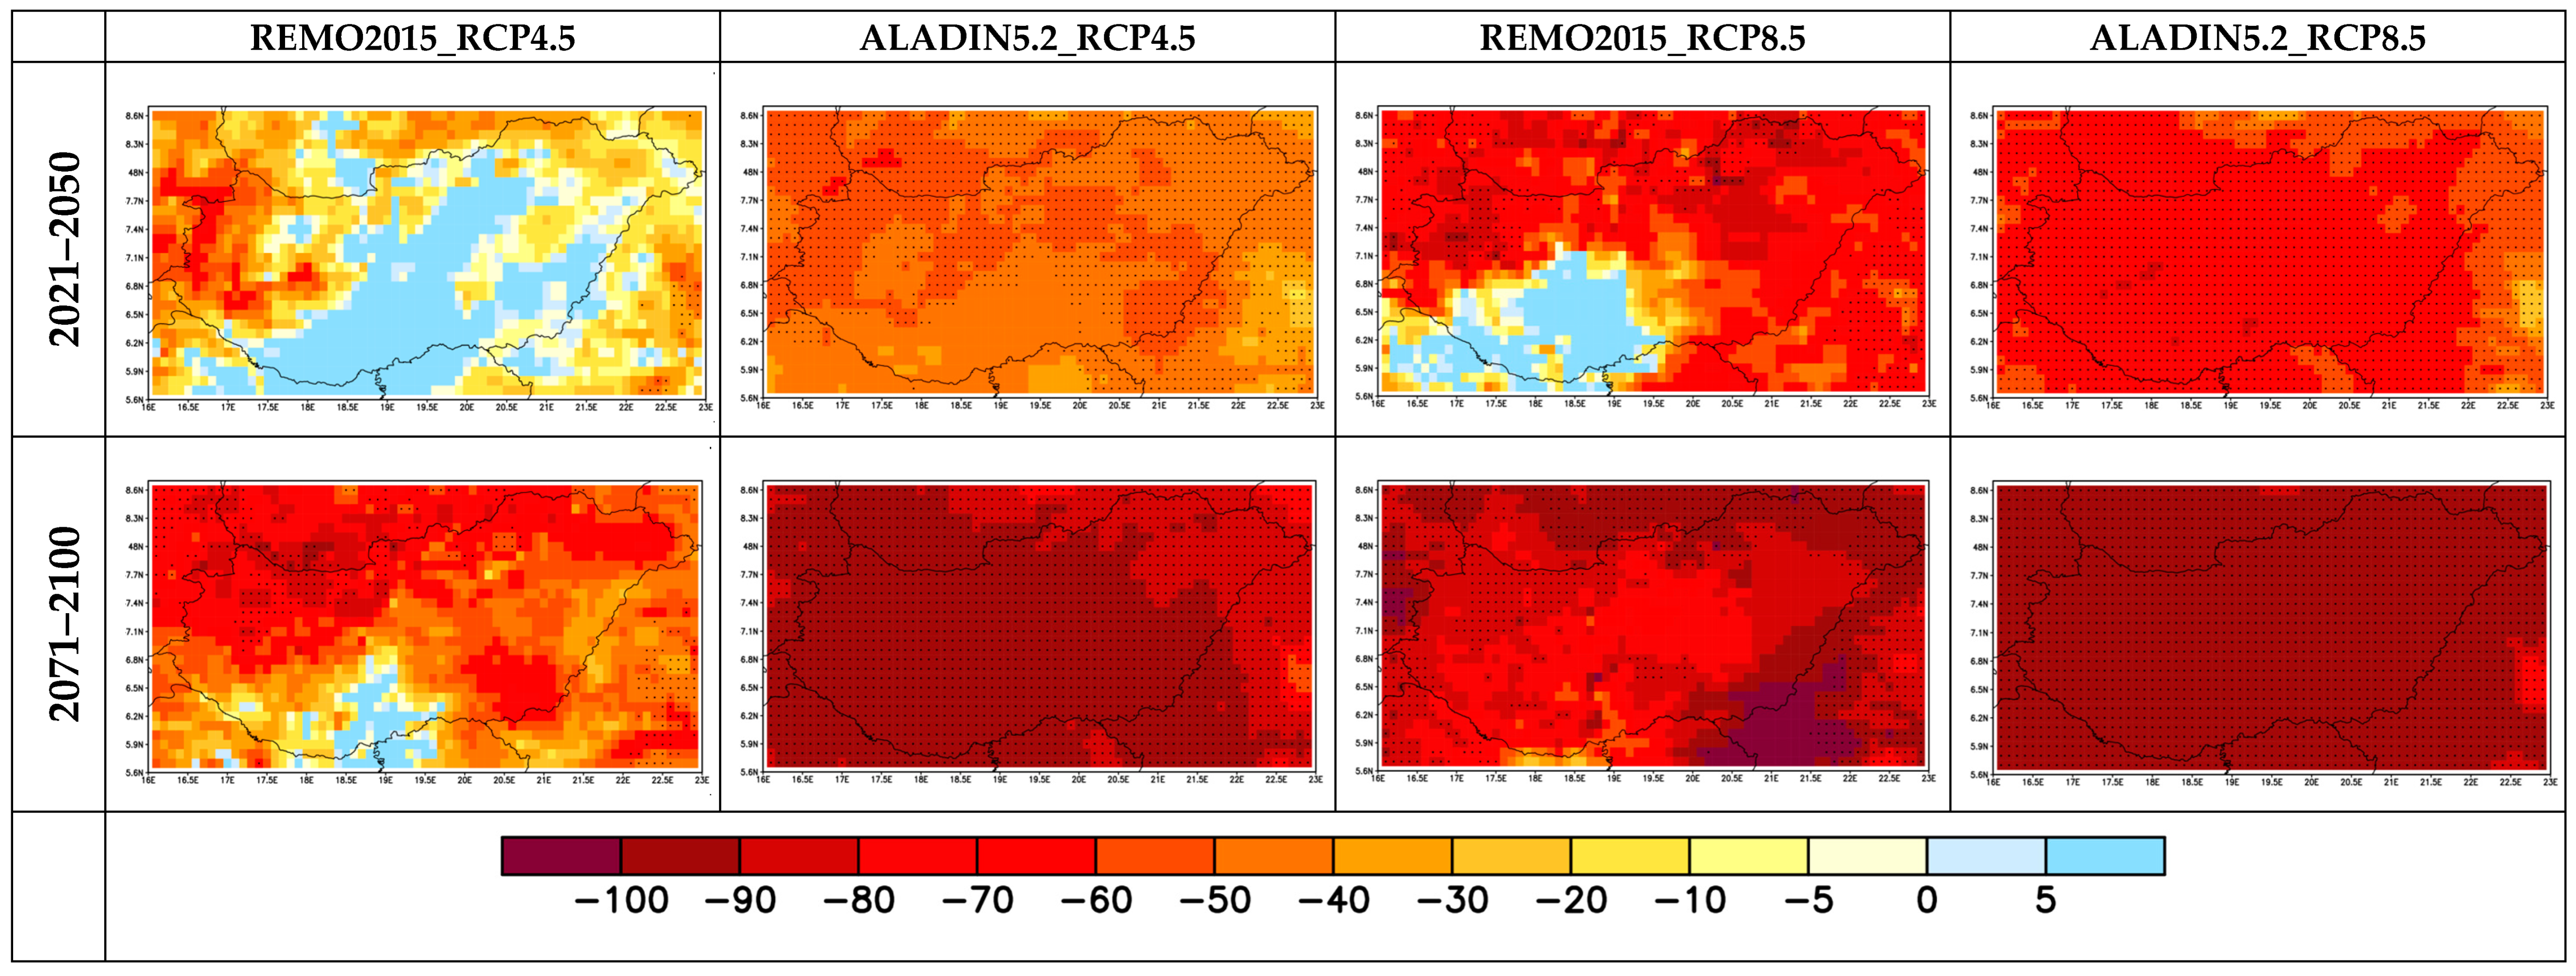
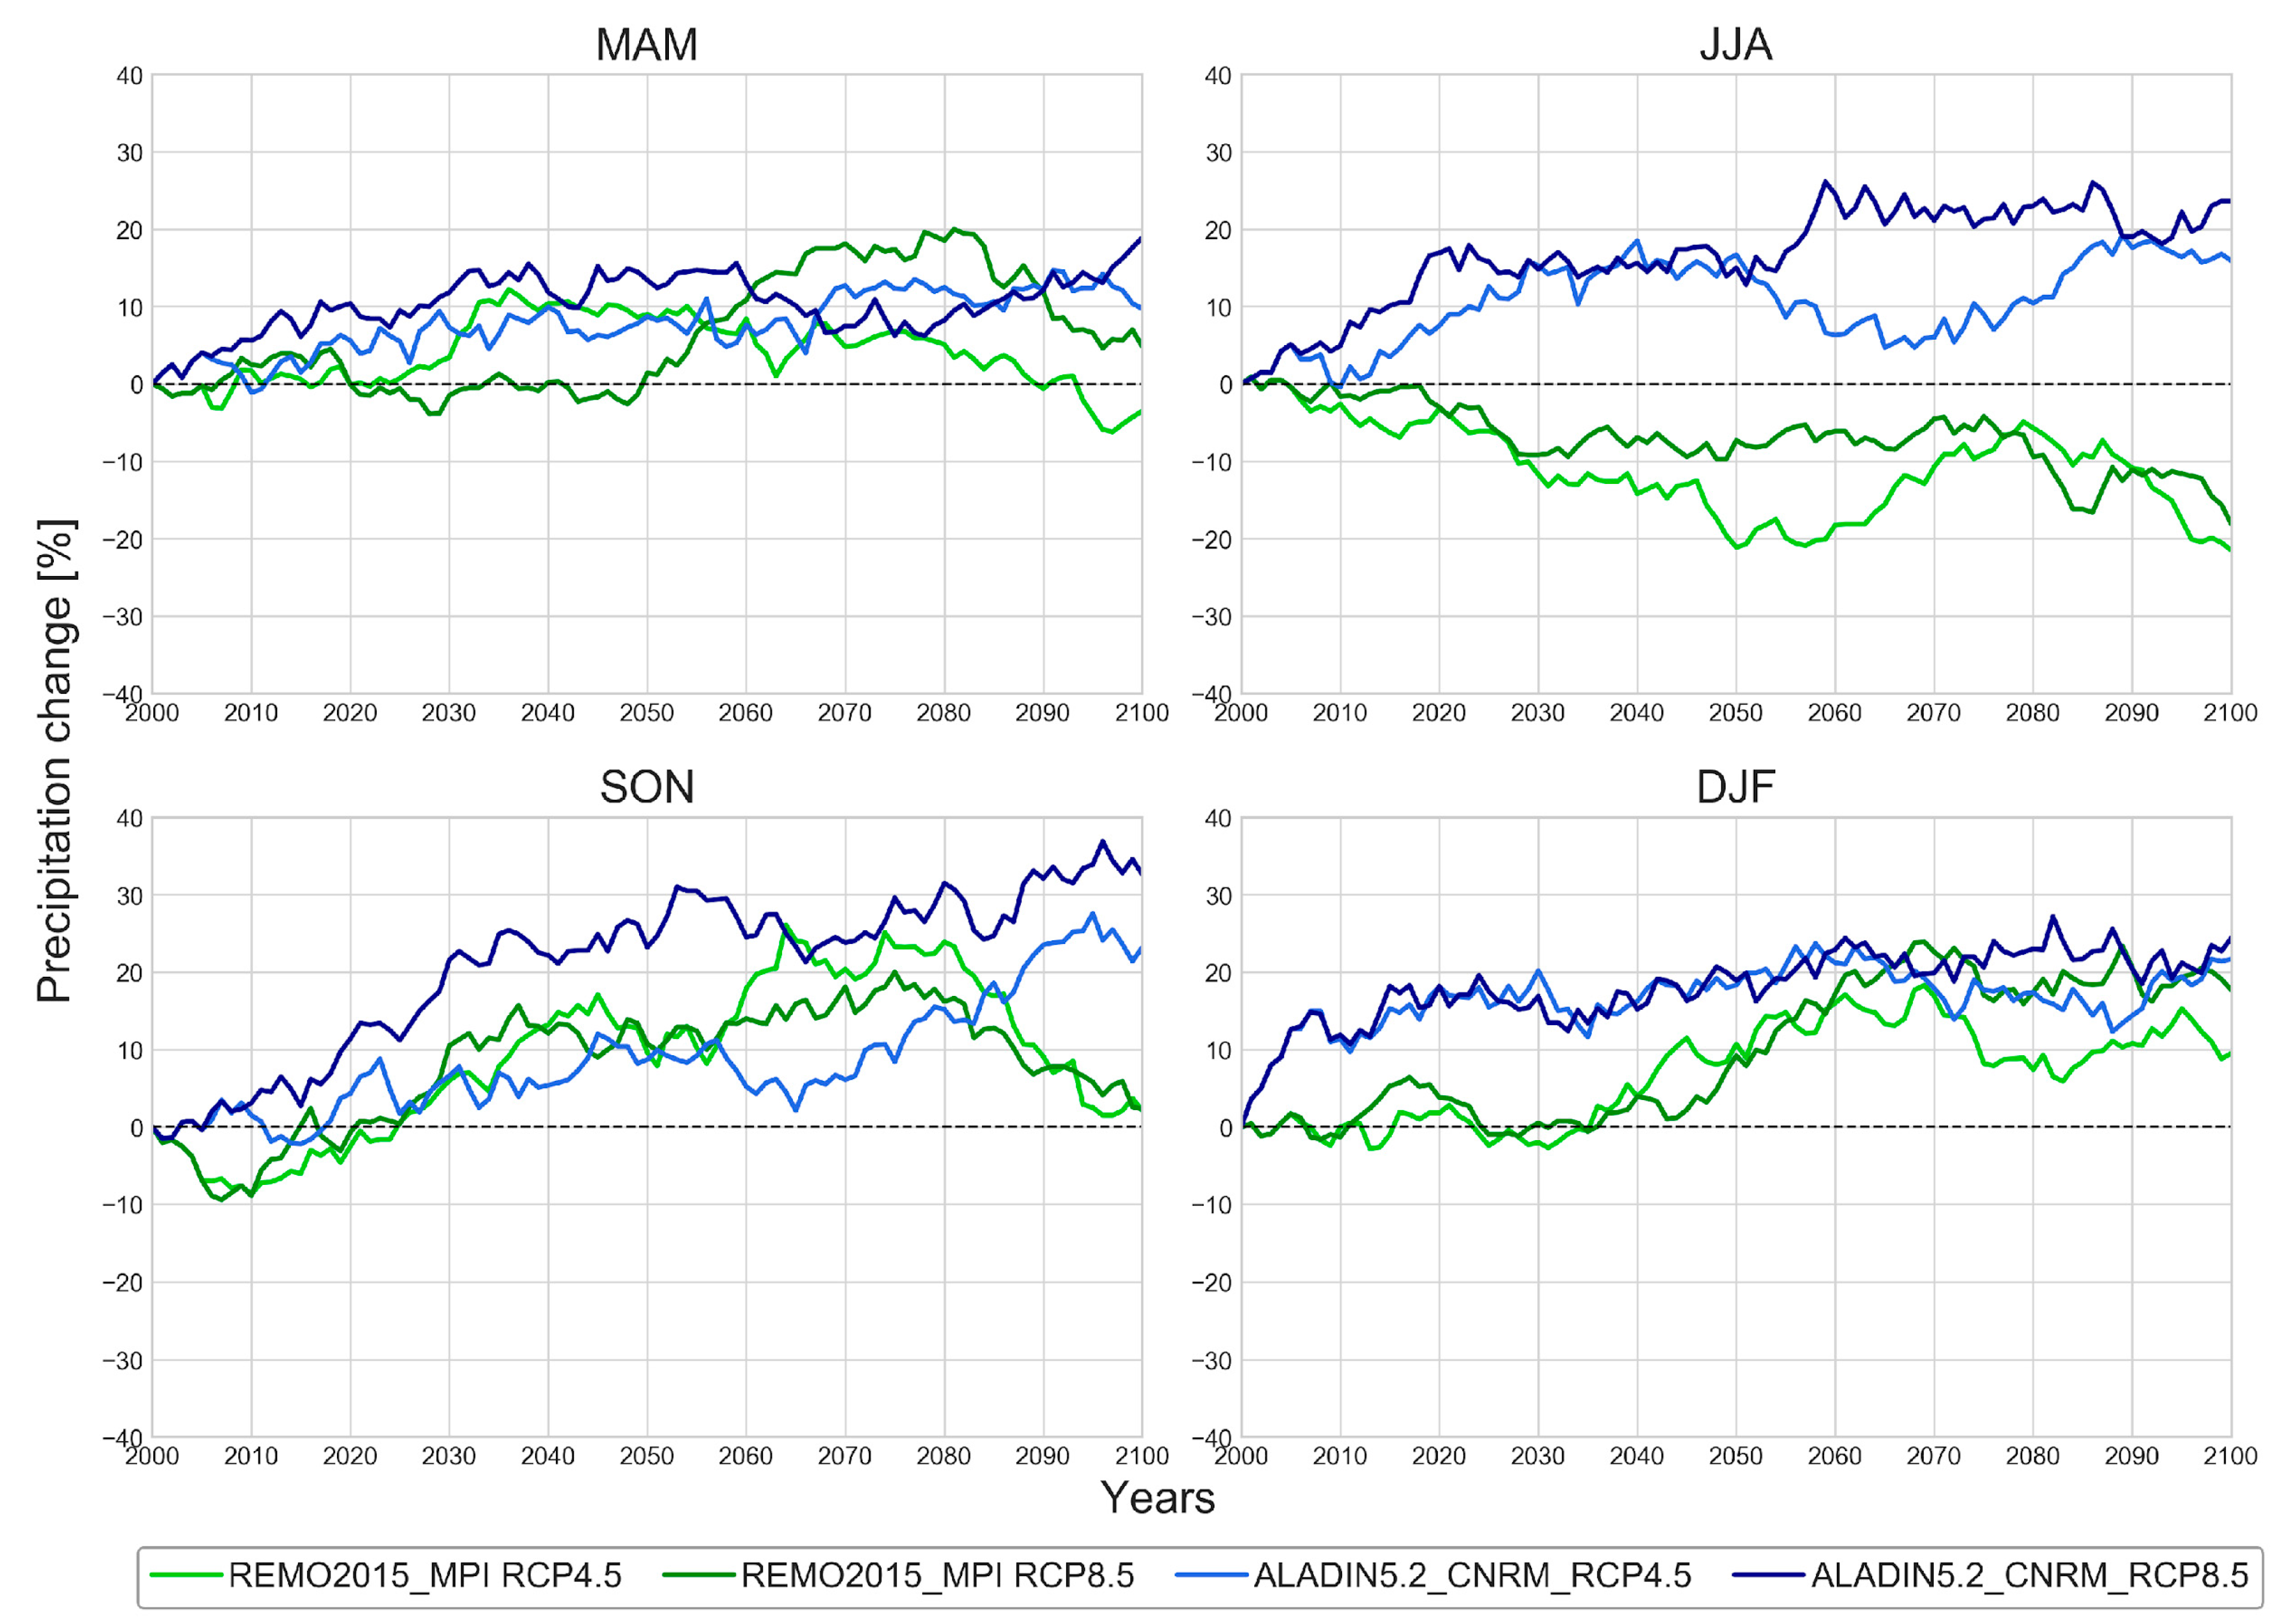
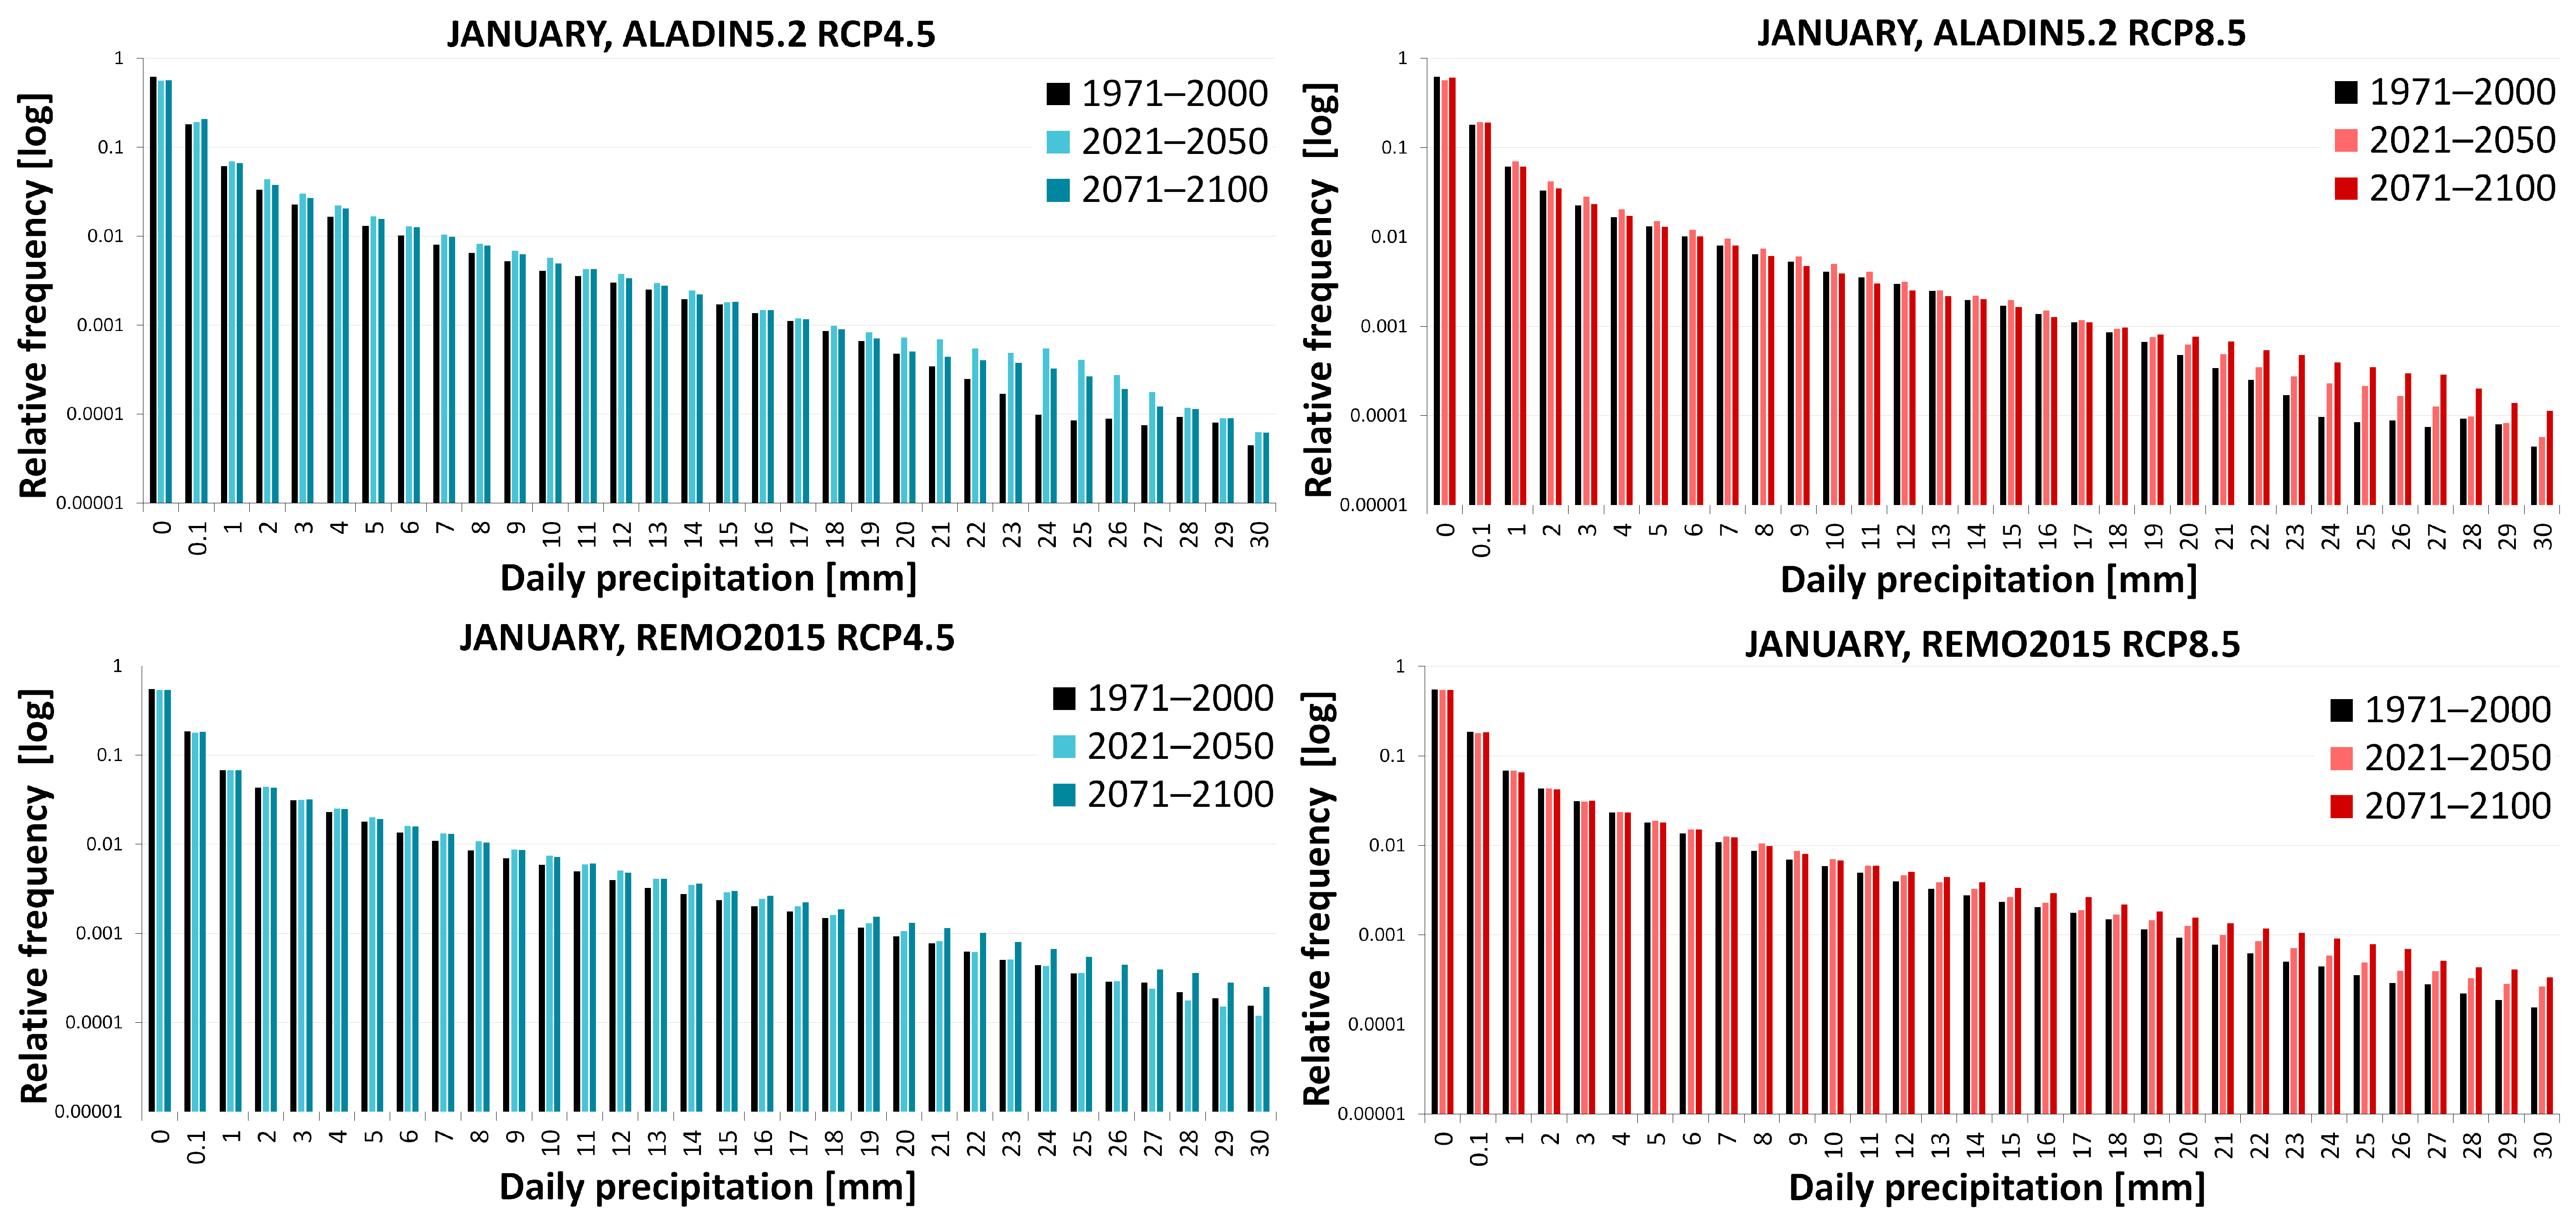
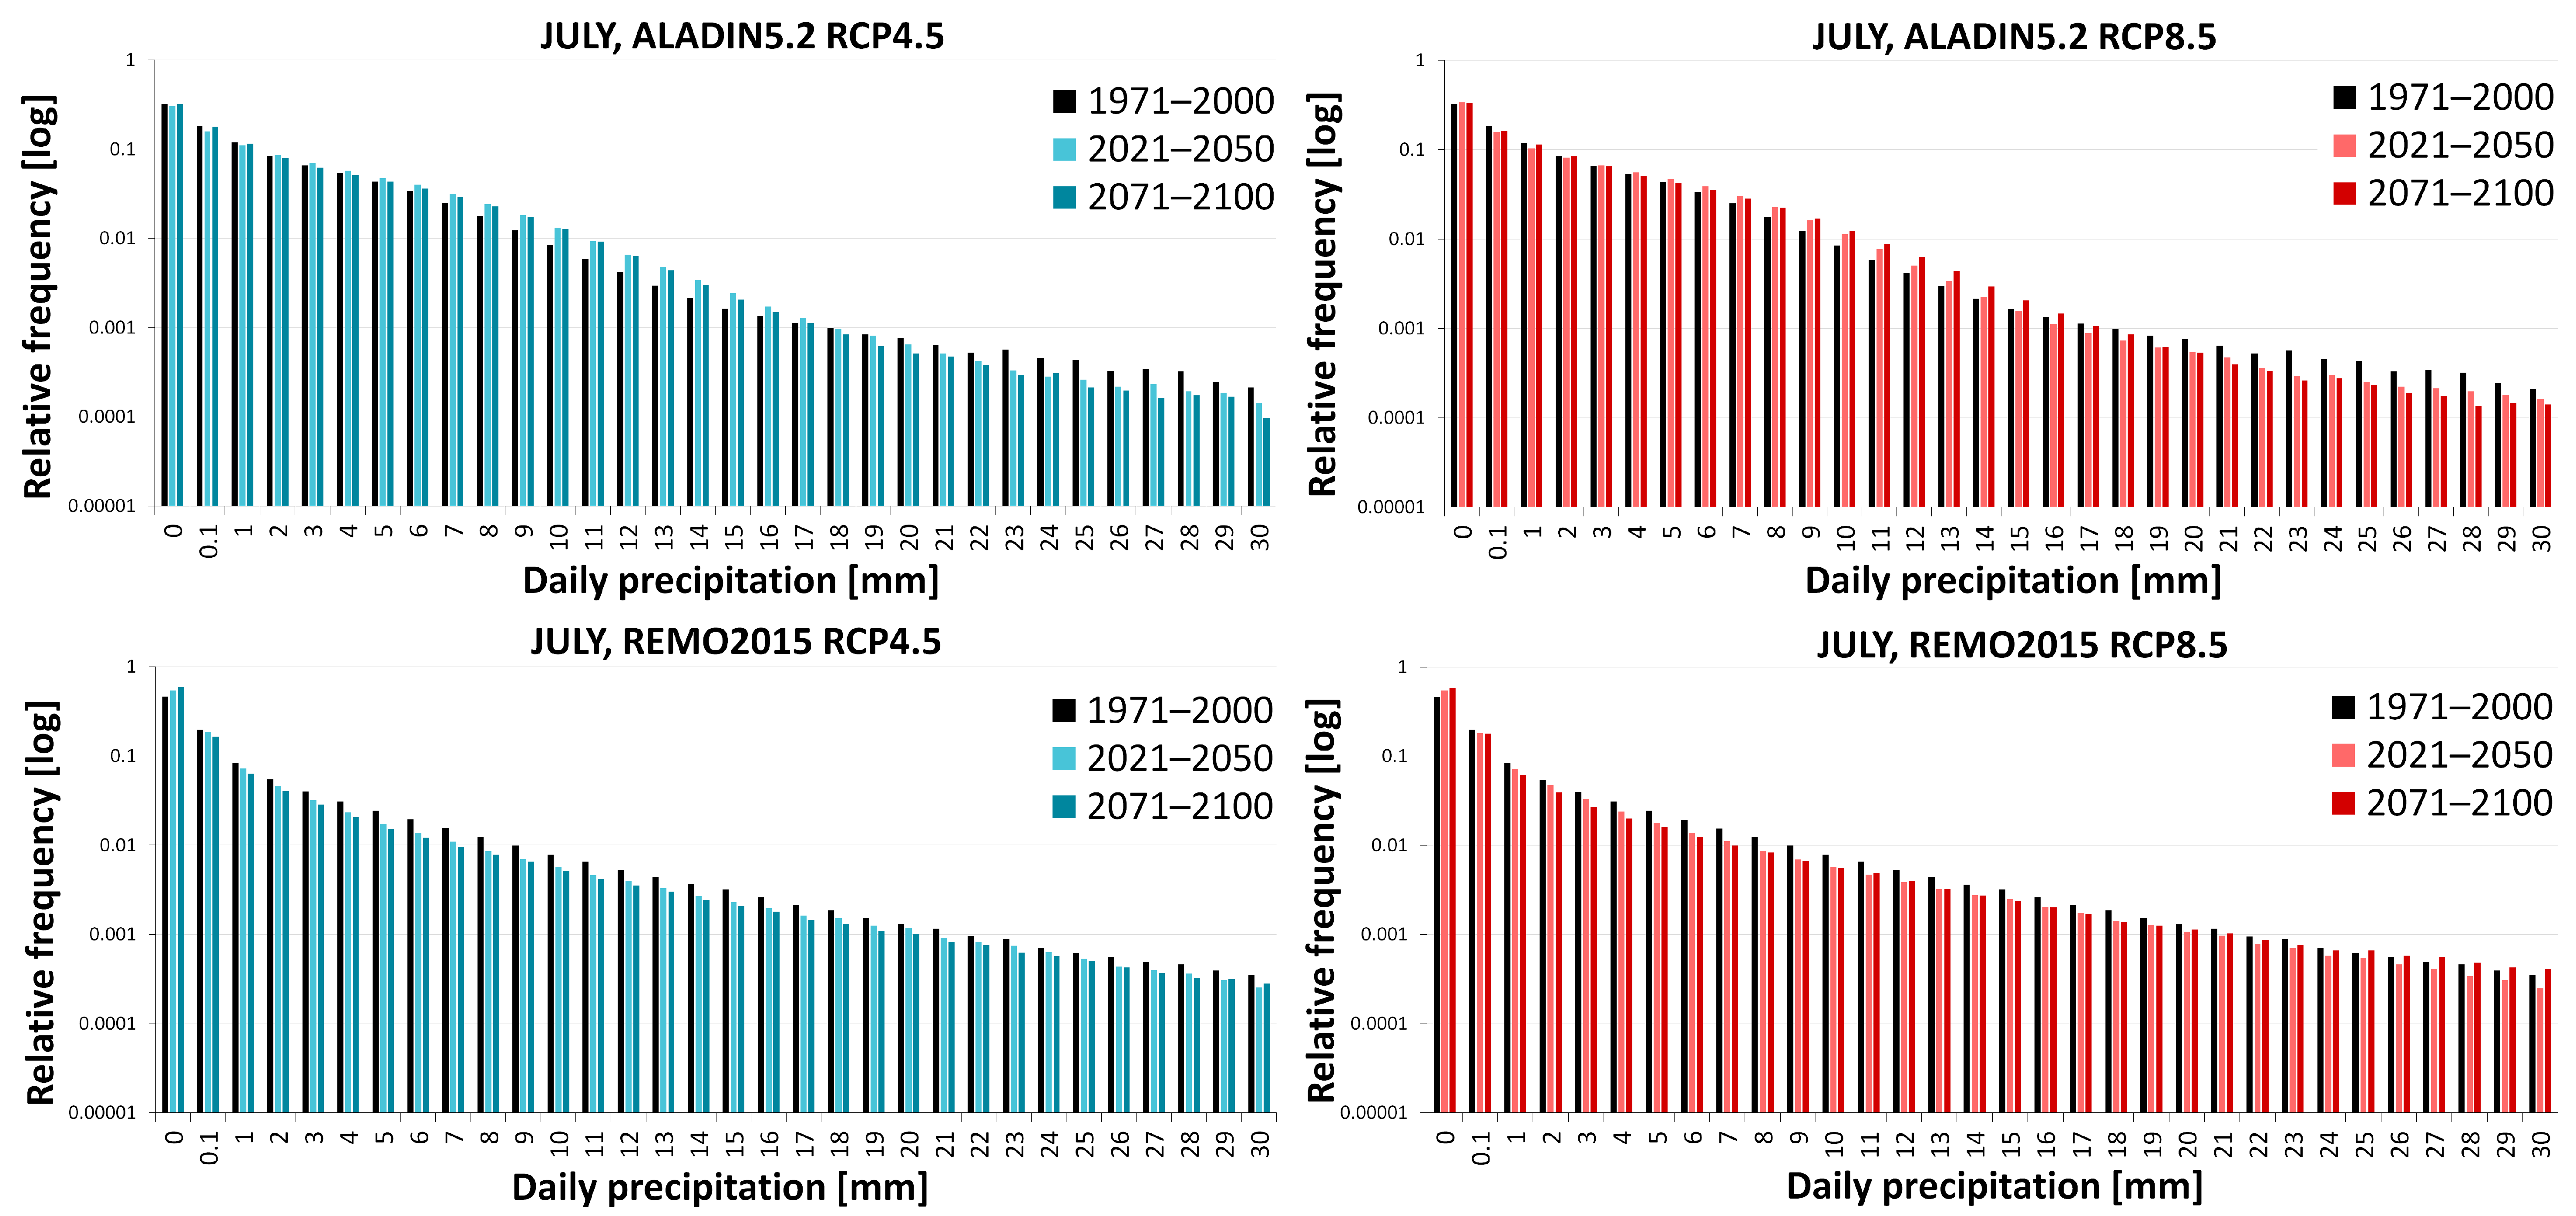
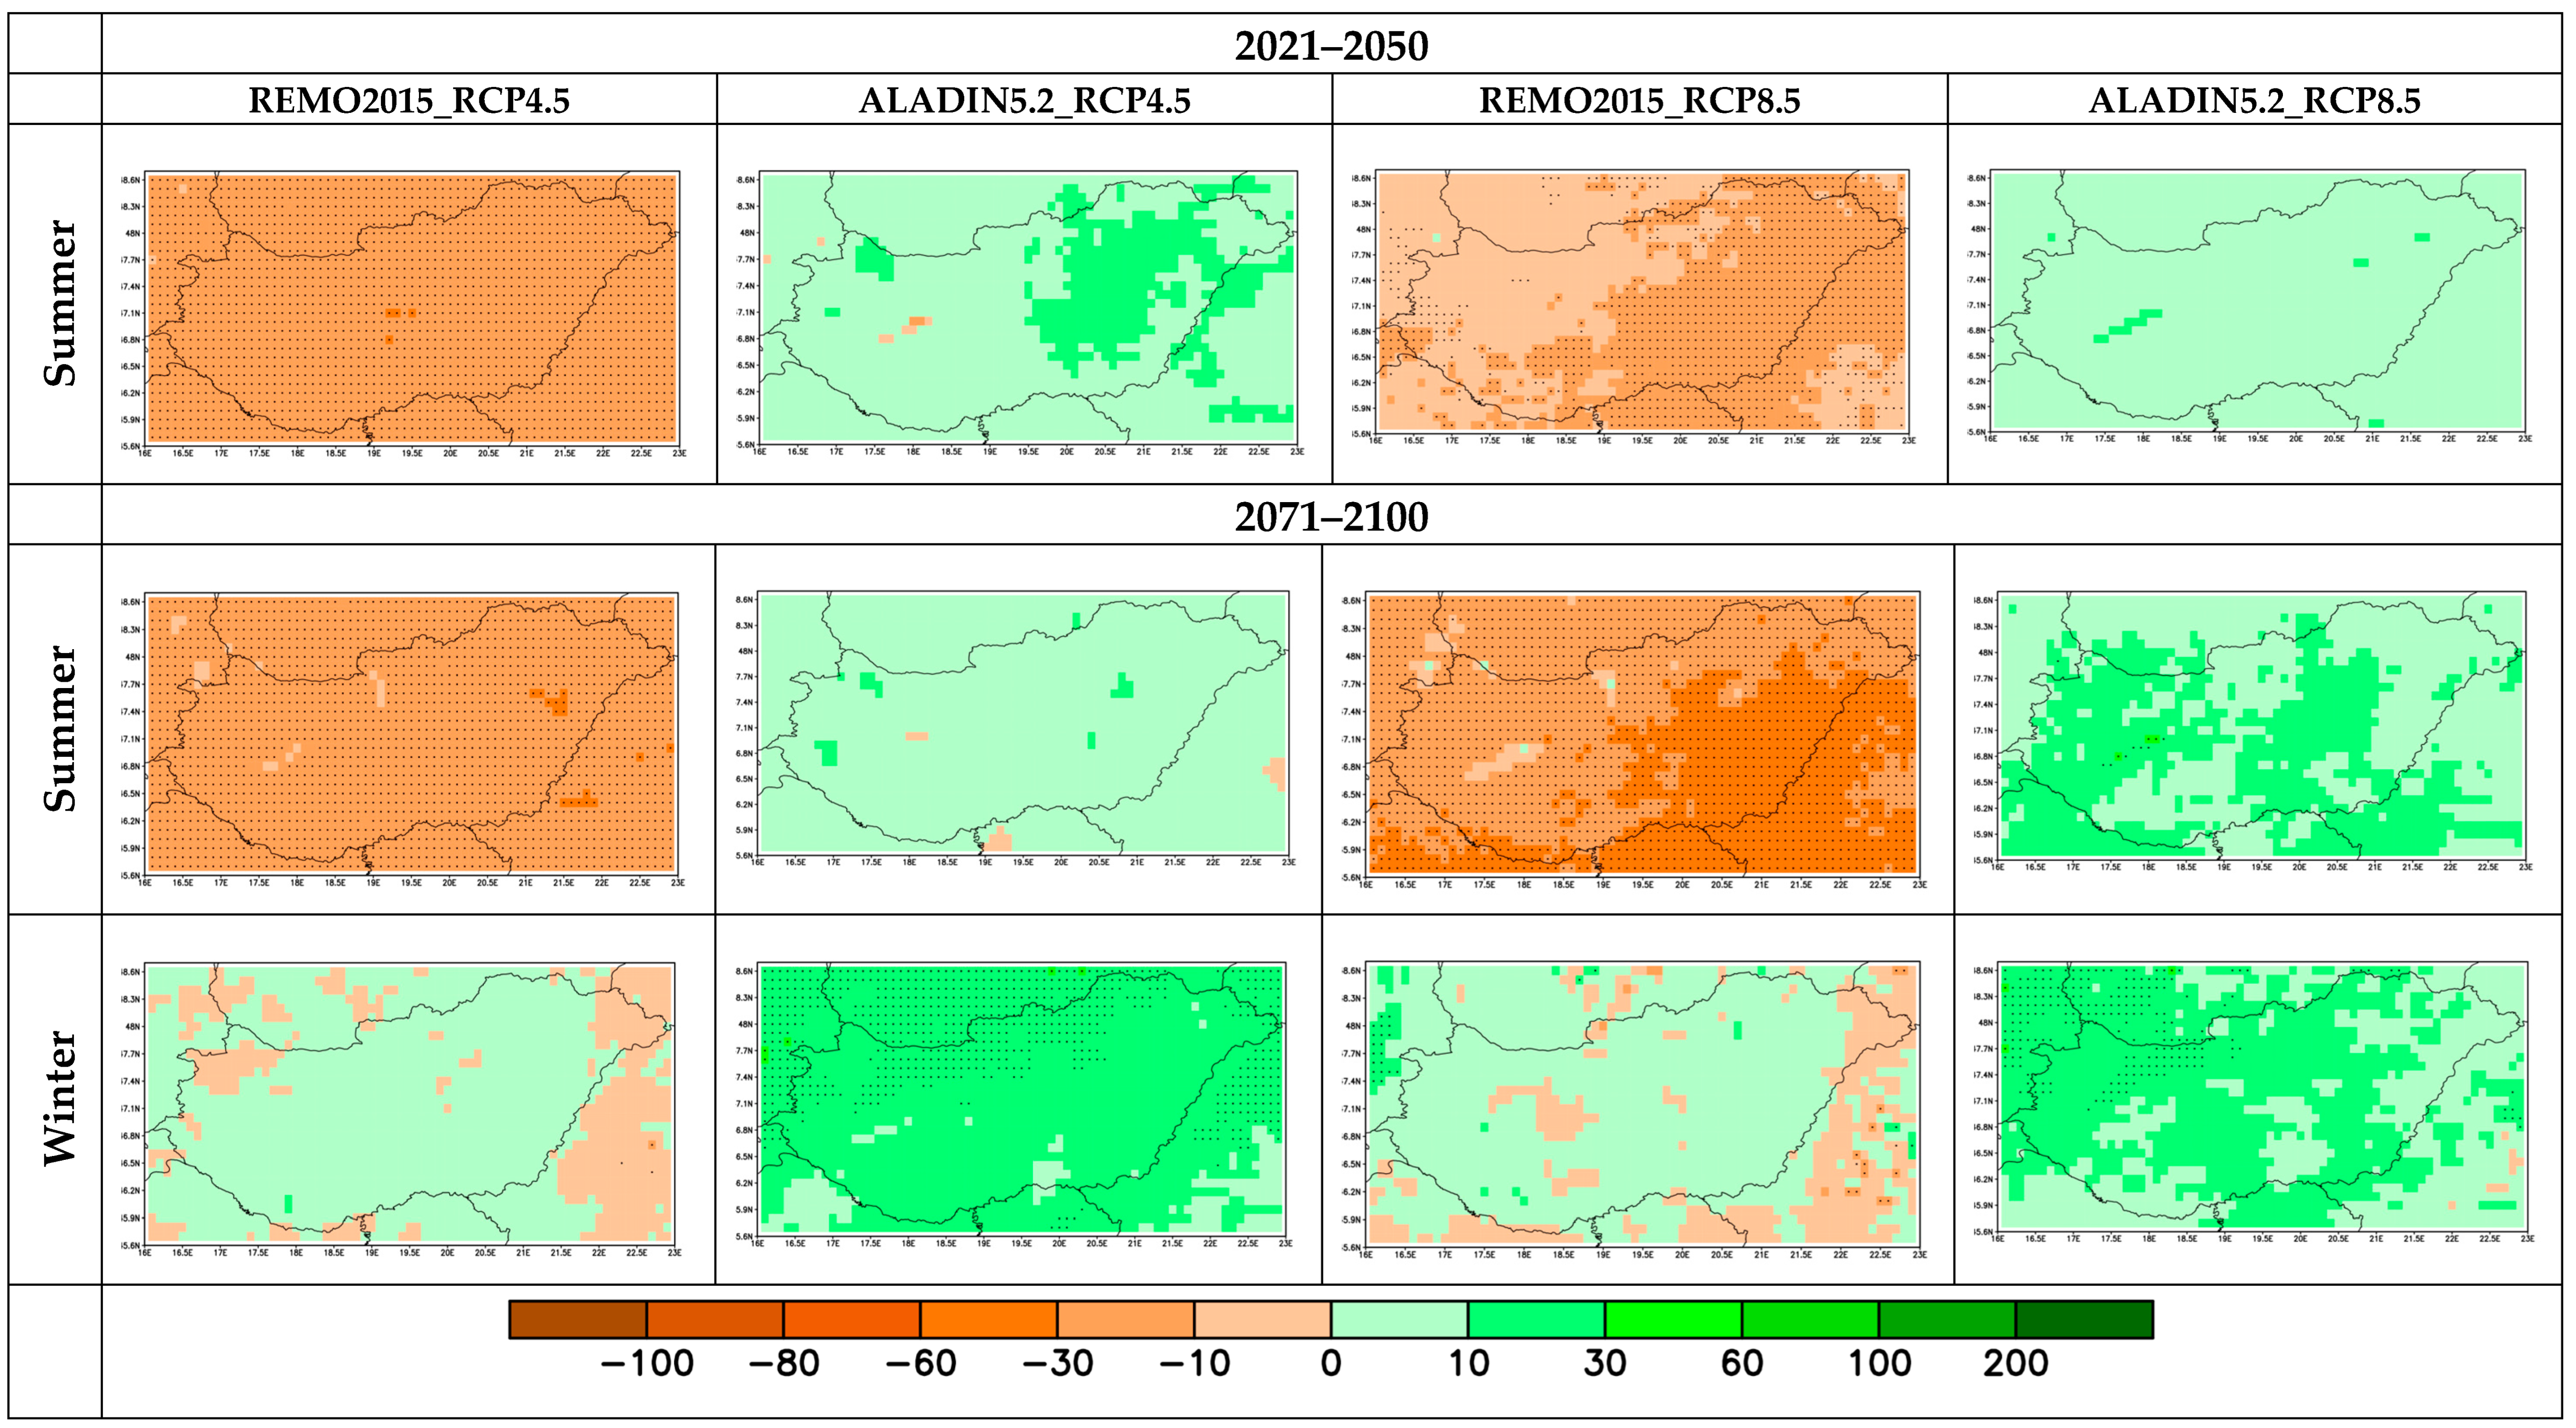
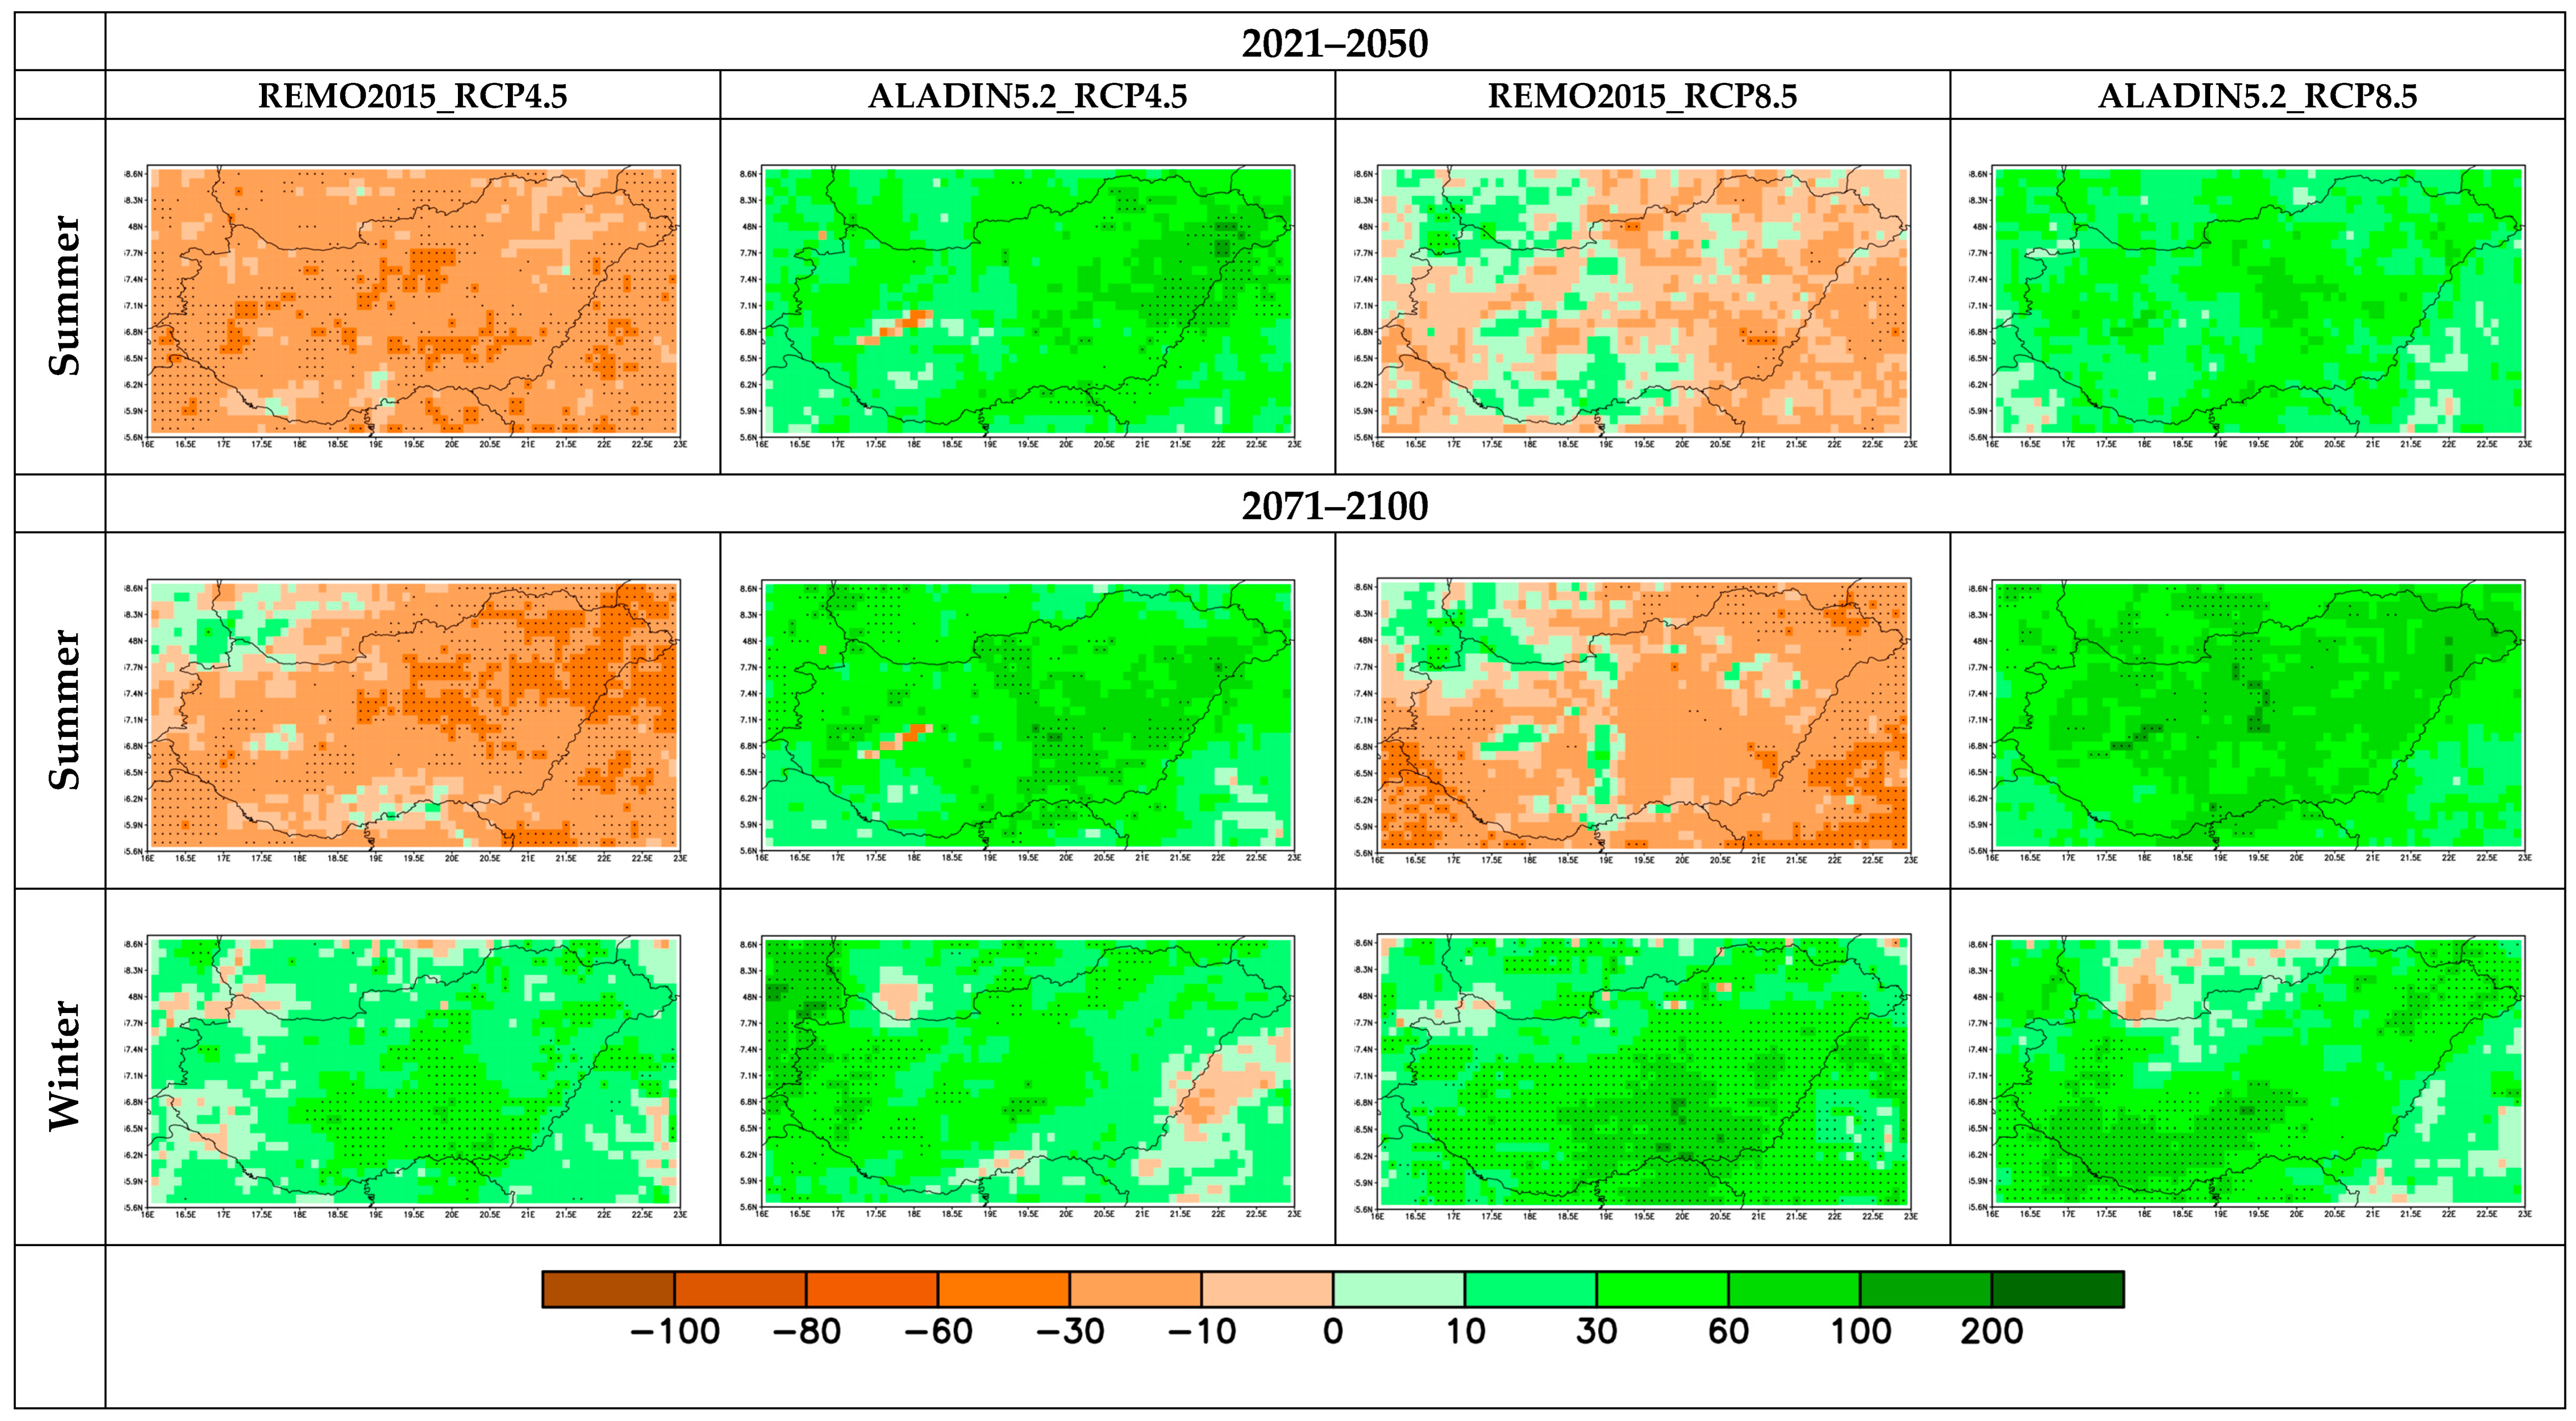
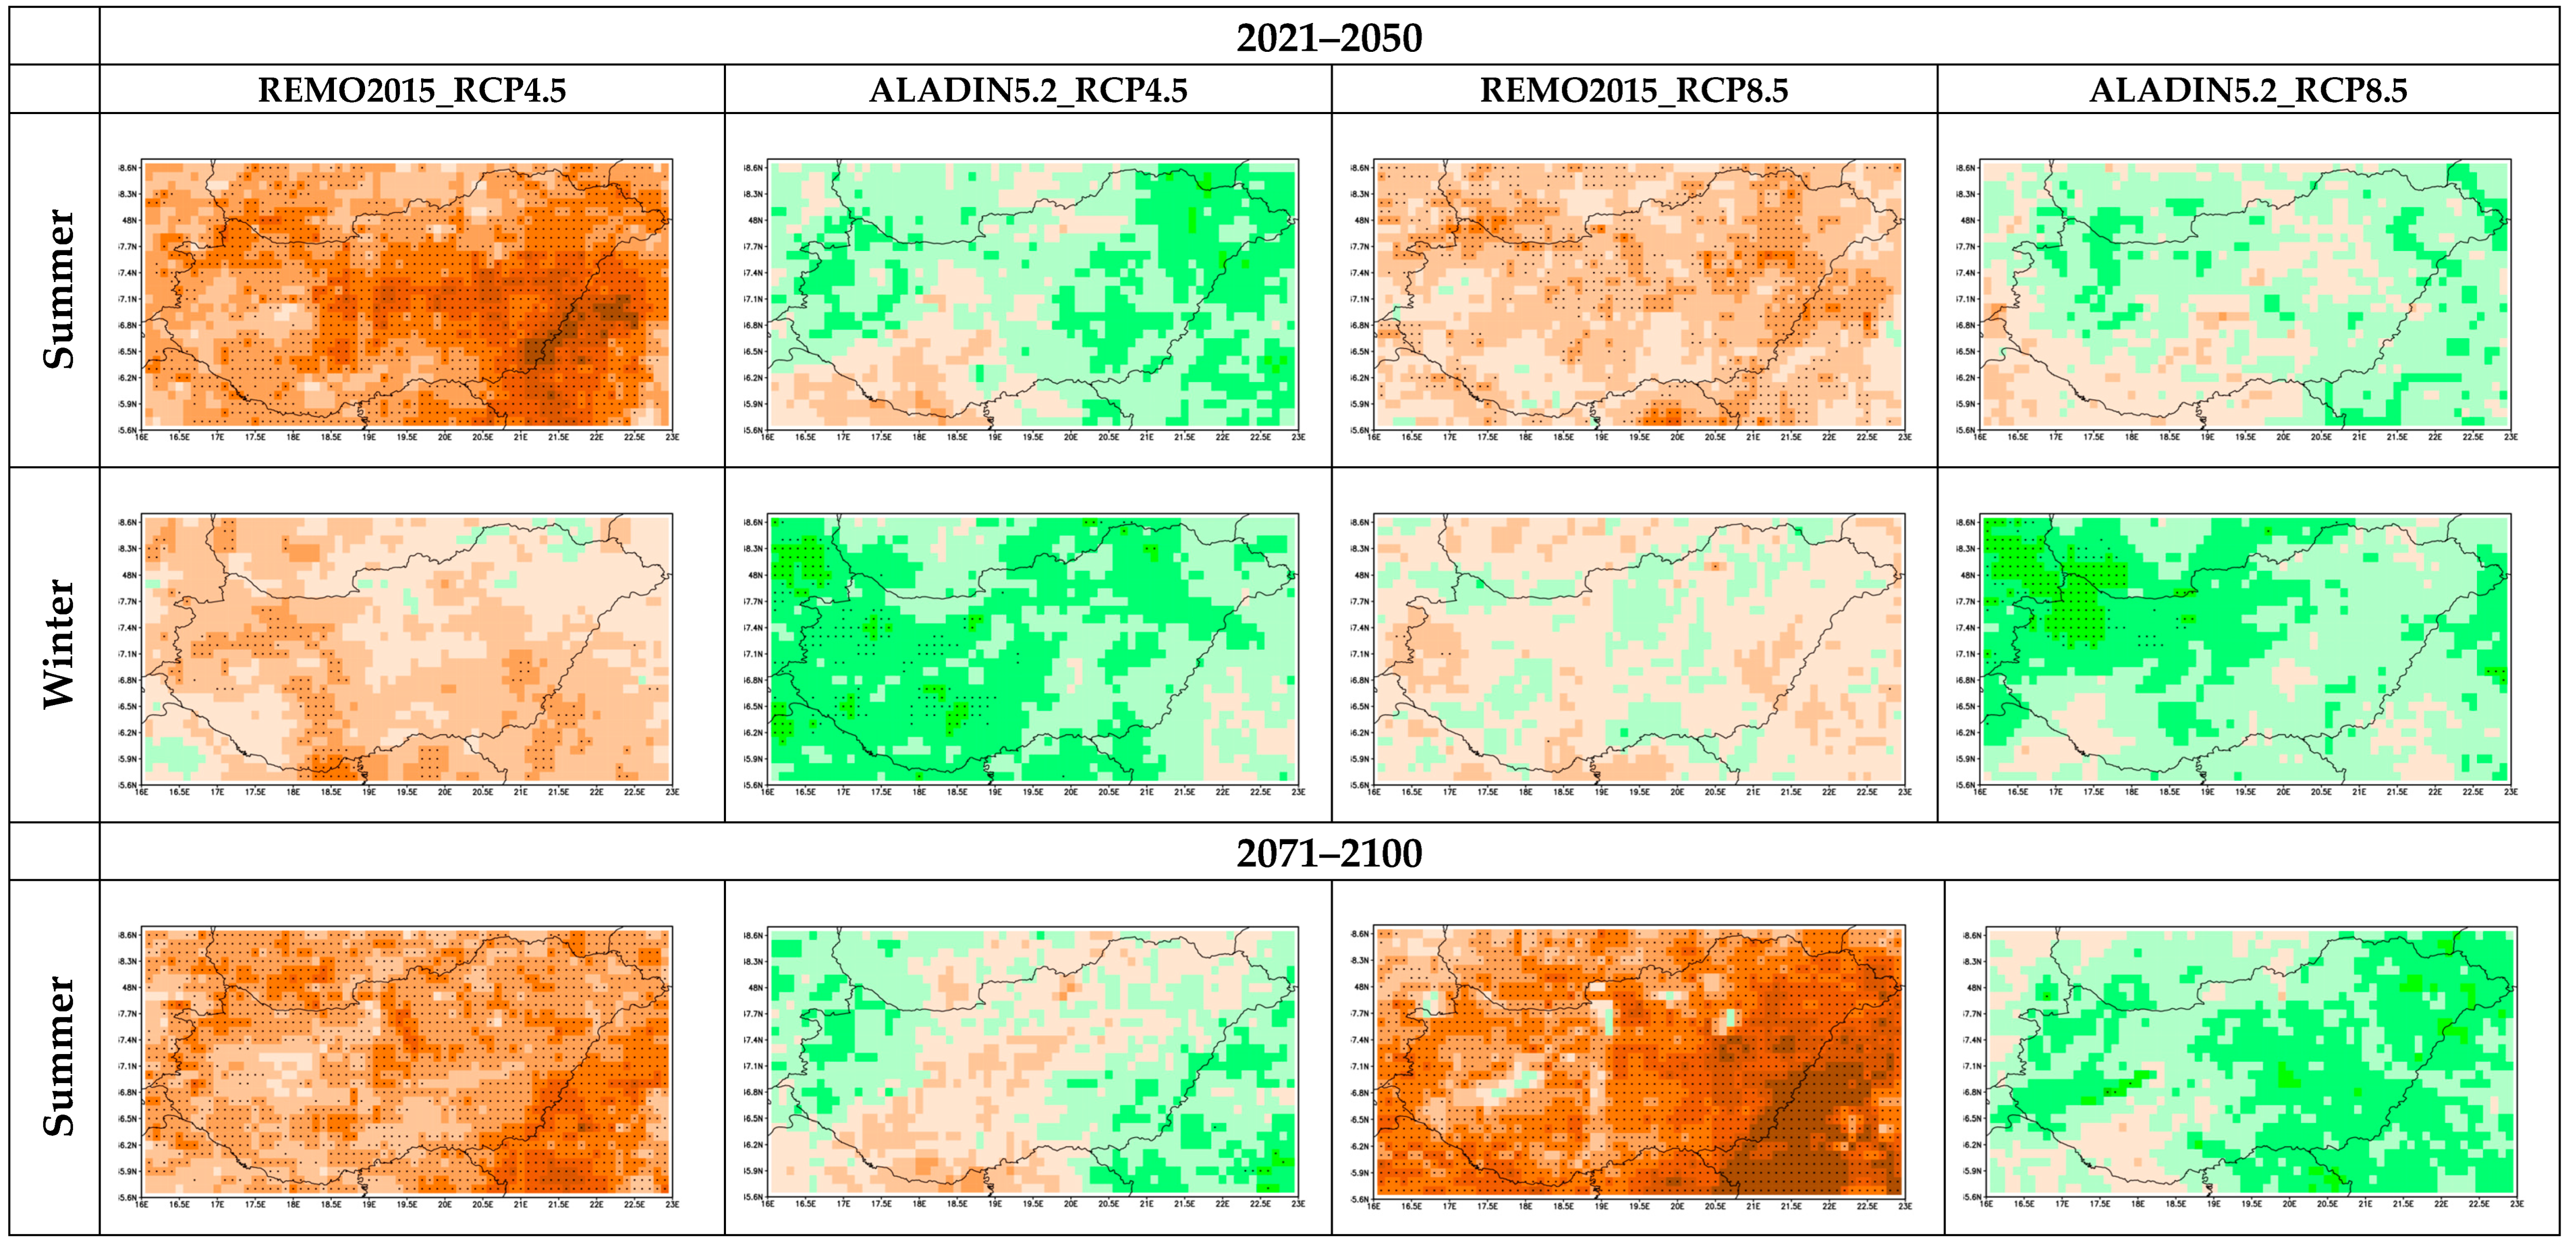
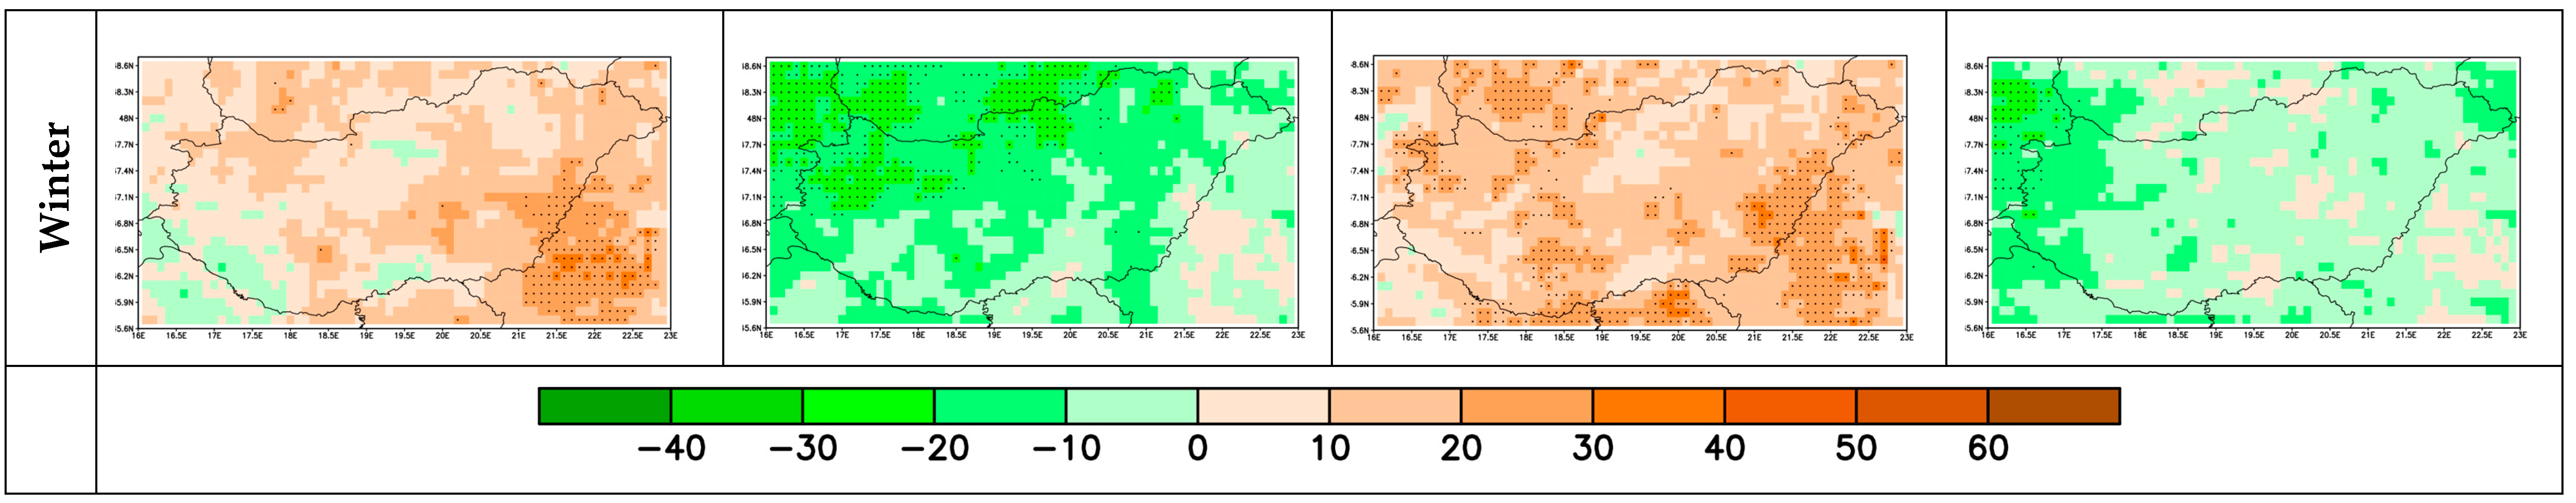
3.2.2. Precipitation

In general, an increasing trend was seen for annual and seasonal mean precipitation, except in summer (Figure 18). The simulations conducted with the same model but different scenarios did not show clear differences in their results. However, the experiments achieved with the same scenarios but different models sometimes indicated divergent future pathways, especially for summer and winter. The smallest difference between the simulation results was for spring and for winter in the second part of the century. The chosen scenario affected the change in summer precipitation for both models and in autumn precipitation for ALADIN5.2, which showed a greater increase in precipitation under the RCP8.5 scenario. For autumn, ALADIN5.2_RCP4.5 agreed with the REMO2015 simulations, slowly increasing until 2050. The most uncertain results regarding the direction of the changes were in summer, when ALADIN5.2 showed an increase in precipitation and REMO2015 showed a decrease under both RCP scenarios.
If we look at January in Figure 19, REMO2015 slightly and ALADIN5.2 markedly projected an increasing occurrence of days with more than 20 mm of precipitation. In July, however, ALADIN5.2 showed a visible decrease in the number of days with over 20 mm of precipitation and an increase in the days with between 10 and 15 mm of precipitation.
There was high uncertainty in the direction of the change in consecutive dry days in summer and winter, which is in agreement with other studies [12,19]. The average changes were –1 to 5 days and –3 to 2 days, respectively, for summer and winter during the whole century. ALADIN projected a more humid climate in the summer and winter under both scenarios. In contrast, summer drying could be detected for the wet days, heavy precipitation days and consecutive dry days (Figure 20, Figure 21 and Figure 22) in the REMO2015 results, and these changes were significant for most grid points except for heavy precipitation days and for consecutive dry days in 2021–2050 under the RCP8.5 scenarios. For 2021–2050, the driest scenario was REMO2015_RCP4.5, which indicated 20–40% higher changes compared with REMO2015_RCP8.5. This seems to be strongly connected with the change in summer mean temperature (not shown), where the results of RCP4.5 were warmer for the next 30 years than the results of RCP8.5. Nevertheless, this reversed for 2071–2100, when REMO2015_RCP8.5 projected longer dry periods and fewer wet days.
Winter wet days and heavy precipitation days showed very similar changes in both periods investigated by the models; hence, only the results for 2071–2100 are presented on the maps. In the first part of the examined periods, an increase of 1–4 days in wet days was expected in spring and autumn (Figure 23) according to the ensemble, and the range widened to −2 to 5 days by 2071–2100. A decrease was suggested by REMO2015. For winter, we can see an average increase of 1–3 days in wet days in both periods (Figure 23), which was most definite for ALADIN5.2 (Figure 20), with 10–30% in 2021–2050 and 0–10% in 2071–2100. This change was significant in the northern part of Hungary and in the southeast by the end of the century with the ALADIN5.2_RCP8.5 simulation. Moreover, for the number of heavy precipitation days, both models suggested a 60–100% increase locally. For spring and autumn in 2021–2050, the direction of the change was not unequivocal. The increase in consecutive dry days in winter for the REMO2015 simulations, together with the increase in wet days and heavy precipitation days, suggested an uneven precipitation pattern.

4. Conclusions

In this article, we have presented the validation and projection results of four experiments performed with the ALADIN5.2 and REMO2015 regional climate models at a resolution of 10 km over Hungary. The main aim of the work was to analyze the temperature and precipitation indices and also to show the characteristics of mean temperature and precipitation. In order to understand the models’ behavior, assess their weaknesses and better interpret future projections, the models were first subjected to validation. In this step, four simulations (2 × 2, with each model and with boundary conditions from the outputs of reanalysis and GCMs) were evaluated for 1981–2000.
REMO2015 showed a slightly warmer and dryer past climate over Hungary, while ALADIN5.2 had the highest overestimation of temperature in summer. The occurrence of summer days, hot days and frost days was underestimated by REMO2015 resulting from a positive bias in the daily minimum temperature and a negative bias in the daily maximum temperature. The results of ALADIN5.2 varied with an overestimation of hot days and an underestimation of frost days.
For mean precipitation, the seasonal cycle was best represented by REMO2015 with the ERA-Interim boundary conditions. The MPI-driven REMO2015 underestimated the summer maximum and shifted the secondary maximum in November to October. The ALADIN5.2 simulations overestimated the precipitation, especially in spring and summer, which is in accordance with the findings of Krüzselyi et al. [16]. The model simulations somewhat overestimated the number of wet days in spring and summer, while ALADIN5.2 had a slight underestimation for autumn and winter. Consecutive dry days and wet days in winter had a bias in both models but opposite effects. Days of heavy precipitation were underestimated by ALADIN5.2.
According to the model ensemble, the annual number of summer days on average over Hungary is likely to increase by 2–18 days in 2021–2050 and by 14–36 days by the end of the century. The number of hot days will increase by 3–8 days in 2021–2050 and 6–27 days in 2071–2100. The highest values are expected in the south-southeast part of Hungary, mostly in the area of the Great Plain. This is true for the increasing number of tropical nights as well. Furthermore, the number of frost days was projected to decrease significantly: 30–50% (14–58 days on average) fewer frost days are expected, while extremely cold days might decrease by 70–90% according to three scenarios or increase by a few days over some area according to REMO2015_RCP4.5 scenario by 2071–2100.
The changes in the summer precipitation indices are uncertain. This contradicts a previous study [16], which suggested a significant decrease in summer based on simulations with a coarser resolution and SRES scenarios. The REMO2015 simulations still projected summer drying in the future, while ALADIN5.2 predicted more humid summers. For winter, both models suggest an increase in wet days and heavy precipitation days.
The relatively large differences in the models’ results are explained by how both the driving GCMs and the RCMs are built from different NWP models regarding their dynamics and apply different parameterization schemes in many subgrid-scale processes (e.g., convection, large-scale precipitation, microphysics). The fact that they can be considered as independent models is favorable for providing climate services, because this four-member RCM ensemble covers a large part of the uncertainties in climate change.
In the next few years, we are planning to involve the HARMONIE-Climate convection-permitting model in the investigations to obtain more detailed information about the patterns and indices of precipitation, which are highly desirable in climate change mitigation and adaptation plans. Non-hydrostatic kilometer-scale models are more able to describe precipitation events in terms of diurnal cycles, amount and intensity [62,63,64,65].
To better represent the uncertainties, we are also planning to compare our results with the recent Euro-CORDEX simulations. Although, for the results of ALADIN5.2, research has been conducted with such an ensemble [18], REMO2015 has not been part of this study.

Author Contributions

Conceptualization, O.A.M.-K. and G.S.; writing—original draft preparation, O.A.M.-K. and B.B. and R.S.; writing—review, supervision and editing, G.A.-Z. and G.S.; model runs, B.B., R.S. and O.A.M.-K.; data analysis, B.B., O.A.M.-K. and R.S.; visualization, O.A.M.-K., B.B. and R.S. All authors have read and agreed to the published version of the manuscript.

Funding

The research reported in this article was supported by the KlimAdat project implemented in the framework of the Environmental and Energy Efficiency Operative Program focusing on water management and climate adaptation planning, information technology and monitoring developments (KEHOP–1.1.0-15-2015-00001).

Institutional Review Board Statement

Not applicable.

Informed Consent Statement

Not applicable.

Data Availability Statement

The ALADIN5.2 and REMO2015 simulation data used in this study are stored locally at the Hungarian Meteorological Service and can be provided upon request. The CarpatClim-HU dataset is available at http://odp.met.hu.

Acknowledgments

The ALADIN5.2 model simulations were partially conducted in the framework of the RCMGiS project (entitled “New climate scenarios based on the change in radiative forcing over the Carpathian Basin”) supported by the European Economic Area Grants (EEA-C13-10). We acknowledge CarpatClim-HU for the gridded historical dataset based on in situ observations, and the World Climate Research Program’s Working Group on Regional Climate, and the Working Group on Coupled Modeling, the former coordinating body of CORDEX and the panel responsible for CMIP5. We also thank our colleagues at GERICS for help in adapting the REMO2015 model. Special thanks are due to Antoinette Alias (Centre National de Recherches Météorologiques, CNRM) for the technical support and guidance with the ALADIN model. The authors are grateful to Beatrix Kovácsné Izsák for her advice and support regarding the CarpatClim-HU data. We thank the Euro-CORDEX climate modeling groups for producing and making their model outputs and research available. The valuable remarks of the reviewers are gratefully acknowledged.

Conflicts of Interest

The authors declare no conflict of interest.

References

  1. Lakatos, M.; Bihari, Z.; Izsák, B.; Marton, A.; Szentes, O. Megfigyelt éghajlati változások Magyarországon (Observed climate change in Hungary). Légkör 2021, 66, 5–11, ISSN 0133-3666. [Google Scholar]
  2. Szolnoki-Tótiván, B. 2022 nyarának időjárása. (The weather of 2022 summer). Légkör 2022, 67, 169–174, ISSN 0133-3666. [Google Scholar]
  3. Lakatos, M.; Bihari, Z.; Szentimrey, T.; Spinoni, J.; Szalai, S. Analyses of temperature extremes in the Carpathian Region in the period 1961–2010. Időjárás 2016, 120, 41–51. [Google Scholar]
  4. Bokros, K.; Lakatos, M. Hőségperiódusok vizsgálata Magyarországon a XX. század elejétől napjainkig (Analysis of Hot Spells in Hungary from the Early 20th Century to the Present). Légkör 2022, 67, 130–140, ISSN 0133-3666. [Google Scholar] [CrossRef]
  5. Lakatos, M.; Bihari, Z.; Izsák, B.; Szentes, O. Globális és hazai éghajlati trendek, szélsőségek változása: 2020-as helyzetkép. (Global Trends and Climate Change in Hungary in 2020). Sci. Et Secur. 2021, 2, 164–171, ISSN 2732-2688. [Google Scholar]
  6. Christensen, J.H.; Hewitson, B.; Busuioc, A.; Chen, A.; Gao, X.; Held, I.; Jones, R.; Kolli, R.K.; Kwon, W.-T.; Laprise, R.; et al. Regional Climate Projections. In Climate Change 2007: The Physical Science Basis. Contribution of Working Group I to the Fourth Assessment Report of the Intergovernmental Panel on Climate Change; Solomon, S., Qin, D., Manning, M., Chen, Z., Marquis, M., Averyt, K., Tignor, M., Miller, H., Eds.; Cambridge University Press: Cambridge, UK; New York, NY, USA, 2007. [Google Scholar]
  7. Vautard, R.; Gobiet, A.; Sobolowski, S.; Kjellström, E.; Stegehuis, A.; Watkiss, P.; Mendlik, T.; Landgren, O.; Nikulin, G.; Teichmann, C.; et al. The European climate under a 2 °C global warming. Environ. Res. Lett. 2014, 9, 034006. [Google Scholar] [CrossRef]
  8. Christensen, J.H.; Christensen, O.B. A summary of the PRUDENCE model projections of changes in European climate by the end of this century. Clim. Chang. 2007, 81 (Suppl. S1), 7–30. [Google Scholar] [CrossRef]
  9. Giorgi, F.; Coppola, E. The European Climate-Change Oscillation (ECO). Geophys. Res. Lett. 2007, 34, L217003. [Google Scholar] [CrossRef]
  10. Jacob, D.; Petersen, J.; Eggert, B.; Alias, A.; Christensen, O.B.; Bouwer, L.M.; Braun, A.; Colette, A.; Déqué, M.; Georgievski, G.; et al. EURO-CORDEX: New high-resolution climate change projections for European impact research. Reg. Environ. Chang. 2014, 14, 563–578. [Google Scholar] [CrossRef]
  11. Kjellström, E.; Nikulin, G.; Strandberg, G.; Christensen, O.B.; Jacob, D.; Keuler, K.; Lenderink, G.; van Meijgaard, E.; Schär, C.; Somot, S.; et al. European climate change at global mean temperature increases of 1.5 and 2 °C above pre-industrial conditions as simulated by the EURO-CORDEX regional climate models. Earth Syst. Dyn. 2018, 9, 459–478. [Google Scholar] [CrossRef] [Green Version]
  12. Coppola, E.; Nogherotto, R.; Ciarlò, J.M.; Giorgi, F.; van Meijgaard, E.; Kadygrov, N.; Iles, C.; Corre, L.; Sandstad, M.; Somot, S.; et al. Assessment of the European Climate Projections as Simulated by the Large EURO-CORDEX Regional and Global Climate Model Ensemble. J. Geophys. Res. Atmos. 2021, 126, e2019JD032356. [Google Scholar] [CrossRef]
  13. Rajczak, J.; Schär, C. Projections of future precipitation extremes over Europe: A multimodel assessment of climate simulations. J. Geophys. Res. Atmos. 2017, 122, 10–773. [Google Scholar] [CrossRef]
  14. Szabó, P.; Szépszó, G. Quantifying sources of uncertainty in temperature and precipitation projections over Central Europe. In Mathematical Problems in Meteorological Modelling; Bátkai, A., Csomós, P., Faragó, I., Horányi, A., Szépszó, G., Eds.; Springer International Publishing: Berlin/Heidelberg, Germany, 2016; pp. 207–237. [Google Scholar]
  15. Szabó, P. Sources of uncertainties: Added value of the evolution of climate model simulations over Central Europe? In Proceedings of the Annual Meeting of the European Meteorological Society (EMS)/European Conference for Applied Meteorology and Climatology, Budapest, Hungary, 3–7 September 2018. [Google Scholar]
  16. Krüzselyi, I.; Bartholy, J.; Horányi, A.; Pieczka, I.; Pongrácz, R.; Szabó, P.; Szépszó, G.; Torma, C. The future climate characteristics of the Carpathian Basin based on a regional climate model mini-ensemble. Adv. Sci. Res. 2011, 6, 69–73. [Google Scholar] [CrossRef] [Green Version]
  17. Nakicenovic, N.; Alcamo, J.; Davis, G.; de Vries, B.; Fenhann, J.; Gaffin, S.; Gregory, K.; Grübler, A.; Jung, T.Y.; Kram, T.; et al. IPCC Special Report on Emission Scenarios; Cambridge University Press: Cambridge, UK, 2000. [Google Scholar]
  18. Bán, B.; Szépszó, G.; Allaga-Zsebeházi, G.; Somot, S. ALADIN-Climate at the Hungarian Meteorological Service: From the beginnings to the present day’s results. Időjárás 2021, 125, 647–673. [Google Scholar] [CrossRef]
  19. Jacob, D.; Teichmann, C.; Sobolowski, S.; Katragkou, E.; Anders, I.; Belda, M.; Benestad, R.; Boberg, F.; Buonomo, E.; Cardoso, R.M.; et al. Regional climate downscaling over Europe: Perspectives from the EURO-CORDEX community. Reg. Environ. Chang. 2020, 20, 1–20. [Google Scholar] [CrossRef]
  20. Colin, J.; Déqué, M.; Radu, R.; Somot, S. Sensitivity study of heavy precipitations in Limited Area Model climate simulation: Influence of the size of the domain and the use of the spectral nudging technique. Tellus-A 2010, 62, 591–604. [Google Scholar] [CrossRef] [Green Version]
  21. Tegen, I.; Hollrig, P.; Chin, M.; Fung, I.; Jacob, D.; Penner, J. Contribution of different aerosol species to the global aerosol extinction optical thickness: Estimates from model results. J. Geophys. Res. 1997, 102, 23895–23915. [Google Scholar] [CrossRef]
  22. Szopa, S.; Balkanski, Y.; Schulz, M.; Bekki, S.; Cugnet, D.; Fortems-Cheiney, A.; Turquety, S.; Cozic, A.; Déandreis, C.; Hauglustaine, D.; et al. Aerosol and ozone changes as forcing for climate evolution between 1850 and 2100. Clim. Dyn. 2013, 40, 2223–2250. [Google Scholar] [CrossRef] [Green Version]
  23. Jacob, D.; Podzun, R. Sensitivity studies with the regional climate model REMO. Meteor. Atmos. Phys. 1997, 63, 119–129. [Google Scholar] [CrossRef]
  24. Jacob, D.; Bärring, L.; Christensen, O.B.; Christensen, J.H.; Castro, M.D.; Déqué, M.; Giorgi, F.; Hagemann, S.; Hirschi, M.; Jones, R.; et al. An inter-comparison of regional climate models for Europe: Model performance in present-day climate. Clim. Chang. 2007, 81, 31–52. [Google Scholar] [CrossRef]
  25. Majewski, D. The Europa Modell of the Deutscher Wetterdienst. In ECMWF Seminar of Numerical Methods in Atmospheric Models II; ECMWF: Reading, UK, 1991; pp. 147–191. [Google Scholar]
  26. Roeckner, E.; Arpe, K.; Bengtsson, L.; Christoph, M.; Claussen, M.; Dümenil, L.; Esch, M.; Giorgetta, M.; Schlese, U.; and Schulzweida, U. The Atmospheric General Circulation Model ECHAM-4: MODEL Description and Simulation of Present-Day Climate; Report No. 1996, 18; Max Planck Institute for Meteorology: Hamburg, Germany, 1996. [Google Scholar]
  27. Arakawa, A.; Lamb, V. Computational design and the basic dynamical processes of the UCLA general circulation Model. Methods Comput. Phys. 1977, 17, 173–265. [Google Scholar]
  28. Tanré, D.; Geleyn, J.F.; Slingo, J. First results of the introduction of an advanced aerosol-radiation interaction in the ECMWF low resolution global model. In Aerosol and Their Climatic Effects; Gerber, H.E., Deepak, A., Hampton, V., Eds.; Deepak Pub: Hampton, VA, USA, 1984; pp. 133–177. [Google Scholar]
  29. Suga, R.; Megyeri-Korotaj, O.A.; Allaga-Zsebeházi, G. Sensitivity study of the REMO regional climate model to domain size. Adv. Sci. Res. 2021, 18, 157–167. [Google Scholar] [CrossRef]
  30. Davies, H.C. A lateral boundary formulation for multi-level prediction models. Q. J. R. Meteorol. Soc. 1976, 102, 405–418. [Google Scholar]
  31. Fouquart, Y.; Bonnel, B. Computations of solar heating of the Earth’s atmosphere: A new parameterization. Contrib. Atmos. Phys. 1980, 53, 35–62. [Google Scholar]
  32. Mlawer, E.J.; Taubman, S.J.; Brown, P.D.; Iacono, M.J.; Clough, S.A. Radiative transfer for inhomogeneous atmospheres: RRTM, a validated correlated-k model for the longwave. J. Geophys. Res. 1997, 102D, 16663–16682. [Google Scholar] [CrossRef] [Green Version]
  33. Morcrette, J.-J. Description of the Radiation Scheme in the ECMWF Model; European Centre for Medium-Range Weather Forecasts: Reading, UK, 1989. [Google Scholar] [CrossRef]
  34. Masson, V.; Le Moigne, P.; Martin, E.; Faroux, S.; Alias, A.; Alkama, R.; Belamari, S.; Barbu, A.; Boone, A.; Bouyssel, F.; et al. The SURFEXv7.2 land and ocean surface platform for coupled or offline simulation of earth surface variables and fluxes. Geosci. Model Dev. 2013, 6, 929–960. [Google Scholar] [CrossRef] [Green Version]
  35. Noilhan, J.; Mahfouf, J.-F. The ISBA land surface parameterisation scheme. Glob. Planet. Chang. 1996, 13, 145–159, ISSN 0921-8181. [Google Scholar] [CrossRef]
  36. Charnock, H. Wind stress on a water surface. Q. J. R. Meteorol. Soc. 1955, 81, 639–640. [Google Scholar] [CrossRef]
  37. Monin, A.S.; Obukhov, A.M. Basic laws of turbulent mixing in the surface layer of the atmosphere. Contrib. Geophys. Inst. Acad. Sci. USSR 1954, 151, e187. [Google Scholar]
  38. Smith, R.N.B. A scheme for predicting layer clouds and their water content in a general circulation model. Q. J. R. Meteorol. Soc. 1990, 116, 435–460. [Google Scholar] [CrossRef]
  39. Sundqvist, H. A parameterization scheme for non-convective condensation including prediction of cloud water content. Q. J. R. Meteorol. Soc. 1978, 104, 677–690. [Google Scholar] [CrossRef]
  40. Ricard, J.L.; Royer, J.F. A statistical cloud scheme for use in an AGCM. Ann. Geophys. 1993, 11, 1095–1115. [Google Scholar]
  41. Lohmann, U.; Roeckner, E. Design and performance of a new cloud microphysics scheme developed for the ECHAM general circulation model. Clim. Dyn. 1996, 12, 557–572. [Google Scholar] [CrossRef]
  42. Bougeault, P. A simple parameterization of the large-scale effects of cumulus convection. Mon. Weather. Rev. 1985, 113, 2108–2121. [Google Scholar] [CrossRef]
  43. Tiedtke, M. A comprehensive mass flux scheme for cumulus parameterization in large-scale models. Mon. Weather. Rev. 1989, 117, 1779–1800. [Google Scholar] [CrossRef]
  44. Boros-Törék, O.; Krüzselyi, I.; Szépszó, G. Sensitivity study on the integration domain size with ALADIN-Climate RCM. Geophys. Res. Abstr. 2015, 17, EGU2015-6163-3. [Google Scholar]
  45. Dee, D.P.; Uppala, S.M.; Simmons, A.J.; Berrisford, P.; Poli, P.; Kobayashi, S.; Andrae, U.; Balmaseda, M.A.; Balsamo, G.; Bauer, P.; et al. The ERA-Interim reanalysis: Configuration and performance of the data assimilation system. Q. J. R. Meteorol. Soc. 2011, 137, 553–597. [Google Scholar] [CrossRef]
  46. Voldoire, A.; Sanchez-Gomez, E.; Salas y Mélia, D.; Decharme, B.; Cassou, C.; Sénési, S.; Valcke, S.; Beau, I.; Alias, A.; Chevallier, M.; et al. The CNRM-CM5.1 Global Climate Model: Description and Basic Evaluation. Clim. Dyn. 2013, 40, 2091–2121. [Google Scholar] [CrossRef] [Green Version]
  47. Giorgetta, M.A.; Jungclaus, J.; Reick, C.H.; Legutke, S.; Bader, J.; Böttinger, M.; Brovkin, V.; Crueger, T.; Esch, M.; Fieg, K.; et al. Climate and carbon cycle changes from 1850 to 2100 in MPI-ESM simulations for the Coupled Model Intercomparison Project phase 5. J. Adv. Model. Earth Syst. 2013, 5, 572–597. [Google Scholar] [CrossRef]
  48. Teichmann, C.; Eggert, B.; Elizalde, A.; Haensler, A.; Jacob, D.; Kumar, P.; Moseley, C.; Pfeifer, S.; Rechid, D.; Remedio, A.R.; et al. How Does a Regional Climate Model Modify the Projected Climate Change Signal of the Driving GCM: A Study over Different CORDEX Regions Using REMO. Atmosphere 2013, 4, 214–236. [Google Scholar] [CrossRef] [Green Version]
  49. Moss, R.H.; Edmonds, J.A.; Hibbard, K.A.; Manning, M.R.; Rose, S.K.; van Vuuren, D.P.; Carter, T.R.; Emori, S.; Kainuma, M.; Kram, T.; et al. The next generation of scenarios for climate change research and assessment. Nature 2010, 463, 747–756. [Google Scholar] [CrossRef] [PubMed]
  50. Bihari, Z.; Lakatos, M.; Szentimrey, T. Felszíni megfigyelésekből készített rácsponti adatbázisok az Országos Meteorológiai Szolgálatnál (Gridded data series prepared from surface observation at Hungarian Meteorological Service). Légkör 2017, 62, 148–151. [Google Scholar]
  51. Szentimrey, T. Development of MASH homogenization procedure for daily data. In Proceedings of the Fifth Seminar for Homogenization and Quality Control in Climatological Databases, Budapest, Hungary, 29 May–2 June 2006; WCDMP-No.71, WMO/TD-No. 1493. pp. 123–130. [Google Scholar]
  52. Szentimrey, T. Manual of homogenization software MASHv3.03. Hung. Meteorol. Serv. 2017, 71. [Google Scholar]
  53. Szentimrey, T.; Bihari, Z. Mathematical background of the spatial interpolation methods and the software MISH (Meteorological Interpolation based on Surface Homogenized Data Basis). In Proceedings of the Conference on Spatial Interpolation in Climatology and Meteorology, Budapest, Hungary, 11–15 January 2004; COST Action 719, COST Office. pp. 17–27. [Google Scholar]
  54. Szentimrey, T.; Bihari, Z. Manual of interpolation software MISHv1.03. Hung. Meteorol. Serv. 2014, 60. [Google Scholar]
  55. Hoffmann, L.; Izsák, B.; Lakatos, M. Comparison of different interpolation methods for Hungarian climatological data. EMS Annu. Meet. Abstr. 2018, 15, EMS2018-496. [Google Scholar]
  56. Taylor, K.E. Summarizing multiple aspects of model performance in a single diagram. J. Geophys. Res. Atmos. 2001, 106, 7183–7192. [Google Scholar] [CrossRef]
  57. Vautard, R.; Kadygrov, N.; Iles, C.; Boberg, F.; Buonomo, E.; Bülow, K.; Coppola, E.; Corre, L.; van Meijgaard, E.; Nogherotto, R.; et al. Evaluation of the large EURO-CORDEX regional climate model ensemble. J. Geophys. Res. Atmos. 2021, 126, e2019JD032344. [Google Scholar] [CrossRef]
  58. Rai, P.; Ziegler, K.; Abel, D.; Pollinger, F.; Paeth, H. Performance of a regional climate model with interactive vegetation (REMO-iMOVE) over Central Asia. Theor. Appl. Climatol. 2022, 150, 1385–1405. [Google Scholar] [CrossRef]
  59. Lucas-Picher, P.; Argüeso, D.; Brisson, E.; Tramblay, Y.; Berg, P.; Lemonsu, A.; Kotlarski, S.; Caillaud, C. Convection-permitting modeling with regional climate models: Latest developments and next steps. Wiley Interdiscip. Rev. Clim. Chang. 2021, 12, e731. [Google Scholar] [CrossRef]
  60. Berthou, S.; Kendon, E.J.; Chan, S.C.; Ban, N.; Leutwyler, D.; Schär, C.; Fosser, G. Pan-European climate at convection-permitting scale: A model intercomparison study. Clim. Dyn. 2020, 55, 35–59. [Google Scholar] [CrossRef] [Green Version]
  61. Boé, J.; Somot, S.; Corre, L.; Nabat, P. Large discrepancies in summer climate change over Europe as projected by global and regional climate models: Causes and consequences. Clim. Dyn. 2020, 54, 2981–3002. [Google Scholar] [CrossRef]
  62. Kendon, E.J.; Roberts, N.M.; Senior, C.A.; Roberts, M.J. Realism of rainfall in a very high-resolution regional climate model. J. Clim. 2012, 25, 5791–5806. [Google Scholar] [CrossRef]
  63. Kendon, E.J.; Ban, N.; Roberts, N.M.; Fowler, H.J.; Roberts, M.J.; Chan, S.C.; Evans, J.P.; Fosser, G.; Wilkinson, J.M. Do Convection-Permitting Regional Climate Models Improve Projections of Future Precipitation Change? Bull. Am. Meteorol. Soc. 2017, 98, 79–93, Retrieved 10 January 2023. [Google Scholar] [CrossRef] [Green Version]
  64. Prein, A.F.; Gobiet, A.; Suklitsch, M.; Truhetz, H.; Awan, N.K.; Keuler, K.; Georgievski, G. Added value of convection permitting seasonal simulations. Clim. Dyn. 2013, 41, 2655–2677. [Google Scholar] [CrossRef] [Green Version]
  65. Ban, N.; Schmidli, J.; Schär, C. Evaluation of the convection resolving regional climate modeling approach in decade-long simulations. J. Geophys. Res. Atmos. 2014, 119, 7889–7907. [Google Scholar] [CrossRef]
Figure 1. Integration domain and topography of the ALADIN5.2 (left) and REMO2015 (right) model simulations, both with a 10 km resolution.
Atmosphere 14 00448 g001
Figure 2. The flowchart of the research process.
Atmosphere 14 00448 g002
Figure 3. Taylor diagram for monthly mean temperature (circles) and precipitation (triangles) of four RCM simulations (colors) over Hungary for 1981–2000. Reference: CarpatClim-HU dataset (represented by an X).
Atmosphere 14 00448 g003
Figure 4. Monthly mean temperature in Hungary in 1981–2000 based on the CarpatClim-HU observation dataset and the four RCM simulations (ALADIN5.2_ERAI, ALADIN5.2_CNRM, REMO2015_ERAI and REMO2015_MPI).
Atmosphere 14 00448 g004
Figure 5. Annual mean values of summer days, hot days and frost days for 1981–2000 based on the CarpatClim-HU observation dataset (x-axis) and the RCM simulations (y-axis). Each dot represents the value of one grid point over Hungary.
Atmosphere 14 00448 g005
Figure 6. Monthly mean precipitation in Hungary in 1981–2000 based on the CarpatClim-HU observation dataset and the ALADIN5.2 and REMO2015 simulations.
Atmosphere 14 00448 g006
Figure 7. Mean values of consecutive dry days in summer and winter for 1981–2000 based on the CarpatClim-HU observation dataset (x-axis) and the RCM simulations (y-axis). Each dot represents the value of one grid point over Hungary.
Atmosphere 14 00448 g007
Figure 8. Mean values of (a) wet days and (b) heavy precipitation days in summer and winter for 1981–2000 based on the CarpatClim-HU observation dataset (x-axis) and the RCM simulations (y-axis). Each dot represents the value of one grid point over Hungary.
Atmosphere 14 00448 g008
Figure 9. Quantile–quantile plot of daily precipitation for 1981–2000 in Budapest and Szeged based on four RCM simulations and the CarpatClim-HU observation dataset.
Atmosphere 14 00448 g009
Figure 10. Temporal evolution of the change in the annual mean temperature over Hungary in 2000–2100 based on the ALADIN5.2 and REMO2015 simulations, smoothed with the moving average of a 30-year window. Reference period: 1971–2000.
Atmosphere 14 00448 g010
Figure 11. Range of the minimum and maximum changes (in days) in the mean annual number of summer days, hot days, frost days and extremely cold days over Hungary for 2021–2050 and 2071–2100 based on four RCM simulations. Reference period: 1971–2000.
Atmosphere 14 00448 g011
Figure 12. Change in the annual number of summer days (days) in Hungary for 2021–2050 and 2071–2100 based on the ALADIN5.2 and REMO2015 simulations. Reference period: 1971–2000.
Atmosphere 14 00448 g012
Figure 13. Change in the annual number of hot days (days) in Hungary for 2071–2100 based on the ALADIN5.2 and REMO2015 simulations. Reference period: 1971–2000.
Atmosphere 14 00448 g013
Figure 14. Change in the annual number of extremely hot days (days) in Hungary for 2071–2100 based on the ALADIN5.2 and REMO2015 simulations. Reference period: 1971–2000.
Atmosphere 14 00448 g014
Figure 15. Change in the annual number of tropical nights (days) in Hungary for 2021–2050 and 2071–2100 based on the ALADIN5.2 and REMO2015 simulations. Reference period: 1971–2000.
Atmosphere 14 00448 g015
Figure 16. Relative change in the annual number of frost days (days) in Hungary for 2021–2050 and 2071–2100 based on the ALADIN5.2 and REMO2015 simulations. Reference period: 1971–2000.
Atmosphere 14 00448 g016
Figure 17. Relative change in the annual number of extremely cold days (days) in Hungary for 2021–2050 and 2071–2100 based on the ALADIN5.2 and REMO2015 simulations. Reference period: 1971–2000.
Atmosphere 14 00448 g017
Figure 18. Temporal evolution of the changes in seasonal precipitation over Hungary in 2000–2100 based on the ALADIN5.2 and REMO2015 simulations, smoothed with the moving average of a 30-year window. Reference period: 1971–2000.
Atmosphere 14 00448 g018
Figure 19. Relative frequency of mean daily amounts of precipitation over Hungary in January and July based on the ALADIN5.2 and REMO2015 simulations for 1971–2000, 2021–2050 and 2071–2100.
Atmosphere 14 00448 g019aAtmosphere 14 00448 g019b
Figure 20. Relative change in the number of wet days (%) in summer for 2021–2050 and 2071–2100, and in winter for 2071–2100 in Hungary based on the ALADIN5.2 and REMO2015 simulations. Reference period: 1971–2000.
Atmosphere 14 00448 g020
Figure 21. Relative change in the number of heavy precipitation days (%) in summer for 2021–2050 and 2071–2100, and in winter for 2071–2100 in Hungary based on the ALADIN5.2 and REMO2015 simulations. Reference period: 1971–2000.
Atmosphere 14 00448 g021
Figure 22. Relative change in the number of consecutive dry days (%) in summer and winter in Hungary for 2021–2050 and 2071–2100 based on the ALADIN5.2 and REMO2015 simulations. Reference period: 1971–2000.
Atmosphere 14 00448 g022aAtmosphere 14 00448 g022b
Figure 23. Range between the minimum and maximum changes (in days) in the seasonal mean number of wet days, heavy precipitation days and consecutive dry days over Hungary for 2021–2050 and 2071–2100, based on four RCM simulations. Reference period: 1971–2000.
Atmosphere 14 00448 g023
Table 1. Main features of the ALADIN5.2 and REMO2015 regional climate models.
ALADIN5.2REMO2015
Initial modelsDynamics:
ALADIN NWP model
Dynamics:
Europa Model
Parameterization:
ARPEGE-Climat AGCM
Parameterization:
ECHAM4 AGCM
Dynamics
Handling of horizontal derivativesSpectral methodFinite-difference method
Vertical coordinate systemTerrain-following pressure hybrid
Description of vertical accelerationHydrostatic approach
Prognostic variablesHorizontal wind speed components,
surface air pressure,
temperature,
specific humidity
Horizontal wind speed components,
surface air pressure,
temperature,
specific humidity,
cloud water content
Temporal schemesCombination of semi-implicit and semi-Lagrangian schemesLeapfrog scheme with semi-implicit correction and an Asselin filter
Lateral boundary treatmentDavies [30]
Physical parameterization
RadiationShortwave:
Fouquart and Bonnel [31]
Longwave:
Mlawer et al. [32]
Shortwave:
Fouquart and Bonnel [31]
Longwave: Morcrette [33]
Land surface modelTiling method according to SURFEX [34]: proportion of 3 surface types (nature, sea/ocean and lakes) within a grid cell.
3 soil layers
Tiling method: relative proportion of 3 surface types (land, water and ice) within a grid cell.
5 soil layers
Vertical diffusion and turbulent fluxesAbove natural surfaces: ISBA scheme [35]
Above water surfaces: Charnock formula [36]
Monin and Obukhov [37]
Large-scale precipitationSmith [38]Sundqvist [39]
MicrophysicsRicard and Royer [40]Lohmann and
Roeckner [41]
ConvectionBougeault [42]Tiedtke [43]
Table 2. Characteristics of the model experiments.
ModelALADIN5.2ALADIN5.2REMO2015REMO2015
Lateral boundary conditionERA-InterimCNRM-CM5
ALADIN5.2
ERA-InterimMPI-ESM-LR
REMO2015
Horizontal resolution0.12°~10 km0.09°~10 km
Map projectionLambert conformal conicRotated spherical
Vertical levels3127
Timestep (seconds)3603606060
Evaluation simulations
Integration period1980–20001950–20051980–20001950–2005
Projection simulations
Integration period-2006–2100-2006–2100
Scenarios-RCP4.5
RCP8.5
-RCP4.5
RCP8.5
Table 3. Calculated climate indices.
Climate IndexDefinitionValidationProjection
Summer daysTmax > 25 °CXX
Hot daysTmax ≥ 30 °CXX
Extremely hot daysTmax ≥ 35 °C X
Tropical nightsTmin > 20 °C X
Frost daysTmin < 0 °CXX
Extremely cold daysTmin < −10 °C X
Wet daysRday ≥ 1 mmXX
Heavy precipitation daysRday ≥ 10 mmXX
Consecutive dry daysThe longest number of consecutive days when Rday < 1 mmXX
Table 4. Seasonal and annual temperature bias (°C) of the four model simulations over Hungary in comparison with the CARPATCLIM-HU observation dataset. Period: 1981–2000.
Model SimulationMAMJJASONDJFAnnual
ALADIN5.2_ERAI−1.50.9−1.1−0.7−0.6
ALADIN5.2_CNRM−2.02.5−1.1−1.9−0.6
REMO2015_ERAI0.80.71.00.70.8
REMO2015_MPI0.801.12.10.9
Table 5. Annual minimum and maximum temperature bias (°C) of the four RCM simulations over Hungary in comparison with the CarpatClim-HU observation dataset. Period: 1981–2000.
Model SimulationTminTmax
ALADIN5.2_ERAI−0.30.5
ALADIN5.2_CNRM−0.51.1
REMO2015_ERAI3.9−2.8
REMO2015_MPI4.7−3.2
Table 6. Relative bias of seasonal and annual precipitation (%) of the four model simulations over Hungary in comparison with the CarpatClim-HU observation dataset. Period: 1981–2000.
Model SimulationMAMJJASONDJFAnnual
ALADIN5.2_ERAI59272.30.522
ALADIN5.2_CNRM39128.79.19.0
REMO2015_ERAI183.3−3.434.9
REMO2015_MPI19−0.3−14225.1
Disclaimer/Publisher’s Note: The statements, opinions and data contained in all publications are solely those of the individual author(s) and contributor(s) and not of MDPI and/or the editor(s). MDPI and/or the editor(s) disclaim responsibility for any injury to people or property resulting from any ideas, methods, instructions or products referred to in the content.

