
Prediction of the SO2 Hourly Concentration for Sea Breeze and Land Breeze in an Urban Area of Split Using Multiple Linear Regression


Abstract
1. Introduction
2. Methods
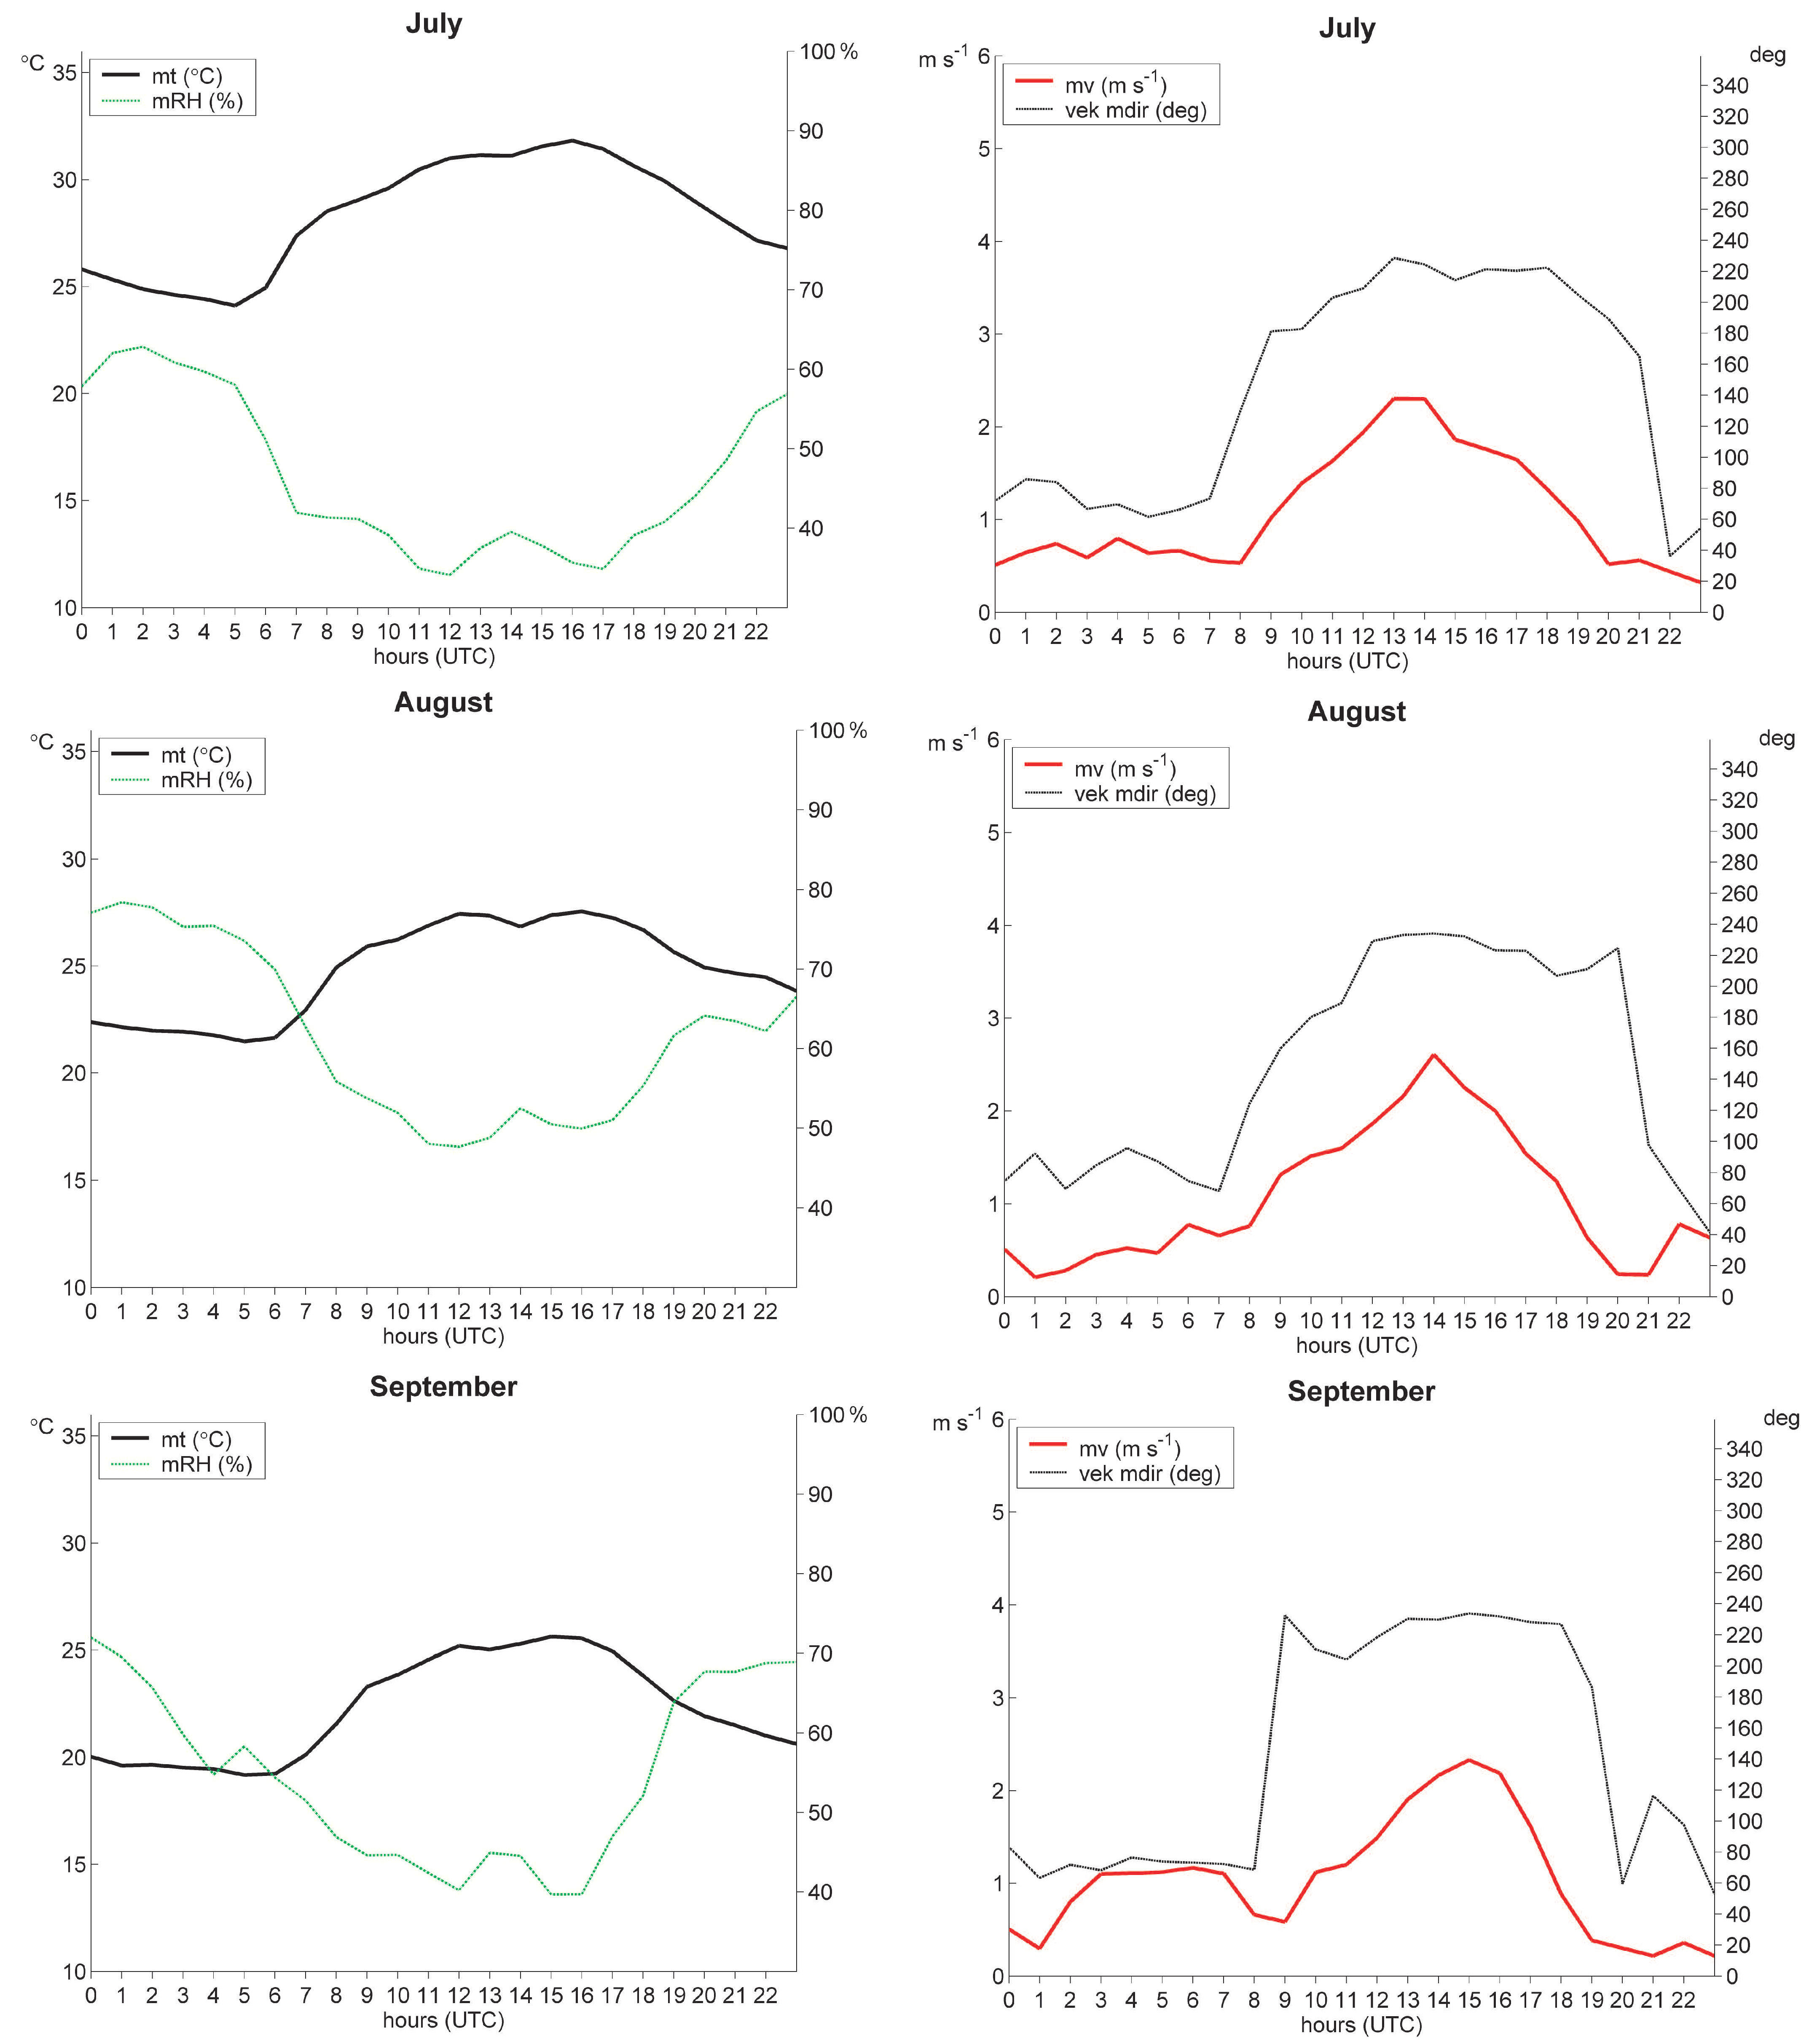
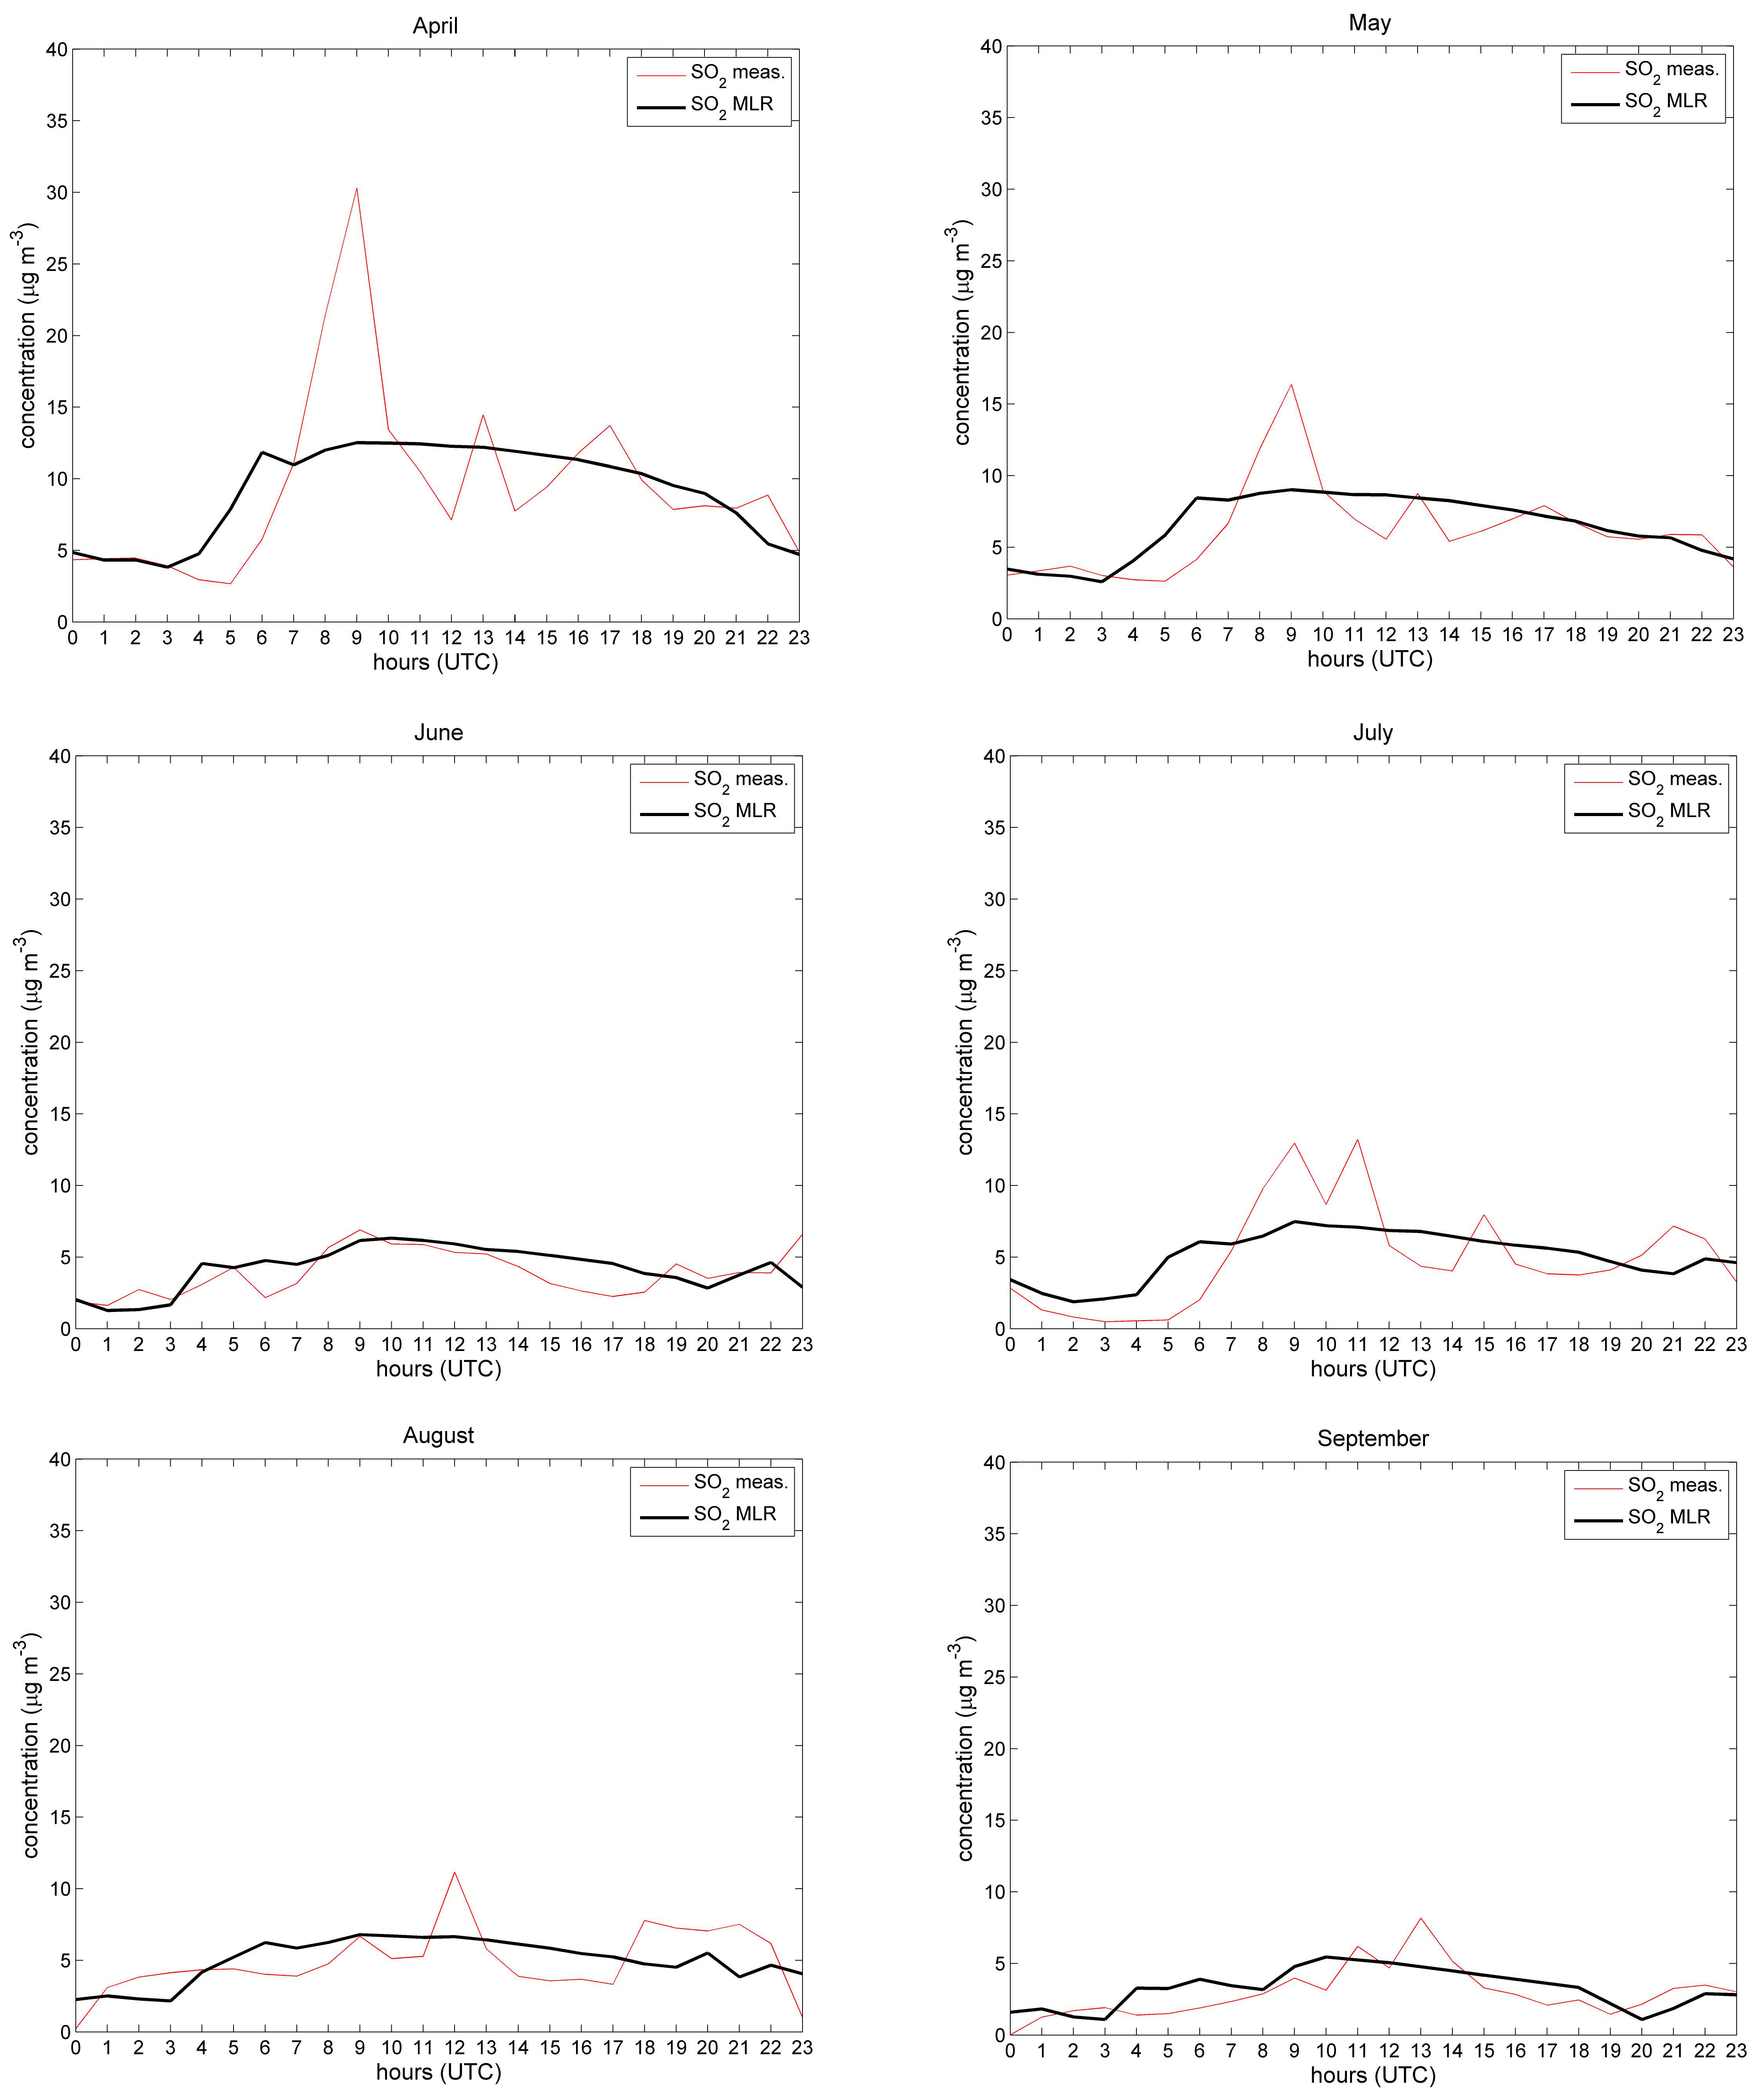
3. Results
4. Discussion
5. Conclusions
Author Contributions
Funding
Institutional Review Board Statement
Informed Consent Statement
Data Availability Statement
Acknowledgments
Conflicts of Interest
References
- Lyons, W.A.; Olsson, L.E. Detailed Mesometeorological Studies of Air Pollution Dispersion in the Chicago Lake Breeze. Mon. Weather. Rev. 1973, 101, 387–403. [Google Scholar] [CrossRef]
- Keen, C.S.; Lyons, W.A. Land/lake breeze circulations on the western shore of Lake Michigan. J. Appl. Meteorol. 1987, 17, 1843–1855. [Google Scholar] [CrossRef]
- Simpson, J. Sea Breeze and Local Wind; Cambridge University Press: Cambridge, UK, 1994. [Google Scholar]
- Clappier, A.; Martilli, A.; Grossi, P.; Thunis, P.; Pasi, F.; Krueger, B.C.; Calpini, B.; Graziani, G.; Van den Bergh, H. Effect of sea breeze on air pollution in the Greater Athens Area. Part I: Numerical simulations and field observations. J. Appl. Meteorol. 2000, 39, 546–562. [Google Scholar] [CrossRef]
- IPCC. Climate Change 2022. In Impacts, Adaptation and Vulnerability: Working Group II Contribution to the Sixth Assessment Report of the IPCC; 2022 Intergovernmental Panel on Climate Change: Geneva, Switzerland, 2022. [Google Scholar]
- Jacobson, M.Z. Atmospheric Pollution: History, Science, and Regulation; Cambridge University Press: Cambridge, UK, 2002. [Google Scholar]
- He, Y.; Uno, I.; Wang, Z.; Ohara, T.; Sugimoto, N.; Shimizu, A.; Richter, A.; Burrows, J.P. Variations of the increasing trend of tropospheric NO2 over central east China during the past decade. Atmos. Environ. 2007, 41, 4865–4876. [Google Scholar] [CrossRef]
- Shon, Z.-H.; Kim, K.-H.; Song, S.K. Long-term trend in NO2 and NOx levels and their emission ratio in relation to road traffic activities in East Asia. Atmos. Environ. 2011, 45, 3120–3131. [Google Scholar] [CrossRef]
- Li, J.; Li, K.; Zhang, H.; Zhang, X.; Ji, Y.; Chu, W.; Kong, Y.; Chu, Y.; Ren, Y.; Zhang, Y.; et al. Effects of OH radical and SO2 concentrations on photochemical reactions and mixed antrophogenic organic gases. Atmos. Chem. Phys. 2022, 22, 10489–10504. [Google Scholar] [CrossRef]
- Shah, A.S.V.; Lee, K.K.; McAllister, D.A.; Hunter, A.; Nair, H.; Whiteley, W.; Langrish, J.P.; Newby, D.E.; Mills, N.L. Short term exposure to air pollution and stroke: Systematic review and meta-analysis. BMJ 2015, 350, h1295. [Google Scholar] [CrossRef]
- Yang, W.-S.; Wang, X.; Deng, Q.; Fan, W.-Y.; Wang, W.-Y. An evidence-based appraisal of global association between air pollution and risk of stroke. Int. J. Cardiol. 2014, 175, 307–313. [Google Scholar] [CrossRef]
- Çapraz, Ö.; Bahtiyar, E.; Ali, D. Study on the association between air pollution and mortality in İstanbul, 2007–2012. Atmos. Poll. Res. 2016, 7, 147–154. [Google Scholar] [CrossRef]
- Wang, L.; Liu, C.; Meng, X.; Niu, Y.; Lin, Z.; Liu, Y.; Liu, J.; Qi, J.; You, J.; Tse, L.A.; et al. Associations between short-term exposure to ambient sulfur dioxide and increased cause-specific mortality in 272 Chinese cities. Environ. Int. 2018, 117, 33–39. [Google Scholar] [CrossRef]
- Yorifuji, T.; Kashima, S.; Suryadhi, M.A.H.; Abudureyimu, K. Acute exposure to sulfur dioxide and mortality: Historical data from Yokkaichi, Japan. Arch. Environ. Occup. Health 2019, 74, 271–278. [Google Scholar] [CrossRef]
- Shen, S.; Li, X.; Yuan, C.; Huang, Q.; Liu, D.; Ma, S.; Hui, J.; Liu, R.; Wu, T.; Chen, Q. Association of short-term exposure to sulfur dioxide and hospitalization for ischemic and hemorrhagic stroke in Guangzhou, China. BMC Pub. Health 2020, 20, 263. [Google Scholar] [CrossRef]
- Orellano, P.; Reynoso, J.; Quaranta, N. Short-term exposure to sulphur dioxide (SO2) and all-cause and respiratory mortality: A systematic review and meta-analysis. Environ. Int. 2021, 150, 106434. [Google Scholar] [CrossRef] [PubMed]
- Sousa, S.I.V.; Pires, J.C.M.; Martins, E.M.; Fortes, J.D.N.; Alvim-Ferraz, M.C.M.; Martins, F.G. Short-term effects of air pollution on respiratory morbidity at Rio de Janeiro—Part II: Health assessment. Environ. Int. 2012, 43, 1–5. [Google Scholar] [CrossRef] [PubMed]
- Krotkov, N.A.; McLinden, C.A.; Li, C.; Lamsal, L.N.; Celarier, E.A.; Marchenko, S.V.; Swartz, W.H.; Bucsela, E.J.; Joiner, J.; Duncan, B.N.; et al. Aura OMI observations of regional SO2 and NO2 pollution changes from 2005 to 2015. Atmos. Chem. Phys. Discuss. 2016, 16, 4605–4629. [Google Scholar] [CrossRef]
- Zhang, L.; Lee, C.S.; Zhang, R.; Chen, L. Spatial and temporal evaluation of long term trend (2005–2014) of OMI retrieved NO2 and SO2 concentrations in Henan Province, China. Atmos. Environ. 2017, 154, 151–166. [Google Scholar] [CrossRef]
- Bani, P.; Oppenheimer, C.; Tsanev, V.; Scaillet, B.; Primulyana, S.; Boyson, S.; Alfianti, H.; Marlia, M. Modest volcanic SO2 emissions from the Indonesian archipelago. Nat. Commun. 2022, 13, 3366. [Google Scholar] [CrossRef]
- Eyring, V.; Isaksen, I.S.; Berntsen, T.; Collins, W.J.; Corbett, J.J.; Endresen, O.; Grainger, R.G.; Moldanova, J.; Schlager, H.; Stevenson, D.S. Transport impacts on atmosphere and climate: Shipping. Atmos. Environ. 2010, 44, 4735–4771. [Google Scholar] [CrossRef]
- Krause, K.; Wittrock, F.; Richter, A.; Schmitt, S.; Pöhler, D.; Weigelt, A.; Burrows, J.P. Estimation of ship emission rates at a major shipping lane by long-path DOAS measurements. Atmos. Meas. Tech. 2021, 14, 5791–5807. [Google Scholar] [CrossRef]
- Knežević, V.; Pavin, Z.; Čulin, J. Estimating Shipping Emissions—A Case Study for CargoPort of Zadar, Croatia. TransNAV Int. J. Mar. Navig. Saf. Sea Transp. 2021, 15, 615–620. [Google Scholar]
- Bouchlaghem, K.; Mansour, F.B.; Elouragini, S. Impact of a seabreeze event on air pollution at the Eastern Tunisian Coast. Atmos. Res. 2007, 86, 162–172. [Google Scholar] [CrossRef]
- Yerramilli, A.; Challa, V.S.; Indracanti, J.; Dasari, H.; Baham, J.; Patrick, C.; Young, J.; Hughes, R.; White, L.D.; Hardy, M.G.; et al. Some observational and modeling studies of the atmospheric boundary layer at Mississippi gulf coast for air pollution dispersion assessment. Int. J. Environ. Res. Pub. Health 2008, 5, 484–497. [Google Scholar] [CrossRef]
- Bahtiyar, E.; Yasar Burak, O.; Ali, D.; Alper, U. Analysis of air pollutants in Kagithane valley and Istanbul Metropolitan Area. Air Qual. Atmos. Health 2022, 15, 1–15. [Google Scholar]
- Physick, W.L. Numerical experimentson the inland penetration of the sea breeze. Q. J. R. Met Soc. 1980, 106, 735–746. [Google Scholar] [CrossRef]
- Abbs, D.J. Sea-breeze interactions along a concave coastline in southern Australia:observations and numerical modelling study. Mon Weather Rev. 1986, 114, 831–848. [Google Scholar] [CrossRef]
- Garratt, J.R. The Internal Boundary-Layer—A review. Bound.-Lay. Meteorol. 1990, 50, 171–203. [Google Scholar] [CrossRef]
- Kouchi, A.; Ohba, R.; Shao, Y. Gas diffusion in a convection layer near a coastal region. J. Wind. Eng. Ind. Aerodyn. 1999, 81, 171–180. [Google Scholar] [CrossRef]
- Augustin, P.; Delbarre, H.; Lohou, F.; Campistron, B.; Puygrenier, V.; Cachier, H.; Lombardo, T. Investigationof local meteorological events and their relationship with ozone and aerosols during an ESCOMPTE photochemical episode. Ann. Geophys. 2006, 24, 2809–2822. [Google Scholar] [CrossRef]
- Shang, F.; Chen, D.; Guo, X.; Lang, J.; Zhou, Y.; Li, Y.; Fu, X. Impact of Sea Breeze Circulation on the Transport of Ship Emissions in Tangshan Port, China. Atmosphere 2019, 10, 723. [Google Scholar] [CrossRef]
- Orlić, M.; Penzar, B.; Penzar, I. Adriatic Sea and Land breezes: Clockwise versus anti-clockwise Rotation. J. Appl. Met. Climat. 1998, 5, 675–679. [Google Scholar]
- Trošić, T.; Šinik, N.; Trošić, Ž. Available potential energy of the daily coastal circulation at Zadar (Croatia). Meteorol. Atmos. Phys. 2006, 93, 211–220. [Google Scholar] [CrossRef]
- Telišman Prtenjak, M.; Grisogono, B. Sea/landbreeze climatological characteristics along the north-ern Croatian Adriatic coast. Theor. Appl. Clim. 2007, 90, 201–215. [Google Scholar] [CrossRef]
- Trošić, T.; Trošić, Ž. Numerical Simulation and Observational Analysis of the Bora of Pag’s Ribs. Bound.-Layer Meteorol. 2010, 134, 353–366. [Google Scholar] [CrossRef]
- Telišman Prtenjak, M.; Jeričević, A.; Kraljević, L.; Bulić, I.H.; Nitis, T.; Klaić, Z.B. Exploring atmospheric boundary layer characteristics in a severe SO2 episode in the north-eastern Adriatic. Atmos. Chem. Phys. 2009, 9, 4467–4483. [Google Scholar] [CrossRef]
- Bralić, M.; Buljac, M.; Periš, N.; Buzuk, M.; Dabić, P.; Brinić, S. Monthly and Seasonal Variations of NO2, SO2 and Black-smoke Located Within the Sport District in Urban Area, City of Split, Croatia. Croat. Chem. Acta 2012, 85, 139–145. [Google Scholar] [CrossRef]
- Trošić Lesar, T.; Filipčić, A. Lagrangian particle dispersion (HYSPLIT) model analysis of the sea breeze case with extreme mean daily PM10 concentration in Split, Croatia. Environ. Sci. Pollut. Res. 2022, 29, 73071–73084. [Google Scholar] [CrossRef]
- Zhang, T.; Wu, C.; Li, B.; Wang, J.; Ravat, R.; Chen, X.; Wei, J.; Yu, Q. Linking the SO2 emission of cement plants to the sulfur characteristics of their limestones: A study of 80 NSP cement lines in China. J. Clean. Prod. 2019, 220, 200–211. [Google Scholar] [CrossRef]
- Ibrahim, H.G.; Okasha, A.Y.; Elatrash, M.S.; Al-Meshragi, M.A. Emissions of SO2, NOx and PMs from Cement Plant in Vicinity of Khoms City in Northwestern Libya. J. Environ. Sci. Eng. 2012, A1, 620–628. [Google Scholar]
- Paschalidou, A.K.; Karaloysios, S.; Kleanthous, S.; Kassomenos, P.A. Forecasting hourly PM10 concentration in Cyprus through artificial neural networks andmultiple regression models: Implications to local environmental management. Environ. Sci. Poll. Res. Intern. 2009, 18, 316–327. [Google Scholar] [CrossRef]
- Vlachogianni, A.; Kassomenos, P.; Karppinen, A.; Karakitsios, S.; Kukkonen, J. Evaluation of a multipleregression model for the forecasting of the concentrationsof NOx and PM10 in Athens and Helsinki. Sci. Total Environ. 2011, 409, 1559–1571. [Google Scholar] [CrossRef]
- Lalas, D.; Veirs, V.R.; Karras, G.; Kallos, G. An analysis of the SO2 concentration in Athens, Greece. Atmos. Environ. 1982, 16, 531–544. [Google Scholar] [CrossRef]
- Tirabassi, T.; Fortezza, F.; Vandini, W. Wind circulation and air pollutant concentration in the coastal city of Ravenna. Energy Build. 1991, 16, 699–704. [Google Scholar] [CrossRef]
- Shams, S.R.; Jahani, A.; Kalantary, S.; Moeinaddini, M.; Khorasani, N. The evaluation on artificial neural networks (ANN) and multiple linear regressions (MLR) models for predicting SO2 concentration. Urban Clim. 2021, 37, 100837. [Google Scholar] [CrossRef]
- Liu, Y.; Zhou, Y.; Lu, J. Exploring the relationship between air pollution and meteorological conditions in China under environmental governance. Sci. Rep. 2020, 10, 14518. [Google Scholar] [CrossRef]
- Liu, B.; Zhao, Q.; Jin, Y.; Shen, J.; Li, C. Application of combined model of stepwise regression analysis and artificial neural network in data calibration of miniature air quality detector. Sci. Rep. 2021, 11, 3247. [Google Scholar] [CrossRef]
- Mukerjee, S.; Shadwick, D.S.; Smith, L.A.; Somerville, M.C.; Dean, K.E.; Browser, J.J. Techniques toassess cross-border air pollution and application to a US-Mexico border region. Sci. Total Environ. 2001, 276, 205–224. [Google Scholar] [CrossRef]
- Kukkonen, J.; Harkonen, J.; Karppinen, A.; Pohjola, M.; Pietarila, H.; Koskentalo, T. A semi-empirical model for urban PM10 concentrations, and its evaluation againstdata from an urban measurement network. Atmos. Environ. 2001, 35, 4433–4442. [Google Scholar] [CrossRef]
- Hrust, L.; Klaić, Z.B.; Križan, J.; Antonić, O.; Hercog, P. Neural network forecasting of air pollutants hourly concentrations using optimised temporal averagesof meteorological variables and pollutant concentrations. Atmos. Environ. 2009, 43, 5588–5596. [Google Scholar] [CrossRef]
- Abdullah, S.; Napi, N.N.L.M.; Ahmed, A.N.; Mansor, W.N.W.; Mansor, A.A.; Ismail, M.; Abdullah, A.M.; Ramly, Z.T.A. Development of Multiple Linear Regression for Particulate Matter (PM10) Forecasting during Episodic Transboundary Haze Event in Malaysia. Atmosphere 2020, 11, 289. [Google Scholar] [CrossRef]
- Zhou, Y.; Guan, H.; Huang, C.; Fan, L.; Gharib, S.; Batelaan, O.; Simmons, C. Sea breeze cooling capacity and its influencing factors in a coastal city. Build. Environ. 2019, 166, 106408. [Google Scholar] [CrossRef]
- Trošić Lesar, T.; Filipčić, A. The hourly simulation of PM2.5 particle concentrations using the multiple linear regression (MLR) model for sea breeze in Split, Croatia. Water Air Soil Pollut. 2021, 232, 261. [Google Scholar] [CrossRef]
- Google Maps. 2022. Available online: https://www.google.com/maps/d/viewer?mid=1Fb1obUiEtNB8bJ-bu-WR7HA-Io&hl=en_US&ll=43.56611726780062%2C16.386492960821638&z=12 (accessed on 20 November 2022).
- Trošić, T. Climatological characteristics of the lower branch of coastal circulation along the Eastern Croatian coast. Croat. Meteorol. J. 2002, 37, 27–36. [Google Scholar]
- Telišman Prtenjak, M.; Grisogono, B. Idealised numerical simulations of diurnal sea breeze characteristics over a step change in roughness. Meteorol. Z. 2002, 11, 345–360. [Google Scholar] [CrossRef]
- Ordieres, J.B.; Vergara, E.; Capuz, R.; Salazar, R. Neural network prediction model for fine particulate matter (PM2.5) on the US–Mexico border in El Paso (Texas) and Ciudad Juarez Chihuahua. Environ. Modell. Soft. 2005, 20, 547–559. [Google Scholar] [CrossRef]
- Zuur, A.F.; Ieno, E.N.; Walker, N.J.; Saveliev, A.A.; Smith, G.M. Mixed Effects Models and Extensions in Ecology with R. Statistics for Biology and Health; Springer: New York, NY, USA, 2009; p. 574. [Google Scholar]
- Trošić Lesar, T.; Filipčić, A. Multiple Linear Regression (MLR) model simulation of hourly PM10 concentrations during sea breeze events in the Split area. Naše More 2017, 64, 77–85. [Google Scholar] [CrossRef]
- Rogalski, L.; Smoczynski, L.; Krzebietke, S.J.; Lenart, L.; Mackiewicz-Walec, E. Changes in sulphur dioxide concentrations in the atmospheric air assessed during short-term measurements in the vicinity of Olsztyn, Poland. J. Elem. 2014, 19, 735–748. [Google Scholar]
- Trošić Lesar, T.; Filipčić, A. The influence of sea breeze on the air pollution in the Split area. Geoadria 2018, 23, 135–151. [Google Scholar] [CrossRef]


| April | May | June | July | August | September | Total | |
|---|---|---|---|---|---|---|---|
| Num. of days | 6 | 7 | 7 | 13 | 4 | 3 | 40 |
| Meas. Conc. at AMS 3 Split-1 (μg m−3) | Meas. Conc. at AMS 1 Kaštel-Sućurac (μg m−3) | Limit Value for Human Health (μg m−3) | |
|---|---|---|---|
| 24 h mean | 13.59 | 11.84 | 125 |
| 24 h max | 89.42 | 73.79 | 350 |
| WDI | WS | dT | RH | C6 | C7 | C8 | Time | |
|---|---|---|---|---|---|---|---|---|
| Sea breeze | x | x | x | x | ||||
| Land breeze | x | x | x | x |
| MAE | RMSE | IA | R | |
|---|---|---|---|---|
| Sea breeze | 3.7 | 5.9 | 0.8 | 0.6 |
| Land breeze | 2.2 | 3.2 | 0.9 | 0.7 |
Disclaimer/Publisher’s Note: The statements, opinions and data contained in all publications are solely those of the individual author(s) and contributor(s) and not of MDPI and/or the editor(s). MDPI and/or the editor(s) disclaim responsibility for any injury to people or property resulting from any ideas, methods, instructions or products referred to in the content. |
© 2023 by the authors. Licensee MDPI, Basel, Switzerland. This article is an open access article distributed under the terms and conditions of the Creative Commons Attribution (CC BY) license (https://creativecommons.org/licenses/by/4.0/).
Share and Cite
Trošić Lesar, T.; Filipčić, A. Prediction of the SO2 Hourly Concentration for Sea Breeze and Land Breeze in an Urban Area of Split Using Multiple Linear Regression. Atmosphere 2023, 14, 420. https://doi.org/10.3390/atmos14030420
Trošić Lesar T, Filipčić A. Prediction of the SO2 Hourly Concentration for Sea Breeze and Land Breeze in an Urban Area of Split Using Multiple Linear Regression. Atmosphere. 2023; 14(3):420. https://doi.org/10.3390/atmos14030420
Chicago/Turabian StyleTrošić Lesar, Tanja, and Anita Filipčić. 2023. "Prediction of the SO2 Hourly Concentration for Sea Breeze and Land Breeze in an Urban Area of Split Using Multiple Linear Regression" Atmosphere 14, no. 3: 420. https://doi.org/10.3390/atmos14030420
APA StyleTrošić Lesar, T., & Filipčić, A. (2023). Prediction of the SO2 Hourly Concentration for Sea Breeze and Land Breeze in an Urban Area of Split Using Multiple Linear Regression. Atmosphere, 14(3), 420. https://doi.org/10.3390/atmos14030420