Article

Adhering Solid Precipitation in the Current and Pseudo-Global Warming Future Climate over the Canadian Provinces of Manitoba and Saskatchewan

1
Department of Environment and Geography, University of Manitoba, Winnipeg, MB R3T 2N2, Canada
2
Centre for Earth Observation Science, University of Manitoba, Winnipeg, MB R3T 2N2, Canada
3
Department of Earth and Atmospheric Sciences, Centre ESCER, Université du Québec à Montréal, Montréal, PQ H2X 3Y7, Canada
*
Author to whom correspondence should be addressed.
Atmosphere 2023, 14(2), 396; https://doi.org/10.3390/atmos14020396
Submission received: 29 December 2022 / Revised: 7 February 2023 / Accepted: 8 February 2023 / Published: 17 February 2023

Abstract

:
Solid precipitation falling near 0 °C, mainly snow, can adhere to surface features and produce major impacts. This study is concerned with characterizing this precipitation over the Canadian Prairie provinces of Manitoba and Saskatchewan in the current (2000–2013) and pseudo-global warming future climate, with an average 5.9 °C temperature increase, through the use of high resolution (4 km) model simulations. On average, simulations in the current climate suggest that this precipitation occurs within 11 events per year, lasting 33.6 h in total and producing 27.5 mm melted equivalent, but there are wide spatial variations that are partly due to enhancements arising from its relatively low terrain. Within the warmer climate, average values generally increase, and spatial patterns shift somewhat. This precipitation consists of four categories covering its occurrence just below and just above a wet-bulb temperature of 0 °C, and with or without liquid precipitation. It generally peaks in March or April, as well as in October, and these peaks move towards mid-winter by approximately one month within the warmer climate. Storms producing this precipitation generally produce winds with a northerly component during or shortly after the precipitation; these winds contribute to further damage. Overall, this study has determined the features of and expected changes to adhering precipitation across this region.

1. Introduction

Winter storms often lead to major impacts. Many of these impacts are directly related to the associated precipitation, which can vary among, for example, snow, freezing rain, and ice pellets [1]. A particular type of hazardous winter storm produces snow that adheres to surfaces, especially with strong winds [2]. The build-up of snow enhances the weight and drag experienced by structures and vegetation. Such storms have to occur with surface air temperatures near 0 °C. If much colder, the snow does not readily adhere to structures; if much warmer, rain falls.
The term ‘wet snow’ is often used to describe this precipitation and, formally, this is “deposited snow that contains a great deal of liquid water” [3]. Wet snow can arise through several processes. For example, [4] showed there are at least four processes with only one, melting, needing to occur at wet bulb temperatures above 0 °C. If due to melting, [5,6] furthermore asserted that it occurs at wet bulb temperatures to at least −0.2 °C; this allows for incomplete refreezing for particles that had fallen through slightly warmer temperatures aloft. Given its various formation mechanisms that can involve particle collisions aloft, even lower temperatures could be associated with snow containing liquid.
Snow that adheres to surfaces is generally associated with being ‘sticky’ if it is wet, but there are other considerations. There does not appear to be a formal definition of ‘sticky’ snow, so the term is simply used here to imply that snow particles have a tendency to ‘stick’ together on collision or adhere onto surfaces. For wet snow, if the temperature is too high, it contains so much liquid that it may simply slide off structures. This limit is approximately 2 °C, although it can be as high as 5 °C under low relative humidity [6,7,8,9]. However, snow does not need to be ‘wet’ [3] to be ‘sticky’. Snow occurring just below 0 °C does not actually melt, but a quasi-liquid layer develops on its surface as temperatures rise to almost 0 °C. [10] found that this layer develops, depending on particle type, at temperatures ≳−4 °C to ≳−2 °C. Studies, such as [11], subsequently referred to snow reaching such temperatures as becoming “stickier”.
Storms producing adhering snow have been examined in different regions of the world. For example, [6] illustrated such storms in different countries that had major impacts on electrical infrastructure. [12] studied such storms over Iceland and noted that adhering snow normally occurred at wet-bulb temperatures below 1 °C. [13] pointed out the consequences on infrastructure and transportation of a devastating wet snow event in Germany, and [14] showed how this precipitation impacted electrical transmission lines in northern Italy. Many studies, for example [15,16,17], have examined storms producing adhering snow over the United States.
Cold season storms lash all regions of Canada [18], and many of these storms produce adhering snow [19]. Such precipitation is common along the Pacific coastline, or within adjacent mountainous regions [20], and is often produced within spring storms in the lee in the Rocky Mountains [21]. In eastern Canada, storms typically produce a wide variety of precipitation types, ranging from rain to snow at cold temperatures, and adhering snow is often embedded within these events [22].
The Canadian Prairies within the central part of the country are also subjected to such storms. [23] described two events that led to major impacts in Saskatchewan, and both had associated surface temperatures in the −1 °C to 2 °C range. [24] examined several storms that produced adhering snow over Manitoba and pointed out the importance of the region’s small topographic features on its spatial distribution. [2] examined an October 2019 event over Manitoba that led to unparalleled damage to electrical utility infrastructure and, in some areas, to more tree damage than from any previously recorded event.
There is concern as to how storms producing adhering snow may change in the future. With our rapidly changing climate [25], attention needs to be placed on future occurrences. Given a general poleward movement of the 0 °C isotherm, such events should as well [26]. However, regional factors also affect the locations of snow near 0 °C, which complicates projections of its future occurrence [24,27].
Because of their importance and relative lack of attention, the focus of this study is on such precipitation, and in particular, over eastern parts of the Canadian Prairies, including its forested areas. Consequently, the objective of this study is to examine changes in adhering solid precipitation over this region’s land areas in a warmer climate. Note that some events with adhering snow also produce snow pellets and ice pellets at near 0 °C temperatures [2], although, if they occur, these latter precipitation types are usually present in small amounts. Nonetheless, and following [28], the term ‘adhering solid precipitation’ will be used to cover all these types.
A key dataset being used in this analysis is the Weather Research and Forecasting (WRF) model 4-km climate simulations [29]. As described in Section 2, these simulations covered the October 2000 to September 2013 period with a retrospective simulation, as well as one using a pseudo-global warming (PGW) assumption.
The article is organized as follows: Section 2 presents the observational and model datasets used in the study and Section 3 provides an evaluation of model capabilities. Section 4 discusses the occurrences and amounts of adhering solid precipitation and Section 5 focuses on the events within which this precipitation occurs. Section 6 provides further analyses of critical features, Section 7 discusses implications, and Section 8 provides concluding remarks.

2. Datasets and Methodology

2.1. Observational Meteorological and Land Surface Data

Hourly surface weather observations from manned Environment and Climate Change Canada’s (ECCC) stations [30] were utilized. These variables included temperature, relative humidity, wind speed and direction, as well as precipitation occurrence and type. The actual measurements were obtained from the ECCC’s National Climate Data and Information Archive [31]. Surface air temperature and humidity were measured at a 2-m height and wind was measured at a 10-m height, which are the standard levels for these observations.
Observations of precipitation amounts over the cold season at the ECCC stations are only available on a daily basis. Values used in this study have been adjusted by ECCC to account for measurement issues, including under-catchment within winds [32].
ECCC records were also used to find previous storms that produced adhering snow and caused major impacts. In particular, the list of top 10 weather stories across Canada for every year from 1996 to 2021, as well as the top weather stories of the 20th century [33], were examined, and storms were selected if they produced significant snow at temperatures close to 0 °C over the eastern Prairies.

2.2. Weather Research and Forecasting (WRF) Simulations

This study used a Weather Research and Forecasting (WRF) model dataset that was developed through a pseudo-global warming assumption (PGW). As described by [29], the simulations used 4-km resolution and explicit calculation of convection over the October 2000 to September 2013 period. The simulations covered the contiguous United States, southern Canada, and northern Mexico.
The simulations were performed in two steps. First, a control (CTRL) run of the historical conditions was carried out using initial and boundary conditions from the European Centre for Medium-Range Weather Forecasts Re-Analysis (ERA-Interim). This was followed by a second run using the PGW approach [34] that was accomplished by perturbing the CTRL with the Coupled Model Intercomparison Project 5 (CMIP5) [35] 19-model ensemble mean, using the Representative Concentration Pathway 8.5 (RCP 8.5) “business as usual” emission scenario at the end of the 21st century. Spectral nudging was used to maintain the historical overall large scale synoptic (of order 2000 km) flows; this forced storms to follow the same general paths in the PGW simulations. Since this approach does not consider changes in large-scale forcing, it can largely be considered as an examination of the consequences of changes in thermodynamic forcing in a warmer, moister climate [29,36].
These simulations used the Thompson aerosol-aware microphysics scheme [37] to predict clouds and precipitation. Only one moment of the size distribution was predicted for cloud water, snow, and graupel, and two moments for cloud ice and rain. Because the hydrometeor categories are only liquid or solid, not all types of precipitation can be computed. Ice pellet formation from partial melting aloft was, consequently, not simulated, but graupel was. As described in Section 2.3, wet snow and freezing rain are diagnosed using temperature criteria.

2.3. Methodology Including Definitions

This study focuses on the eastern Canadian Prairies. This includes the provinces of Manitoba and Saskatchewan, as well as a small corner of northwestern Ontario (Figure 1). This is a relatively flat region, although there are distinct terrain features. The highest terrain, Cypress Hills (1392 m MSL), is situated in southwestern Saskatchewan [38], and another notable feature is the Manitoba Escarpment, which is a series of four peaks straddling the Manitoba-Saskatchewan border, with Riding Mountain (762 m MSL) being the most southerly [39].
This region is characterized by warm summers and cold winters [40]. In terms of its eco-climates [41], much of it is within the Prairie grasslands, but the southern part of the boreal forest [42] cuts through it as well. There is a small area on the southeastern corner, which is part of the Great Lakes–St. Lawrence forest region [43].
To examine this region, a subset of the WRF overall domain was used. The study area was between 49° N and 56° N, and between 94° W and 110° W (Figure 1); this represents 1.01 million km2. The study was furthermore concerned with precipitation over land, so the largest lakes, covering 4.9% of the study area, were not considered in the ensuing analyses. It should be noted that the northern edge of the overall WRF domain is located at approximately 57.5° N (Liu et al., 2017) for our region of interest but, to reduce lateral boundary errors, only information up to 56° N was utilized.
All eight manned ECCC weather stations within this domain were used for evaluation (Figure 1). These are spread over the domain, although there are gaps. Their elevations above sea level range from 224.0 m at Thompson to 577.6 m at Regina.
Adhering solid precipitation is the focus of this study. This precipitation is made up of snow and/or ice pellets and/or snow pellets using observations, and it is made up of snow and/or graupel when using WRF model output. It either occurs on its own or in combination with liquid precipitation.
Precipitation was broken down into four categories based on precipitation type and temperature (Table 1). As discussed in the Introduction, there are temperature and relative humidity thresholds between different adhering precipitation particles. To approximate these thresholds, the wet bulb temperature (Tw) and the presence or absence of liquid precipitation were utilized. A wet bulb temperature of −2 °C was used to identify the onset for solid precipitation being able to adhere, and a value of 0 °C was used to identify that it had enough liquid to be deemed ‘wet’. Wet snow can occur when Tw < 0 °C, due to several mechanisms [4], and these occurrences are therefore not considered. Wet snow containing so much liquid that it may simply slide off structures was considered to occur if Tw > 2 °C.
The term ‘adhering solid precipitation’ refers to its occurrence within the whole window of −2 °C ≤ Tw ≤ 2 °C. It can either occur on its own or with liquid precipitation. This liquid precipitation was broken down into freezing rain and rain, using a threshold of 0 °C to separate them. Because wet snow on its own contains liquid water [3], only the category of not-wet/sticky is not associated with liquid. These definitions followed and expanded upon those used in previous studies [24,44].
A value of 0.2 mm melted equivalent was used as a threshold of each explicit model hourly output. However, [30] considered an amount of 0.2 mm to be a trace over a 24 h period. Through this higher threshold, this study will consequently underestimate the number of occurrences in comparison with observations. [24,44] used this same procedure.
To separate the adhering solid precipitation into its respective categories, checks were used to determine when one precipitation type was missing. For example, under the category with only adhering solid precipitation, a criterion was applied to ensure associated liquid was below the 0.2 mm/h threshold.
An event was defined as a continuous period with the appropriate hourly conditions. These conditions are simply the presence of adhering solid precipitation ≥ 0.2 mm in an hour.

3. Model Evaluation

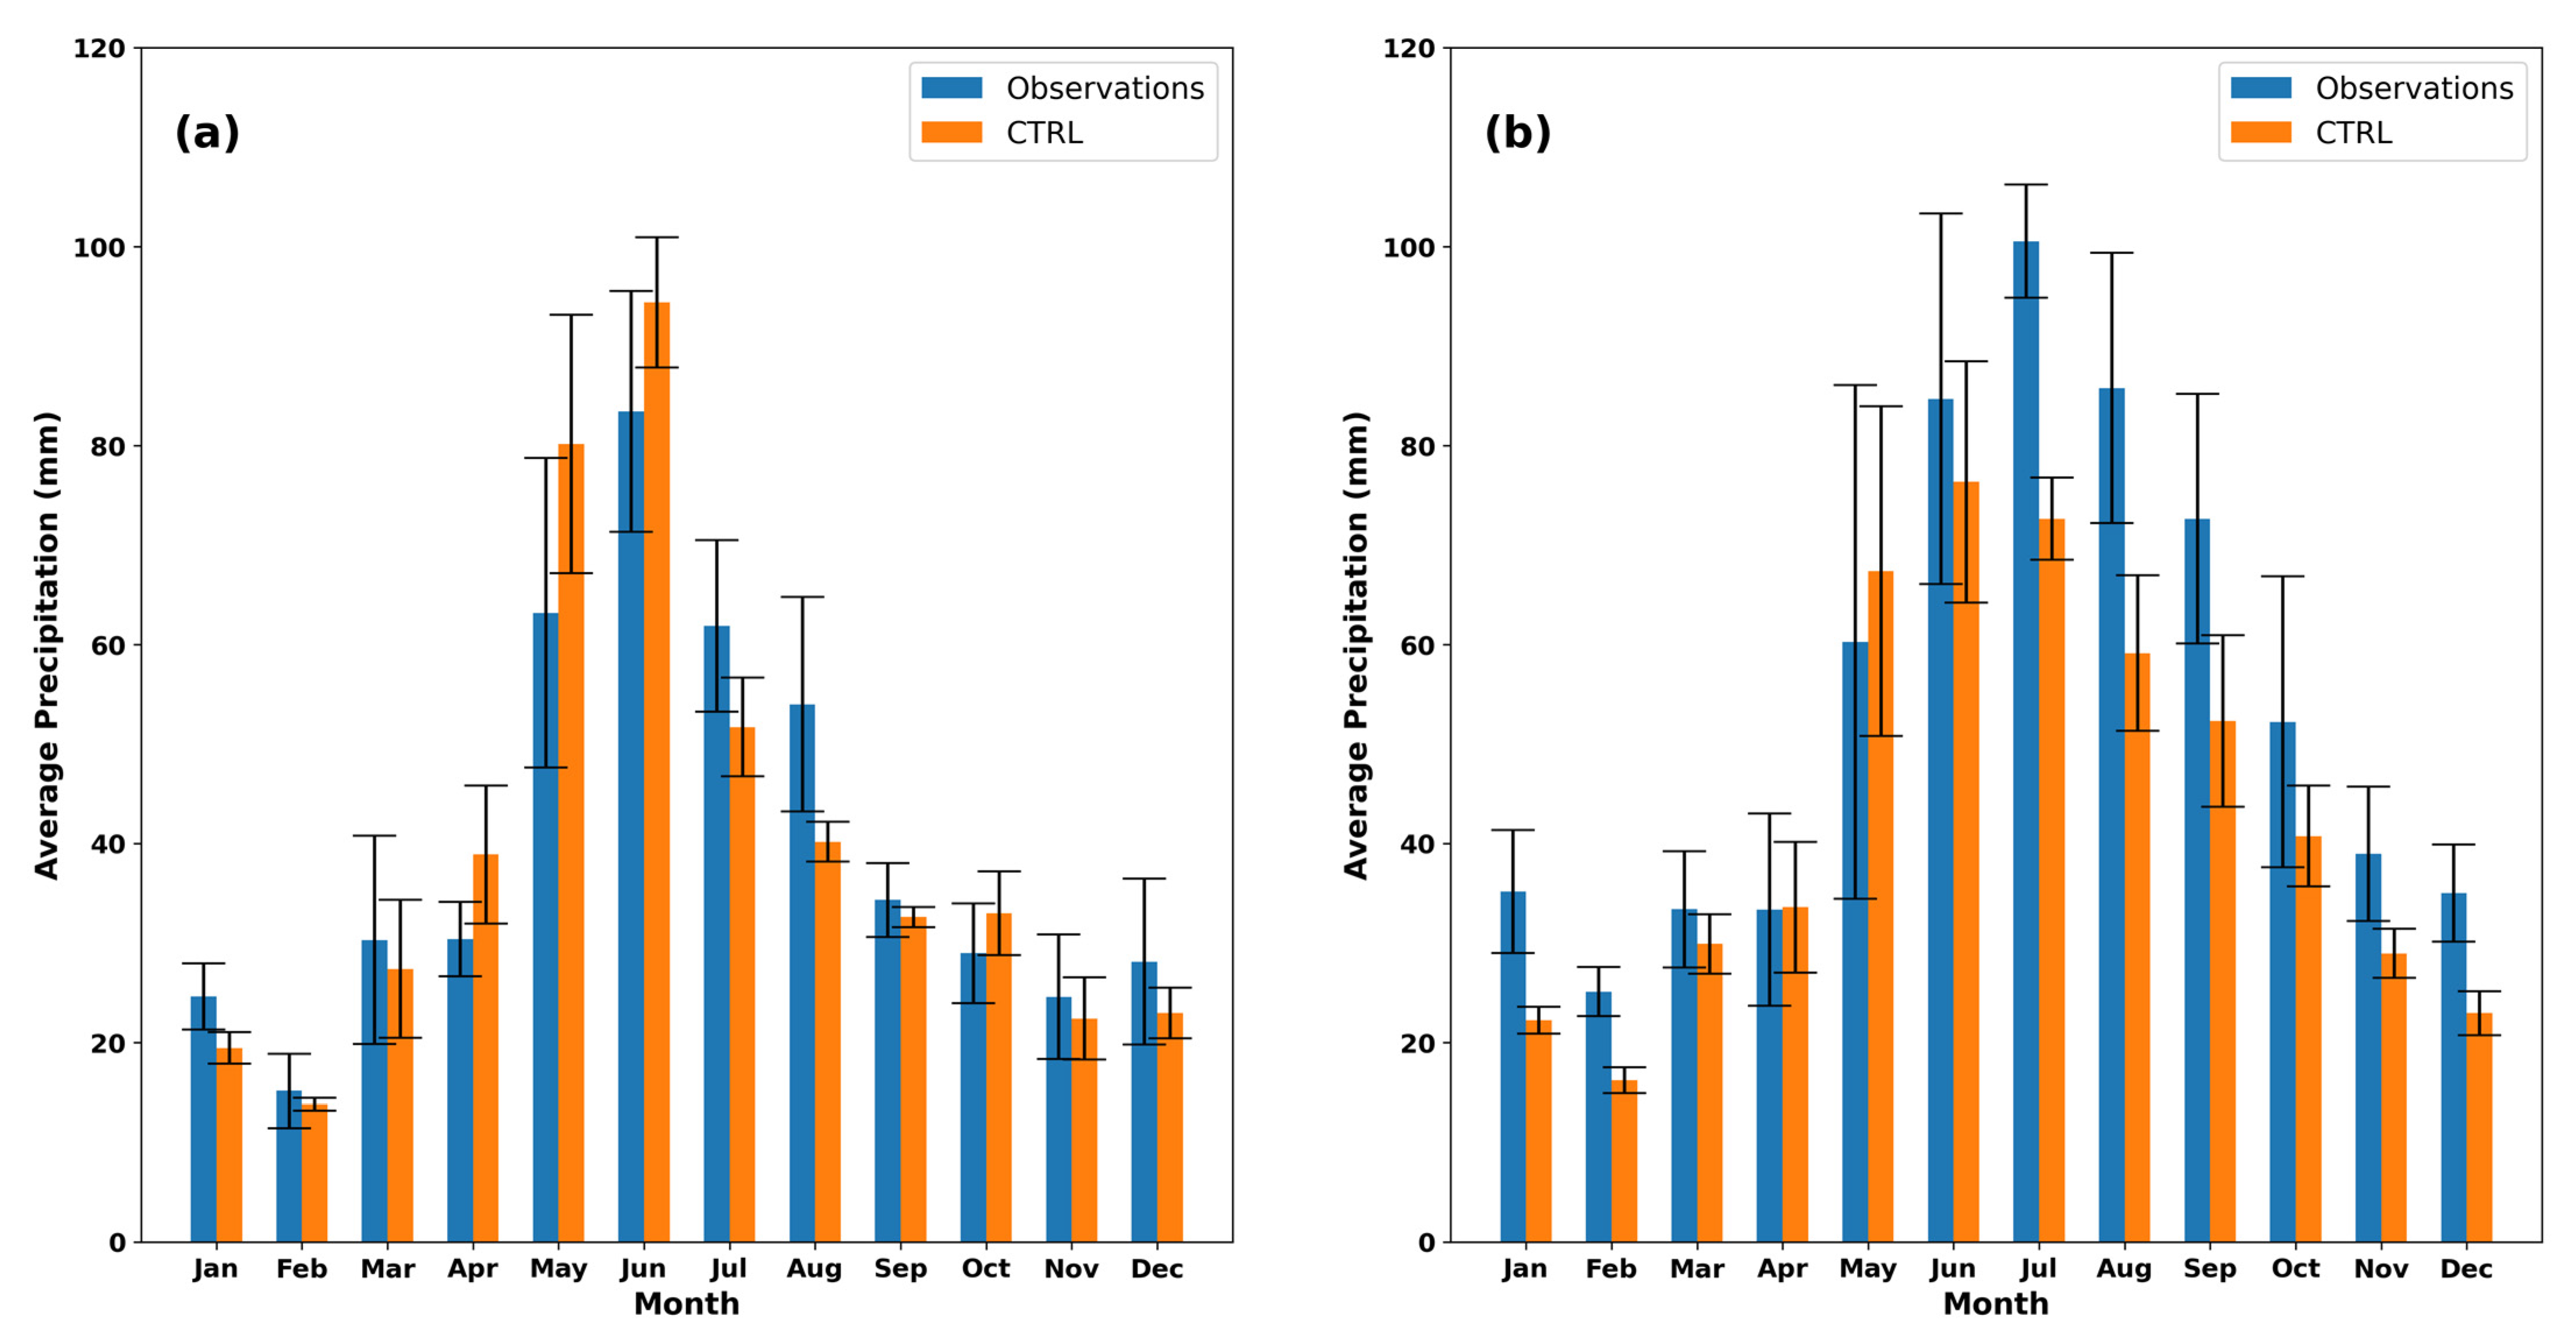
To assess the capabilities of the model simulations, precipitation amounts were first evaluated (Figure 2). As discussed in Section 2.1, observed values are only daily and, in addition, model values are averaged over 4 × 4 grid boxes encompassing station locations. The evaluation separately considered the four stations with the lowest annual precipitation (Saskatoon, Regina, Brandon, and Winnipeg) and the four with the highest annual precipitation (La Ronge, The Pas, Thompson, and Kenora). For the lower precipitation amount stations, averaging 469 mm, CTRL was lower than observations in eight months, although they all agreed within one standard deviation. For the higher precipitation amount stations, averaging 661 mm, CTRL was lower than observations in 10 months and six agreed within one standard deviation. For the six months that did not agree within one standard deviation, CTRL was always lower than observations, with the largest differences being in July and August.
Hourly output variables were utilized next in the evaluation. Figure 3 shows the average monthly number of hours within the −2 °C ≤ Tw ≤ 2 °C window, as well as the number of hours of adhering solid precipitation occurrences. The latter variable requires the simultaneous simulation of both the narrow temperature window as well as the presence of solid precipitation. Here, information from the eight stations was averaged. CTRL provides a good simulation of the wet-bulb temperature window. CTRL values are generally slightly lower than observed values, but they always agree within one standard deviation. CTRL also simulates adhering solid precipitation occurrences well, if a very low precipitation threshold is considered (0.01 mm/h). CTRL values are slightly lower than the observations for all months, except March, which implies an overall underestimation. However, for all months, they agree within one standard deviation. In this study, the focus is on occurrences at higher rates (≥0.2 mm/h). This substantially reduces CTRL values so that average monthly adhering snow hours range from 19% to 43% of observed values if the low values in June and September are excluded. In several months, CTRL values still agree with observations within one standard deviation. Note that there were no occurrences in July and August in either the observations or model output.
Two studies have previously discussed the capabilities of this model dataset within regions relevant to this study. [29] found surface air temperature biases near the Canadian border of Manitoba and Saskatchewan to be 2–3 °C too cold in winter, 1–3 °C too warm in spring, and <1 °C too warm in autumn; the annual precipitation amount was well simulated. [24] examined several precipitation events over southern Manitoba and found surface air temperature biases averaging −1.5 °C, but found precipitation amounts to be well simulated. However, both of these studies just utilized average temperatures; neither specifically evaluated the occurrence of the narrow −2 °C ≤ Tw ≤ 2 °C window that is critical in the present study.
Collectively, these evaluations indicate that CTRL is a suitable dataset for the examination of adhering solid precipitation over this region.

4. Adhering Solid Precipitation Patterns

4.1. Occurrences and Amounts

The occurrence of adhering solid precipitation is not common across the domain. In terms of overall annual occurrence, it averages 33.6 h in CTRL, or approximately 1.5 days annually. In PGW, the average temperature across the domain, computed using hourly information, increases by 5.9 °C and, considering the 10 months with adhering solid precipitation (Section 3), the average monthly temperature increase ranges from 4.3 °C in May to 8.1 °C in December. These temperature increases are associated with an increase in occurrences of 7.7% to 36.2 h in PGW.
The average annual amount of adhering solid precipitation is small. It averages 27.5 mm annually in CTRL and increases slightly (2.9%) to 28.3 mm in PGW.

4.2. Spatial Patterns of Occurrences and Amounts

4.2.1. Occurrences

There is considerable variation across the domain (Figure 4). Highest values in CTRL occur in the higher terrain of Cypress Hills, with values of approximately 80 h, and there are slightly lower values in several other areas that are also mainly associated with higher terrain. In contrast, lowest values of approximately 20 h occur in several areas.
A similar spatial pattern occurs within PGW. Highest values are slightly lower in the southeastern corner (approximately 70 h), but values in other regions of higher terrain, approximately 60 h, are now closer. Lowest values are similar to those in CTRL, and they occur in approximately the same areas. Across the whole domain, there is an almost unbroken band of increases between approximately 52° N and 55° N. Overall, the largest changes between PGW and CTRL are approximately 20 h increases and decreases.
There are large differences in the average annual occurrence of the different categories. In CTRL, the most frequently occurring category is not-wet/sticky (19.6 h or 58.4%), followed by not-wet/sticky with freezing rain (7.2 h or 21.2%) and wet/sticky with rain (6.1 h or 18.2%). In PGW, the same ordering occurs, and all categories increase their average annual values, although not-wet/sticky increased the most (1.9 h).
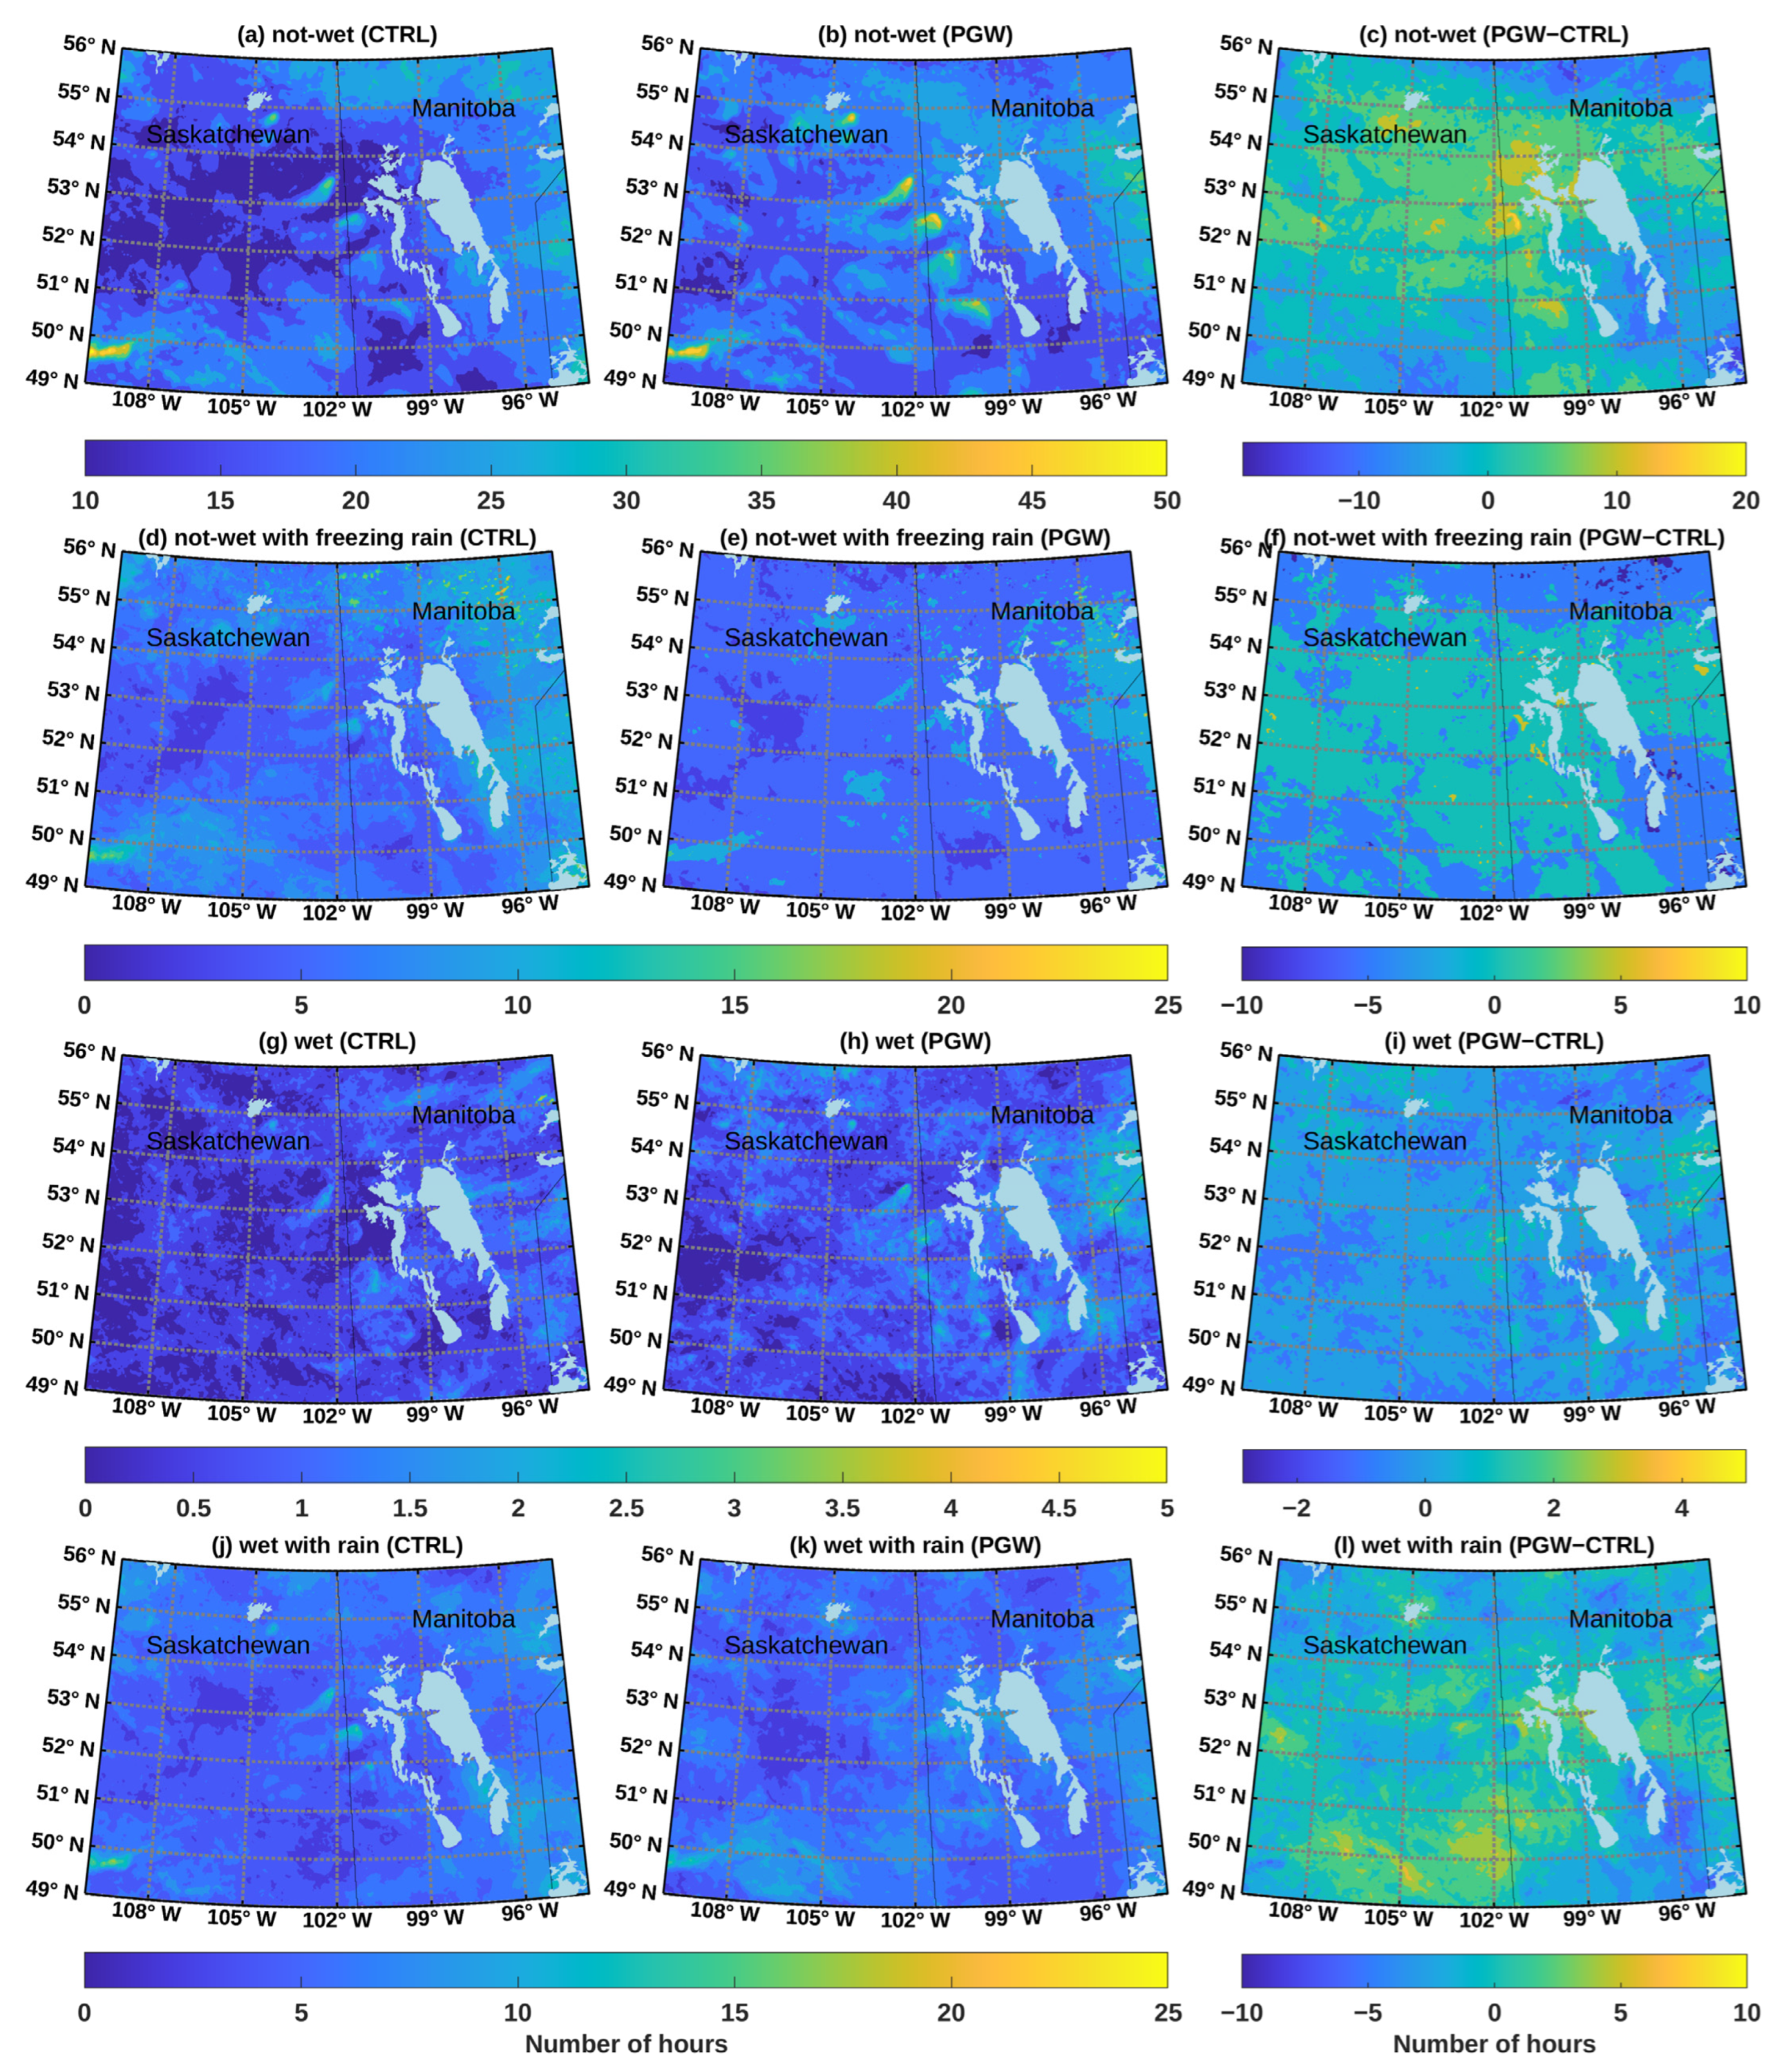
There are large spatial variations in the occurrence of the different categories across the domain with CTRL (Figure 5). Cypress Hills experiences some of the highest values for all categories except wet/sticky. High values of all categories also occur near and within the Manitoba Escarpment and in different areas on the eastern side of the domain. Lowest values generally occur within the central and western parts of the domain for all categories, and the highest ones occur in varying locations.
Similar patterns occur under PGW, although values change somewhat. There are still large values of all categories except wet/sticky in the Cypress Hills, and not-wet/sticky is more prominent near and within the Manitoba Escarpment (up to 45 h). Between CTRL and PGW, wet/sticky with rain shows the largest increase (up to 6 h) in southern Saskatchewan. All categories show decreases in several areas within the domain, with the largest values being approximately 6 h.

4.2.2. Amounts

The amount varies substantially across the domain (Figure 6). Highest values occur in the Cypress Hills (up to 80 mm), but a large area experiences values of only approximately 20 mm.
In PGW, the highest values of approximately 80 h still occur in the Cypress Hills, but comparable values occur near and within the Manitoba Escarpment. There are still large areas with approximately 20 mm, but their extent is less than in CTRL. In general, there is an overall decrease in the amount in the southern and northern areas and an increase in the central areas.
The spatial patterns of amount within the different categories are similar to their occurrence pattern (Figure 5). Although not shown, the largest amount is associated with not-wet/sticky (approximately 50 mm) in the Cypress Hills, but this category only produces approximately 10 mm in some areas within Saskatchewan, in particular. The higher terrain of the Manitoba Escarpment also exhibits high amounts in all categories. In PGW, the patterns are similar, although increases in amounts associated with the Manitoba Escarpment are more pronounced than those associated with the Cypress Hills.
Overall, changes between CTRL and PGW illustrate complex patterns of increases and decreases that also depend on category.

4.3. Temporal Patterns

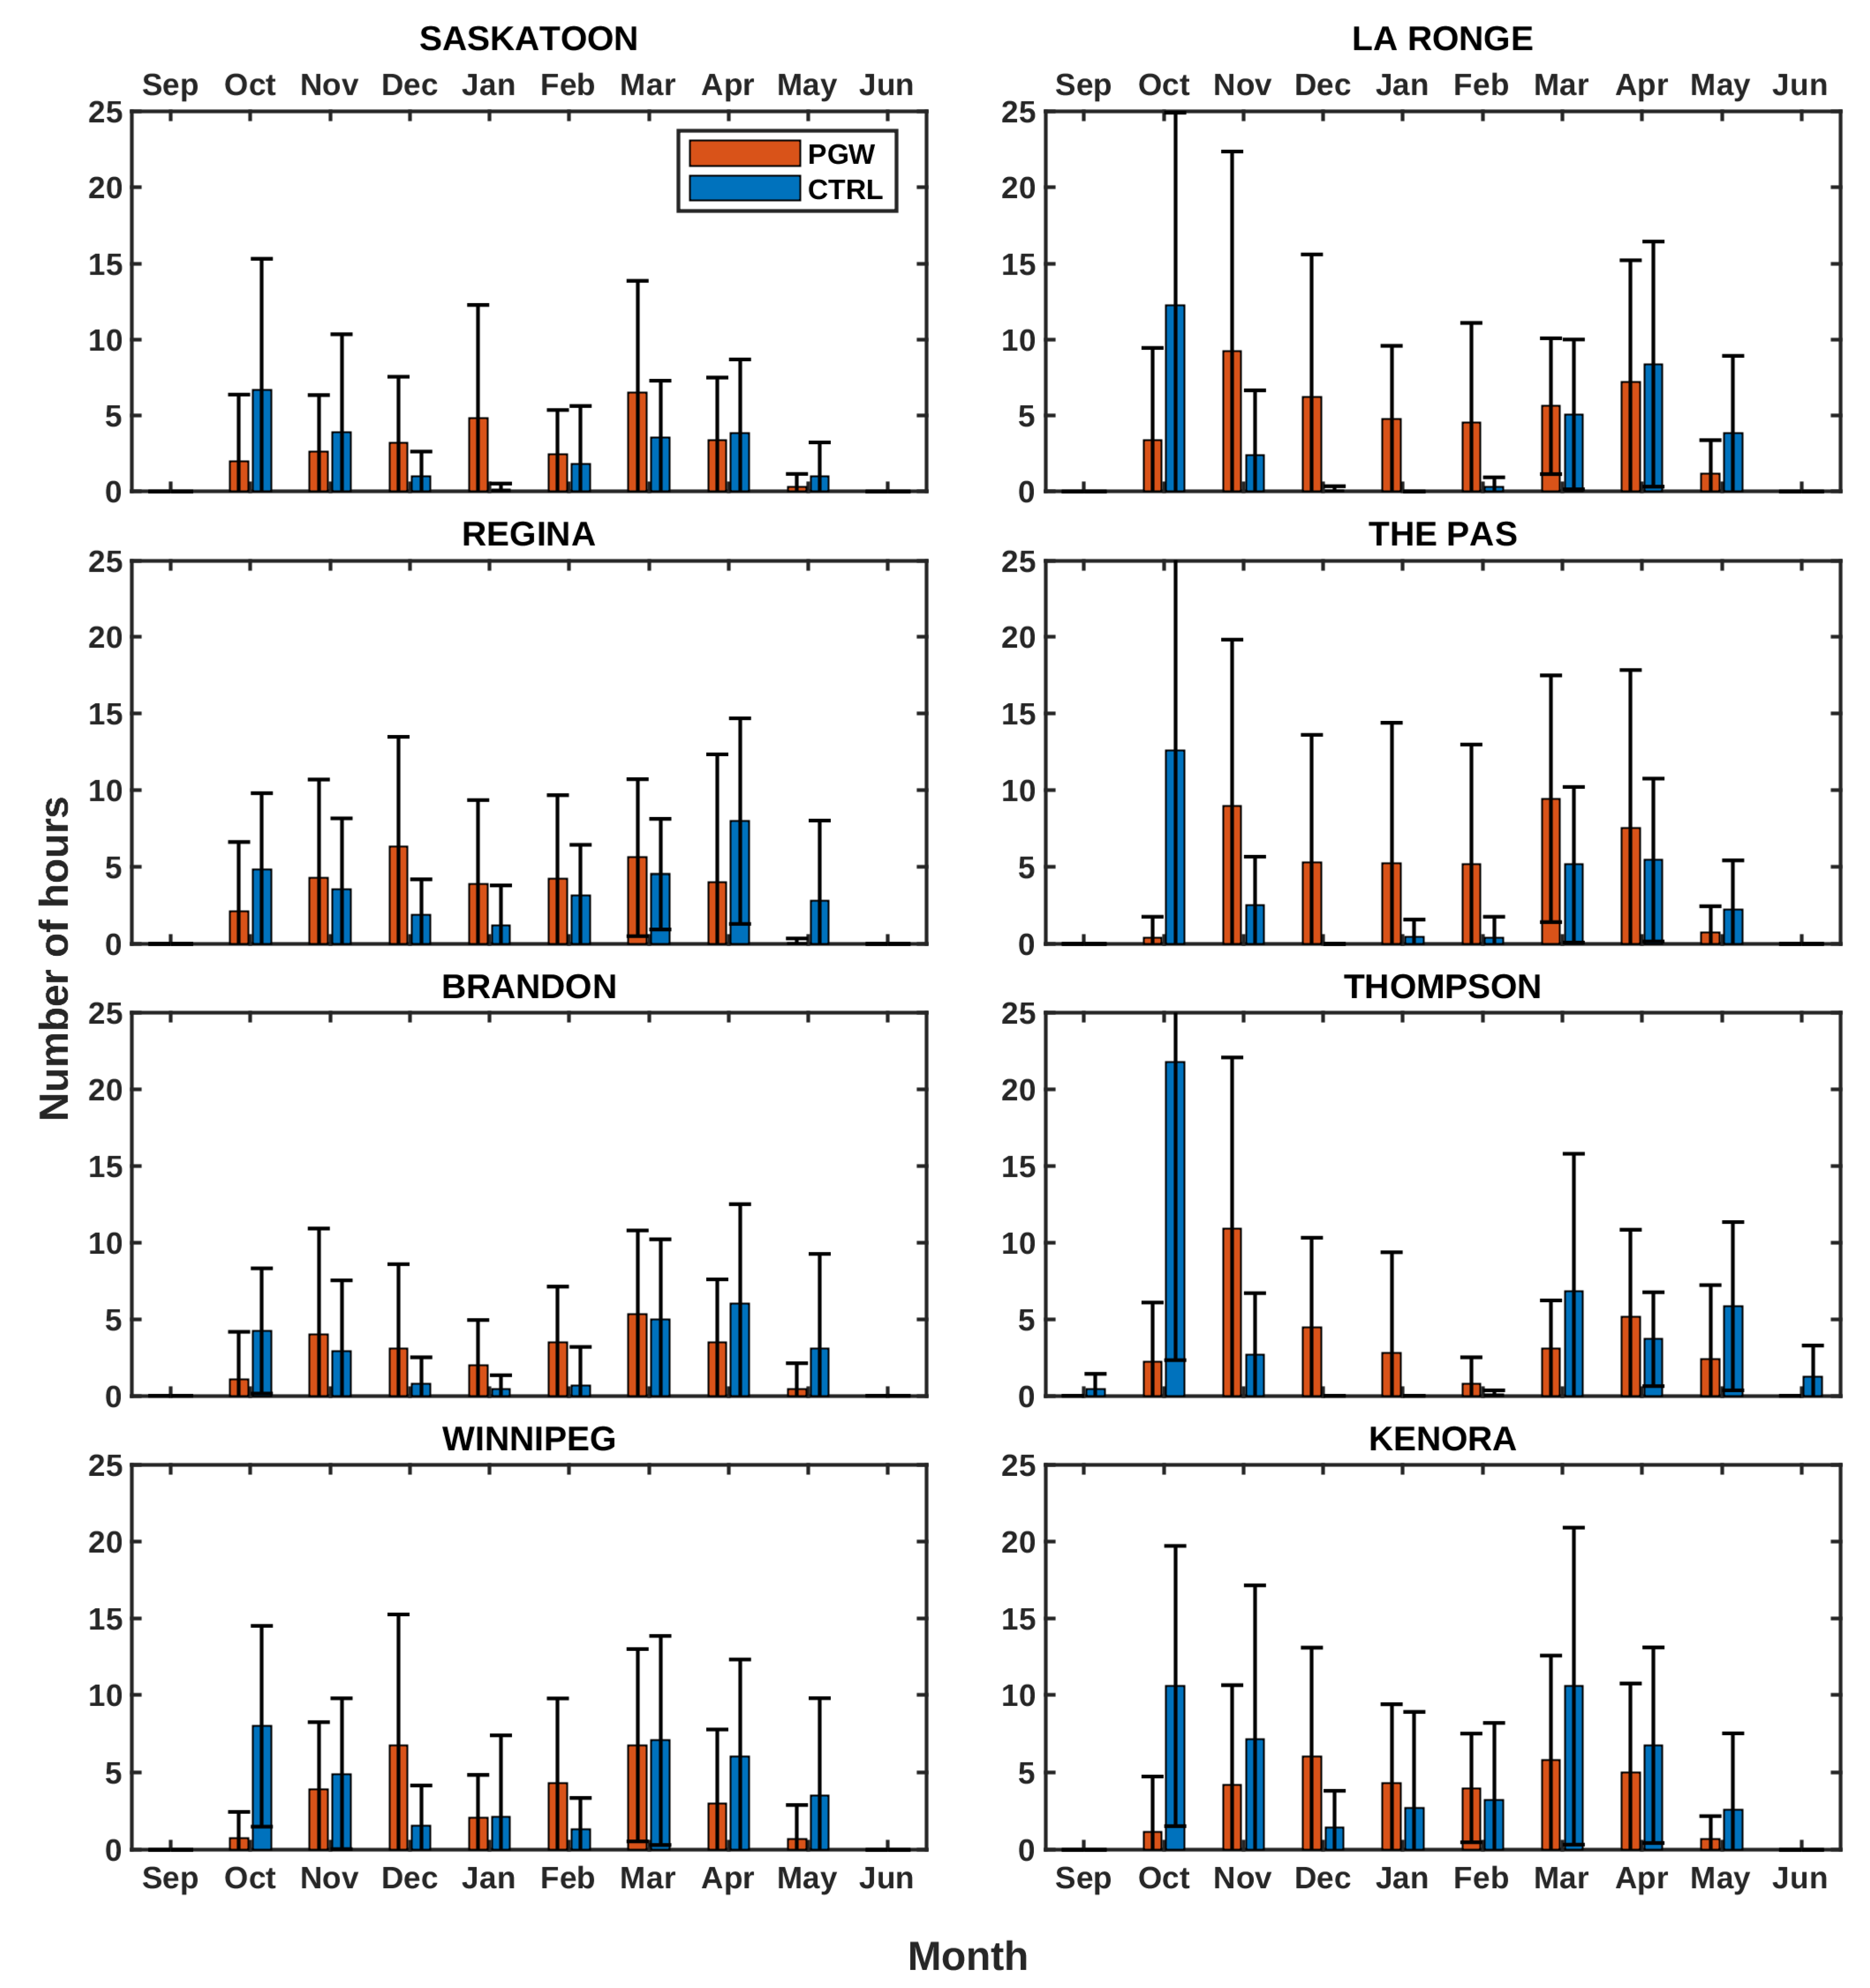
The temporal patterns of adhering solid precipitation occurrence are examined (Figure 7). The corresponding patterns for amount are similar and are not shown. In CTRL, the highest number of occurrences is generally in autumn (October) and spring (generally March or April). Mid-winter has a relative dearth of occurrences; it is too cold. Summer has an absence of them; it is too warm.
Within PGW, there is a dramatic change evidenced by a more even distribution of occurrence. This results from increases in mid-winter. October is no longer associated with the largest autumn occurrences; these now generally occur in November and December. At many locations, April is no longer associated with the largest number of spring occurrences; many now occur in March. Overall, the period with no adhering solid precipitation increases in the summer but is largely eliminated in mid-winter.

5. Events with Adhering Solid Precipitation

5.1. Number and Duration

Events containing adhering solid precipitation were investigated. As discussed in Section 2.3, an event is defined by the period over which adhering solid precipitation is continuously present. In CTRL, there are an average of 11 events per annum with an average duration of 3.0 h, although the average maximum duration is 17.7 h. In PGW, these values change somewhat. There are an average of 11.4 events, with an average duration of 3.2 h, but with an average maximum duration of 19.2 h. Overall, there are slightly more events and these last slightly longer.
However, there are large variations from average conditions across the domain (Figure 8). The largest number of events is in the Cypress Hills (approximately 25), which also has the highest frequency of occurrence and amount. The number of events also shows higher values (15–20 events) within and near the Manitoba Escarpment. A large area of the domain, nonetheless, only experiences approximately five events annually. The overall pattern is similar in PGW. There are differences, however, with increases (up to five events) mainly being an area across the middle of the domain, and with decreases (up to five events) mainly being in the corners of the domain.
Figure 8 also shows the average duration of events. In CTRL, the longest durations are in the northern parts of the domain, with values approaching 4.5 h. Large areas are characterized by values of approximately 2.5 h. In PGW, the longest durations mainly occur in elongated areas, mainly within the central part of the domain, with values typically being 3.5 h. This area is associated with the largest increases from CTRL (up to 2.0 h), whereas the largest decreases (approximately 1.0 h) generally occur in the corners.
Additionally, Figure 8 shows maximum duration. Overall, its pattern is similar to that of average duration. However, maximum duration is not linked as closely to terrain features as are the number of events and their average duration. For example, the maximum overall duration in CTRL (approximately 40 h) occurs in the northeastern corner of the domain, although some areas of high values in PGW (approximately 50 h) are associated with the Manitoba Escarpment.

5.2. Amount and Duration

Over the domain in CTRL, there is an average of 2.1 mm per event, although the average maximum value is 23.1 mm. In PGW, the average does not change, but the average maximum value decreases slightly (−5.6%) to 21.8 mm.
Figure 8 shows the maximum amount within events across the domain. Within CTRL, some of the highest maximum values (approximately 80 mm) are linked with the Cypress Hills and Manitoba Escarpment, but other areas exhibit similar values. Within PGW, values linked with the Cypress Hills are less pronounced, but those linked with the Manitoba Escarpment are enhanced (to approximately 100 mm). Note that the average amount within events in both CTRL and PGW only varies across the domain from approximately 1.5 mm to 3.5 mm, with the higher values generally occurring in the same areas as the maximum values.
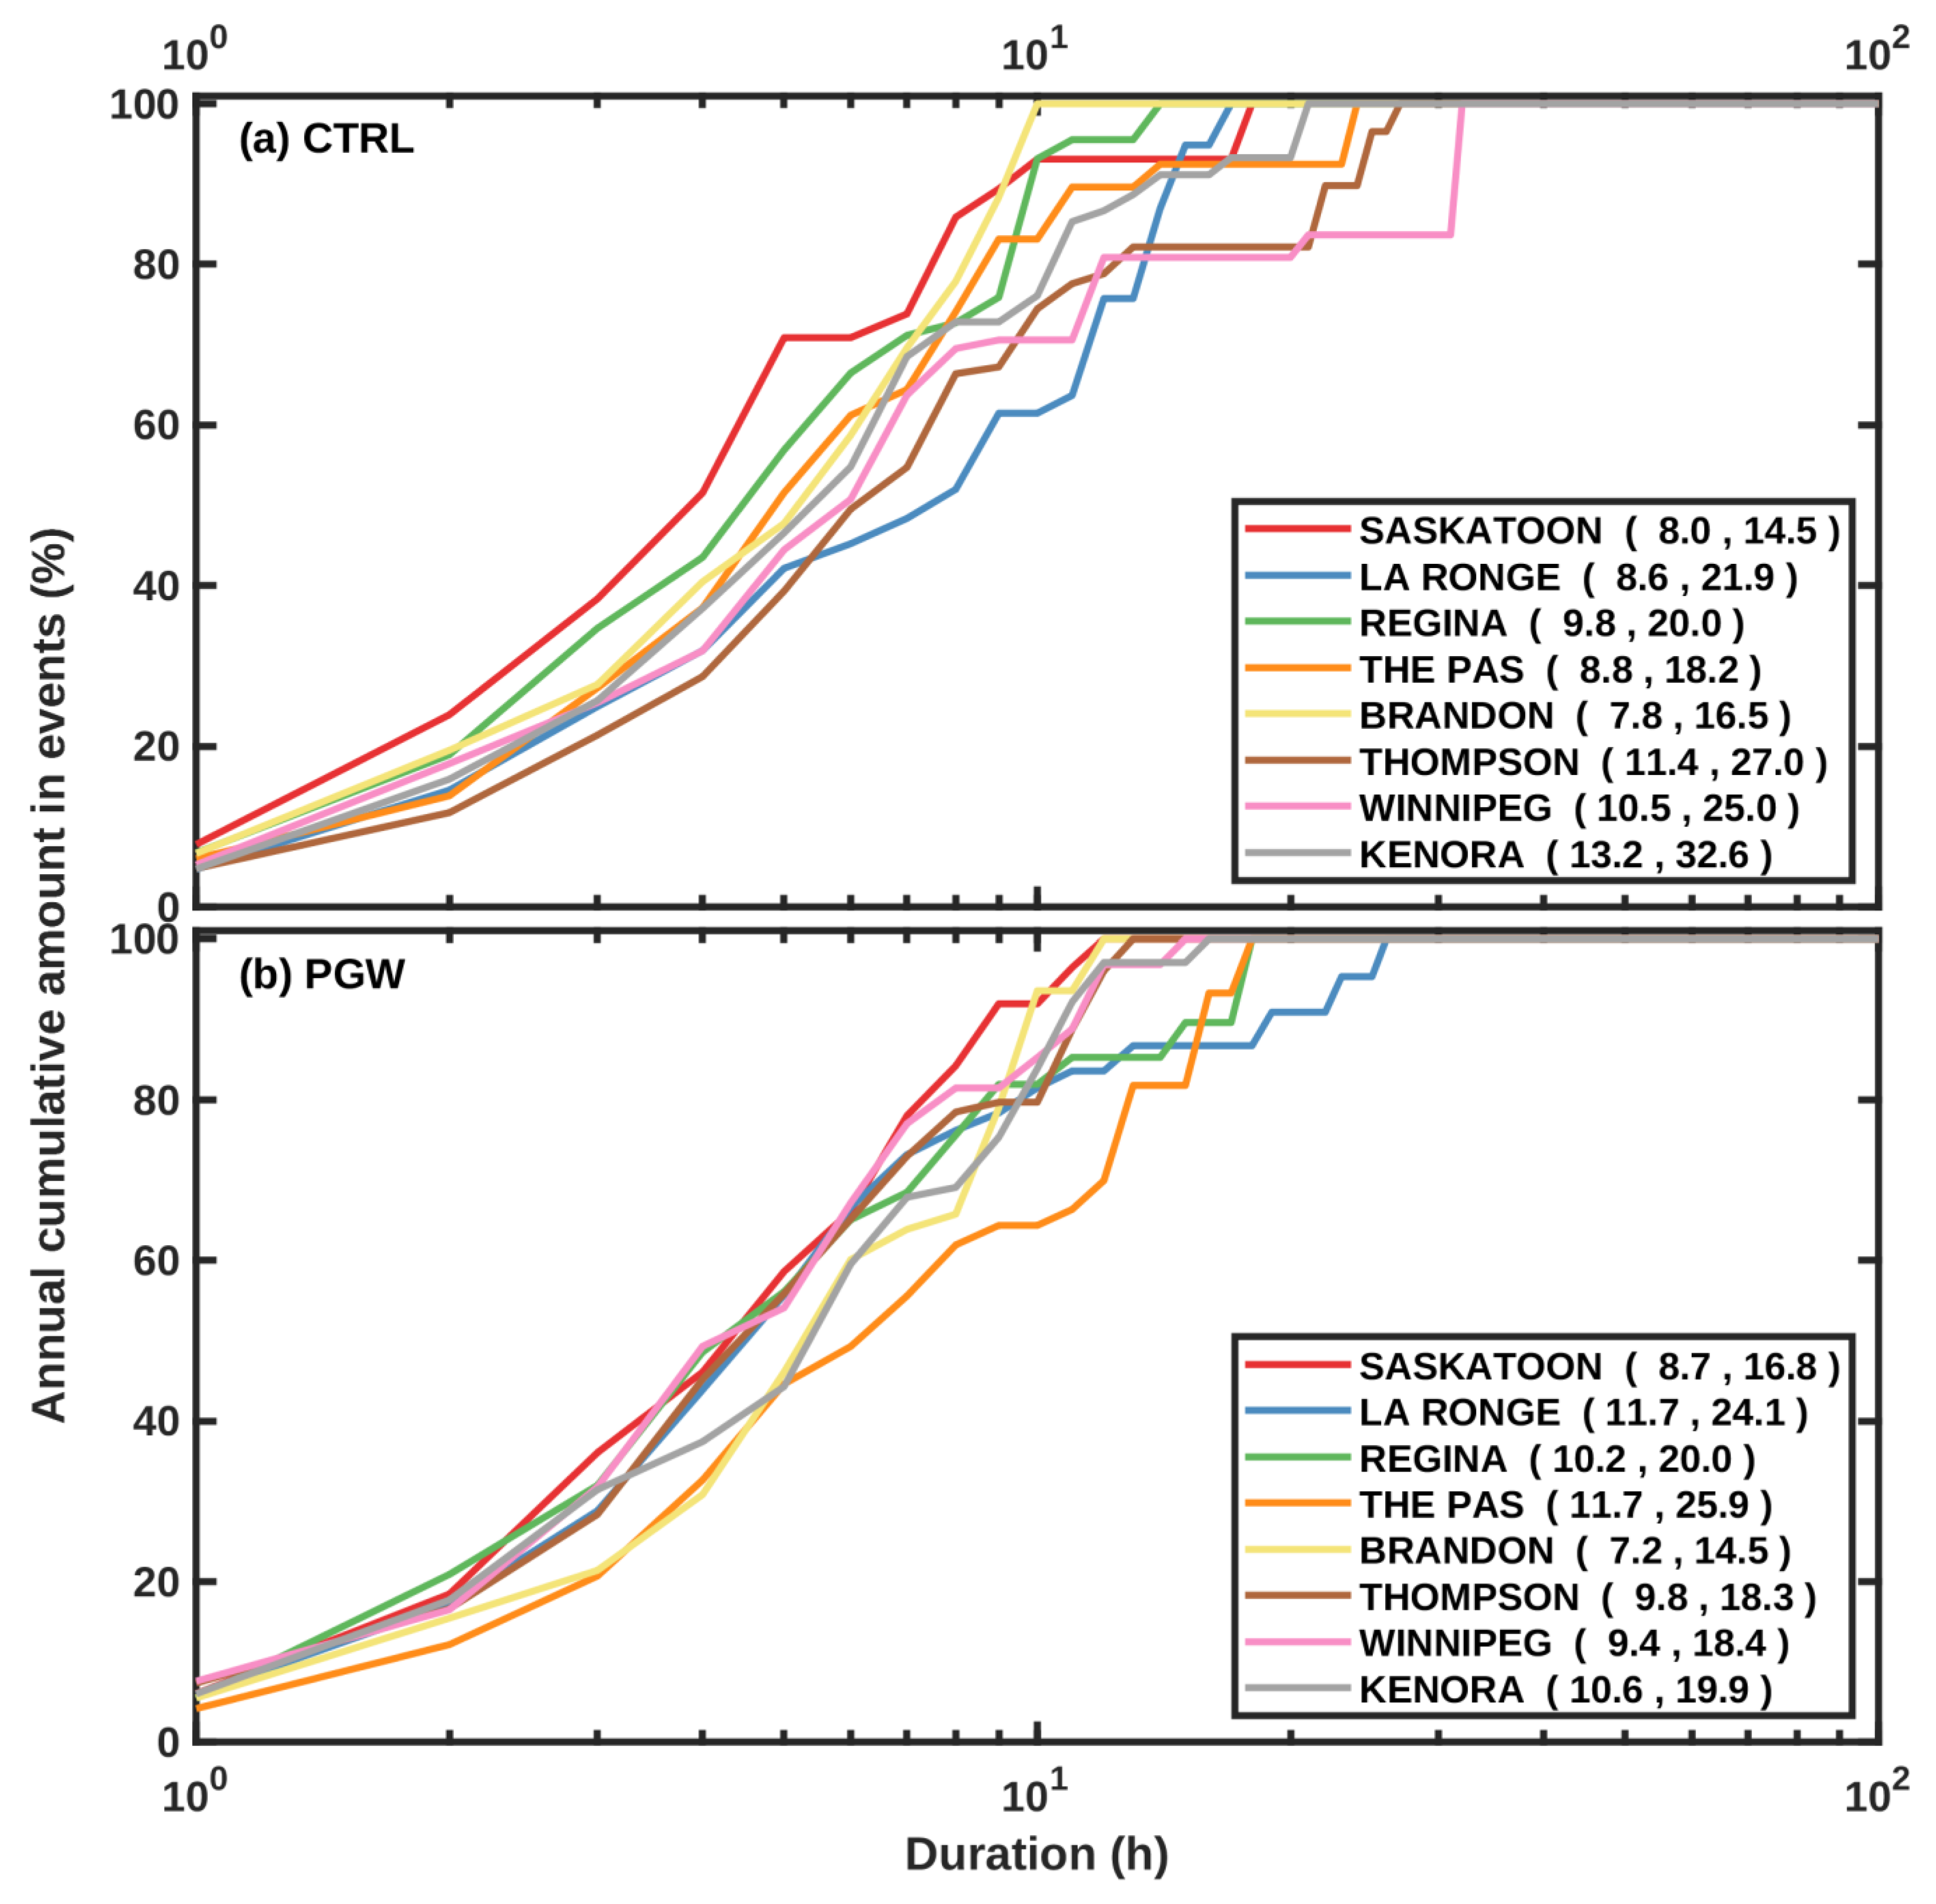
Figure 9 shows the cumulative average annual amount as a function of the average duration at the eight stations. Within CTRL, events lasting from 3.9 h (Saskatoon) to 7.5 h (La Ronge) account for 50% of the overall amount. There is a tendency for the overall amount to directly depend upon the average annual number of events and the occurrence of long-duration events. For example, Brandon (16.5 mm) experiences 7.8 events, with the longest duration being 10 h, whereas Winnipeg (25.0 mm) experiences 10.5 events, with the longest duration being 32 h. However, there are several exceptions, such as Saskatoon (14.5 mm) experiencing 8.0 events, with the longest duration being 18 h. These features largely persist within PGW. The 50th percentile lies between similar values (4.2 h to 6.1 h) and the overall amount still only depends somewhat upon the number of events and the occurrence of long-duration events.

5.3. Longest Duration Events

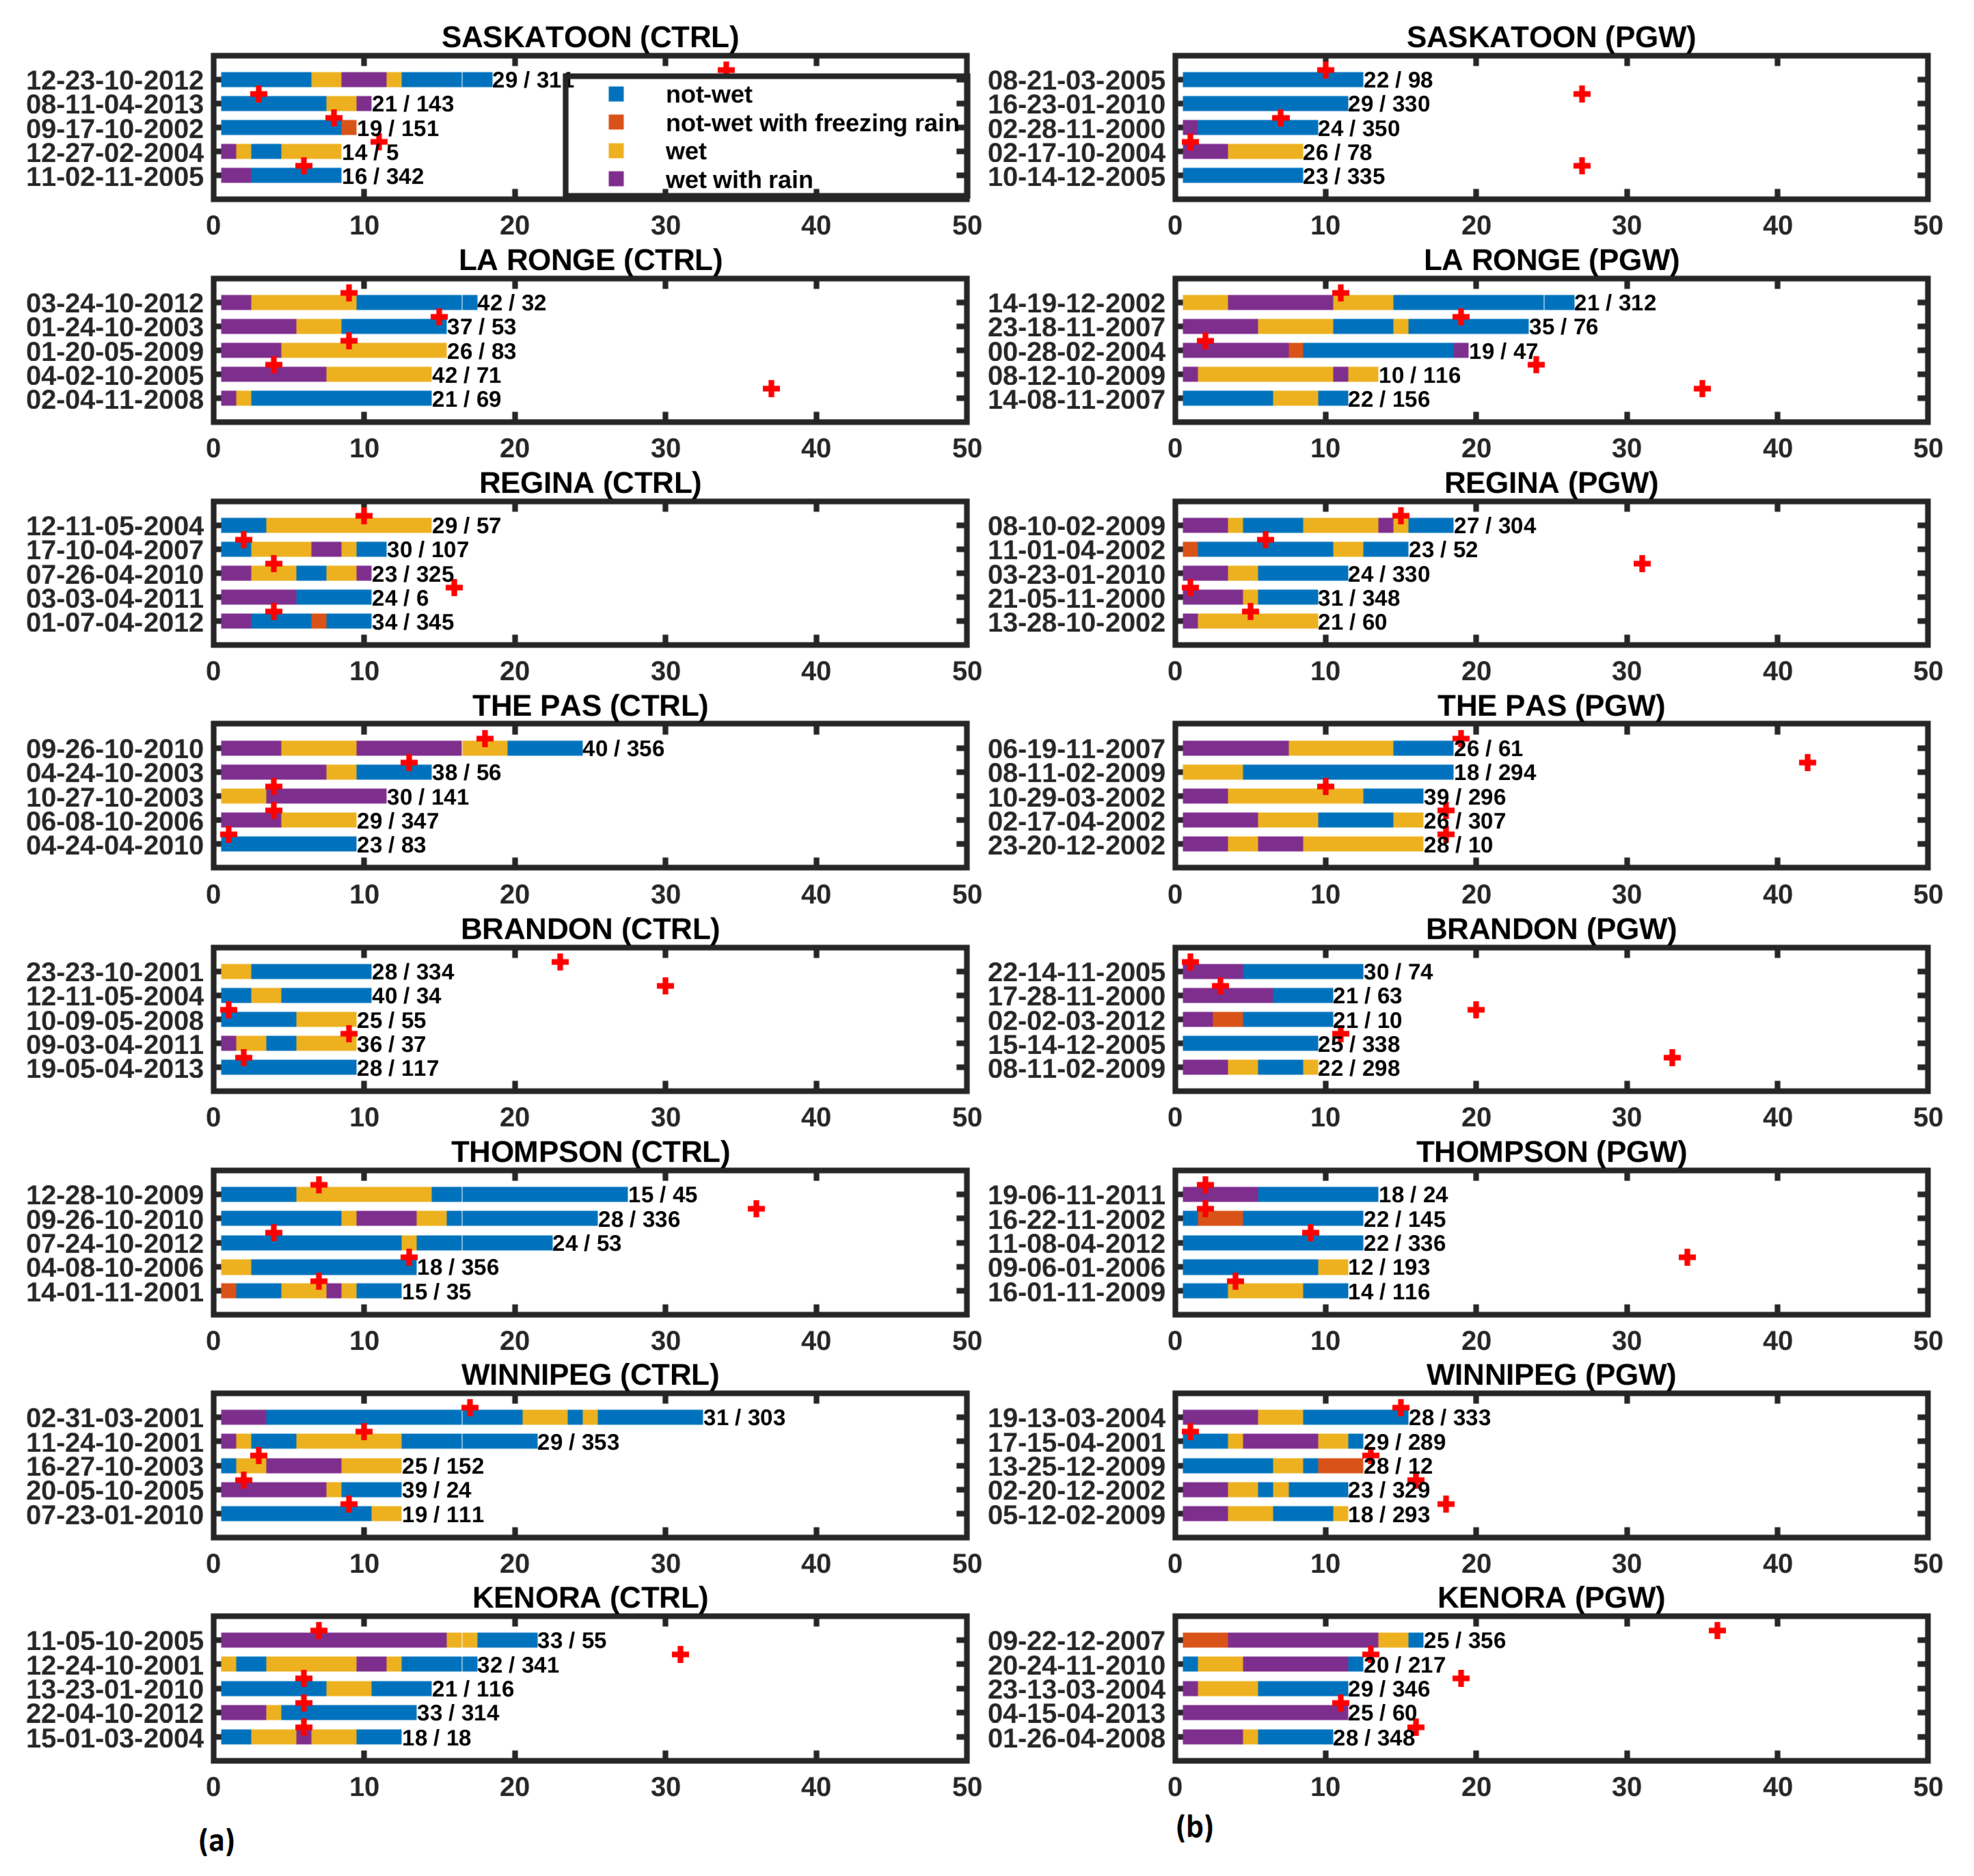
The five longest duration events are examined for each station (Figure 10). These last for at least 8 h in both CTRL and PGW, and their timing illustrates distinct patterns. Within CTRL, most events occur in October (50%), followed by April (20%), and only 6% occur mid-winter (December to February). Six of the stations experience these events in both spring and autumn, except for Regina that only experiences them in spring and Thompson that only experiences them in autumn. In PGW, most events now occur one month later in November (22%), but the second highest occurrences are still in April (12%). Additionally, 30% occur mid-winter, and all stations experience events in both spring and autumn.
Events may be composed of different categories and, to illustrate this, the occurrence of categories within the longest duration events was examined (Figure 10). Except for two events in CTRL and five in PGW, all events have more than one category. However, the fractional occurrence of categories varies between events and between CTRL and PGW, although not-wet/sticky is most common and it occurs within every event. In one event, a PGW one at Kenora, all four categories occur.
There are also different patterns in the evolution of categories within events. Many begin with not-wet/sticky, although several begin as wet/sticky, sometimes with rain and, in some events, the final category is the same as the initial one. In CTRL, two events are characterized by six changes in category (02-31-03-2001 Winnipeg and 12-24-10- 2001 Kenora). Similar patterns occur within PGW, and one event even has seven changes in category (08-10-02-2009 Regina). Overall, there are numerous category evolutions within these long-duration events in both CTRL and PGW.

6. Interpretation and Related Features

6.1. Precipitation Amount Perspective

Broad spatial patterns of adhering solid precipitation are evident within the preceding results. Along a band near the southern portion of the domain, values are high on the western edge, dip in the central area, and increase towards the eastern edge. There is a general decrease north of this band, at least over the western portion of the domain, and values generally increase towards the northern edge of the domain. Some of these patterns are linked with topographic features, as discussed in Section 6.3. Such patterns are consistent with those considering all precipitation. According to [32], the average annual precipitation increases eastward, near the southern portion of the domain (Figure 1), from 385 mm at Regina in the central area to 842 mm at Kenora near the eastern edge; values north of these locations are similar or lower, such as 380 mm at Saskatoon; values near the northern edge increase with values of 606 mm at La Ronge and 630 mm at Thompson.
The amount of adhering solid precipitation, nonetheless, represents just a small fraction of the annual amount of all precipitation. Relative to average annual values, its fraction varies from as low as 2.9% at Brandon to only as high as 5.1% at Regina. Fractions are much higher for the months of October, March, and April, when adhering snow is most common (Section 4.3). These fractions are above 11% at all locations and range up to 34% at Thompson in October.
It is not surprising that the overall patterns of adhering solid precipitation do not change dramatically from CTRL to PGW (Figure 7). This approach forces the large-scale circulation to remain the same, so storm tracks will as well. However, under warmer conditions, the storms producing adhering solid precipitation over a particular area cannot be the same ones as in CTRL. As shown by [24], storms producing adhering snow over a particular area within PGW often just produce snow at colder temperatures within CTRL and as implied in Section 4.3, they occur more often towards mid-winter than in CTRL.

6.2. Storm Feature Perspective

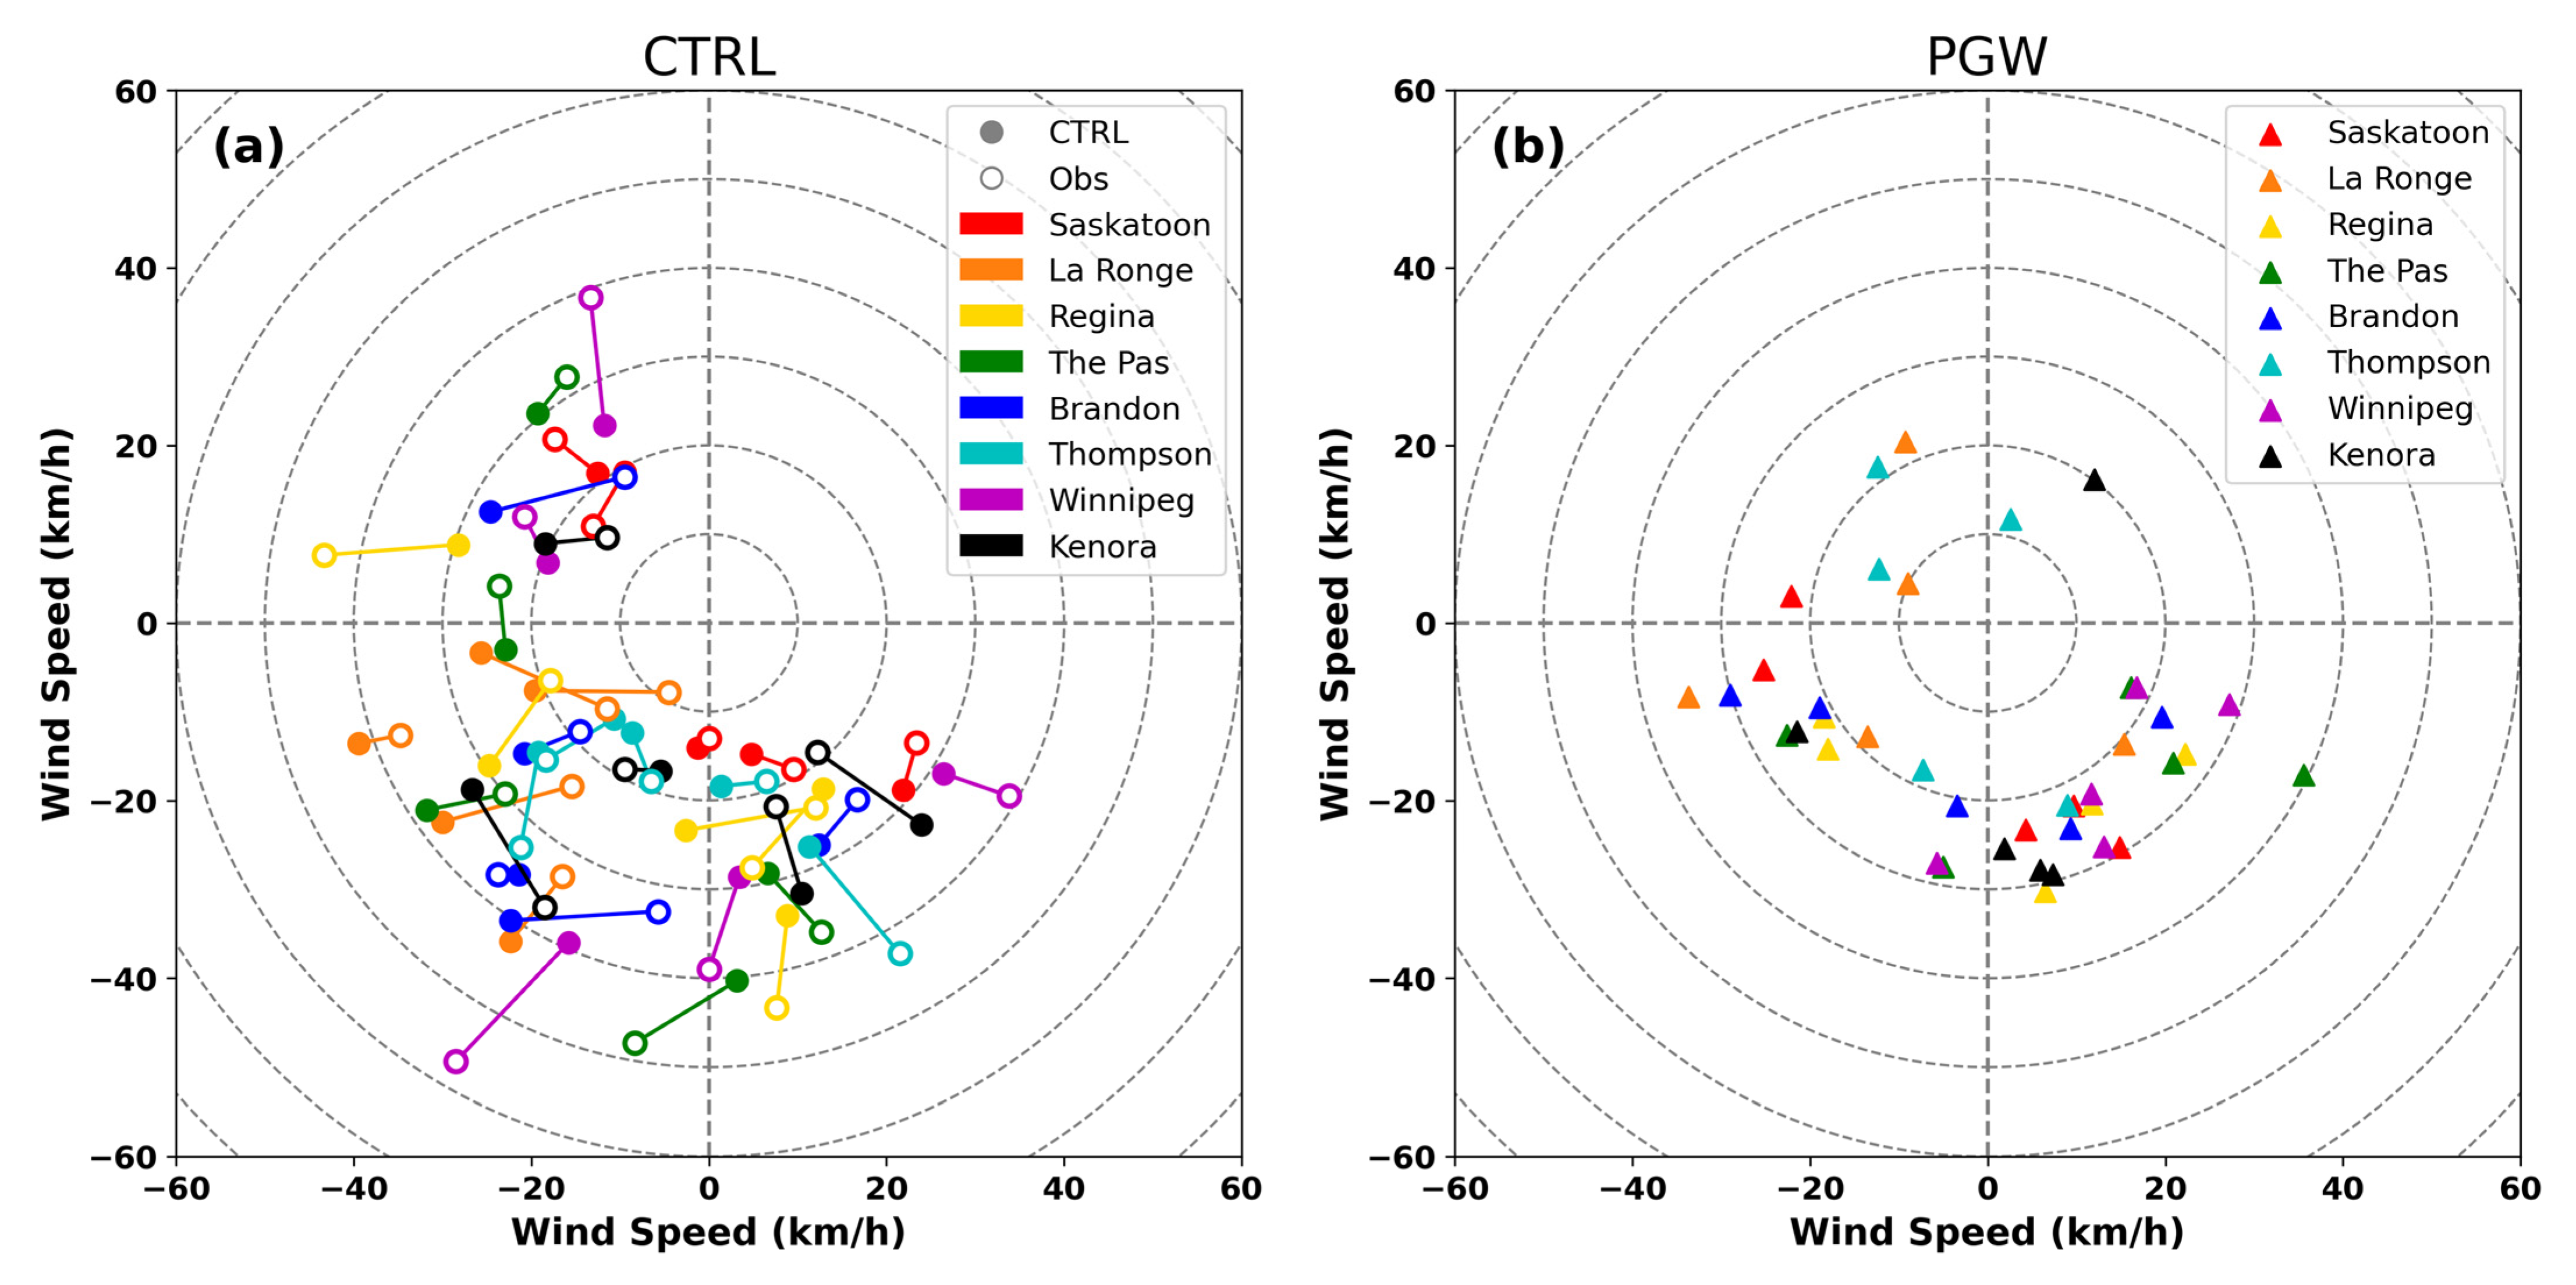
A critical aspect of many events is the associated wind. An evaluation of CTRL capabilities to simulate wind was first carried out (Figure 11) using the strongest winds occurring during the top five duration events, or within 24 h of their cessation (Figure 10). CTRL values agree very well with the observations and can therefore be used for further analyses.
Northerly flows dominate the strongest winds during or within 24 h of the cessation of the events (Figure 11). In CTRL, these characterize 80% of the events and, of these, 60% have an easterly component. Within PGW, similar patterns are evident, although there is more variation. Nonetheless, 82% of these winds are northerly and, of these, 39% have an easterly component.
Although not shown, winds at the beginning and ending of these events reveal consistent patterns. Northerly flows dominate when considering winds at the beginning of the events: 75% (85%) are northerly in CTRL (PGW) and, of these, 90% (74%) have an easterly component. Additionally, wind shifts between the beginning and ending of these events generally show surface backing. Within CTRL (PGW), 85% (68%) illustrate this characteristic, which implies low centres tracking to the right of stations. Collectively, the dominance of northerly or northeasterly winds and surface backing would suggest that the associated low centres are generally situated to the south and/or east of the stations.
These findings are consistent with previous studies and reports. As discussed in the Introduction, three studies of such events have been carried out over this region [2,23,24]. In all of these, storms producing the adhering solid precipitation tracked to the right of locations, and always to their south and/or east, and consequently produced northerly and/or easterly winds. As discussed in Section 2.1, Environment and Climate Change Canada (ECCC) annually chooses the country’s top 10 weather stories [33]. Five of these were associated snow occurring near 0 °C over the study region (12 October 1998; 2 November 2000; 11 May 2004; 29–30 April 2011; 29–30 September 2019). All of these also tracked to the right of locations affected by this precipitation and, in particular, to their south and/or east.

6.3. Topographic Effects

As shown in Section 4 and Section 5, elevated terrain affects the occurrence and amount of adhering solid precipitation. Both these features are either at their highest values, or near highest, over elevated terrain within CTRL and PGW. To illustrate the impacts of terrain, two of the higher terrain features were selected. These are the Cypress Hills in southwestern Saskatchewan and Riding Mountain in western Manitoba (Figure 1).
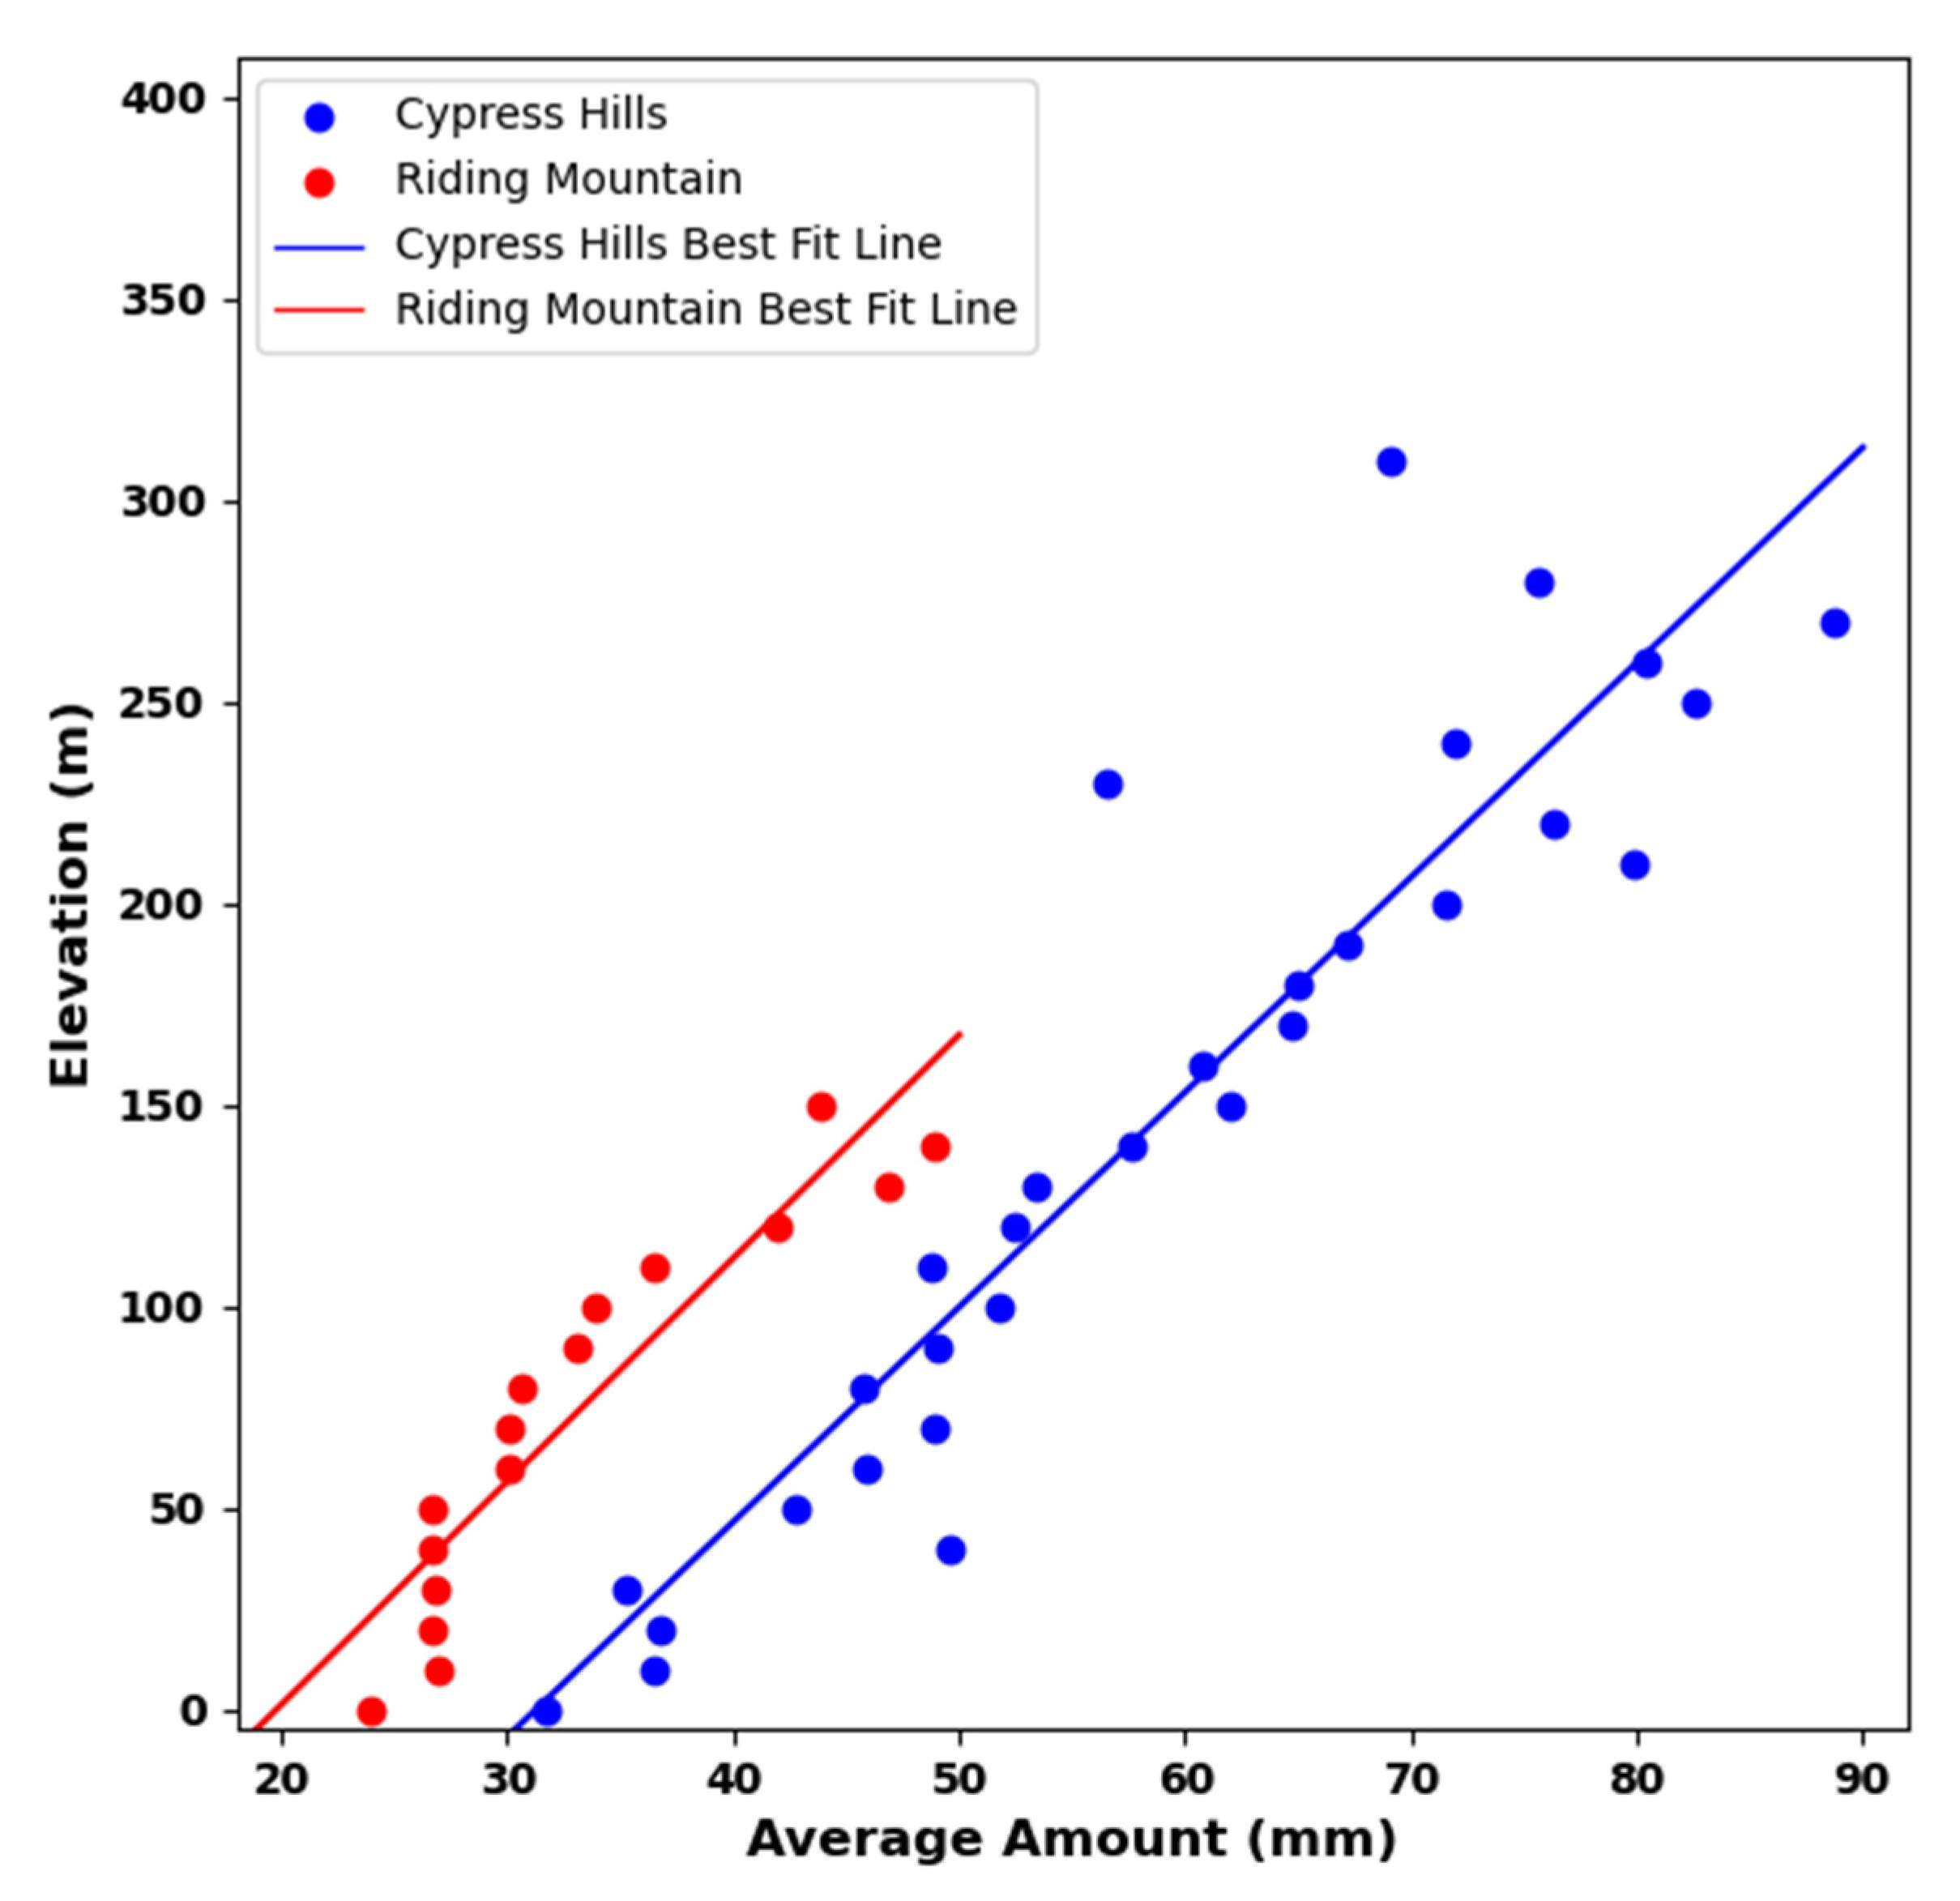
The amount of adhering precipitation around and over these features was investigated (Figure 12). The precipitation gradients up these terrain features were determined by computing averages every 10 m of elevation in areas encompassing them (Figure 1). There is no variation of precipitation amount with elevation over the lower portions of these features, but there is a near-linear increase with elevation over the upper portions. Within CTRL, over the upper 310 m of Cypress Hills, the gradient (with r2 of 0.85) is 19 mm/(100 m), whereas over the upper 150 m of Riding Mountain, the precipitation gradient (with r2 of 0.86) is 18 mm/(100 m). Although not shown, the near-linear increase is maintained within PGW, and gradients are similar, although it decreases (with r2 of 0.87) to 17 mm/(100 m) for Cypress Hills and increases (with r2 of 0.74) to 24 (100 m) for Riding Mountain.
Both higher and lower precipitation gradients occur in other regions. [45] found a gradient of 39 mm/(100 m) within a section of the Canadian Rocky Mountains, and [46] found a gradient of 100 mm/(100 m) in annual precipitation over the Cypress Mountain in the coastal mountains of British Columbia. The adhering solid precipitation gradients are 20–50% of these values, even though these latter ones include all types of precipitation. In contrast, [47] found a gradient of only 2.4 mm/(100 m) in cold season precipitation in west-central Alberta, on the eastern slopes of the Rocky Mountains. The adhering solid precipitation gradients are in order of magnitude higher.
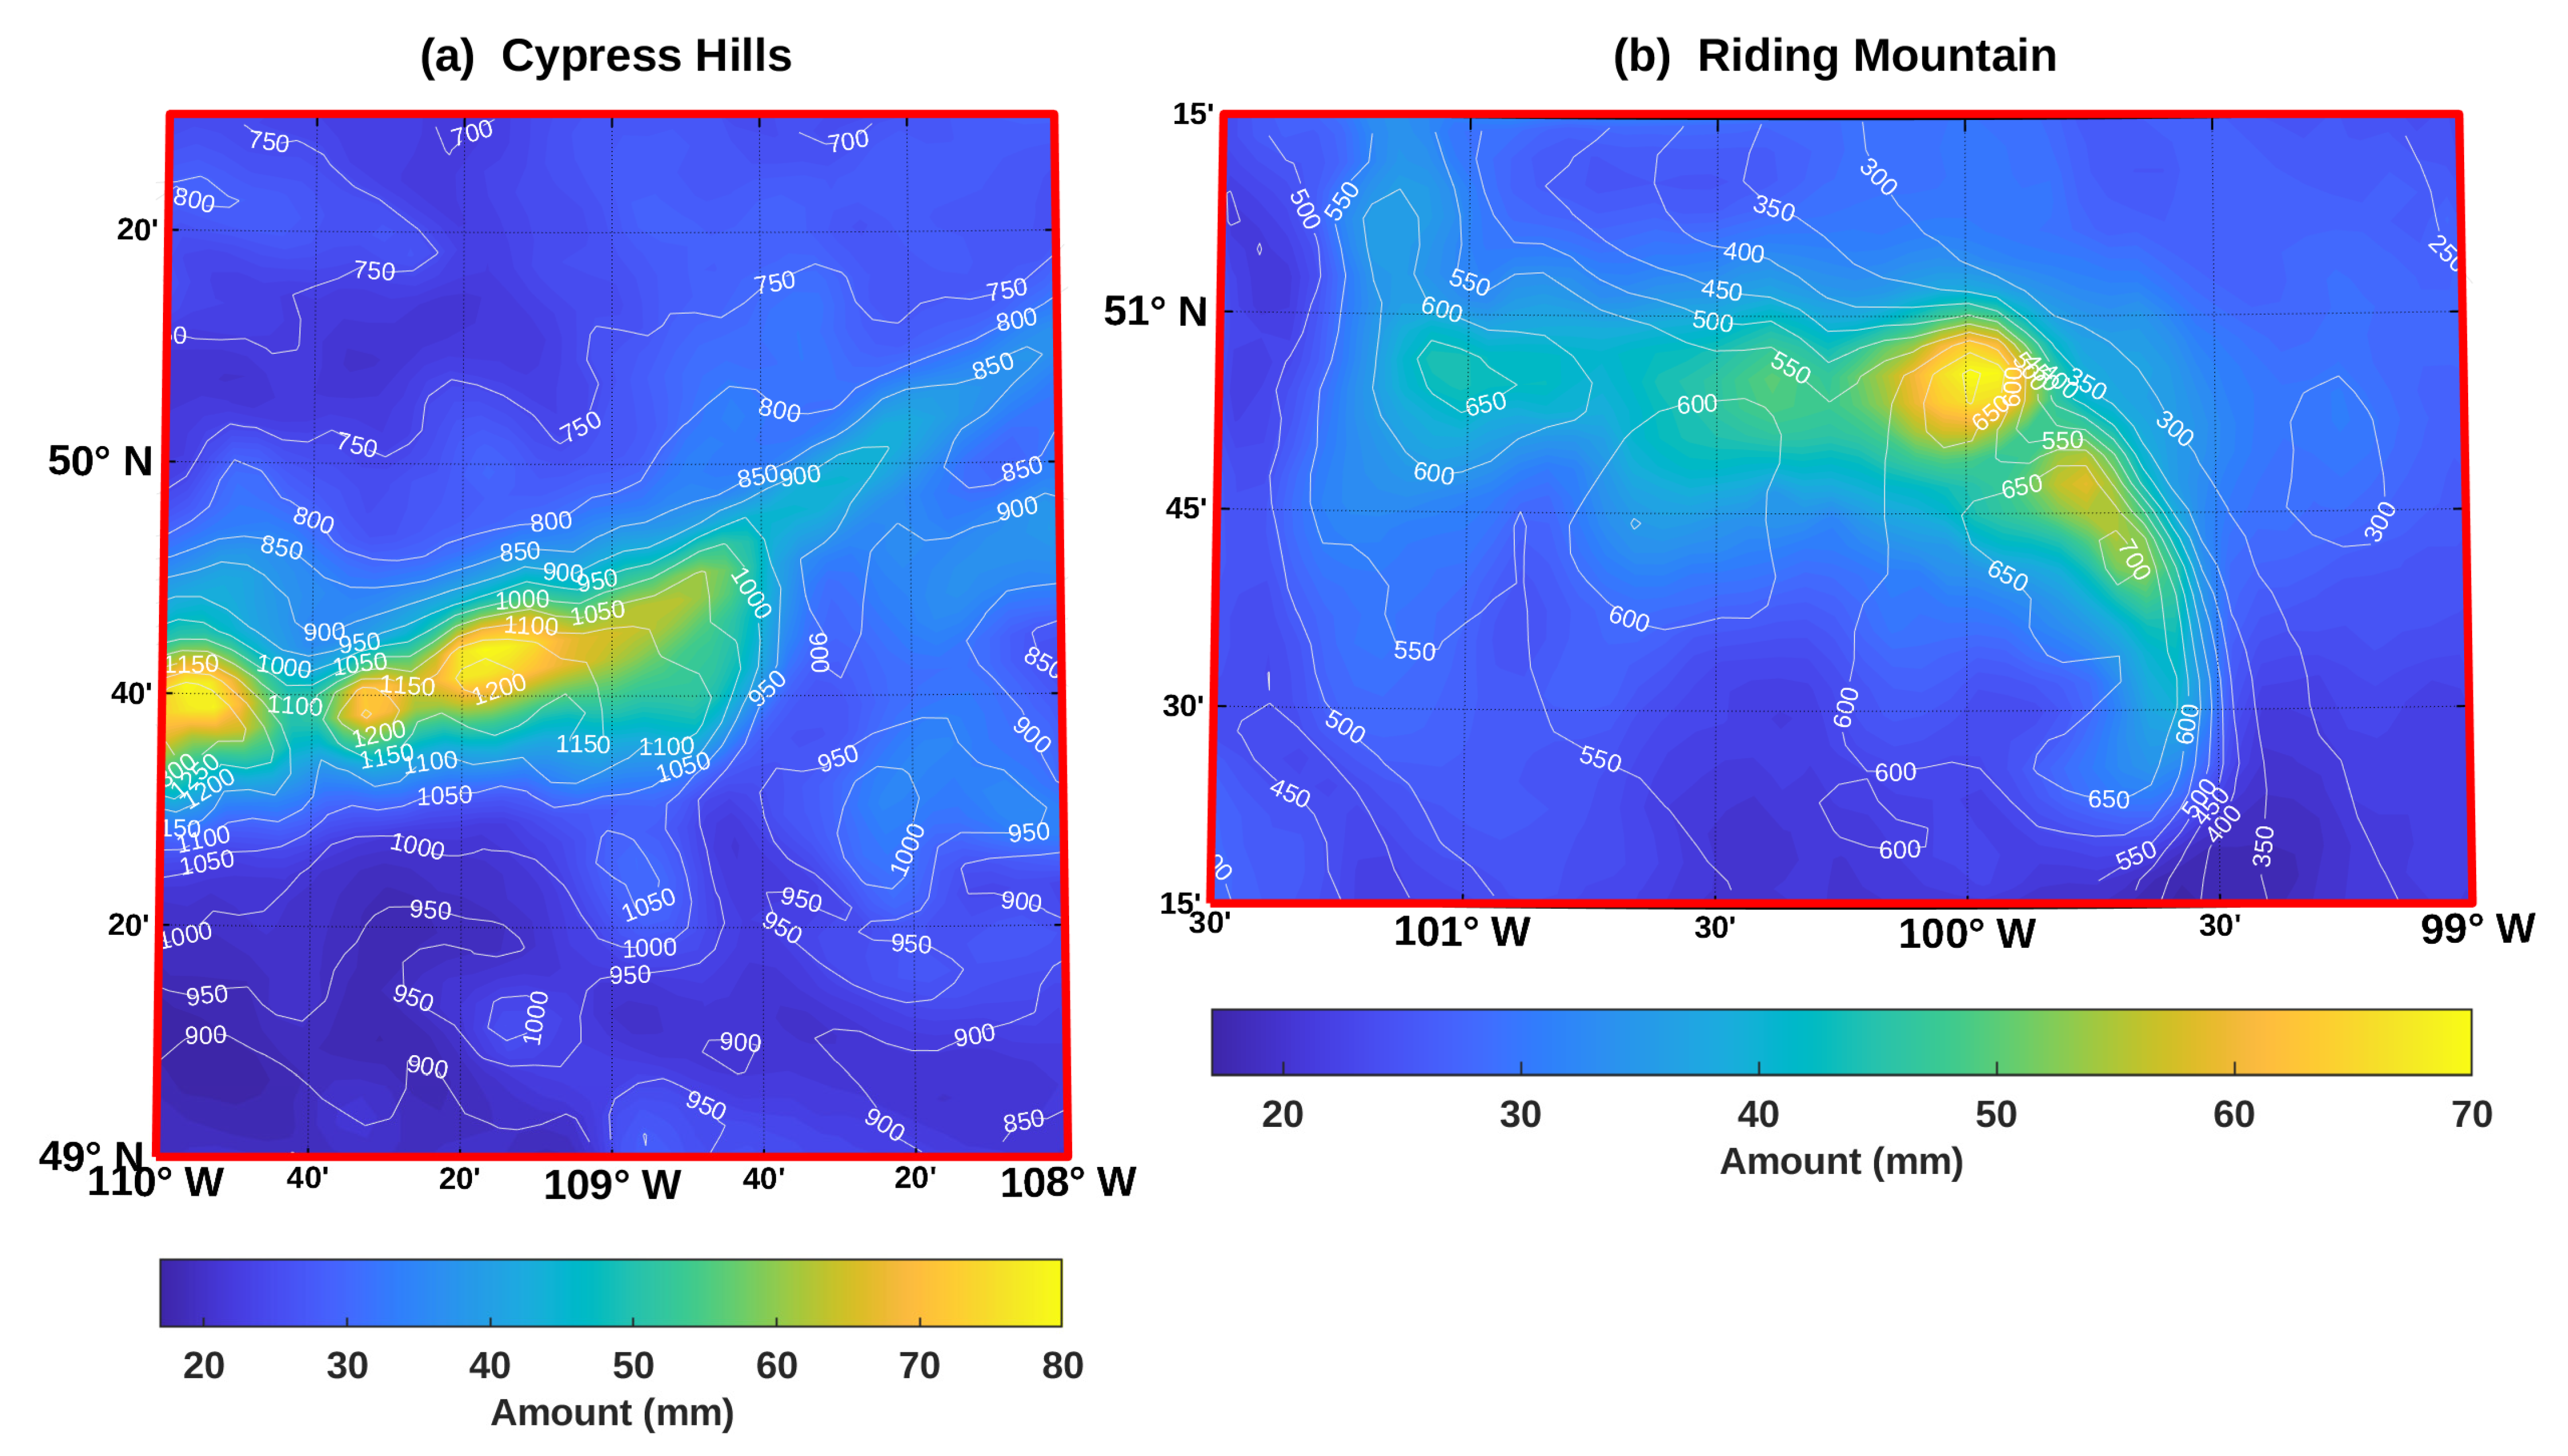
The spatial distribution of adhering solid precipitation also shows a consistency over these terrain features. Although more dramatic over Riding Mountain, the highest precipitation amounts are biased to occur on their northern or eastern flank in both CTRL (Figure 13) and PGW. This is consistent with the dominating northerly or northeasterly flows (Section 6.2) impinging on this terrain.

7. Implications

Although a detailed examination of adhesion onto infrastructure and vegetation is beyond the study’s scope, some inferences can be made.

7.1. Adhesion, Categories, and Winds within Events

Adhering solid precipitation can lead to major impacts, although its severity depends upon which categories are occurring. For example, precipitation in the two ‘wet’ categories (Section 2.3) undoubtedly adheres more effectively than precipitation in the ‘not-wet’ category, as discussed by, for example, [8]. However, 28.9% (25.6%) of the not-wet/sticky precipitation’s occurrences are accompanied by freezing rain within CTRL (PGW); this combination would readily adhere to surfaces.
In addition, as discussed in Section 5.3, long duration events normally contain more than one category, their ordering varies, and liquid may occur simultaneously. Accretion models need to be very sophisticated to be able to handle such characteristics, due to the consequently varying adhesion efficiencies, latent heat exchanges, and character of the accumulating solid precipitation on structures.
Wind also has a major impact on adhesion by enhancing the drag experienced by structures and vegetation. To examine this issue, the strongest winds were found during or within 24 h of the cessation of the longest duration events (Figure 10 and Figure 11). These strong winds often occur in both CTRL and PGW after the precipitation has been falling for some time or after it has finished. For example, within CTRL (PGW), strongest winds occur in 38% (68%) of events after 10 h of adhering solid precipitation and, in 20% (40%) of events, they occur after all this precipitation has fallen. In addition, as evidenced in Figure 10 and Figure 11, directions of these winds often have a northerly or northeasterly component. For perspective, [2] found that the strongest and northerly winds occurred after 20 h of continuous adhering solid precipitation within one very damaging event over Manitoba. Overall, these findings imply that substantial adhesion onto surfaces may generally occur before the strongest winds, often with a northerly or northeasterly component.

7.2. Electrical Transmission Lines and Vegetation

One type of infrastructure vulnerable to adhesion is electrical transmission lines. A considerable amount of research has examined this complex issue [6,8]. The eastern Prairie domain of this study (Figure 1) is laced with electrical transmission lines of varying voltages, and these are aligned in all directions. It is expected that lines passing through the highest occurrences and largest amounts of adhering solid precipitation, overall and within specific events, are most adversely affected. Higher terrain areas are, consequently, particularly vulnerable. The most impacted lines would also be expected to be aligned perpendicular to the strongest winds. For the longest duration events, this implies that lines aligned east-west or northeast-southwest may be most affected.
The study region is also characterized by several ecosystems, including forests (Figure 1). In general, the forested area is dominated by deciduous trees on its southern edge, but conifers make up an increasing fraction northward. Deciduous trees are most prone to impact from adhering solid precipitation during their ‘leaf period’. There are wide year-to-year variations in the timing of both leaf emergence and leaf senescence, but these typically occur in May and October, respectively. As shown in Section 4.3, much of the adhering solid precipitation occurs in spring, generally highest in March or April, but still often substantial in May, and in the autumn, highest in October. May and October occurrences therefore coincide with the typical timing of leaf emergence and senescence. Deciduous trees are must often within their ‘leaf period’ when adhering solid precipitation occurs.
Deciduous leaf evolution is expected to change under future warmer conditions. It is generally assumed that spring leaf emergence should shift earlier, and autumn leaf senescence should shift later. However, there is considerable uncertainty as to the magnitudes of such shifts because, for example, leaf senescence’s timing does not just depend on temperature; it also depends on other variables, including precipitation [48] and CO2 levels [49]. As discussed in Section 4.3, periods with the highest occurrences of adhering solid precipitation also shift towards mid-winter. Collectively, a warmer climate does not necessarily reduce impacts from adhering solid precipitation on deciduous trees.

8. Concluding Remarks

Solid precipitation in cold conditions (snow, snow pellets, and ice pellets) that adheres to structures and vegetation often leads to devastating impacts. This study has examined the occurrence of this precipitation over much of the Canadian provinces of Manitoba and Saskatchewan. The study relied on high resolution (4 km) simulations (CTRL) over a 13-year period (October 2000 to September 2013), and on a future climate, following a pseudo-global warming assumption (PGW) with an average 5.9 °C temperature increase. This precipitation is considered to occur within the wet-bulb temperature range of −2 °C ≤ Tw ≤ 2 °C, and with a lower hourly threshold of 0.2 mm melted equivalent. This hourly threshold does not account for very low precipitation rates, so occurrences of adhering solid precipitation are lower than would be experienced in both CTRL and PGW. The ensuing analysis has led to several findings.
Adhering solid precipitation in CTRL, on average, occurs for 33.6 h and produces 27.5 mm per year, although the highest values reach approximately 80 h and 80 mm, respectively. Nearly half of this precipitation occurs with liquid either within it (wet snow) or separately (freezing rain and rain). In terms of its four categories, not-wet/sticky is the most common, followed by not-wet/sticky with freezing rain and wet/sticky with rain. Events with continuous adhering solid precipitation occur, on average, 11 times annually, although this can be up to 25, they can last up to 40 h, and they can produce up to 40 mm of precipitation. Within PGW, values are similar, although there are small increases in some features.
The features of the adhering solid precipitation illustrate spatial and temporal patterns. Within both CTRL and PGW, occurrences, amounts, and events are generally highest in the Cypress Hills of southwestern Saskatchewan, in the Manitoba Escarpment straddling the Manitoba-Saskatchewan border, and in eastern (often northeastern) Manitoba. Within CTRL, this precipitation most often occurs in spring (generally March or April) and autumn (October). Within PGW, these peaks are typically shifted by approximately one month towards mid-winter.
Events with a long duration often lead to the greatest impacts. Their overall durations change little between CTRL and PGW, and they were typically associated with storms producing northerly or northeasterly winds, during or shortly after the adhering precipitation. They were also usually made up of more than one precipitation category; all four categories can occur within a single event, and the ordering of categories varies within events.
The findings have important implications for adhesion onto infrastructure and vegetation. For example, this domain is crossed by many electrical transmission lines, and it contains many deciduous trees. Both are susceptible to damage from adhering solid precipitation and this potential is, overall, slightly increased within PGW.
Although significant progress has been made, it is recognized that this study has limitations. For example, the future projection assumes that large scale atmospheric circulations do not change. Incorporating changing dynamics would undoubtedly alter some of the findings involving future conditions.
In summary, events with persistent adhering solid precipitation represent a significant issue over the eastern Canadian Prairies. The occurrence, amount, timing, and other features of such events vary across this region, and these are all expected to change at least somewhat in the future warmer climate.

Author Contributions

Conceptualization, J.H., R.S. and J.M.T.; methodology, J.H., Z.L., D.P.-N., R.S. and J.M.T.; software, D.P.-N. and Z.L.; formal analysis, J.H., Z.L., D.P.-N., R.S. and J.M.T.; data curation, D.P.-N. and Z.L.; writing—original draft preparation, R.S.; writing—review and editing, J.H., Z.L., D.P.-N., R.S. and J.M.T.; funding acquisition, J.H., R.S. and J.M.T. All authors have read and agreed to the published version of the manuscript.

Funding

This research was supported by the Natural Sciences and Engineering Research Council of Canada (J.H., R.S. and J.M.T.), the Canada Research Chairs program (J.M.T.), as well as Global Water Futures (J.H. and R.S.), which is project 418474-1234 funded by the Canada First Research Excellence Fund.

Institutional Review Board Statement

Not applicable.

Informed Consent Statement

Not applicable.

Data Availability Statement

Environment and Climate Change Canada surface station data are openly available at https://climate.weather.gc.ca/historical_data/search_historic_data_e.html, accessed on 28 December 2022. The WRF dataset (Rasmussen and Liu, 2017) is openly available at https://rda.ucar.edu/datasets/ds612.0/, accessed on 28 December 2022.

Acknowledgments

The authors would like to thank the National Center for Atmospheric Research for providing the WRF dataset, which made this work possible. This research was enabled in part by support provided by the Prairie Digital Infrastructure Group and the Digital Research Alliance of Canada (alliancecan.ca).

Conflicts of Interest

The authors declare no conflict of interest.

References

  1. Stewart, R.E.; Theriault, J.M.; Henson, W. On the characteristics of and processes producing winter precipitation types near 0 °C. Bull. Amer. Meteor. Soc. 2015, 96, 623–639. [Google Scholar] [CrossRef] [Green Version]
  2. Hanesiak, J.; Stewart, R.E.; Painchaud-Niemi, D.; Milrad, S.; Liu, G.; Vieira, M.; Theriault, J.; Cholette, M.; Ziolkowski, K.K. The severe multi-day October 2019 snow storm over southern Manitoba, Canada. Atmos. Ocean. 2022, 60, 65–87. [Google Scholar] [CrossRef]
  3. American Meteorological Society. Glossary. Available online: https://glossary.ametsoc.org (accessed on 15 May 2022).
  4. Stewart, R.E.; Crawford, R.W.; Donaldson, N.R. Precipitation characteristics within several Canadian East Coast winter storms. Atmos. Res. 1990, 25, 293–316. [Google Scholar] [CrossRef]
  5. Makkonen, L.; Wichura, B. Simulating wet snow loads on power line cables by a simple model. Cold Reg. Sci. Tech. 2010, 61, 73–81. [Google Scholar] [CrossRef]
  6. Centre for Energy Advancement through Technological Innovation (CEATI). State of the Art Report on Designing Transmission Lines for Wet Snow Accumulation (Report No. T153733-33/101). Available online: https://www.ceati.com (accessed on 1 July 2022).
  7. Makkonen, L. Estimation of wet snow accretion on structures. Cold Reg. Sci. Tech. 1989, 17, 83–88. [Google Scholar] [CrossRef]
  8. Mohammadian, B.; Sarayloo, M.; Abdelaal, A.; Raiyan, A.; Nims, D.K.; Sojoudi, H. Experimental and theoretical studies of wet snow accumulation on inclined cylindrical surfaces. Model. Simul. Eng. 2020, 2020, 9594685. [Google Scholar] [CrossRef]
  9. Peabody, A.; Finstad, K.; Jones, K.; Orde, C.; Renwick, R. Modeling snow and wind-on-snow loads in southern Alberta. In Proceedings of the International Workshop on Atmospheric Icing of Structure XII, Yokohama, Japan, 9–12 October 2007. [Google Scholar]
  10. Furukawa, Y.; Yamamoto, M.; Kuroda, T. Ellipsometric study of the transition layer on the surface of an ice crystal. J. Cryst. Growth 1987, 82, 665–677. [Google Scholar] [CrossRef]
  11. Lawson, R.P.; Stewart, R.E.; Angus, L.J. Observations and numerical simulations of the origin and development of very large snowflakes. J. Atmos. Sci. 1998, 55, 3209–3229. [Google Scholar] [CrossRef]
  12. Nygaard, B.E.K.; Ágústsson, H.; Somfalvi-Toth, K. Modeling wet snow accretion on power lines: Improvements to previous methods using 50 years of observations. J. Appl. Meteor. Climat. 2013, 52, 2189–2203. [Google Scholar] [CrossRef]
  13. Frick, C.; Wernli, H. A case study of high-impact wet snowfall in northwest Germany (25–27 November 2005): Observations, dynamics, and forecast performance. Weather Forecast. 2012, 27, 1217–1234. [Google Scholar] [CrossRef]
  14. Bonelli, P.; Lacavalla, M.; Marcacci, P.; Mariani, G.; Stella, G. Wet snow hazard for power lines: A forecast and alert system applied in Italy. Nat. Hazards Earth Syst. Sci. 2011, 11, 2419–2431. [Google Scholar] [CrossRef]
  15. Spiegler, D.B.; Fisher, G.E. A snowfall prediction method for the Atlantic seaboard. Mon. Weather Rev. 1971, 99, 311–325. [Google Scholar] [CrossRef]
  16. Kocin, P.J.; Uccellini, L.W. Snowstorms along the Northeastern Coast of the United States: 1955 to 1985; American Meteorological Society: Boston, MA, USA, 1990; p. 280. [Google Scholar] [CrossRef]
  17. McMurdie, L.A.; Heymsfield, G.M.; Yorks, J.E.; Braun, S.A.; Skofronick-Jackson, G.; Rauber, R.M.; Yuter, S.; Colle, B.; McFarquhar, G.M.; Poellot, M.; et al. Chasing snowstorms: The Investigation of Microphysics and Precipitation for Atlantic Coast-Threatening Snowstorms (IMPACTS) campaign. Bull. Amer. Meteor. Soc. 2022, 103, E1243–E1269. [Google Scholar] [CrossRef]
  18. Stewart, R.E.; Bachand, D.; Dunkley, R.R.; Giles, A.C.; Lawson, B.; Legal, L.; Miller, S.T.; Murphy, B.P.; Parker, M.N.; Paruk, B.J.; et al. Winter storms over Canada. Atmos. Ocean 1995, 33, 223–248. [Google Scholar] [CrossRef] [Green Version]
  19. Mekis, E.; Stewart, R.E.; Theriault, J.M.; Kochtubajda, B.; Bonsal, B.R.; Liu, Z. Near 0 °C surface temperature and precipitation type patterns across Canada. Hydrol. Earth Syst. Sci. 2020, 24, 1741–1761. [Google Scholar] [CrossRef] [Green Version]
  20. Isaac, G.A.; Joe, P.I.; Mailhot, J.; Bailey, M.; Belair, S.; Boudala, F.S.; Brugman, M.; Campos, E.; Carpenter, R.L.; Crawford, R.W.; et al. Science of Nowcasting Olympic Weather for Vancouver 2010 (SNOW-V10): A World Weather Research Programme project. Pure Appl. Geophys. 2014, 171, 1–24. [Google Scholar] [CrossRef]
  21. Janz, B. Southern Alberta’s paralyzing snowstorms in April 1967. Weatherwise 1968, 21, 70–75. [Google Scholar] [CrossRef]
  22. Chartrand, J.; Thériault, J.M.; Marinier, S. Freezing rain events that impacted the province of New Brunswick, Canada, and their evolution in a warmer climate. Atmos. Ocean 2022, 61, 40–56. [Google Scholar] [CrossRef]
  23. Bauer, D. Snow accretion on power lines. Atmosphere 1973, 11, 88–96. [Google Scholar] [CrossRef] [Green Version]
  24. Tropea, B.; Stewart, R. Assessing past and future hazardous freezing rain and wet snow events in Manitoba, Canada using a pseudo-global warming approach. Atmos. Res. 2021, 259, 105656. [Google Scholar] [CrossRef]
  25. Intergovernmental Panel on Climate Change (IPCC). Climate Change 2021: The Physical Science Basis. Contribution of Working Group I to the Sixth Assessment Report of the Intergovernmental Panel on Climate Change. Available online: https://www.ipcc.ch/report/ar6/wg1/ (accessed on 1 June 2022).
  26. Stewart, R.E.; Szeto, K.K.; Bonsal, B.R.; Hanesiak, J.M.; Kochtubajda, B.; Li, Y.; Theriault, J.M.; DeBeer, C.M.; Tam, B.Y.; Li, Z.; et al. Summary and synthesis of Changing Cold Regions Network (CCRN) research in the interior of western Canada—Part 1: Projected climate and meteorology. Hydrol. Earth Syst. Sci. 2019, 23, 3437–3455. [Google Scholar] [CrossRef] [Green Version]
  27. Ohba, M.; Sugimoto, S. Impacts of climate change on heavy wet snowfall in Japan. Clim. Dyn. 2020, 54, 3151–3164. [Google Scholar] [CrossRef]
  28. Nitu, R.; Roulet, Y.A.; Wolff, M.; Earle, M.; Reverdin, A.; Smith, C.; Kochendorfer, J.; Morin, S.; Rasmussen, R.; Wong., K.; et al. WMO Solid Precipitation Intercomparison Experiment (SPICE) (2012–2015); Report No. 131; World Meteorological Organization: Geneva, Switzerland, 2018. [Google Scholar]
  29. Liu, C.; Ikeda, K.; Rasmussen, R.; Barlage, M.; Newman, A.J.; Prein, A.F.; Chen, F.; Chen, L.; Clark, M.; Dai, A.; et al. Continental-scale convection-permitting modeling of the current and future climate of North America. Clim. Dyn. 2017, 49, 71–95. [Google Scholar] [CrossRef]
  30. Environment and Climate Change Canada (ECCC). Manual of Surface Weather Observation Standards, 8th Edition. Available online: http://publications.gc.ca/collections/collection_2019/eccc/En56-238-2-2018-eng.pdf (accessed on 1 May 2022).
  31. Environment and Climate Change Canada (ECCC). Historical Data. Available online: https://climate.weather.gc.ca/historical_data/search_historic_data_e.html (accessed on 1 May 2022).
  32. Smith, C.D.; Mekis, E.; Hartwell, M.; Ross, A. The hourly wind-bias adjusted precipitation data set from the Environment and Climate Change Canada automated surface observation network (2001–2019). Earth Syst. Sci. Data Discuss. 2022, 14, 5253–5265. [Google Scholar] [CrossRef]
  33. Environment and Climate Change Canada. Canada’s Top 10 Weather Stories. Available online: https://www.canada.ca/en/environment-climate-change/services/top-ten-weather-stories.html (accessed on 1 October 2022).
  34. Schär, C.; Frei, C.; Lüthi, D.; Davies, H.C. Surrogate climate-change scenarios for regional climate models. Geoph. Res. Lett. 1996, 23, 669–672. [Google Scholar] [CrossRef]
  35. Taylor, K.E.; Stouffer, R.J.; Meehl, G.A. An overview of CMIP5 and the experiment design. Bull. Amer. Meteor. Soc. 2012, 93, 485–498. [Google Scholar] [CrossRef] [Green Version]
  36. Rasmussen, R.; Liu, C. High resolution WRF simulations of the current and future climate of North America. In Research Data Archive at the National Center for Atmospheric Research, Computational and Information Systems Laboratory; NCAR: Boulder, CO, USA, 2017. [Google Scholar] [CrossRef]
  37. Thompson, G.; Eidhammer, T. A study of aerosol impacts on clouds and precipitation development in a large winter cyclone. J. Atmos. Sci. 2014, 71, 3636–3658. [Google Scholar] [CrossRef]
  38. Klassen, R.W. Nature, origin, and age relationships of landscape complexes in southwestern Saskatchewan. Géographie Phys. Quat. 1992, 46, 361–388. [Google Scholar] [CrossRef] [Green Version]
  39. Lang, A.H. Guide to the Geology of Riding Mountain National Park. Information; Canada: Ottawa, ON, Canada, 1974; p. 68. [Google Scholar]
  40. Hare, F.K.; Thomas, M.K. Climate Canada, 2nd ed.; John Wiley and Sons Canada Ltd.: Toronto, ON, Canada, 1979; p. 230. [Google Scholar]
  41. Natural Resources Canada (NRCan). Forest Maps. Available online: https://www.nrcan.gc.ca/maps-tools-and-publications/maps/forest-maps/16874 (accessed on 30 May 2022).
  42. Brandt, J.P. The extent of the North American boreal zone. Environ. Rev. 2009, 17, 101–161. [Google Scholar] [CrossRef]
  43. Rowe, J.S. Forest Regions of Canada; Canadian Forestry Service Publication 1300; Department of the Environment, Canadian Forestry Service: Ottawa, ON, Canada, 1972; p. 111. [Google Scholar]
  44. Almonte, J.; Stewart, R.E. Precipitation transition regions over the southern Canadian Cordillera during January–April 2010 and under a pseudo-global warming assumption. Hydrol. Earth Syst. Sci. 2019, 23, 3665–3682. [Google Scholar] [CrossRef] [Green Version]
  45. Mitchell, S. Precipitation Gradients across the Continental Divide in the Southern Canadian Rockies. Master’s Thesis, University of Northern British Columbia, Prince George, BC, Canada, 2022. [Google Scholar]
  46. Oke, T.; Hay, J. The Climate of Vancouver; BC Geographical Series No. 50; University of British Columbia: Vancouver, BC, Canada, 1998; p. 84. [Google Scholar]
  47. Smith, C. The relationship between monthly precipitation and elevation in the Alberta foothills during the Foothills Orographic Precipitation Experiment. In Cold Region Atmospheric and Hydrologic Studies, The Mackenzie GEWEX Experience Volume 1: Atmospheric Dynamics; Woo, H., Ed.; Springer: Berlin/Heidelberg, Germany, 2008; pp. 167–183. [Google Scholar]
  48. Gill, A.L.; Gallinat, A.S.; Sanders-Demott, R.; Rigden, A.J.; Gianotti, D.J.S.; Mantooth, J.A.; Templer, P.H. Changes in autumn senescence in northern hemisphere deciduous trees: A meta-analysis of autumn phenology studies. Ann. Bot. 2015, 116, 875–888. [Google Scholar] [CrossRef] [Green Version]
  49. Cavender-Bares, J.; Potts, M.; Zacharias, E.; Bazzaz, F.A. Consequences of CO2 and light interactions for leaf phenology, growth, and senescence in Quercus rubra. Glob. Change Biol. 2000, 6, 877–878. [Google Scholar] [CrossRef] [Green Version]
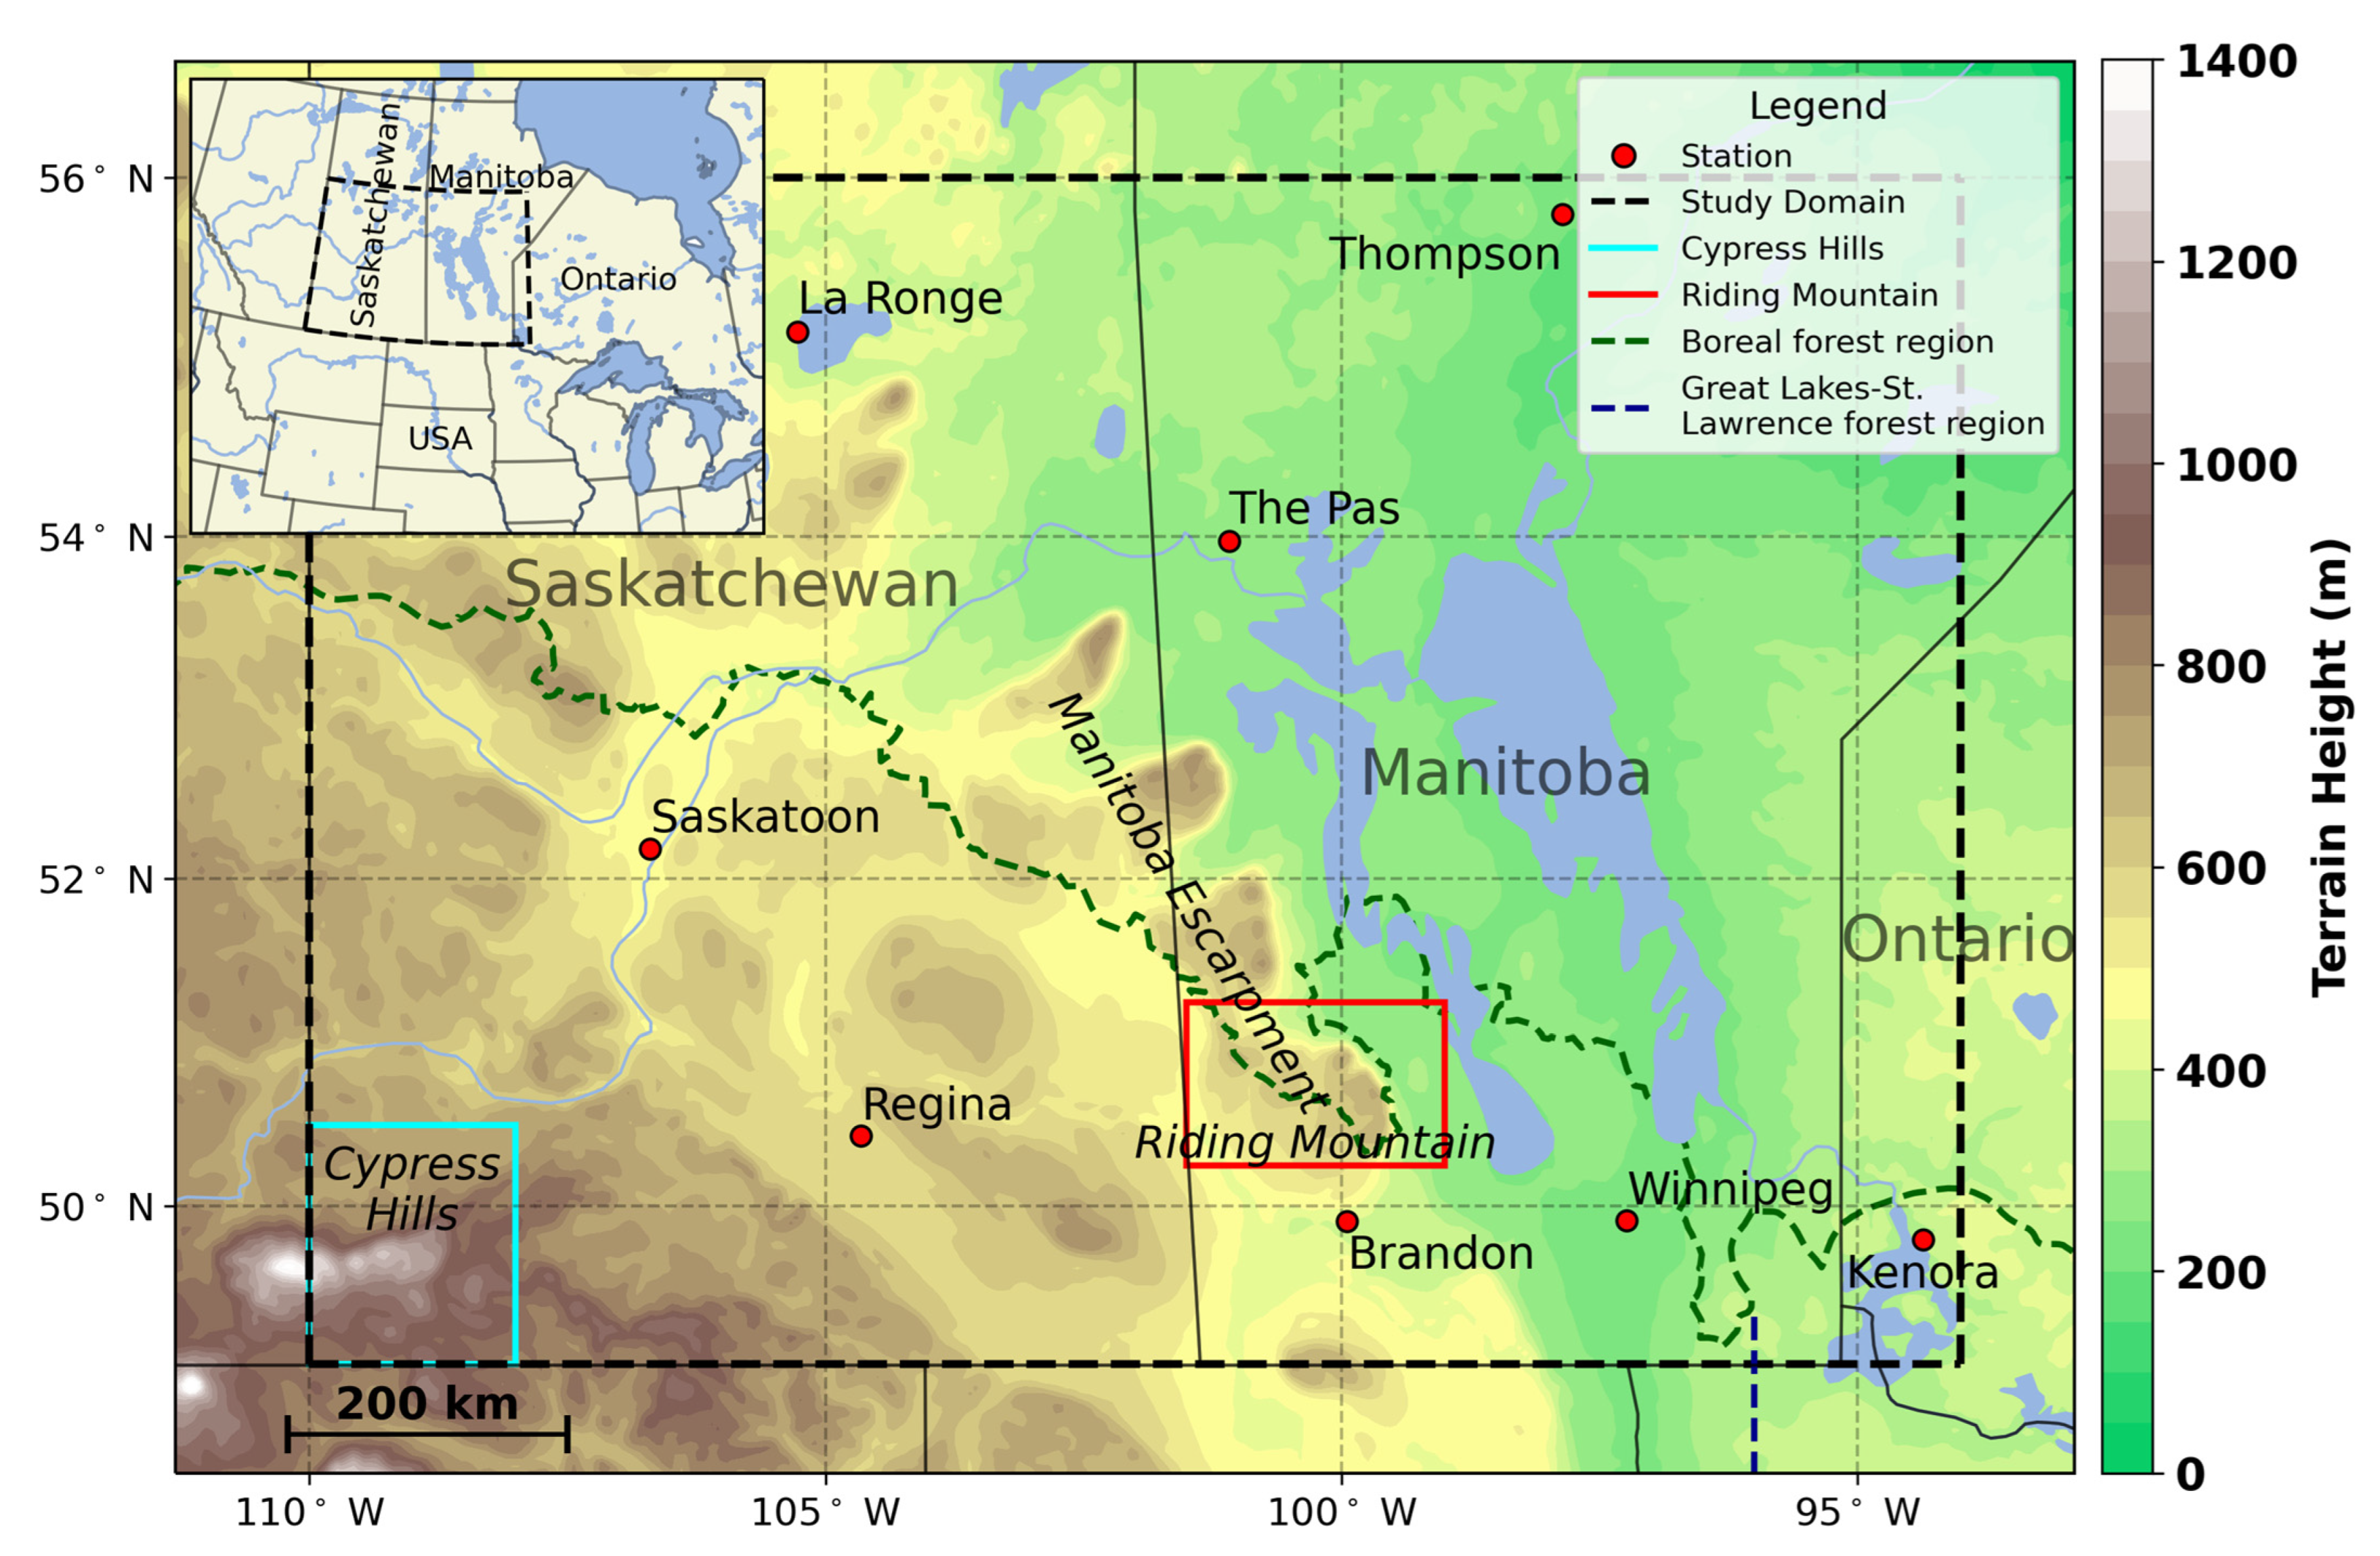
Figure 1. Map of the terrain height for much of the Canadian provinces of Manitoba and Saskatchewan, as well as a small area of northwestern Ontario. The black dotted line signifies the domain of this study. Surface weather observation stations used in this study are depicted as red dots. The terrain data are from the Weather Research and Forecasting model. The cyan line encompasses Cypress Hills, and the red line encompasses Riding Mountain. The green dashed line shows the southern edge of the boreal forest region. The dark blue dashed line shows the western edge of the Great Lakes–St. Lawrence forest region, which covers the extreme southeastern portion of the domain. The insert highlights this domain within a portion of North America.
Atmosphere 14 00396 g001
Figure 2. Average monthly precipitation amount (melted equivalent) over the October 2000 to September 2013 period. Data are averaged from the four stations with the (a) lowest and (b) highest annual amount of precipitation. Bars indicate ± one standard deviation from the average 13-values, indicating interannual variability.
Atmosphere 14 00396 g002
Figure 3. Average monthly hours of (a) −2 °C ≤ Tw ≤ 2 °C temperatures and (b) adhering solid precipitation over the October 2000 to September 2013 period. Data from the eight stations are averaged. Bars indicate ± one standard deviation from the average 13-values, indicating interannual variability.
Atmosphere 14 00396 g003
Figure 4. Average annual occurrence of adhering solid precipitation over the October 2000 to September 2013 period for (a) CTRL, (b) PGW, and (c) their difference (PGW—CTRL).
Atmosphere 14 00396 g004
Figure 5. Average annual occurrence of adhering solid precipitation, broken down into its four categories, over the October 2000 to September 2013 period for (ac) not-wet/sticky, (df) not-wet/sticky with freezing rain, (gi) wet/sticky, and (jl) wet/sticky with rain. Each category has panels for CTRL, PGW, and their difference (PGW—CTRL). Note that the scale varies with adhering solid precipitation category.
Atmosphere 14 00396 g005
Figure 6. Average annual amount of adhering solid precipitation (melted equivalent) across the domain over the October 2000 to September 2013 period in (a) CTRL, (b) PGW, and (c) their difference (PGW—CTRL).
Atmosphere 14 00396 g006
Figure 7. Average monthly occurrence of adhering solid precipitation at the eight stations over the October 2000 to September 2013 period. Bars indicate ± one standard deviation from the average 13-values, indicating interannual variability. Note that some of these values are above the indicated scale.
Atmosphere 14 00396 g007
Figure 8. Characteristics of events across the domain over the October 2000 to September 2013 period for (ac) average annual number of events, (df) average duration, (gi) maximum duration, and (jl) maximum amount (melted equivalent). Each variable has panels for CTRL, PGW, and their difference (PGW—CTRL).
Atmosphere 14 00396 g008
Figure 9. Cumulative amount of average annual adhering solid precipitation (melted equivalent), as a function of the average duration of events, for the eight stations over the October 2000 to September 2013 period within (a) CTRL and (b) PGW. The average annual number of events and the average annual amount of adhering solid precipitation (mm) are shown in brackets.
Atmosphere 14 00396 g009
Figure 10. The five longest duration events of adhering solid precipitation, and their associated categories and strongest winds, over the October 2000 to September 2013 period at the eight stations in (a) CTRL and (b) PGW. The initiation of each event is shown as time (UTC)-day-month-year, and the timing of the strongest wind within 24 h of the event’s cessation is shown by the red positive sign (+), along with its speed (km/h) and direction (degrees).
Atmosphere 14 00396 g010
Figure 11. Hodographs associated with the strongest winds (km/h) for the five longest duration events at the eight stations. (a) CTRL and observed (obs) 10-m winds and (b) PGW 10-m winds. In (a), open symbols indicate observations and filled ones indicate CTRL, and lines connect these values.
Atmosphere 14 00396 g011
Figure 12. Average amount of adhering solid precipitation (melted equivalent) in CTRL over Cypress Hills and Riding Mountain, within the indicated areas shown in Figure 1, and in relation to contour elevations every 10 m, as well as their best fit lines over the October 2000 to September 2013 period. Elevation refers to the upper part of these terrain features.
Atmosphere 14 00396 g012
Figure 13. Average amount of adhering solid precipitation (melted equivalent), within CTRL as a function of elevation (m, MSL), within the indicated areas shown in Figure 1 over the October 2000 to September 2013 period for (a) Cypress Hills and (b) Riding Mountain. Note that the scales of amount are different between (a) and (b). The white contours indicate elevation above sea level (m).
Atmosphere 14 00396 g013
Table 1. Adhering solid and associated liquid precipitation categories and their associated wet-bulb temperature (Tw) windows. Categories are explained in the text.
PrecipitationWet-Bulb Temperature
Adhering solid precipitation−2 °C ≤ Tw ≤ 2 °C
Categories:
Solid precipitation not-wet/sticky
1. 
on its own
2. 
with freezing rain
−2 °C ≤ Tw ≤ 0 °C
Solid precipitation wet/sticky
3. 
on its own
4. 
with rain
0 °C < Tw ≤ 2 °C
Disclaimer/Publisher’s Note: The statements, opinions and data contained in all publications are solely those of the individual author(s) and contributor(s) and not of MDPI and/or the editor(s). MDPI and/or the editor(s) disclaim responsibility for any injury to people or property resulting from any ideas, methods, instructions or products referred to in the content.