Article

Performance of the WRF Model for the Forecasting of the V-Shaped Storm Recorded on 11–12 November 2019 in the Eastern Sicily

by
Giuseppe Castorina
1,2,3,*,
Agostino Semprebello
1,2,4,
Vincenzo Insinga
2,
Francesco Italiano
1,
Maria Teresa Caccamo
2,4,
Salvatore Magazù
2,4,
Mauro Morichetti
5 and
Umberto Rizza
5
1
Istituto Nazionale di Geofisica e Vulcanologia (INGV)—Sezione di Palermo, Sede Operativa di Milazzo, 98057 Milazzo, Italy
2
Consorzio Interuniversitario di Scienze Fisiche Applicate (CISFA), Piazza Salvatore Pugliatti, 98123 Messina, Italy
3
Associazione Meteo Professionisti (AMPRO), Via Francesco Morandini, 00142 Roma, Italy
4
Dipartimento di Scienze Matematiche e Informatiche, Scienze Fisiche e Scienze della Terra (MIFT), Università degli Studi di Messina, Viale F. Stagno D’Alcontres, 98166 Messina, Italy
5
Institute of Atmospheric Sciences and Climate (ISAC), National Research Council (CNR), Unit of Lecce, 73100 Lecce, Italy
*
Author to whom correspondence should be addressed.
Atmosphere 2023, 14(2), 390; https://doi.org/10.3390/atmos14020390
Submission received: 31 December 2022 / Revised: 7 February 2023 / Accepted: 8 February 2023 / Published: 16 February 2023
(This article belongs to the Special Issue The Impact of Data Assimilation on Severe Weather Forecast)

Abstract

:
During the autumn season, Sicily is often affected by severe weather events, such as self-healing storms called V-shaped storms. These phenomena cause significant total rainfall quantities in short time intervals in localized spatial areas. In this framework, this study analyzes the meteorological event recorded on 11–12 November 2019 in Sicily (southern Italy), using the Weather Research and Forecasting (WRF) model with a horizontal spatial grid resolution of 3 km. It is important to note that, in this event, the most significant rainfall accumulations were recorded in eastern Sicily. In particular, the weather station of Linguaglossa North Etna (Catania) recorded a total rainfall of 293.6 mm. The precipitation forecasting provided by the WRF model simulation has been compared with the data recorded by the meteorological stations located in Sicily. In addition, a further simulation was carried out using the Four-Dimensional Data Assimilation (FDDA) technique to improve the model capability in the event reproduction. In this regard, in order to evaluate which approach provides the best performance (with or without FDDA), the Root Mean Square Error (RMSE) and dichotomous indexes (Accuracy, Threat Score, BIAS, Probability of Detection, and False Alarm Rate) were calculated.

1. Introduction

The Mediterranean Sea is a geographic area that is particularly affected by Global Warming [1,2,3,4]. Despite negative temperature anomalies were observed in the Northern Atlantic Ocean (e.g., Cold Blob), in the last few years, positive anomalies in the Mediterranean area were recorded [5,6,7]. In this regard, with the aim to show the upward trend of the sea surface temperature in the Mediterranean Sea [8,9], the marine climate data, recorded by the Rete Mareografica Nazionale (RMN), belonging to the Istituto Superiore per la Protezione e la Ricerca Ambientale (ISPRA) (available at https://www.mareografico.it/ (accessed on 13 December 2022)), were analyzed. The RMN is composed of 36 stations, evenly distributed in the Italian territory, mainly placed inside portual areas. In particular, three measuring stations (see Figure 1), two of these placed in eastern Sicily (Messina and Catania cities), and the other one placed in Lampedusa Island, which, in relation to its geographical position, represents a natural hotspot on the Mediterranean Sea for Climate Change studies, were selected.
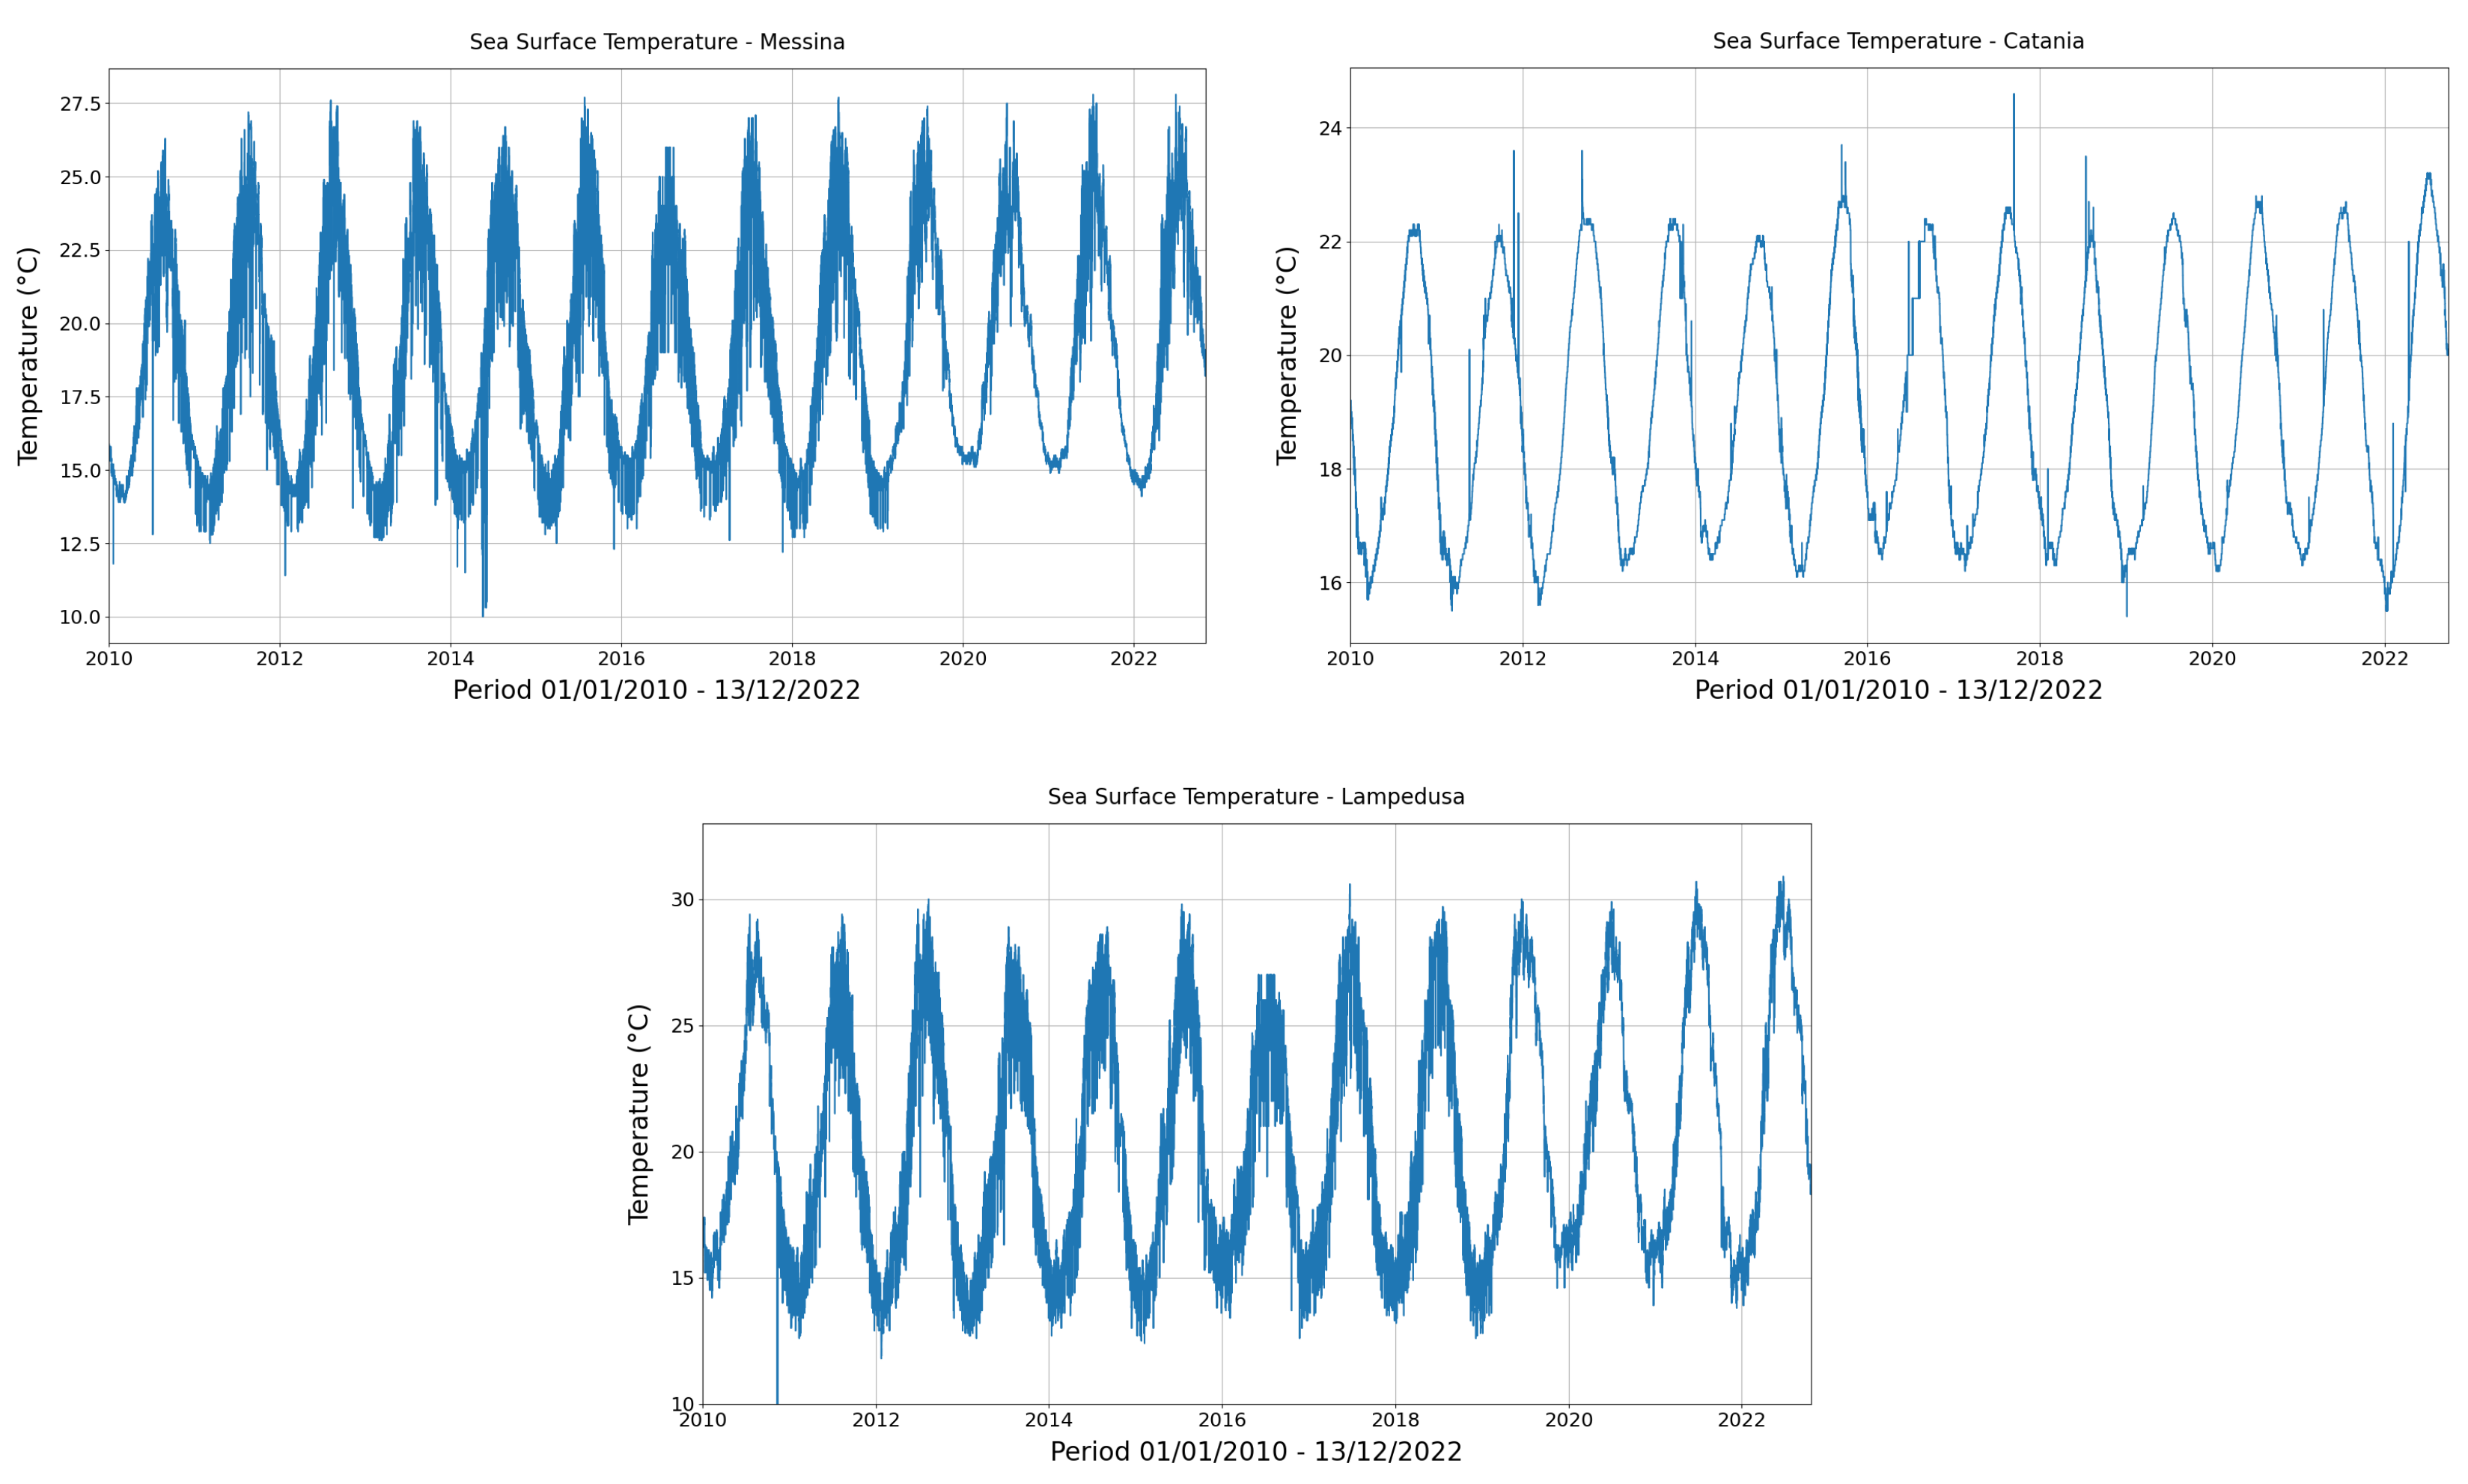
Figure 2 shows the charts of sea surface temperature from January 2010 to December 2022.
The considered stations show an upward trend for the study period, both from maximum and minimum values.
In addition, in order to highlight that the positive thermal anomaly recorded in the Mediterranean Sea does not concern only surface temperatures, data acquired by a multidisciplinary submarine observatory, starting from the end of 2015, were analyzed. This research infrastructure, managed by the Istituto Nazionale di Geofisica e Vulcanologia (INGV) of Palermo (Italy), is located about 2 miles east of Panarea Island (Aeolian Archipelago, Southeastern Tyrrhenian Sea, see Figure 1) and consists in a pole beacon connected to a seafloor observatory located at depth of about 23 m [10,11]. The analysis focused on the autumn period and the result obtained shows an increase in the trend of thermal values, especially during November and December (see Figure 3).
This situation accentuates the horizontal thermal gradient allowing the oceanic disturbances that reach the regions of Italy to acquire more vigor. In fact, high sea surface temperature values provide a lot of energy resources, in terms of heat and humidity, which are made available to incoming atmospheric disturbances.
Moreover, the orographic conditions play a key role in the genesis of cyclonic vortices in the Mediterranean basin [12,13,14,15,16,17,18]. For example, in presence of fluxes coming from the Atlantic Ocean, the formation of downwind-powered low-pressure systems can be favored (e.g., formation of downwind-powered low-pressure systems which form in the Pyrenees area, close to the Balearic archipelago). Another phenomenon to be mentioned here is the North African cyclogenesis, which is caused by the effects of the Atlas Mountains (Algeria). A further example is represented by the cyclonic vortices which generating on the Tyrrhenian Sea when an air mass coming from northern sectors collides with the Alps or Apennines. Therefore, the above-mentioned weather phenomena have always existed. However, the sea surface temperature warming can increase their intensity and, if the thermal values on the sea surface exceed 26–27 °C, favor the transition of cyclones to tropical-like or tropical systems [19,20].
In this context, during the autumn period, Sicily, particularly the eastern sector, is often affected by intense weather events [21,22,23,24]. When cyclonic vortices of Afro-Mediterranean matrix occur, it can be possible the activation of warm-humid air flows from Libya, called Warm Conveyor Belt. These flows, crossing wide streches of sea (high fetch), further increase their amount of available water vapor, reaching high values of Precipitable Water (PW).
When atmospheric flux coming from the Southeast collides with the eastern mountains of Sicily, the atmospheric instability is increased by the orographic forcing [25]. In fact, the warm-humid mass, in relation to the presence of Etna Mount and Peloritani Mounts, is forced to lift.
Furthermore, in presence of favorable conditions, such as upper air disturbances (e.g., the subtropical jet stream), in these areas, the genesis of intense Mesoscale Convective Systems (MCSs) is possible [26,27,28].
The thunderstorms developed upwind close to reliefs generate, in turn, the gust-front (cold front on small scale) coming down toward the coasts. The presence of air flows coming from southeastern sectors, with a large amount of available thermal energy, can generate new convective cells on the sea behind (thermodynamic feedback), allowing the thunderstorm to become stationary. This generates self-healing semistationary thunderstorms that can accumulate a large amount of rainfall on the ground, causing massive damage.
In addition, the positive wind shear (air flows from SE on the ground and SW in altitude) can generate the so-called V-shaped storms, which are quasistationary storm systems that cause intense and persistent rainfall, always in the same area. The V-shaped storms are MCSs consisting of several cells close together and in different evolutionary states. These backward regenerative systems that take on a V shape in the infrared satellite imagery are characterized by a narrow vertex (tip of the V) where new convective cells are often formed in a rapid sequence, causing the maximum rainfall peak, while the mature and old ones move toward the V branches, following the wind direction at altitude [29]. These events cause huge amounts of rainfall, characterized by high rain rate values.
As mentioned above, the increase of sea surface temperature favors the genesis of V-shaped storms, especially in the autumn season. In the last few years, these phenomena caused important hydrogeological damage in different regions of the Mediterranean basin (e.g., Spain, France, and Italy) [30,31,32,33].
In this context, there are many works in literature on V-shaped systems over Northwestern Italy, especially regarding Liguria and Tuscany [34,35,36,37,38,39]. Moreover, even Sicily is often affected by V-shaped storms [40].
In this framework, with the aim to study one of these meteorological events, we analyzed an event recorded on November 2019. In particular, from the meteorological point of view, Sicily was affected by three relevant events on the dates: 11–12, 16–17, and 23–24 November. Among these days, the most severe weather event was recorded on 11 and 12 November, which affected, in particular, the eastern sector of Sicily, where intense rainfall accumulations were observed (maximum rainfall accumulation recorded by the Linguaglossa North Etna meteorological station equal to 293.6 mm at the end of the event).
The purpose of this work is to evaluate the capability of the Weather Research and Forecasting (WRF) model [41], specifically developed and optimized for the complex orography of Sicily [42], in the reproduction of this event. In particular, a simulation with the WRF model, in order to evaluate its performance for rainfall estimation, was carried out. In addition, it was considered interesting to carry out a second simulation using the Four-Dimensional Data Assimilation (FDDA) technique in order to assess whether, in this case, a better estimate of the precipitations would be obtained.

2. Materials and Methods

2.1. The Weather Research and Forecasting Model

The WRF model is a new generation Numerical Weather Prediction (NWP) system that works on limited area (LAM—Limited Area Model). This model has been developed both for research and operational application.
In the present work, the release 4.1.2 [43] of the WRF model (available at https://www2.mmm.ucar.edu/wrf/users/wrf_files/ (accessed on 20 September 2021)), with the use of specific configurations and parameterizations for the regional features of territory has been used.
The dynamical solver employed was the Advanced Research WRF (ARW), which integrates Euler’s equations, operating in nonhydrostatic conditions and taking compressibility into account. The equations are expressed in flux form by using physical variables that have conservation properties for mass, energy, and momentum [44]. Moreover, the use of terrain-following hydrostatic-pressure coordinates, for the vertical domain, is adopted [45,46]. Instead, along the horizontal domain, the ARW core works with a staggered Arakawa C-grid [43]. The vertical domain has been composed of 65 levels, up to 50 hPa.
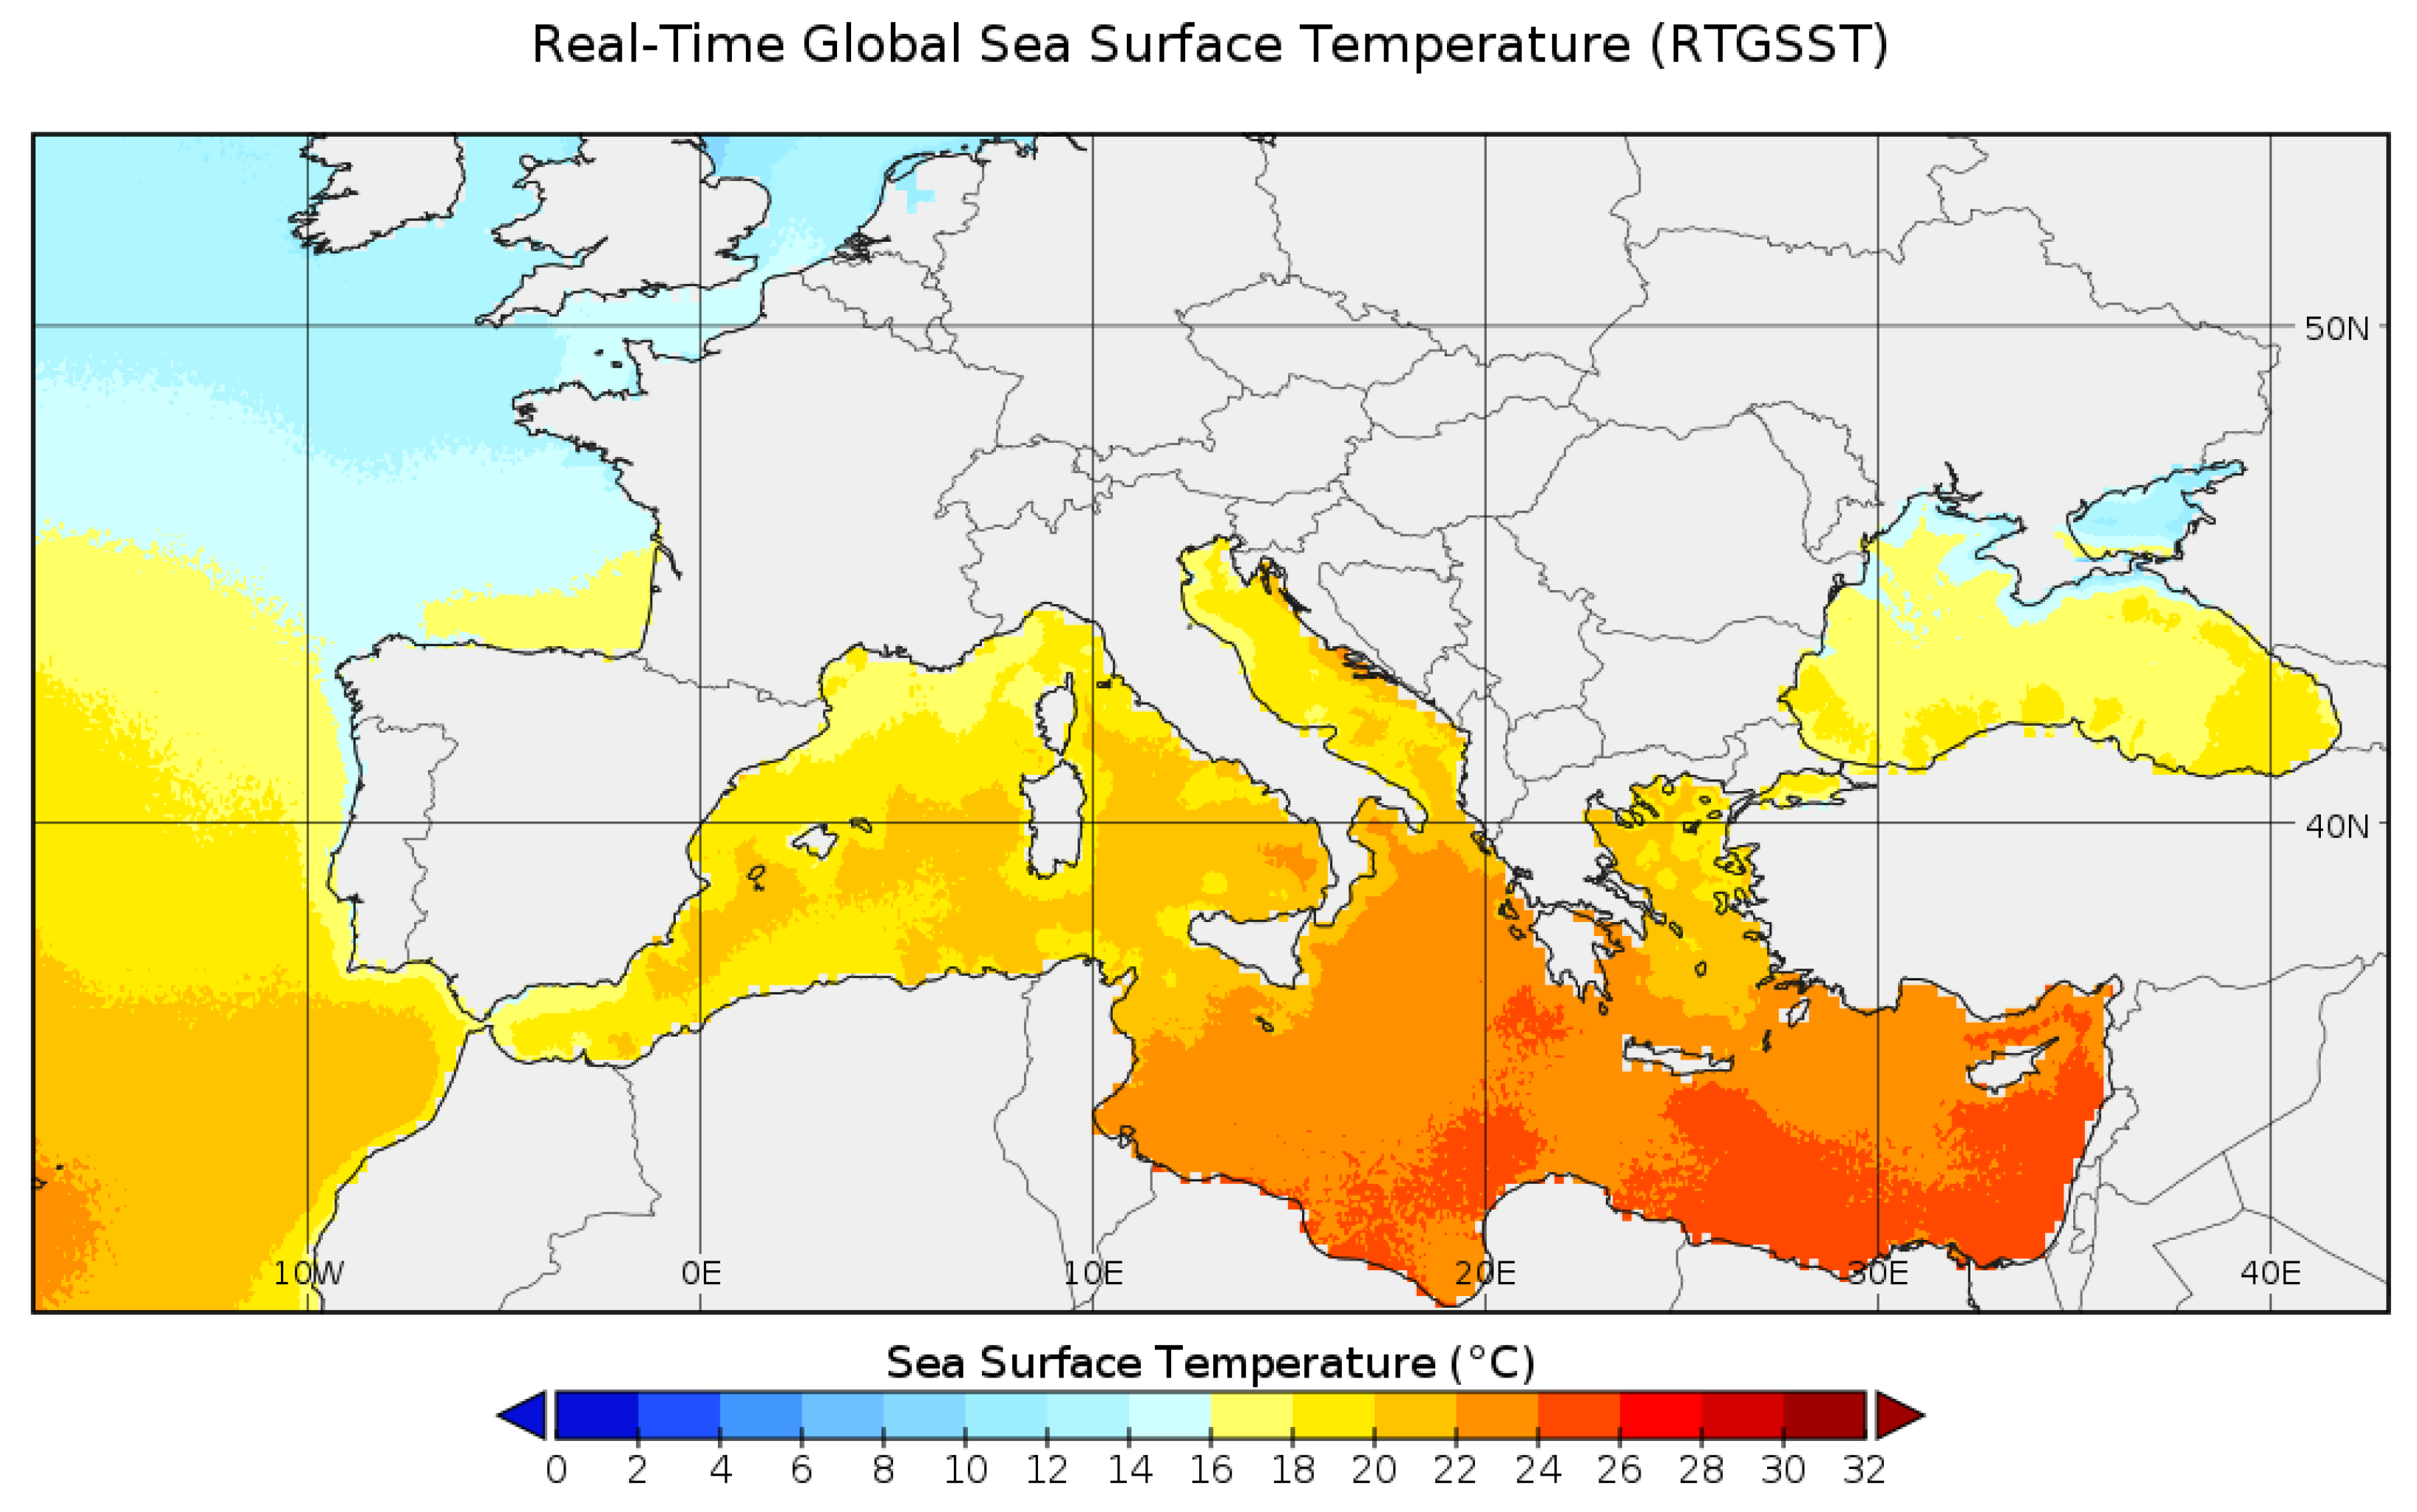
The data acquired from the Global Forecast System (GFS) with a resolution of 0.25 degrees (available at https://soostrc.comet.ucar.edu/data/grib/gfsp25/20191111/ (accessed on 5 September 2022)) provided the initial and boundary conditions. We have used data with a time resolution equal to one hour, processed starting from the 00:00 UTC run, relative to 11 November 2019, thus providing a sufficient spin-up time [47,48,49]. The performed simulation ended at 00:00 UTC of 13 November 2019, for a total duration of 48 h. Furthermore, the Real-Time Global Sea Surface Temperature Analysis (RTG-SST), with a resolution equal to 0.083 degrees (available via ftp at: ftp://ftp.ncep.noaa.gov/pub/data/nccf/com/gfs/prod (accessed on 5 September 2022)) was used. Values of RTG-SST for 11 November 2019 are shown in Figure 4. In particular, between the coasts of eastern Sicily and north Africa, the SST had values of around 24 °C, with maximum peaks close to 26 °C.
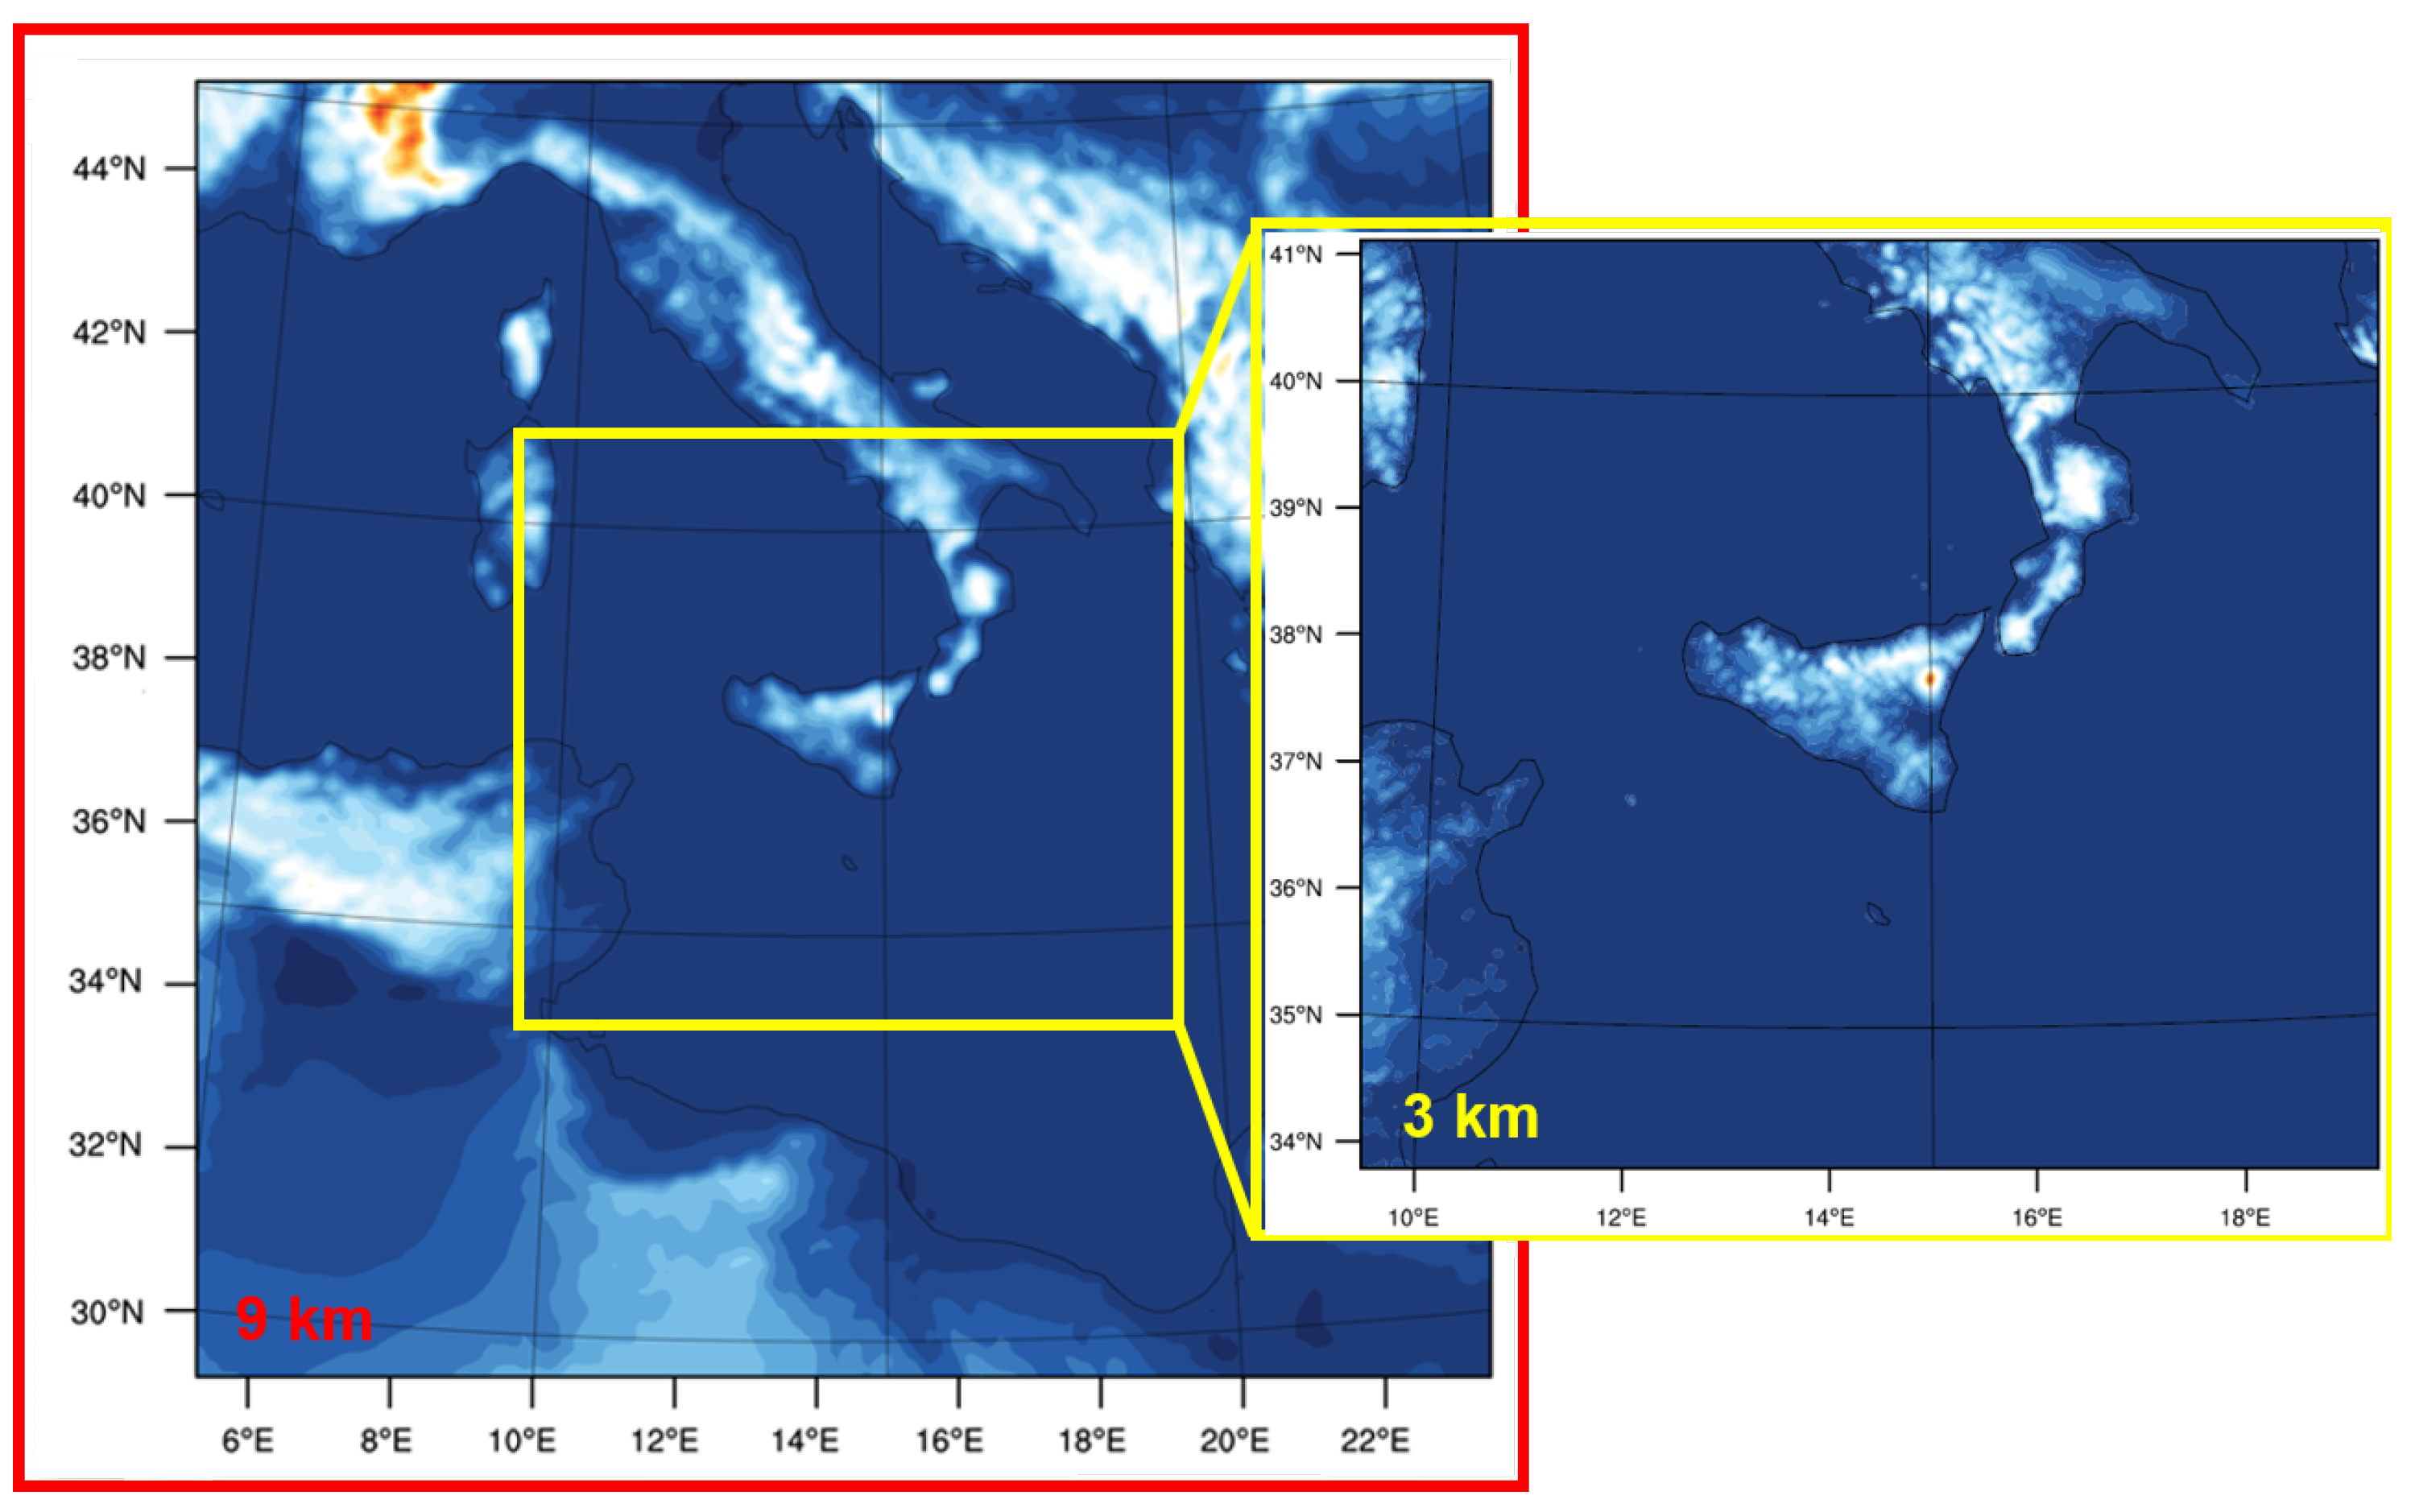
The nesting protocol [50,51], with One-Way configuration [52,53], was adopted. With the use of this technique, it was possible to obtain a nested domain, with a finer spatial grid and, consequently, an increased spatial resolution with respect to the parent domain. The two different employed domains, with the respective resulting orography, are reported in Figure 5. In particular, starting from a parent domain with a resolution of 9 km (left in Figure 5), a nested domain (right in Figure 5) with a resolution of 3 km (ratio 1/3) was obtained.
Table 1 shows the parameterizations adopted. Their choice was based on the results obtained previously [54,55,56,57].
With the aim to study the severe weather event occurred in Sicily on 11 and 12 November 2019, a simulation with the WRF model was performed. Subsequently, a further simulation was carried out, with the same physic-configuration, in which the Four-Dimensional Data Assimilation (FDDA) technique was implemented.
The FDDA was added to the WRF model to study the impact of “nudging” on the prediction [66]. The nudging is a consolidated methodology used to improve the model performance. This methodological approach relies on the dynamical relaxation to adjust the model regarding observations data; the dynamical downscaling is based on a Newtonian relaxation method keeping all the features of the large-scale gridded analysis field. FDDA in WRF could be considered as observational and analysis nudging, regardless of the types. It has been shown that this technique improves air quality prediction, and if it is applied to surface temperature and wind, it enhances the simulation of the inversion layer structure. This approach is commonly considered robust and computationally efficient [67,68].
Particularly, in the present study, we used the FDDA grid-nudging for temperature, horizontal wind speed, and relative humidity in all layers of the domain, including the PBL (Planetary Boundary Layer). The model level below which nudging is switched off for all components is the first level. The meteorological fields adopted for the nudging are those used for initial and boundary conditions (i.e., GFS grib files at 0.25 degrees, starting from 00:00 UTC of 11 November 2019). Moreover, the model is forced to use them every 6 h, and not only during the pre-event phase but also during the entire period of simulation.

2.2. Synoptic Analysis

In order to carry out a detailed synoptic analysis of 11 and 12 November 2019, data obtained from the ERA5 Reanalisys [69], which has 137 vertical levels and about 30 km of horizontal resolution, were used. Geopotential fields were obtained from the ERA5 hourly data on pressure levels (available from 1979 to present) in NetCDF format (https://www.unidata.ucar.edu/software/netcdf/) (accessed on 13 January 2022) from the Copernicus Climate datastore (https://cds.climate.copernicus.eu/ (accessed on 5 September 2022)).
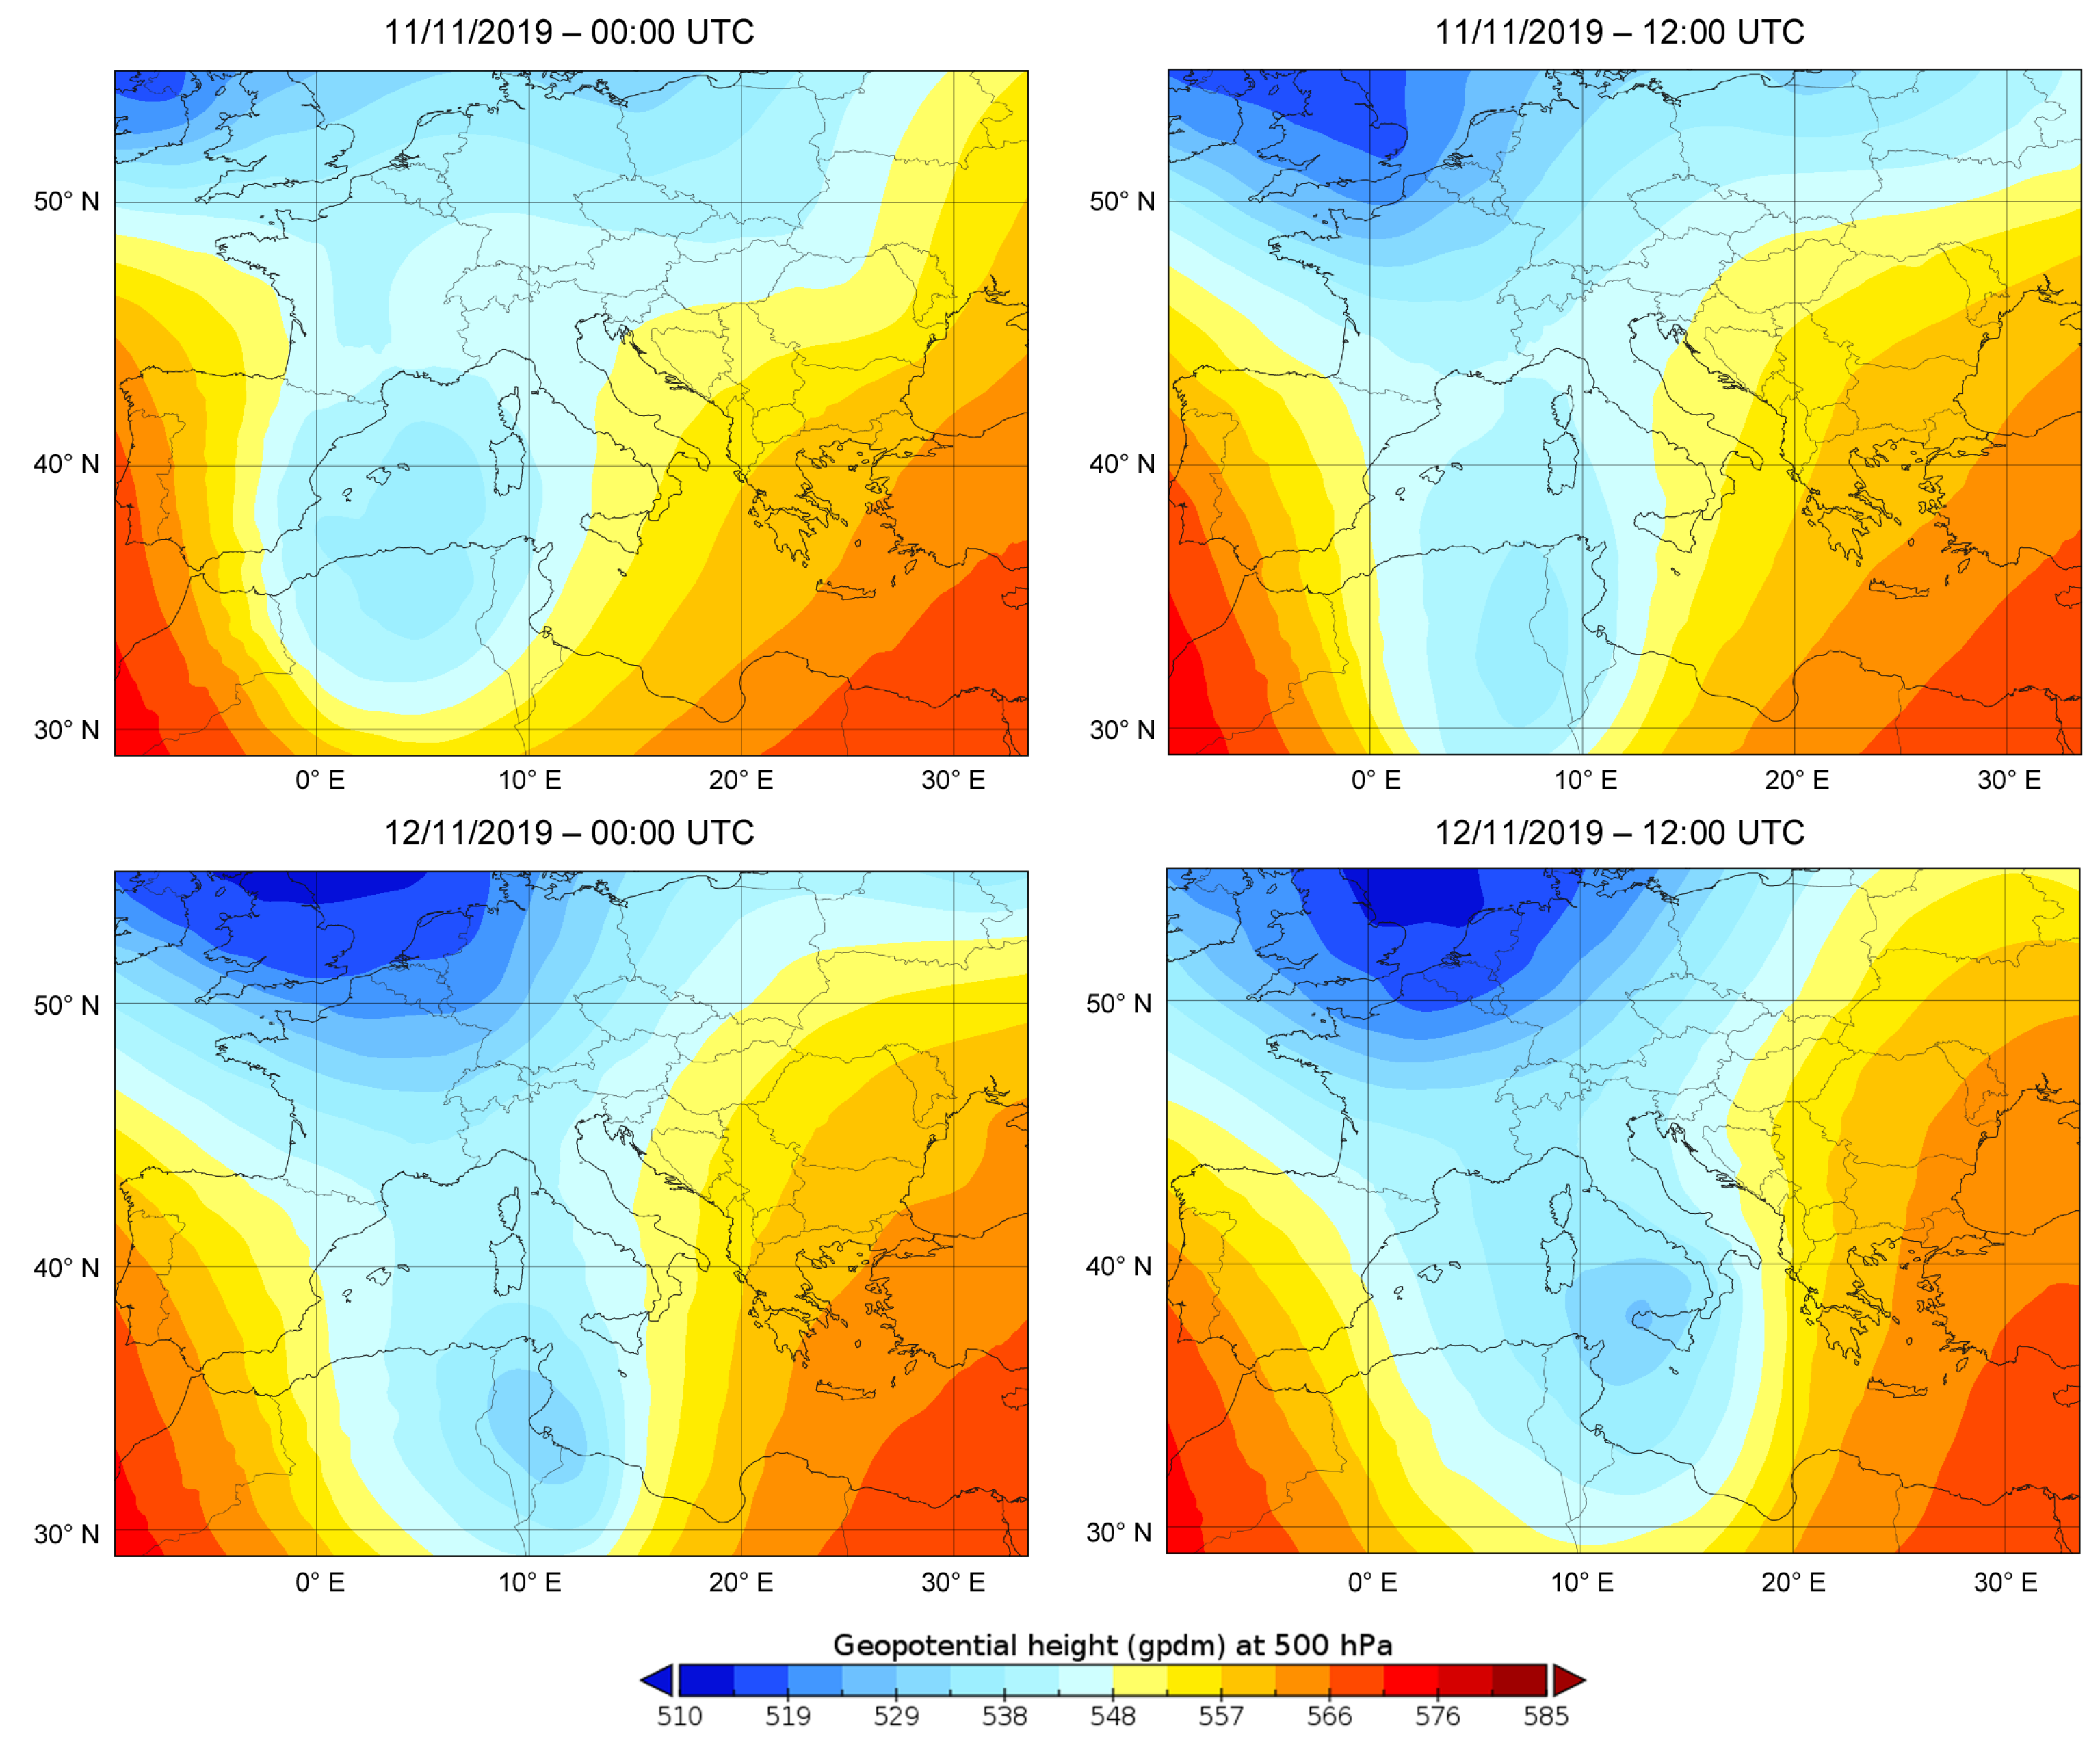
In particular, the maps of geopotential height at 500 hPa (Figure 6) show the presence of a cyclonic vortex, which, at 00:00 UTC on 11 November 2019, was positioned between Spain, Sardinia, and the northern African coasts (top left in Figure 6). In the following hours, with a classic zonal circulation, the cyclonic vortex reached Sicily (top right and bottom panels in Figure 6).
This meteorological framework is often the cause of particular relevant weather events, in which extreme rainfall accumulations are recorded, especially in eastern Sicily.
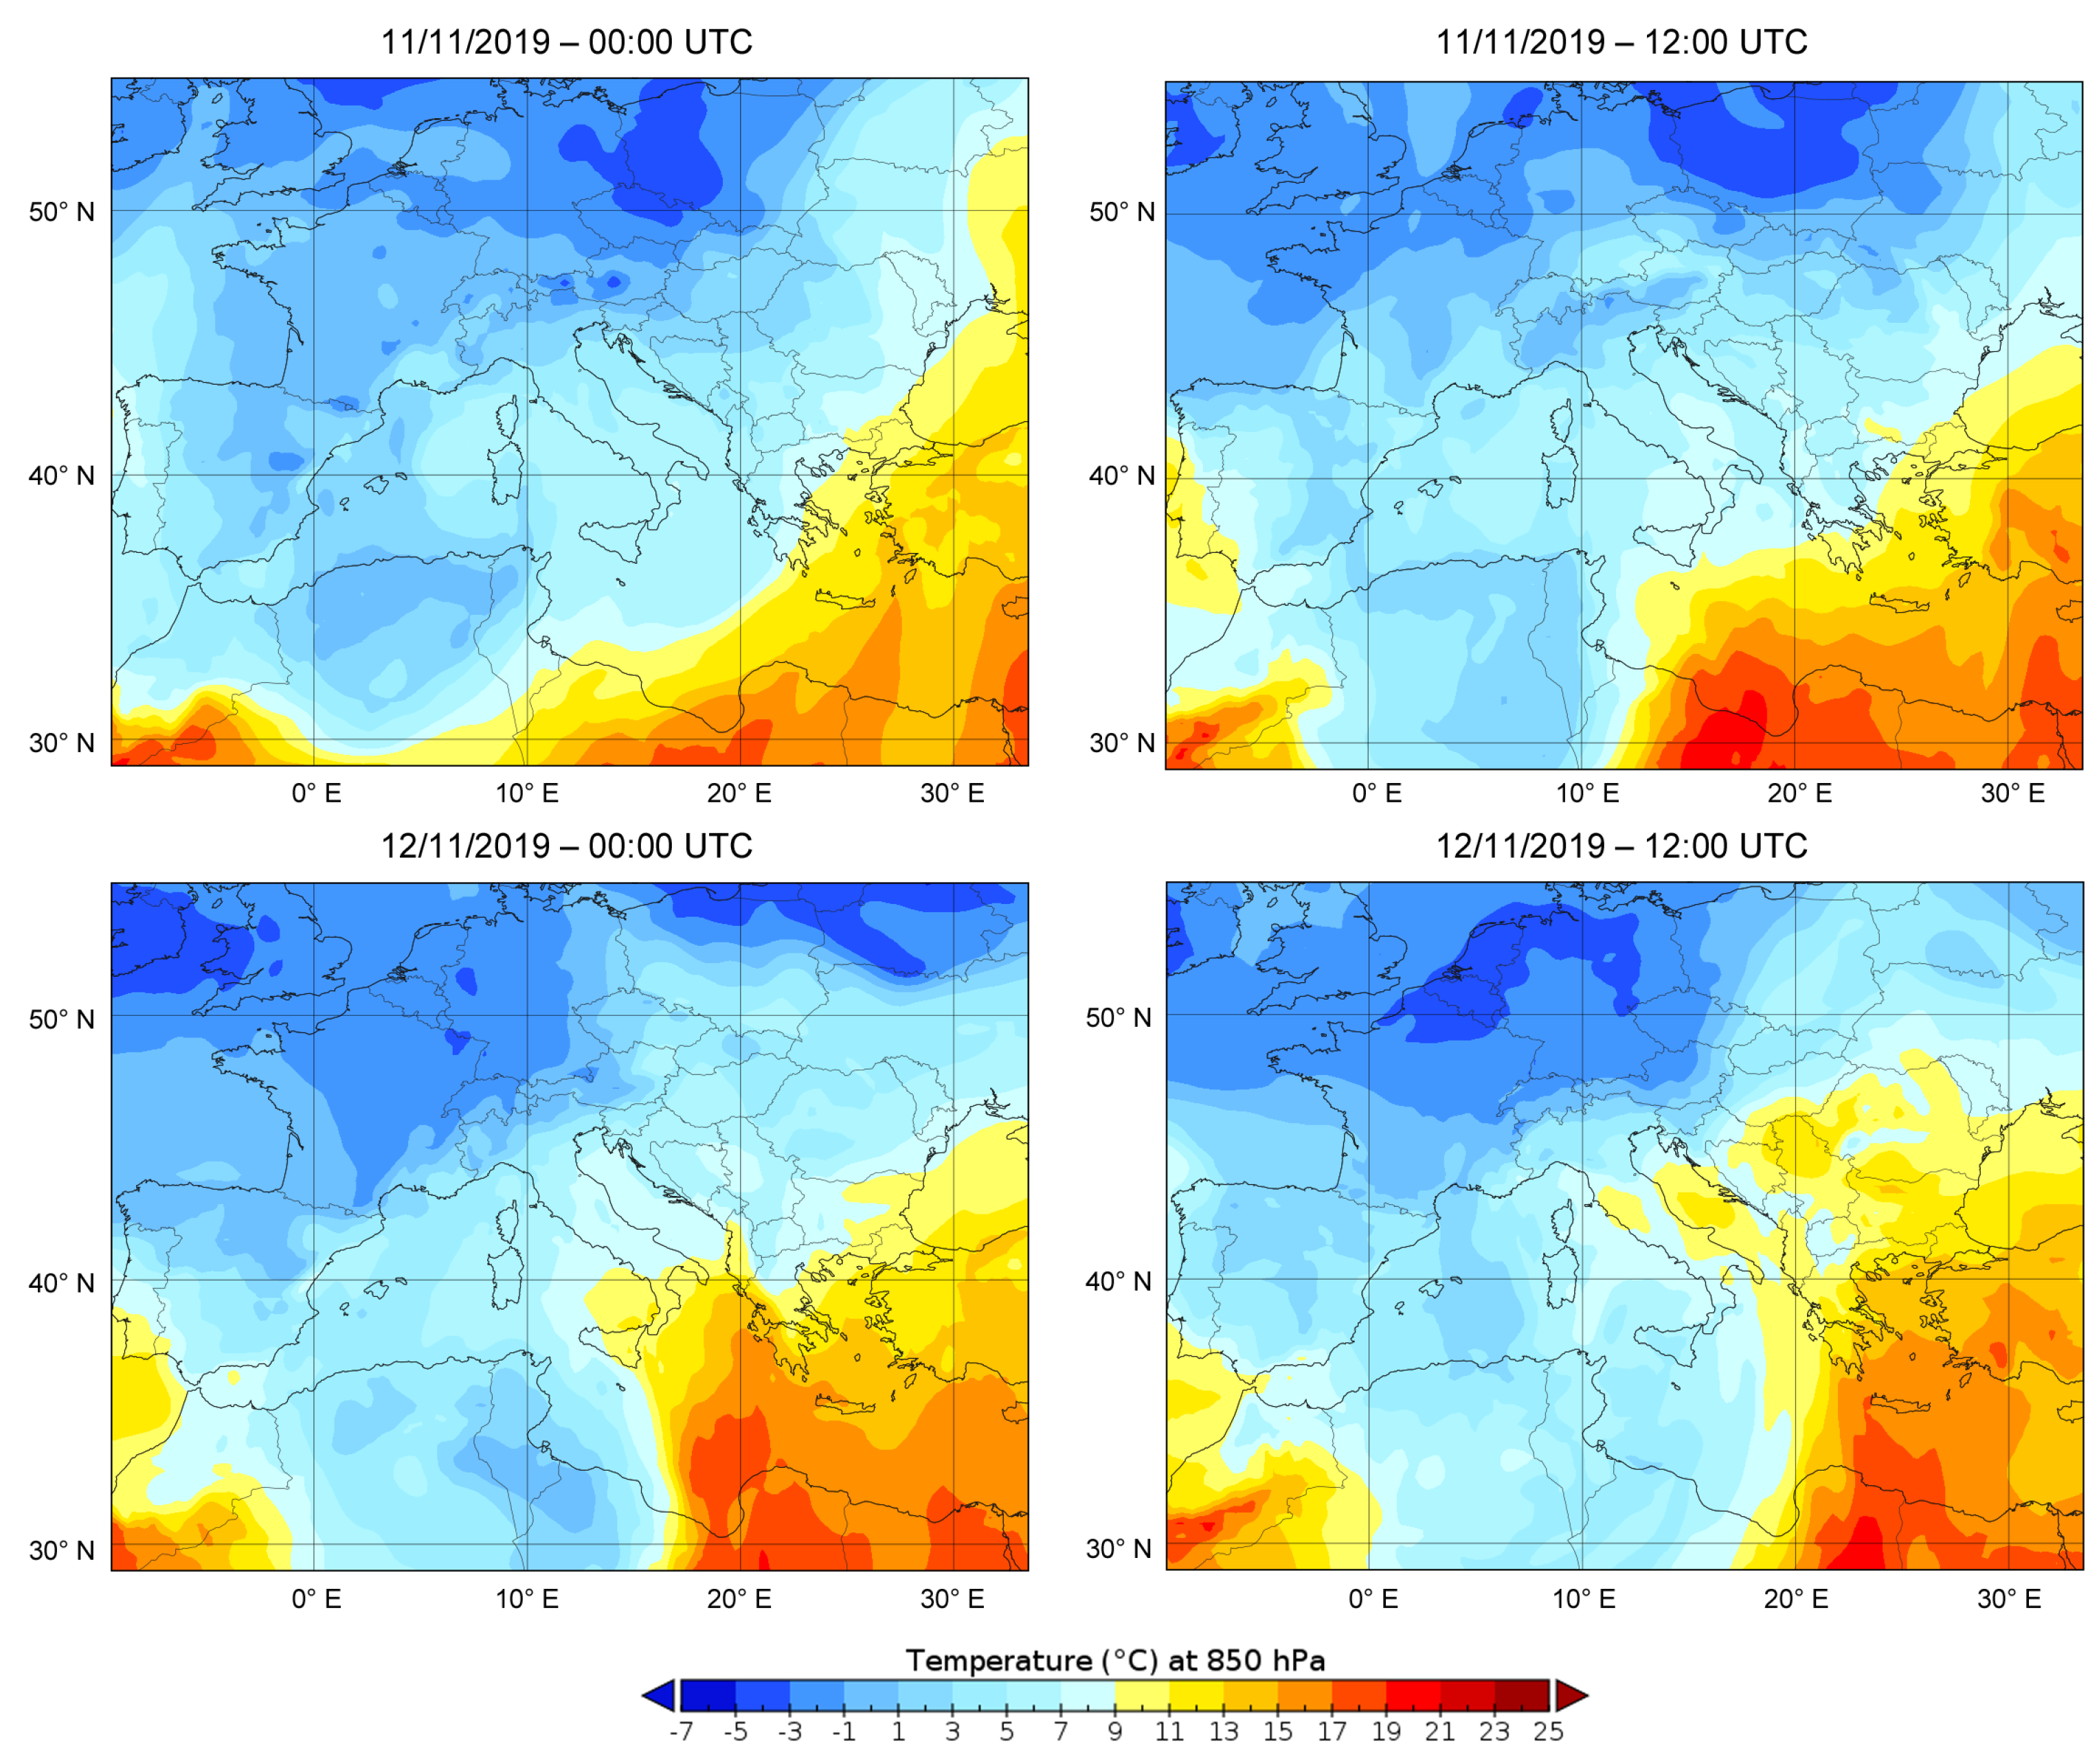
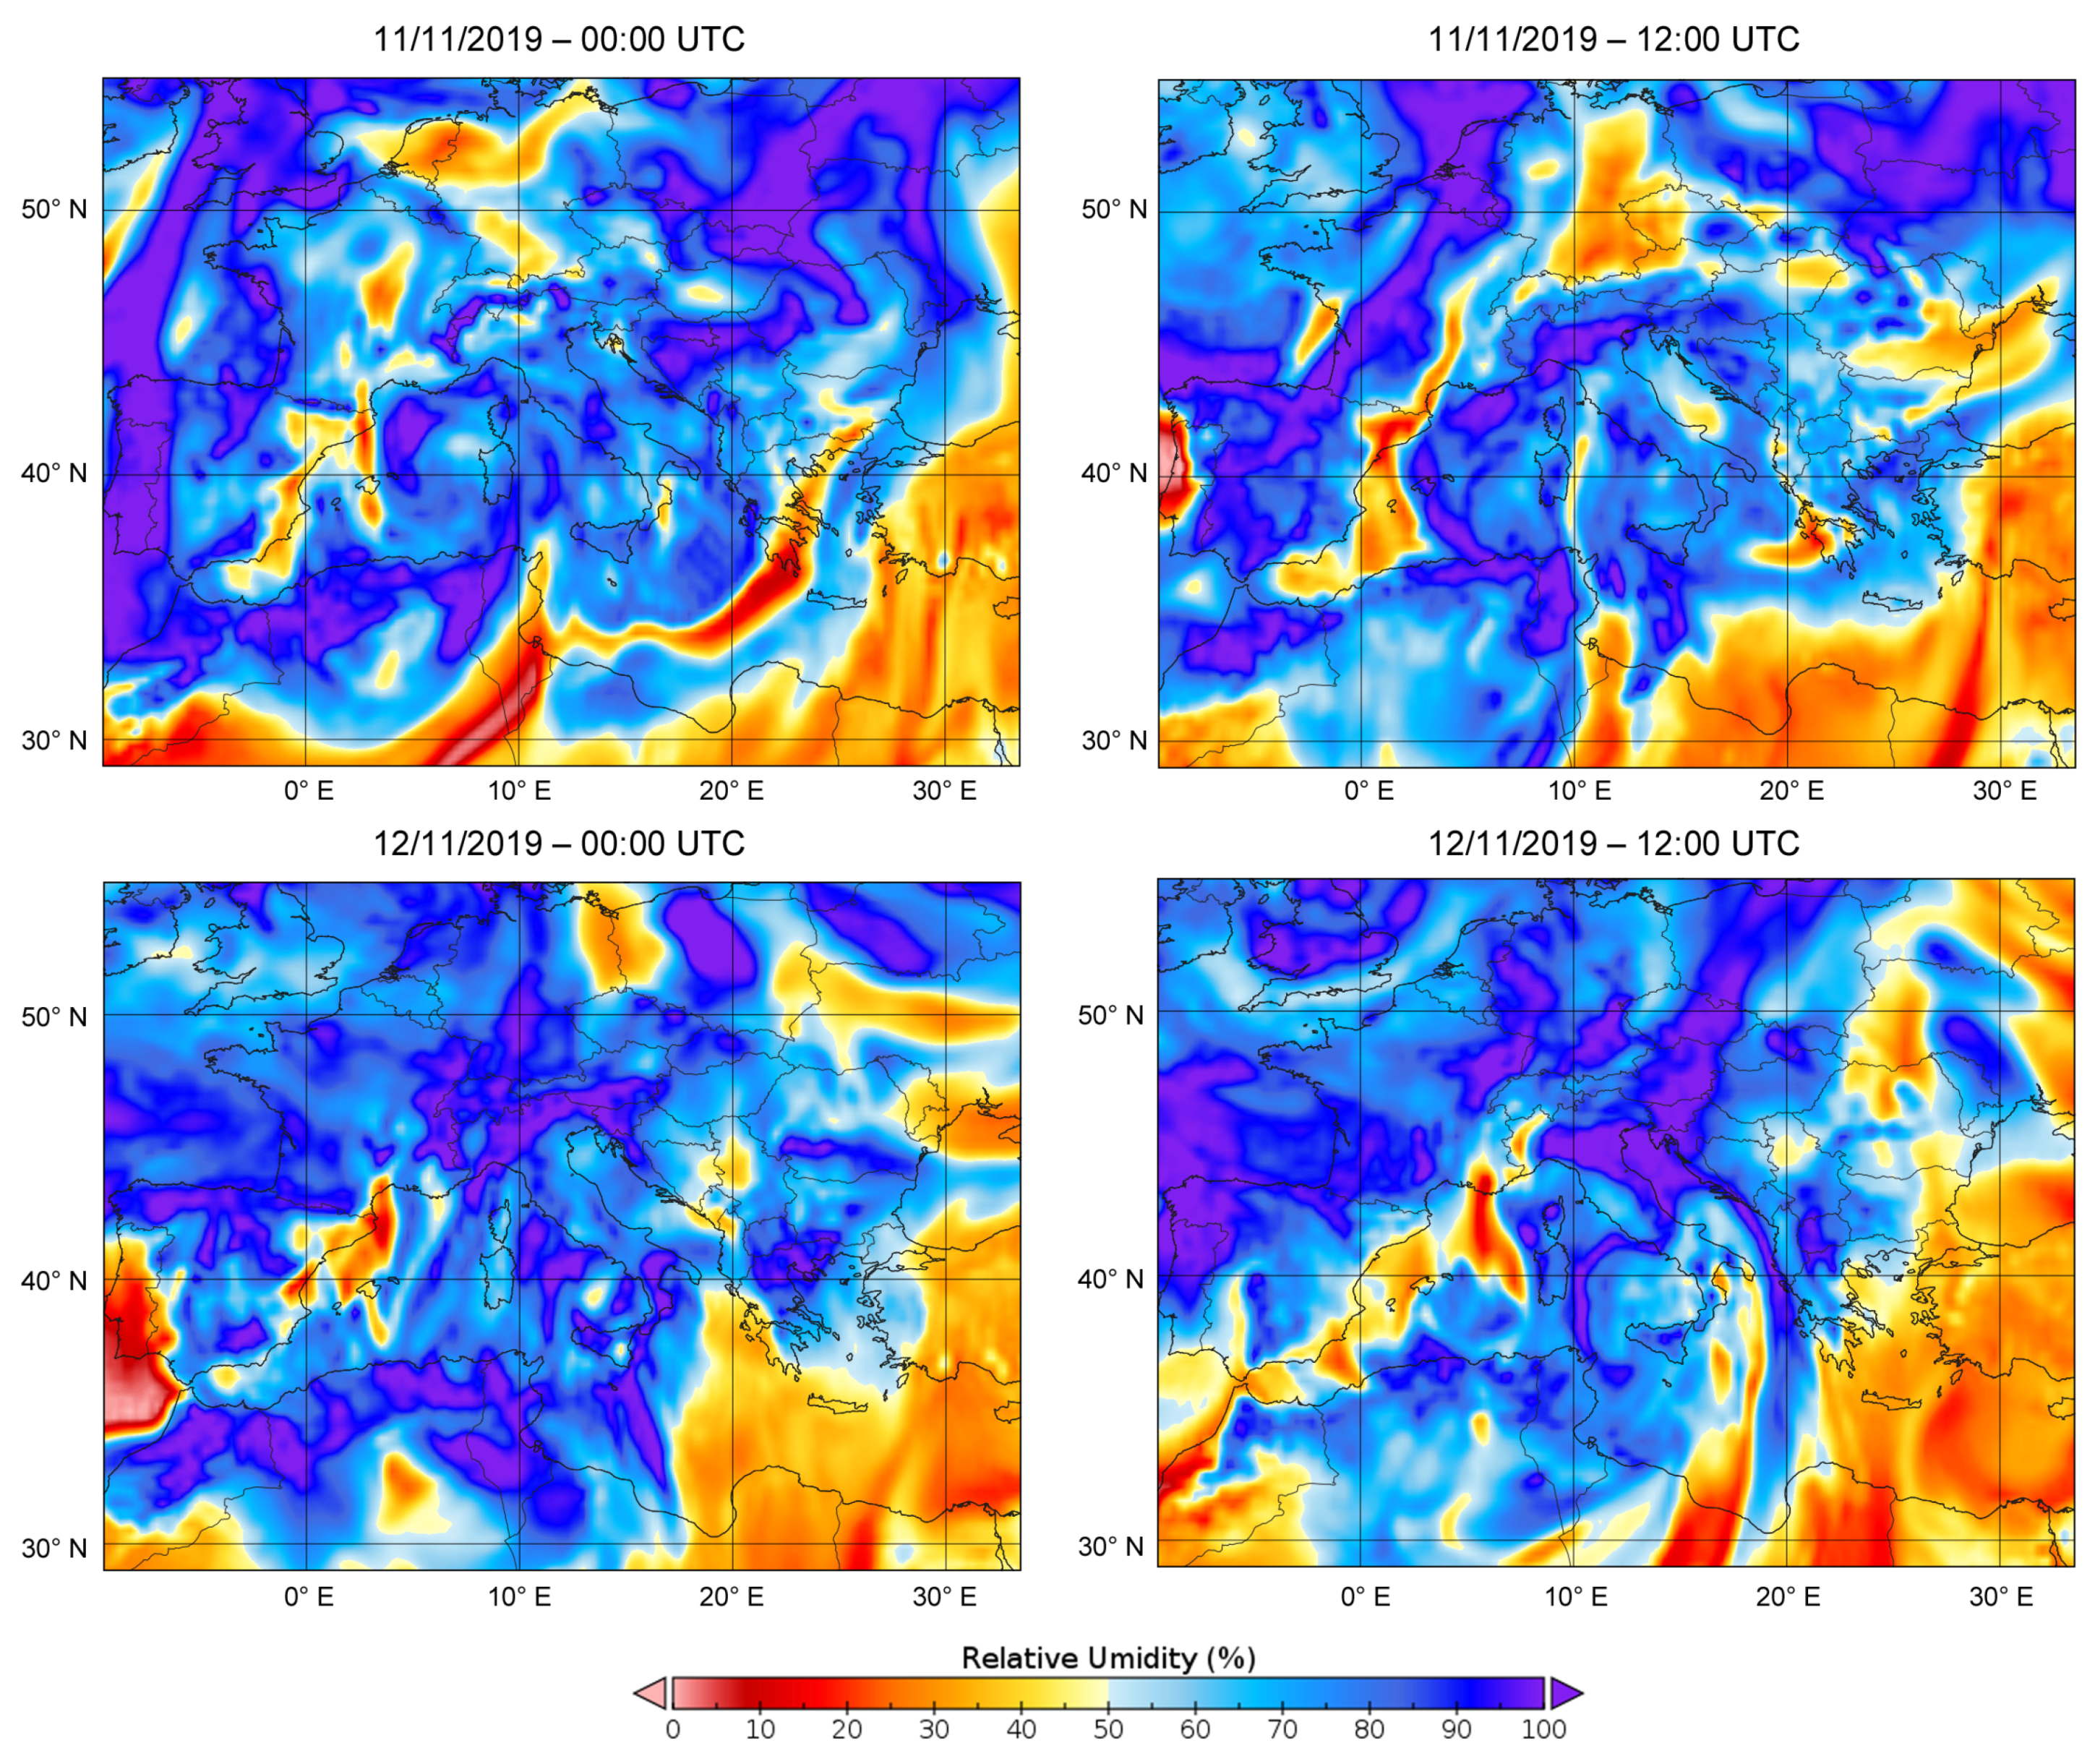
In particular, the genesis of the recorded meteorological event was due to different conditions. In fact, the baric situation described has triggered intense winds from the southern quadrants (see Figure 7), favoring the ascent of warm-humid air masses that have affected Sicily (see Figure 8 and Figure 9).
In addition, a significant contribution to the genesis of the meteorological event has been provided by the enormous quantity of water vapor released from the sea south of Sicily, still remarkably warm compared to the temperatures of the soil (Figure 4), to the air flow in the low layers.
Finally, the complex orography of Sicily plays an important role. In particular, in the eastern sector, the orographic forcing (adiabatic expansion [70,71], called Stau effect, due to the forced ascent caused by Etna and the Peloritani) favored the genesis of the convective motions.
Given the peculiar features of the expected meteorological event, the Centro Funzionale Decentrato–Idrogeologico (CDF-Idro) of the Dipartimento Regionale di Protezione Civile (DRPC) of Sicily, issued the red alert in the notice for the meteo-hydrogeological risk.
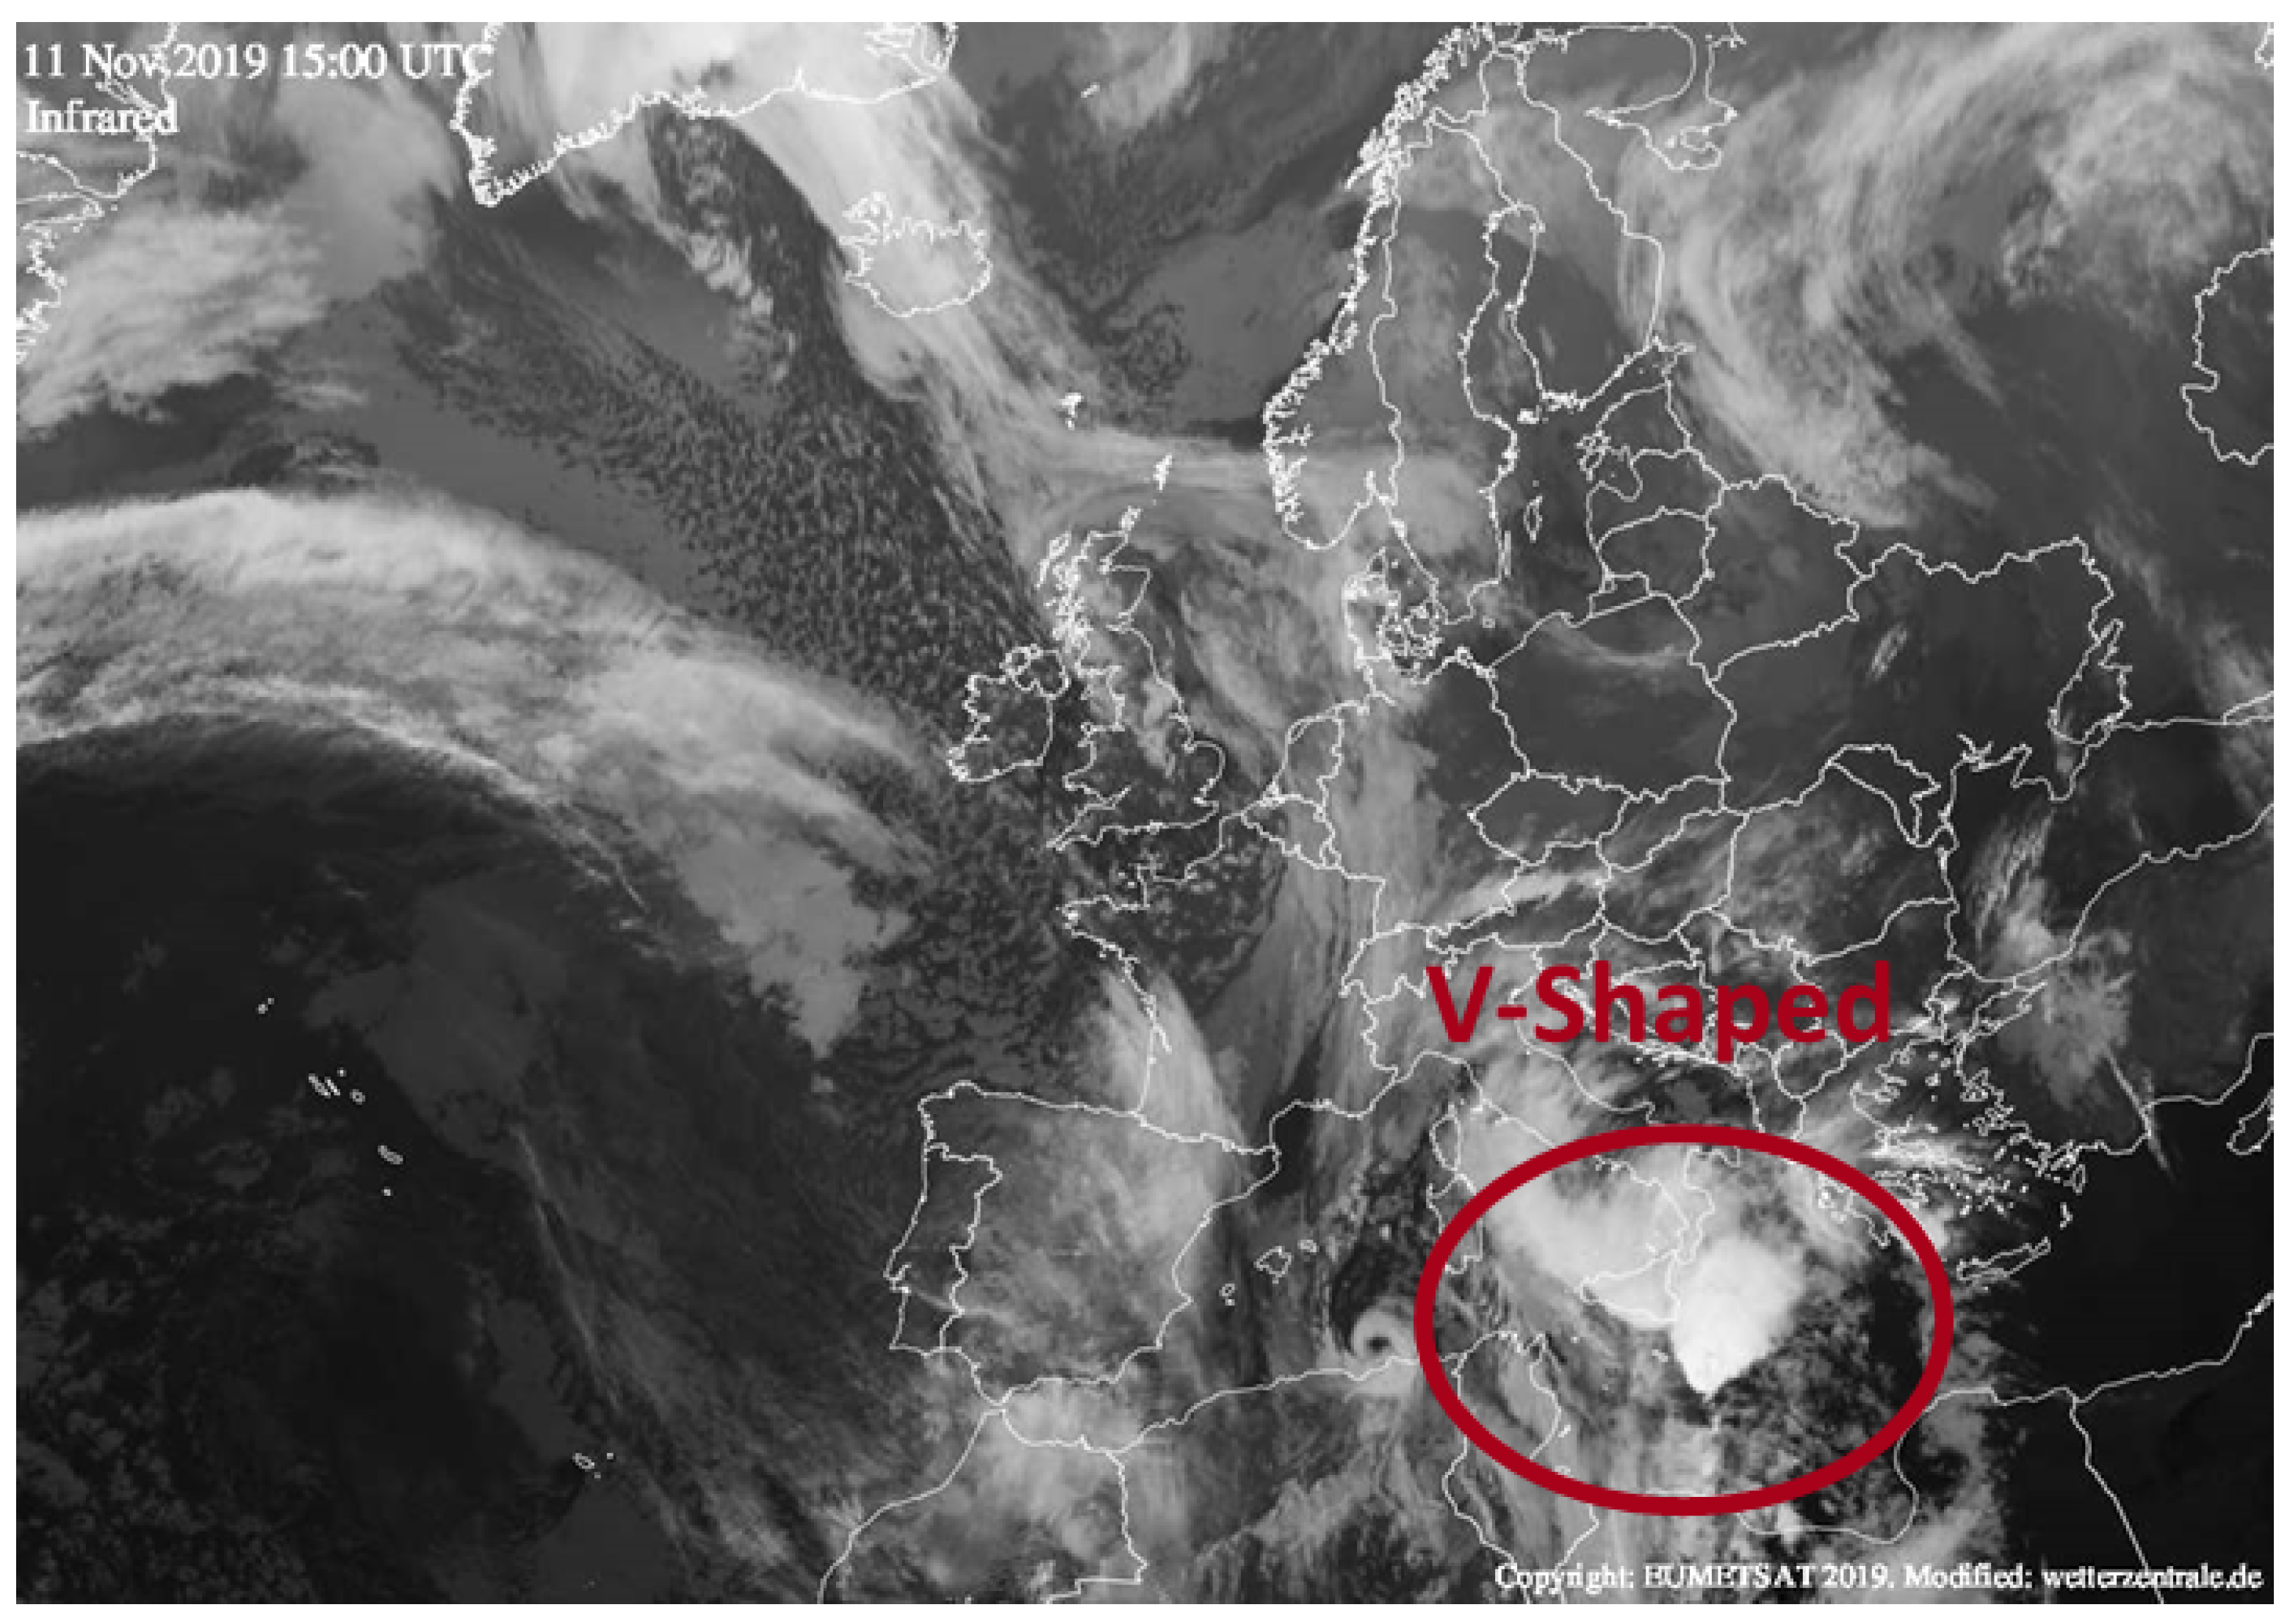
The infrared image from the EUMETSAT satellite (see Figure 10), at 15:00 UTC on 11 November 2019, shows the genesis of a particular thunderstorm structure called a V-shaped storm.
In this framework, intense and persistent storms, with intensive rainfall accumulations, were recorded in the central-southern and eastern sectors of Sicily. The highest rainfall was recorded during the afternoon hours of day 11 November 2019; persistent rainfall occurred on 12 November 2019.
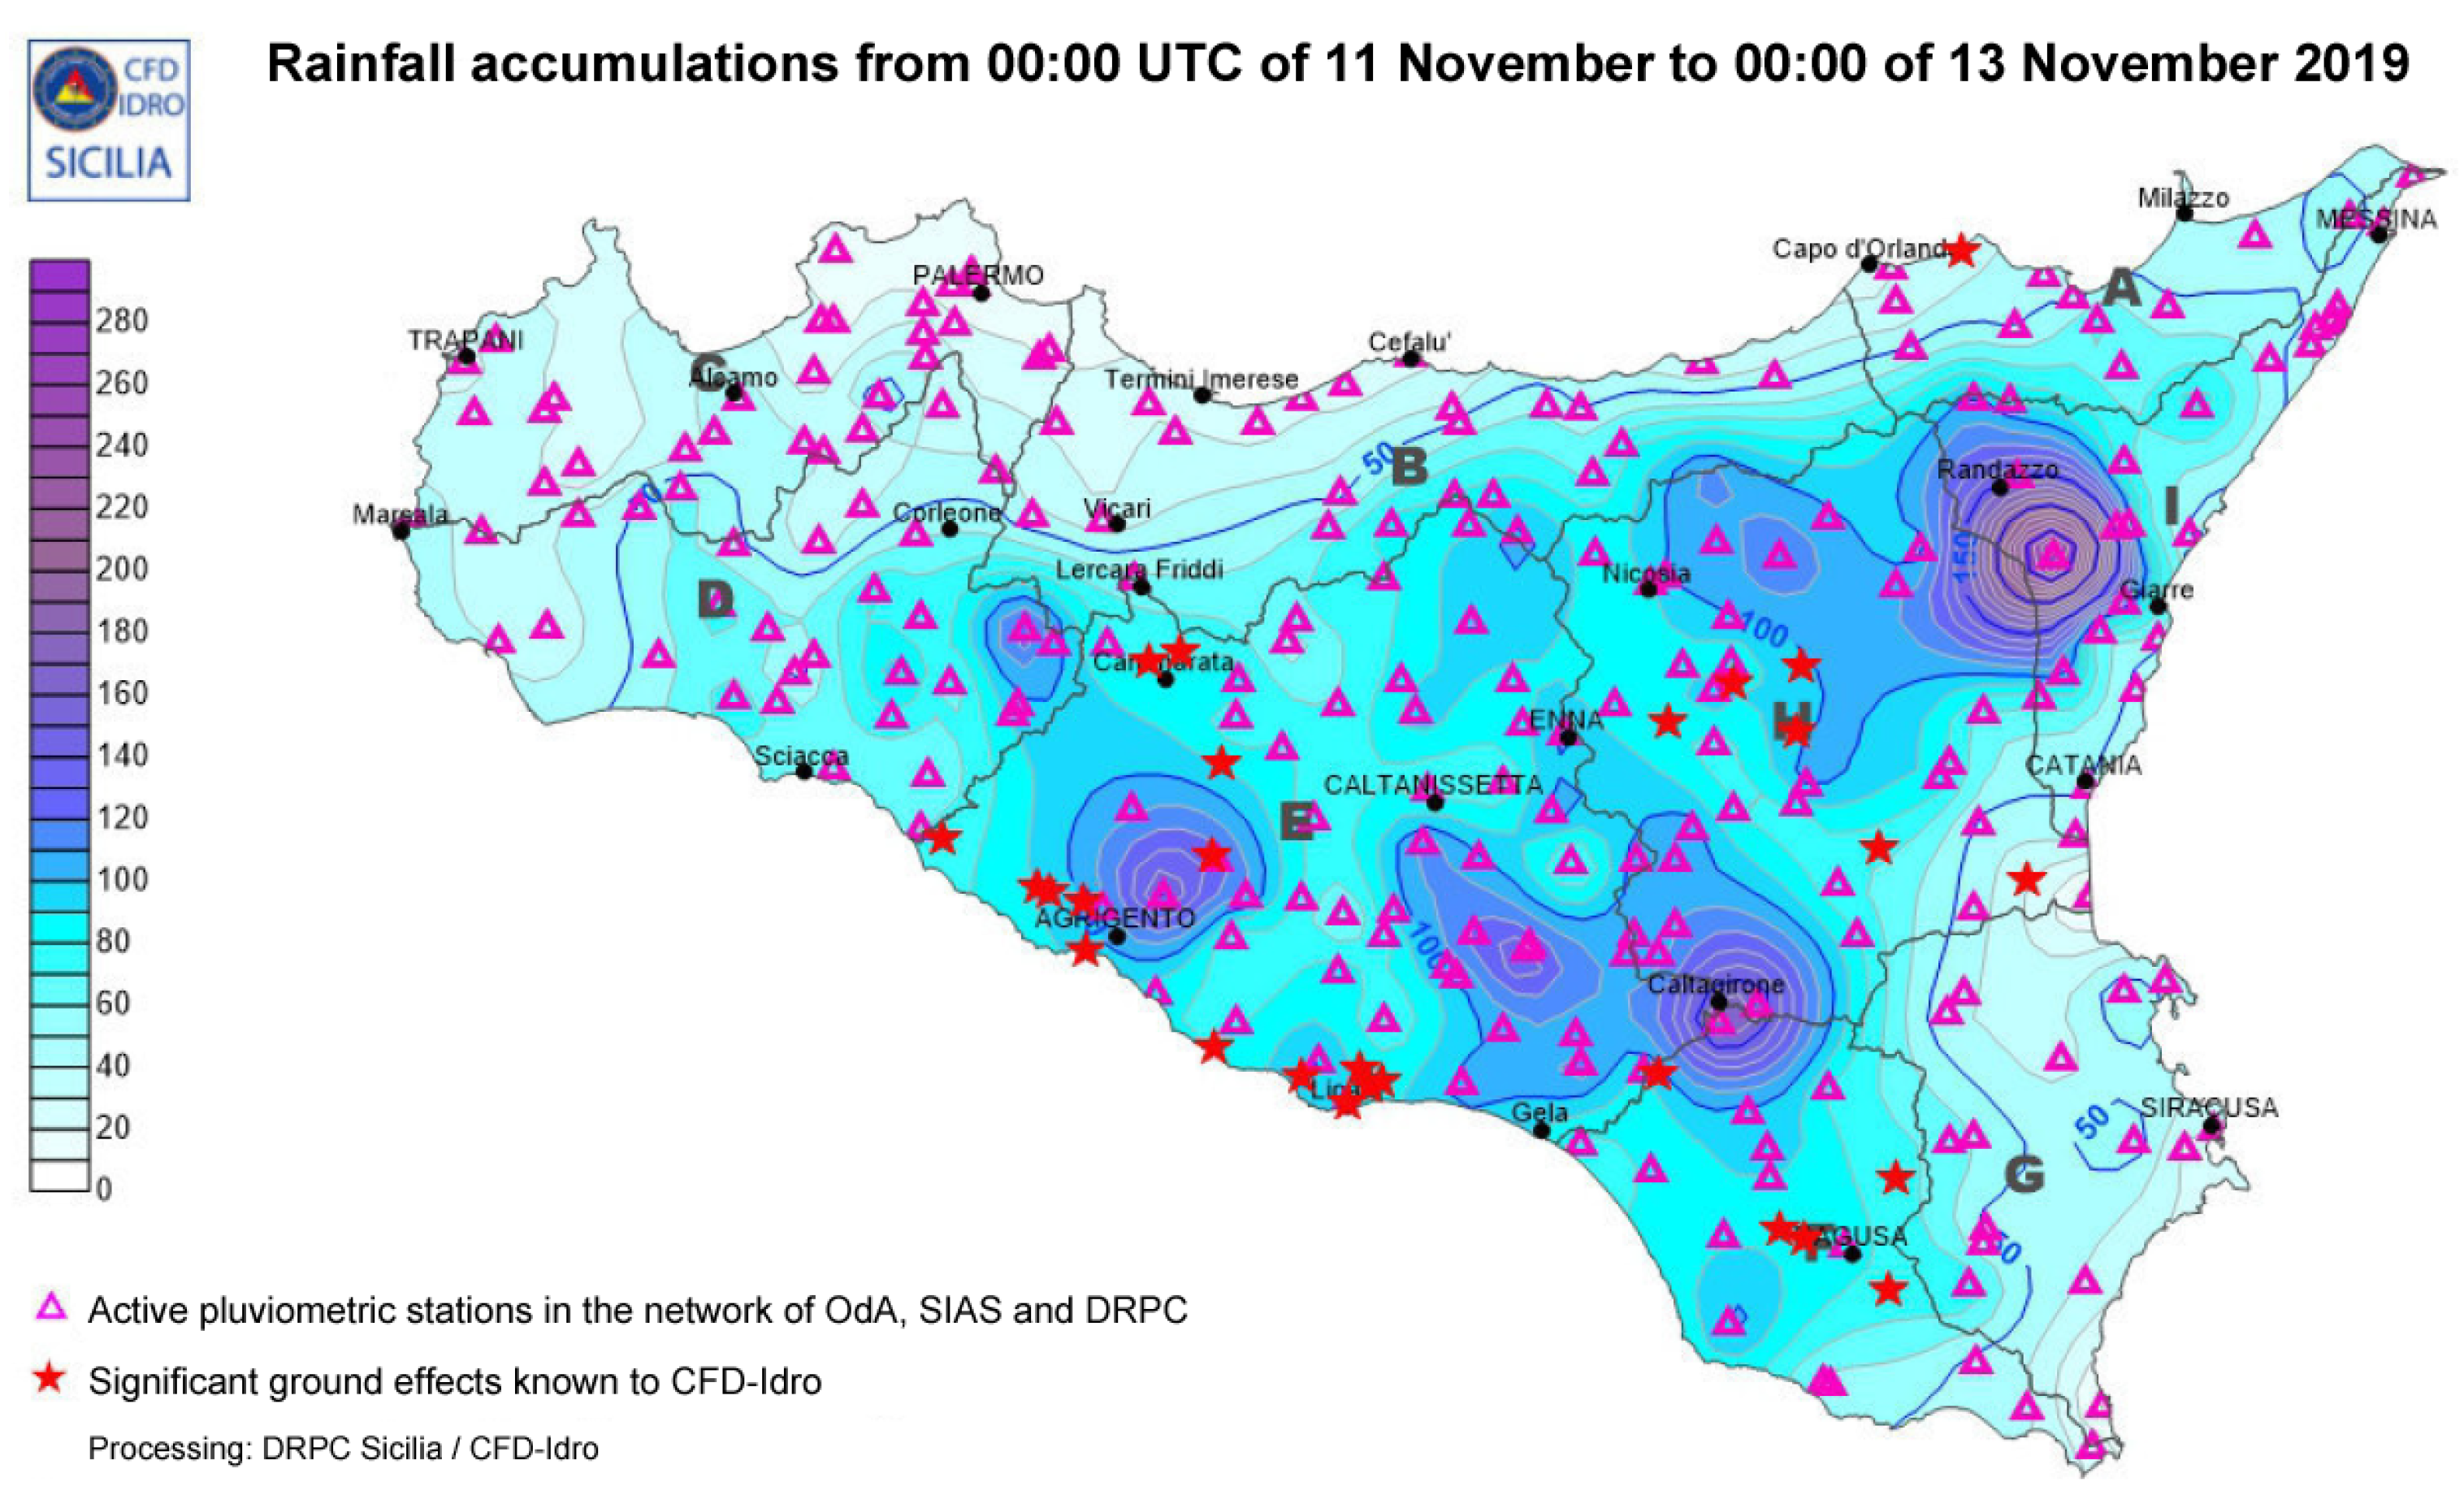
Figure 11 shows cumulative rainfall from 00:00 of 11 November 2019 to 00:00 of 13 November 2019, highlighting the hydrogeological and hydraulic effects on the ground.
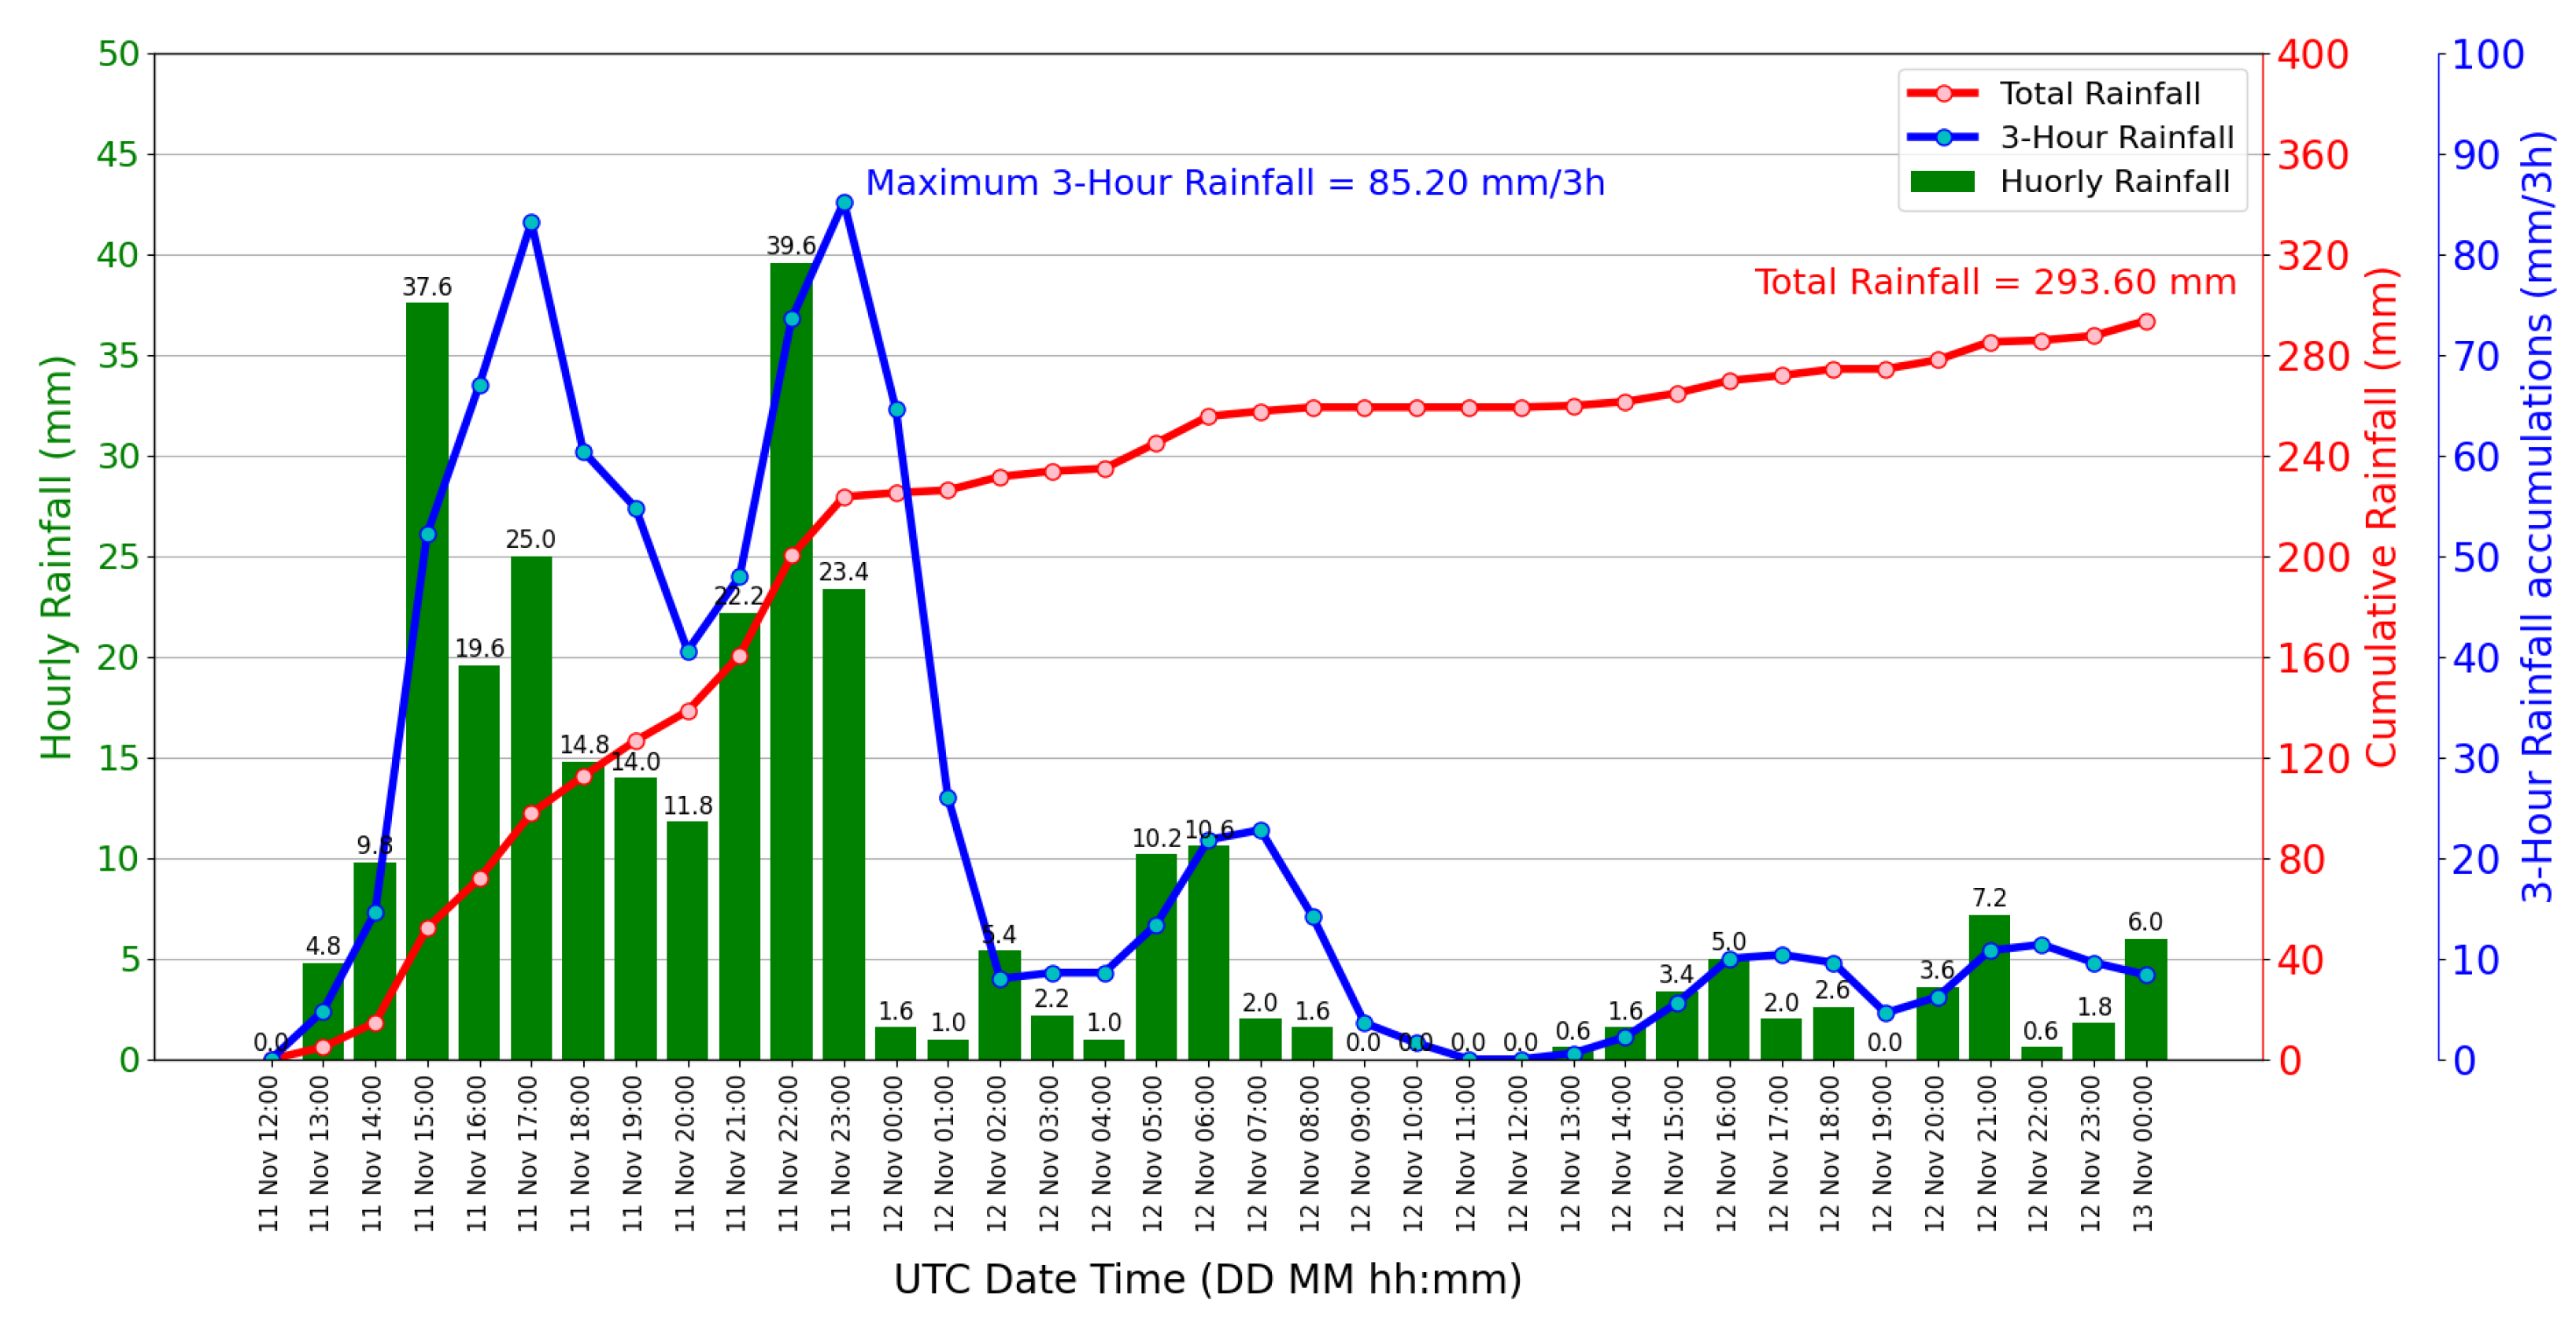
The Linguaglossa North Etna meteorological station recorded the maximum rainfall peak, equal to 293.6 mm. In Figure 12, the hourly precipitation (green bars), the total rainfall accumulations (red line) and the maximum precipitation every three hours (blue line), are shown. In particular, it can be noted that the most intense rainfall accumulations were recorded between 13:00 UTC and 23:00 UTC on 11 November 2019.
These weather conditions caused important effects on the ground, such as flooding in urban areas, debris spills along the roads, landslides, flooding of watercourses, fallen trees, and ingressions of the sea, with temporary evacuations and interruptions in rail and road connections.

3. Results and Discussion

With the aim to evaluate the capability of the WRF model in rainfall esitmation, two simulations were performed, adopting a nested domain with horizontal spatial grid resolution equal to 3 km: the first one without the use of the FDDA technique, the second one including the FDDA.
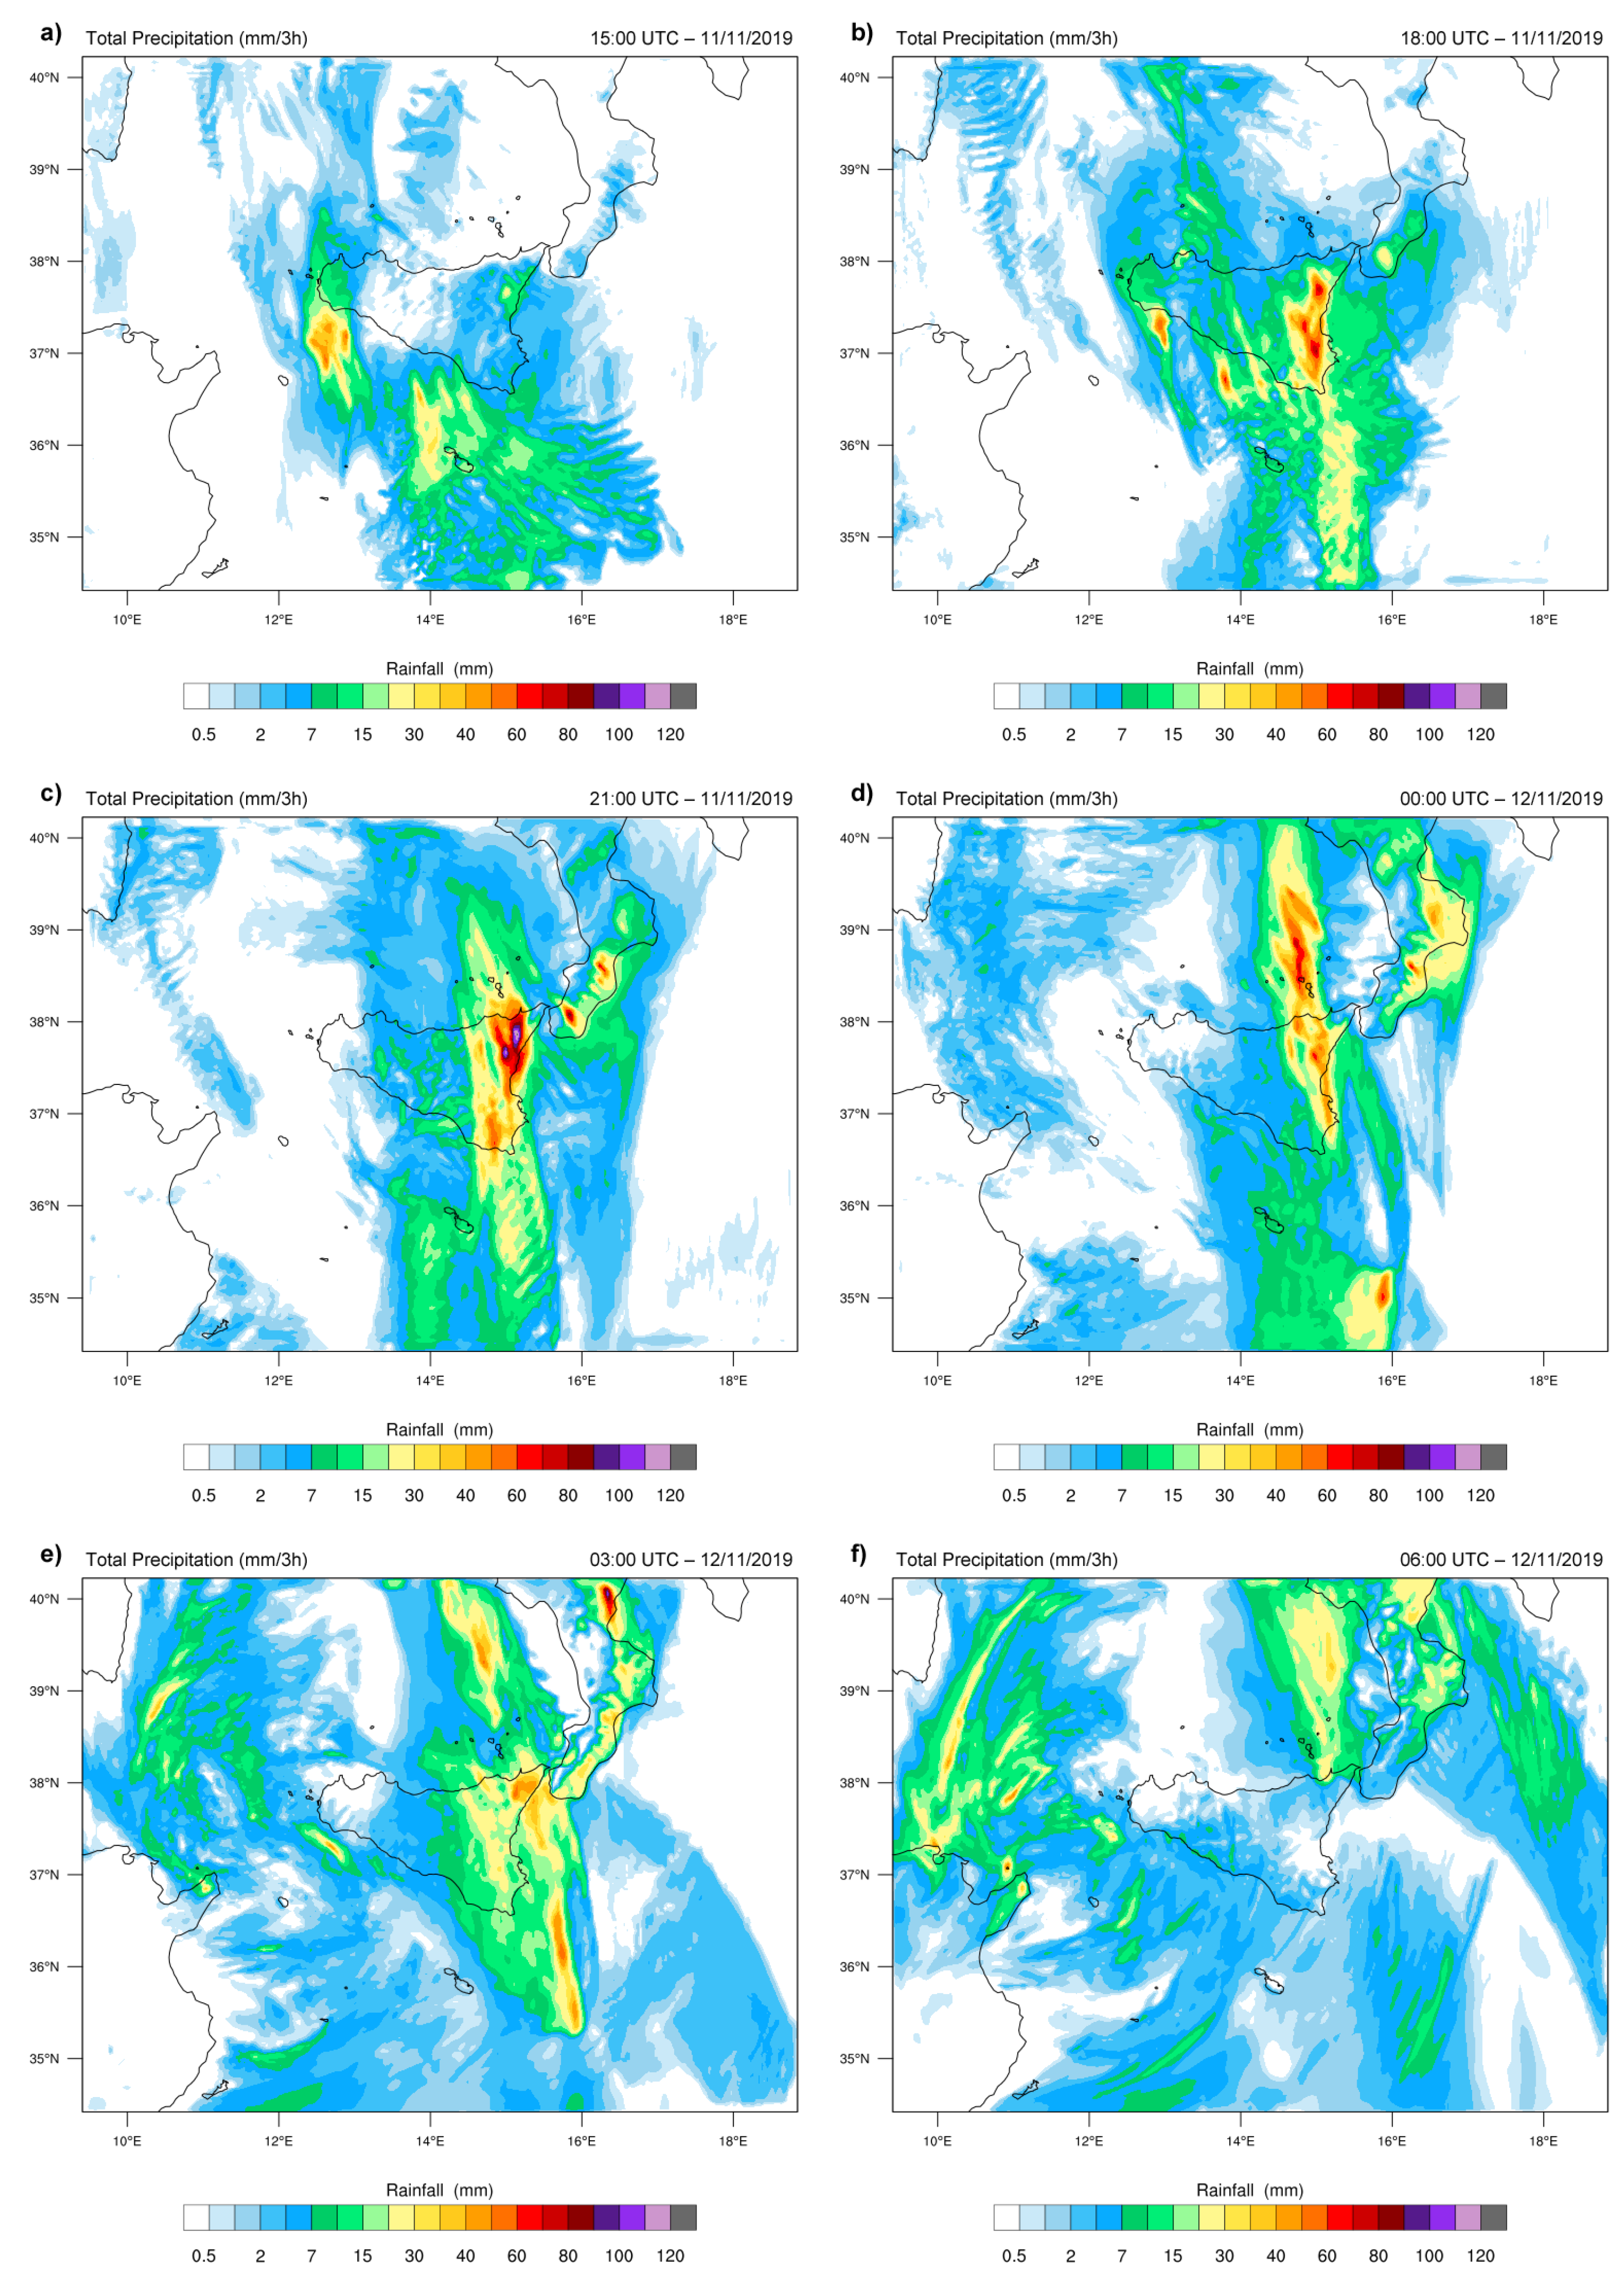
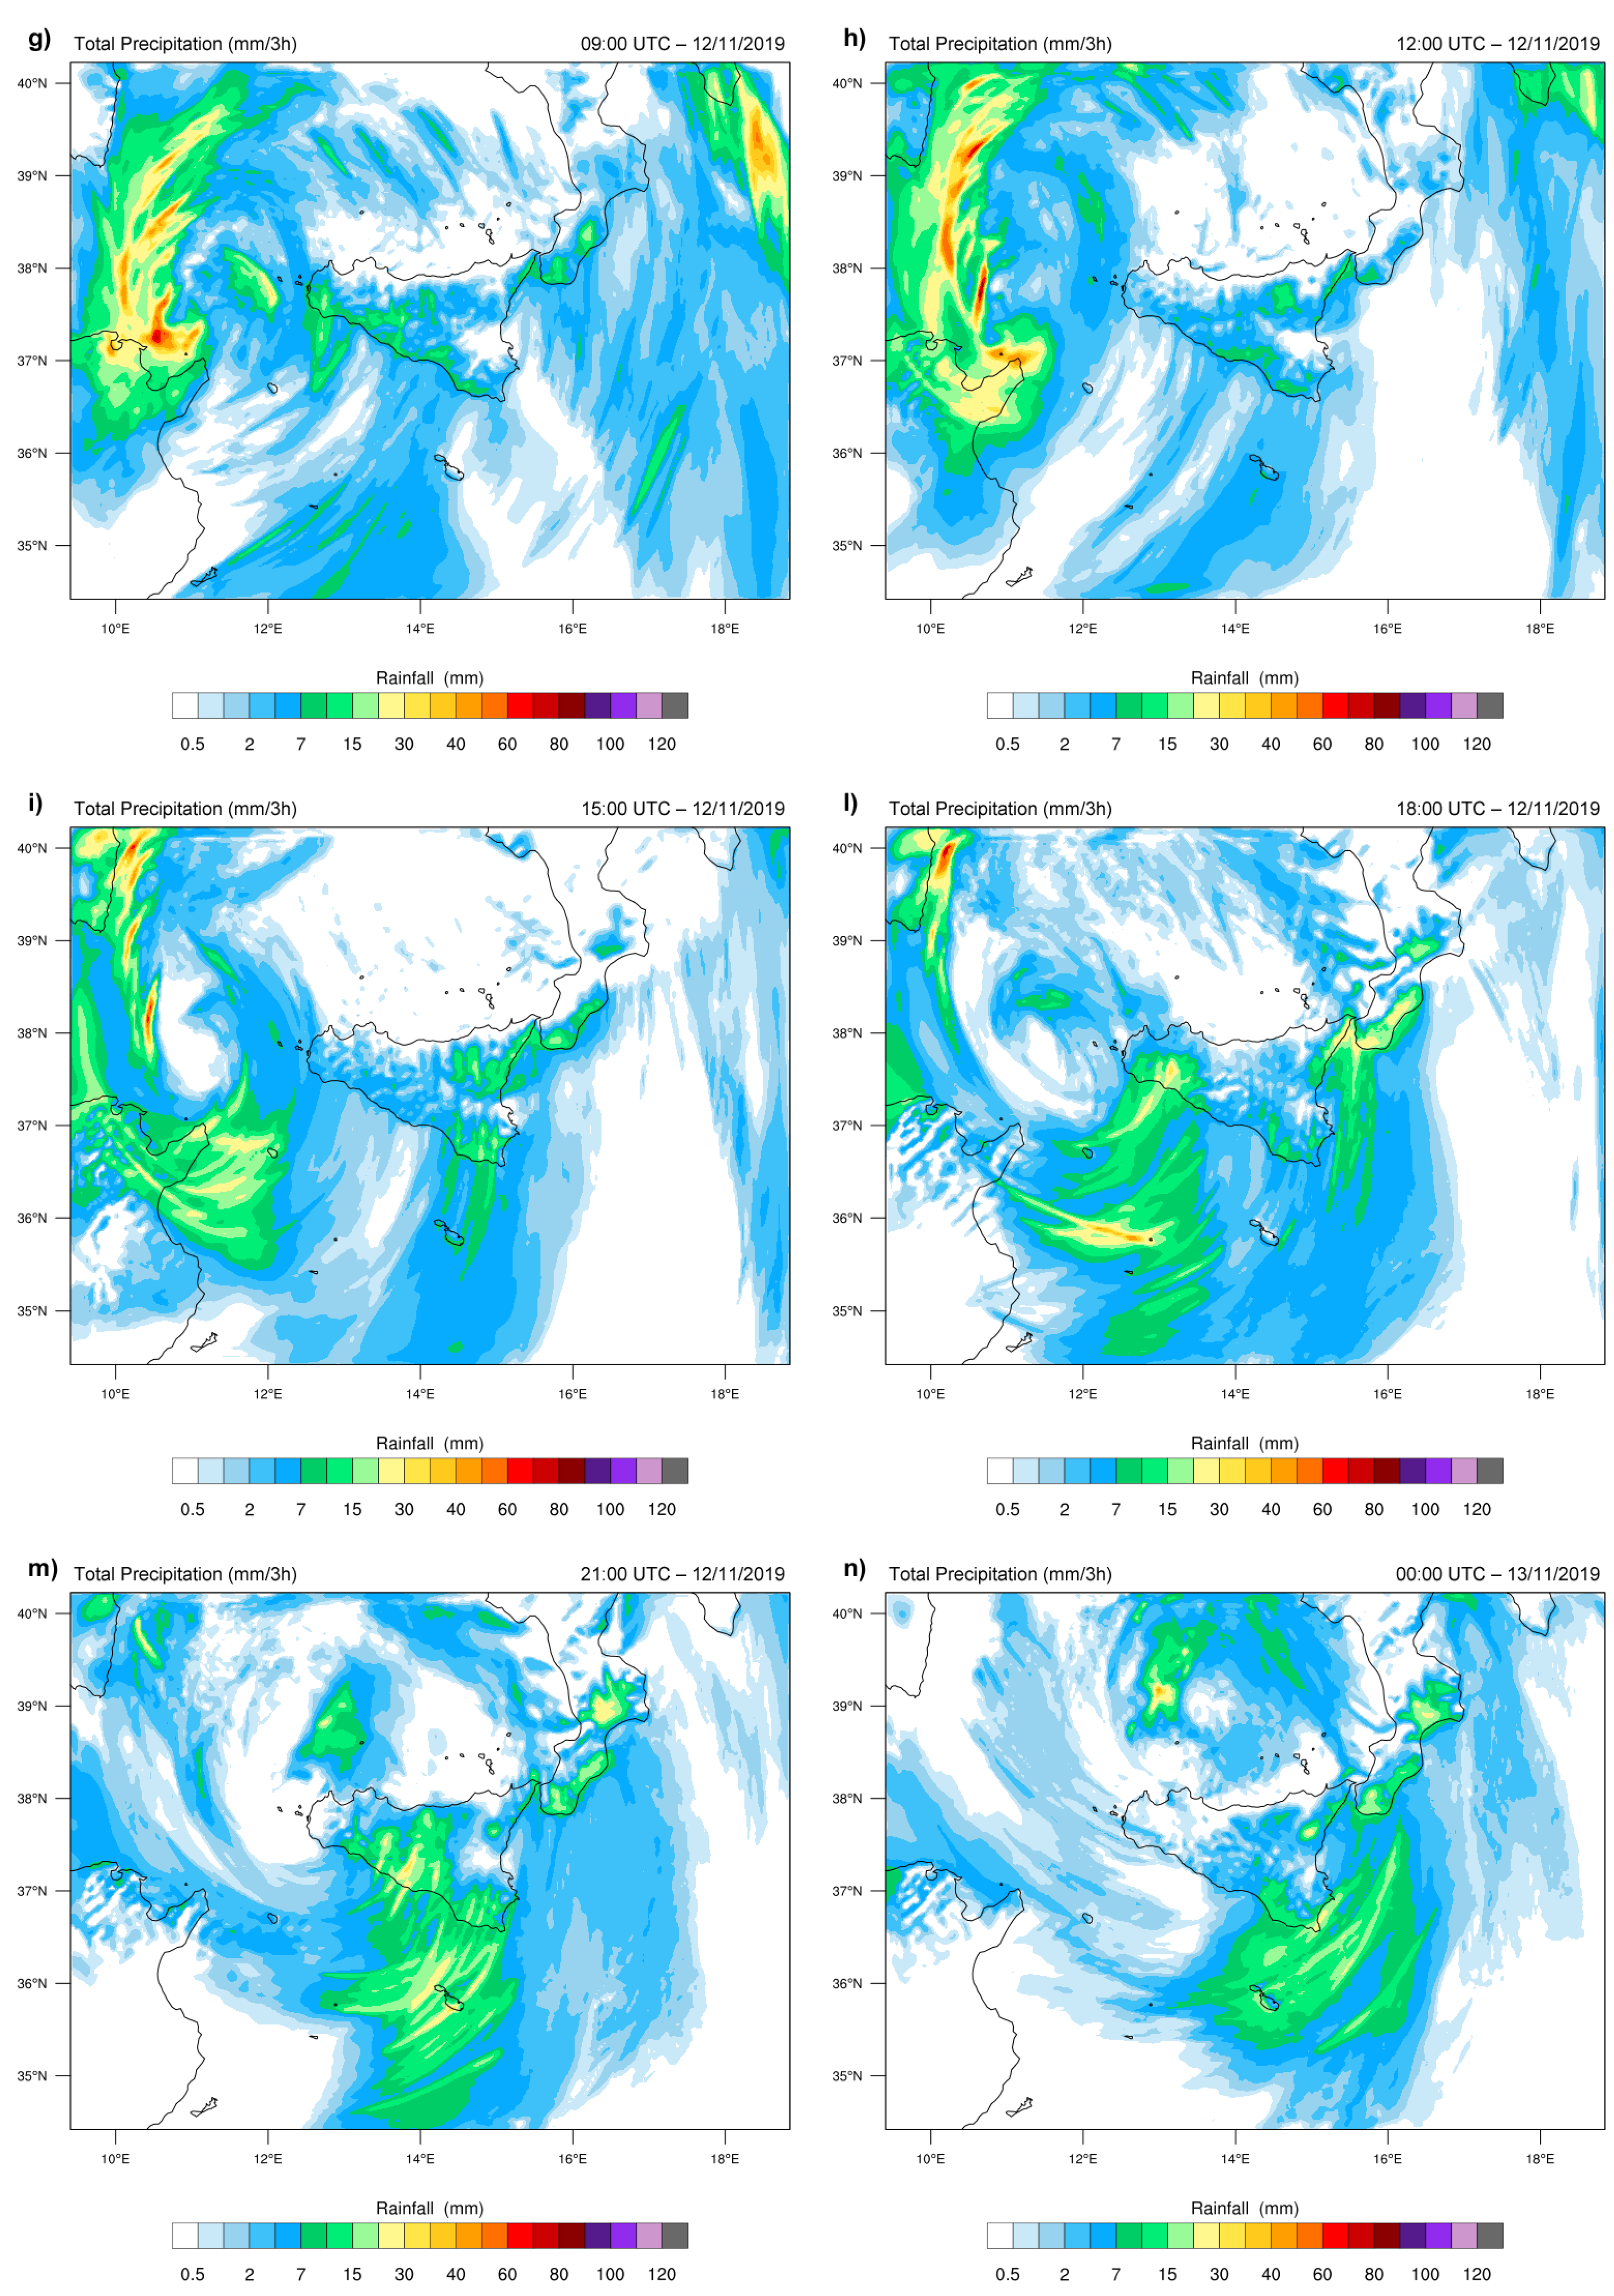
In Figure 13 are shown the maps of the forecasted rainfall accumulations at intervals of three hours, without the use of the FDDA technique. In particular, during the early afternoon of 11 November 2019 (from 12:00 UTC to 15:00 UTC), the simulation forecasted rainfall both for the western and eastern sectors of Sicily (panel a)). During the second part of the afternoon and the evening, rainfalls were forecasted in the entire Sicilian territory. However, the most intense phenomena were forecasted in the eastern sector, starting from the 15:00–18:00 UTC interval (panel b)), until the early hours of the following morning, (00:00–03:00 UTC, panel e)). The greatest accumulations (values of about 120 mm/3 h close to the Etna area) were expected in the 18:00–21:00 UTC interval of 11 November 2019. In the following hours of 12 November, less intense precipitations were forecasted in the entire region (from panel f) to panel n)).
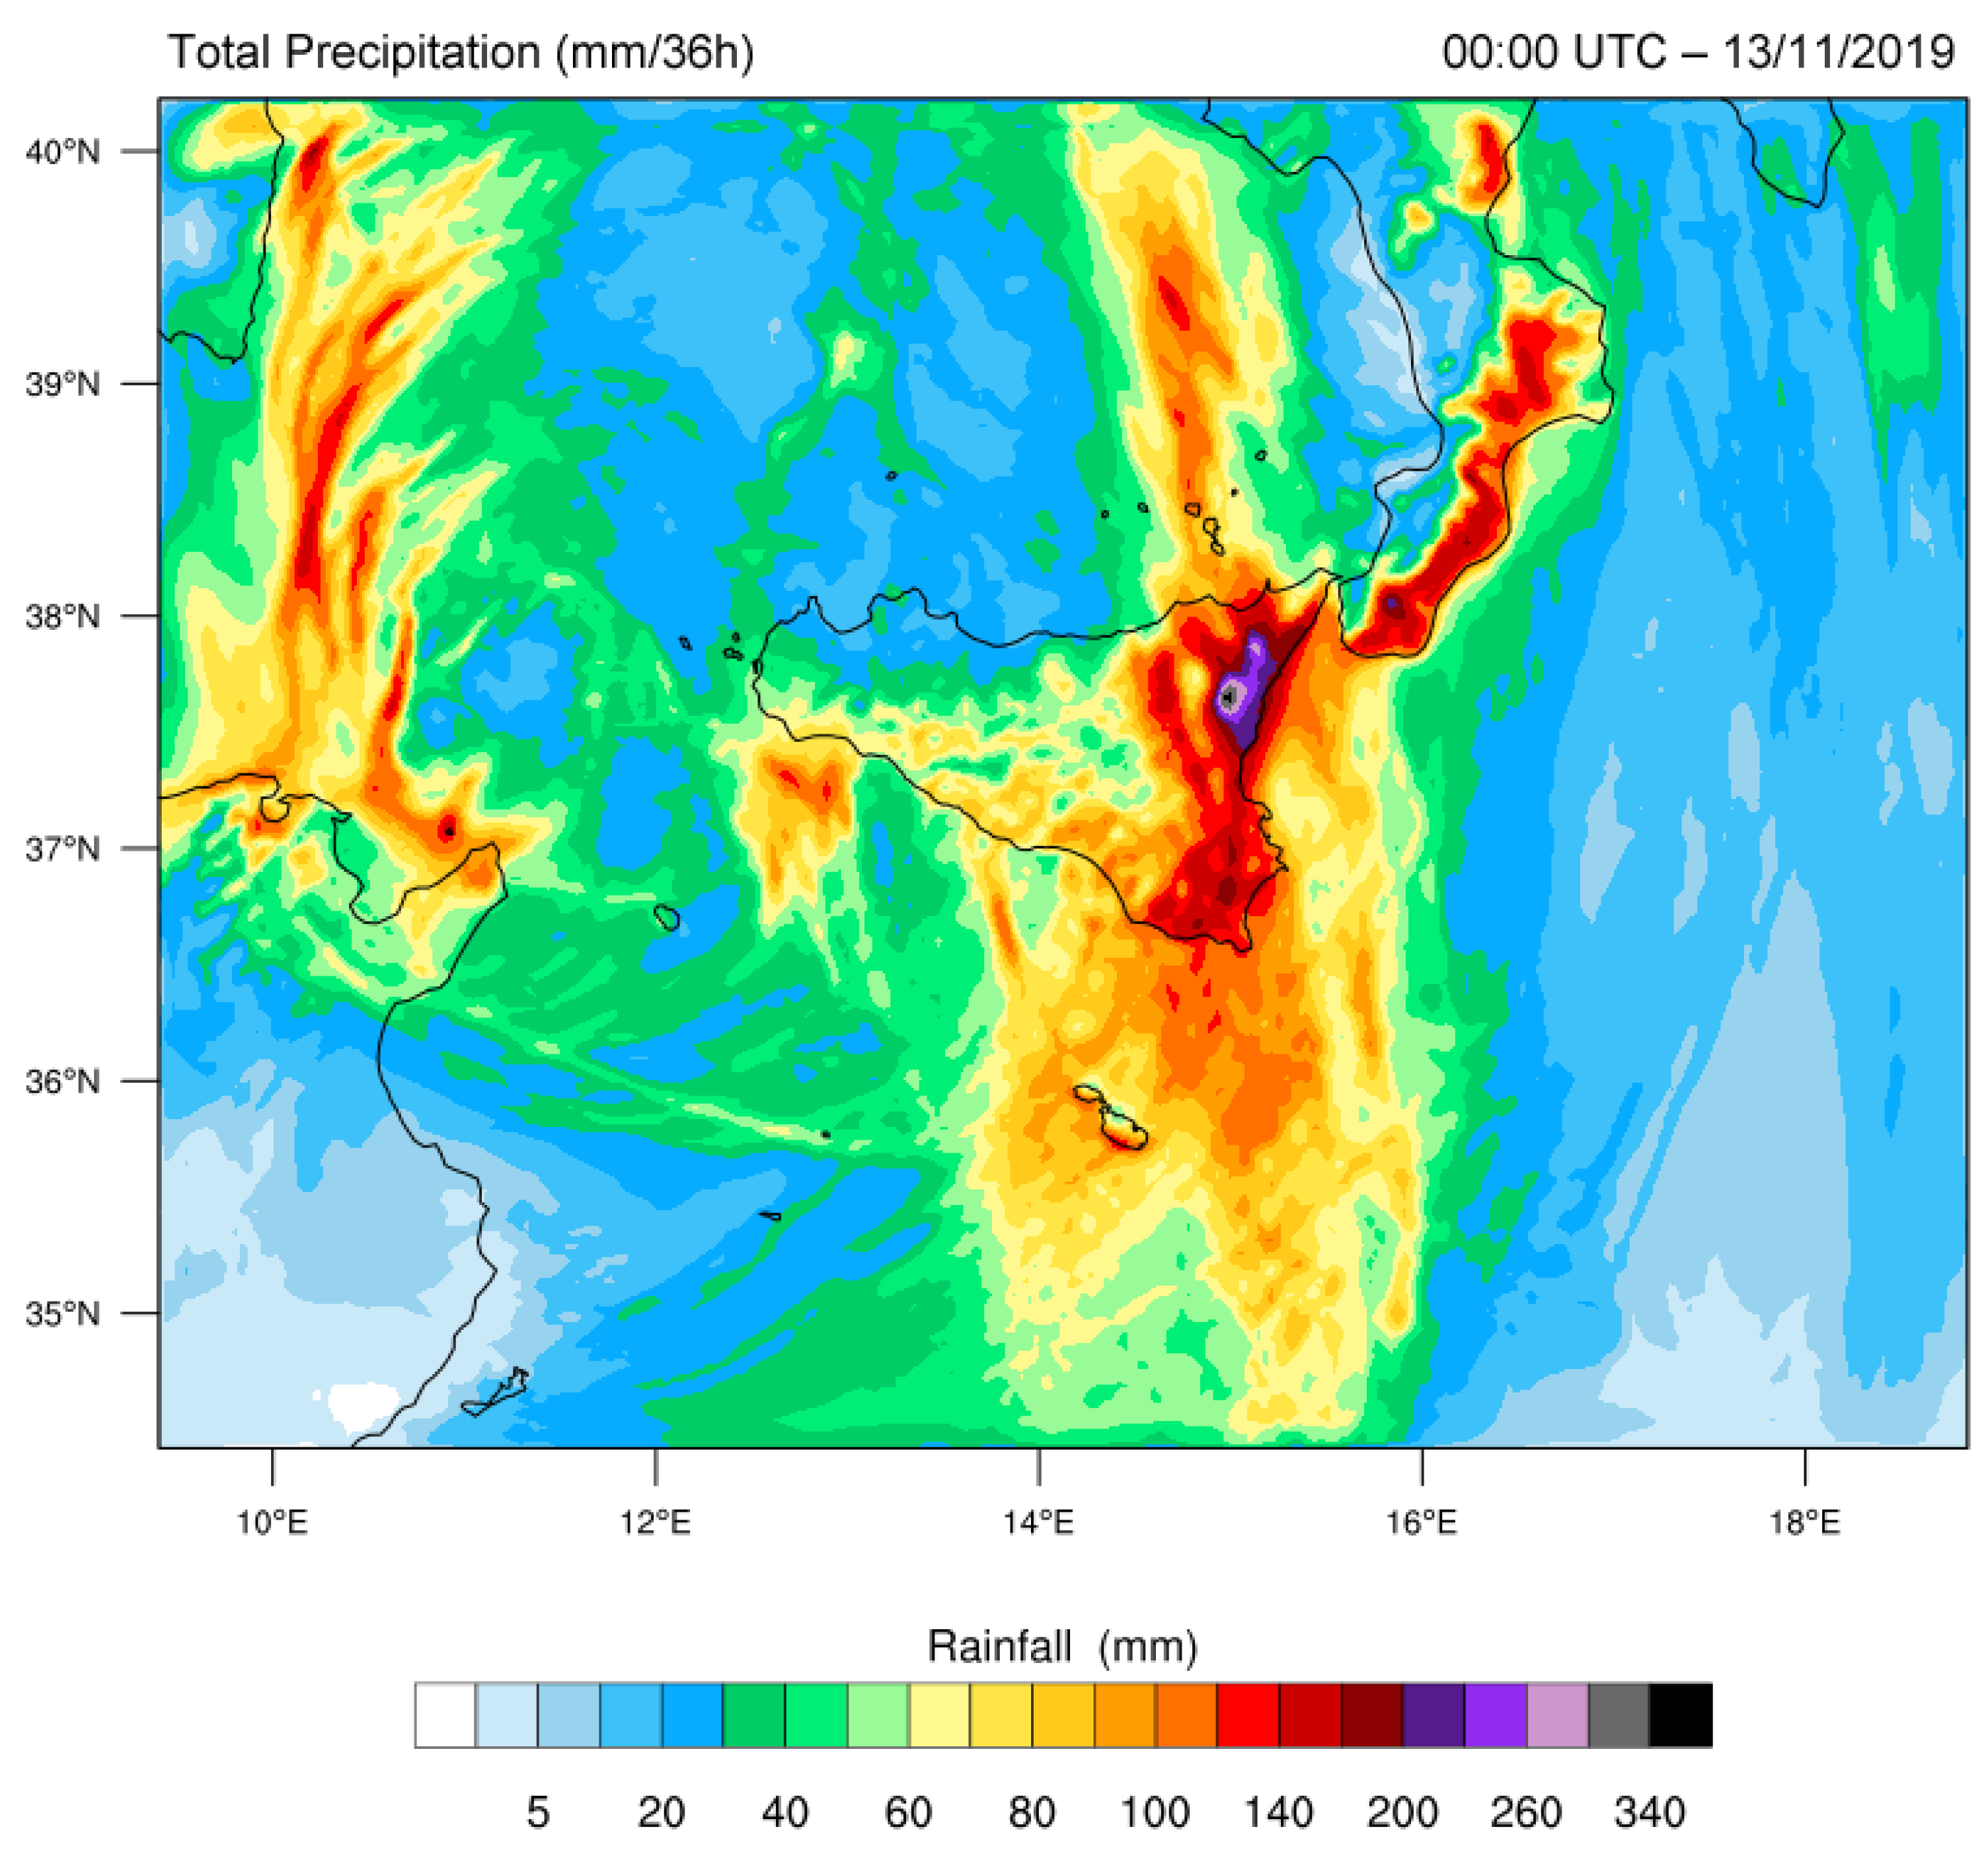
In Figure 14 is shown the rainfall accumulations map in 36 h. Particularly, in the Etna area and in Southeastern sectors of Sicily, the maximum expected peaks were about 340 mm/36 h and 140 mm/36 h respectively.
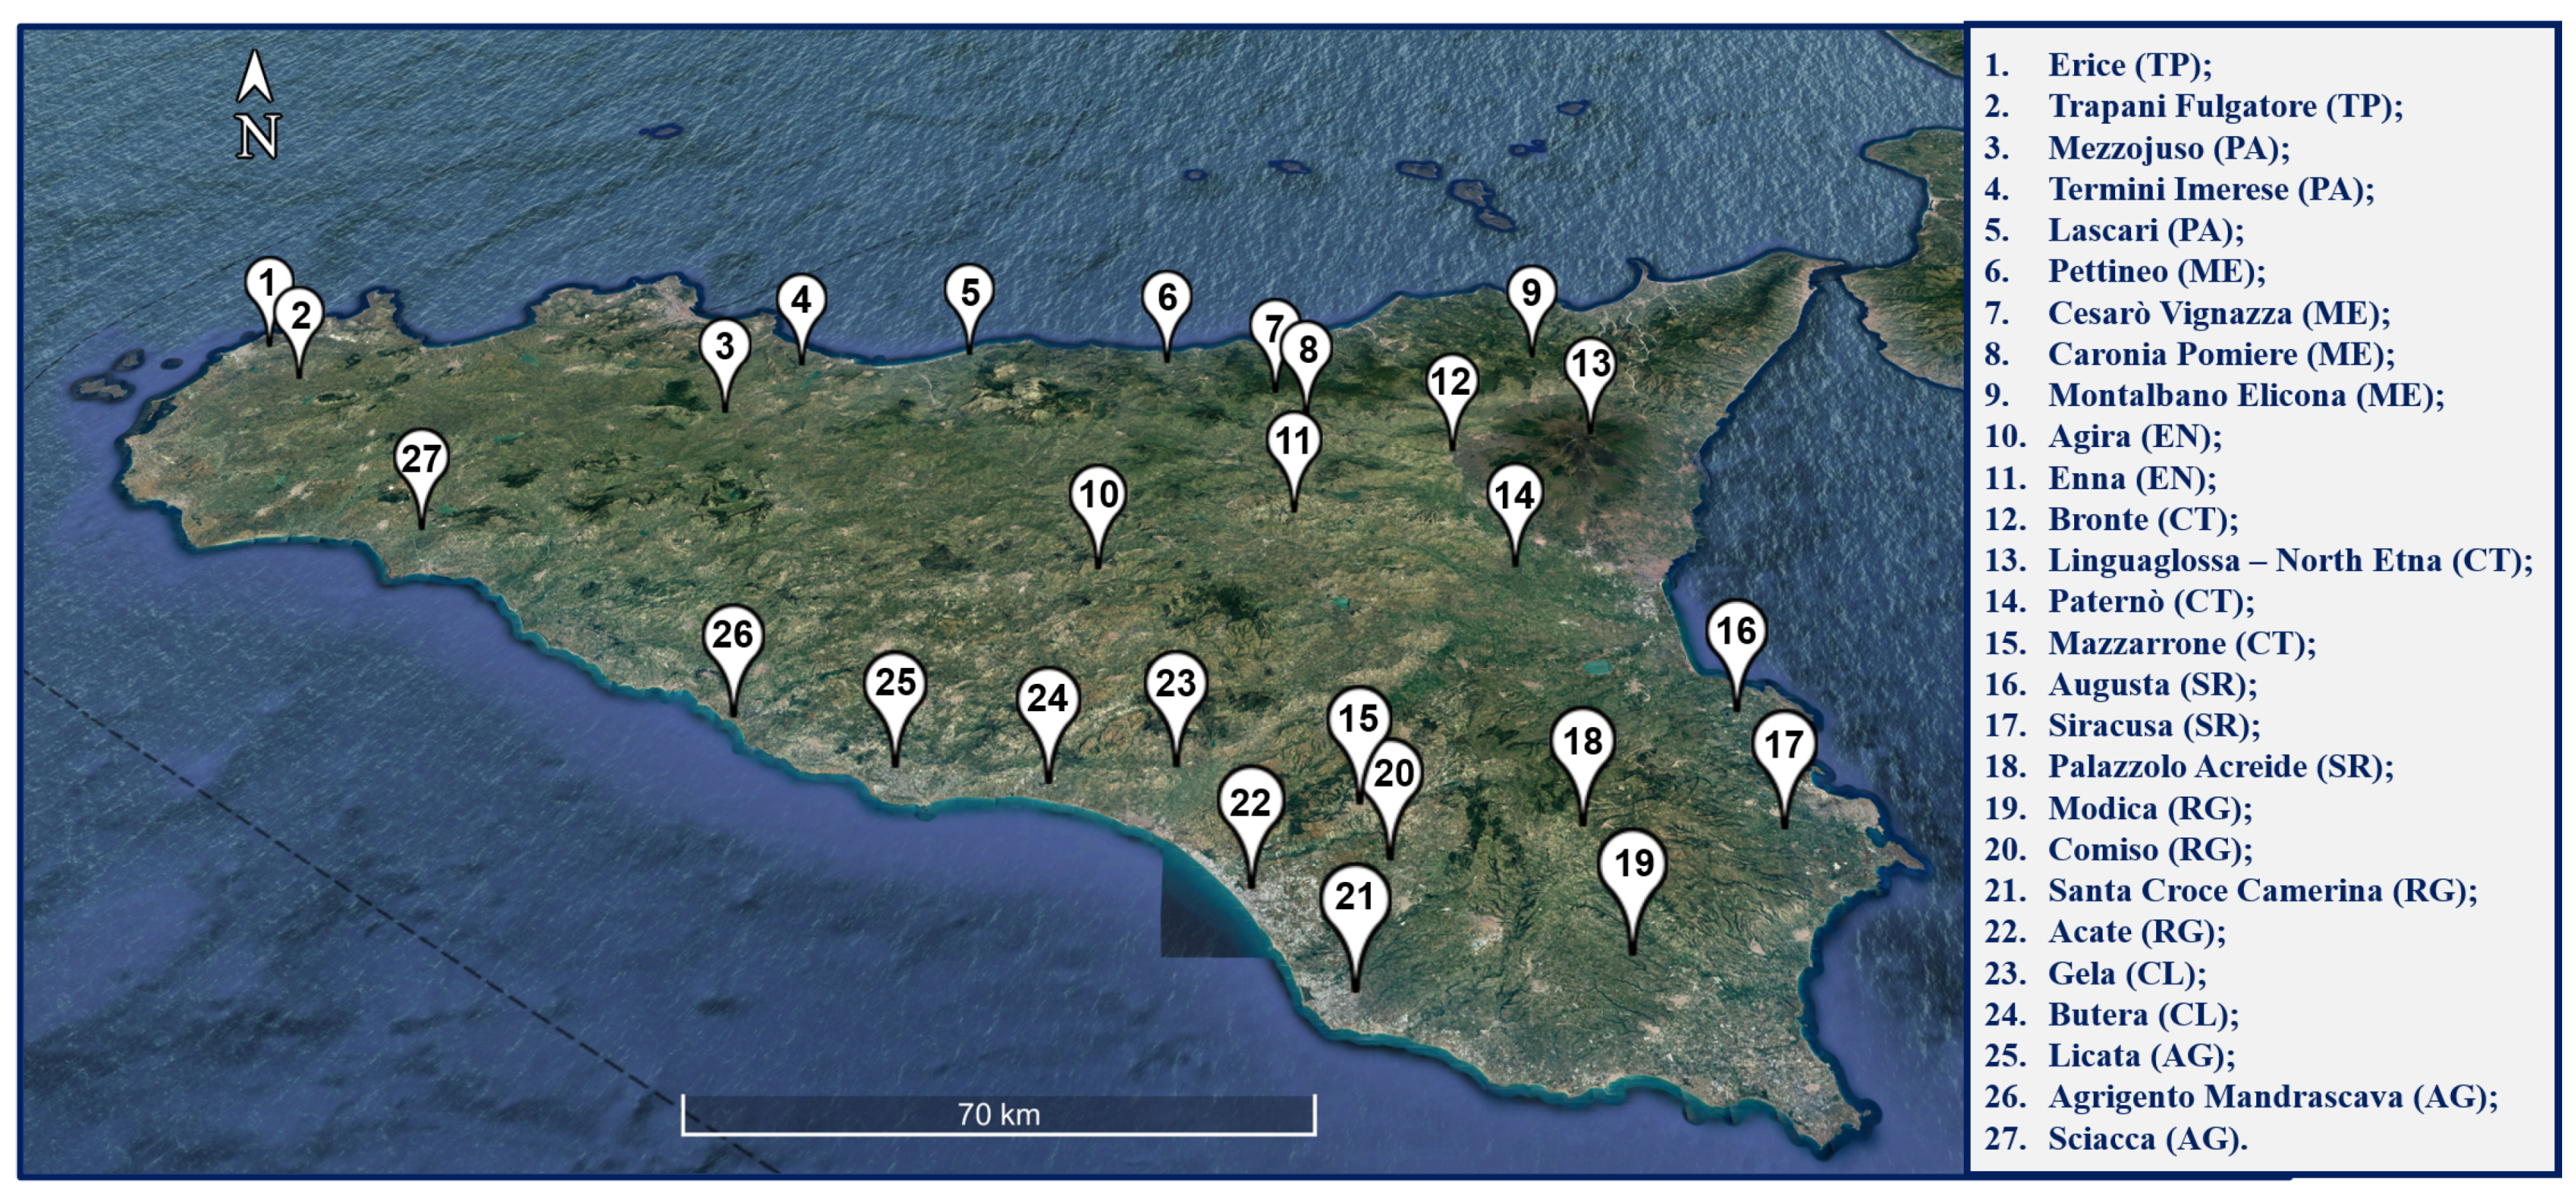
Moreover, in order to compare expected rainfall data with those observed in different areas of the Sicilian territory, the hourly rainfall accumulations in the geographical coordinates of 27 meteorological stations, belonging to the network of the Servizio Informativo Agrometeorologico Siciliano (SIAS), were extracted. These stations (geographical localisation shown in Figure 15) were chosen to take into account the features of the extreme weather event under consideration. In particular, the stations were placed: two in the province of Trapani (Erice, Trapani); three in the province of Palermo (Mezzojuso, Termini Imerese, Lascari); four in the province of Messina (Pettineo, Cesarò Vignazza, Caronia Pomiere, Montalbano Elicona); two in the province of Enna (Agira, Enna); four in the province of Catania (Bronte, Linguaglossa North Etna, Paternò, Mazzarrone); three in the province of Siracusa (Augusta, Siracusa, Palazzolo Acreide); four in the province of Ragusa (Modica, Comiso, Santa Croce Camerina, Acate); two in the province of Caltanissetta (Gela, Butera); and three in the province of Agrigento (Licata, Agrigento Mandrascava, Sciacca).
Table 2 shows the comparison between total rainfall accumulations observed by the meteorological stations and those simulated by the WRF model, starting from 12:00 UTC of 11 November 2019 to 00:00 UTC of 13 November 2019.
Total rainfall accumulations close or higher to 100 mm were observed from the following weather stations: Licata (95.6 mm), Agira (101.6 mm), Cesarò Vignazza (101.8 mm), Butera (102.2 mm), Bronte (108.4 mm), Gela (114.4 mm), Caronia Pomiere (115.4 mm) and North Etna (293.6 mm). In these points, the WRF simulation forecasted total rainfall accumulations equal to: Licata (84.4), Agira (81.2 mm), Cesarò Vignazza (151.3 mm), Butera (91.3 mm), Bronte (109.9 mm), Gela (97.2 mm), Caronia Pomiere (104.1 mm), and Linguaglossa North Etna (328.3 mm).
Therefore, there is a good accordance between forecasted data and those observed, in particular in the maximum values (in Linguaglossa North Etna). However, from the comparison, it is evident that the simulation overestimates the expected rainfall accumulations in the Southeastern areas of Sicily (Siracusa and Ragusa).
Regarding the simulation with the FDDA technique, in Figure 16, the maps of expected rainfall accumulations at time intervals of three hours, are shown.
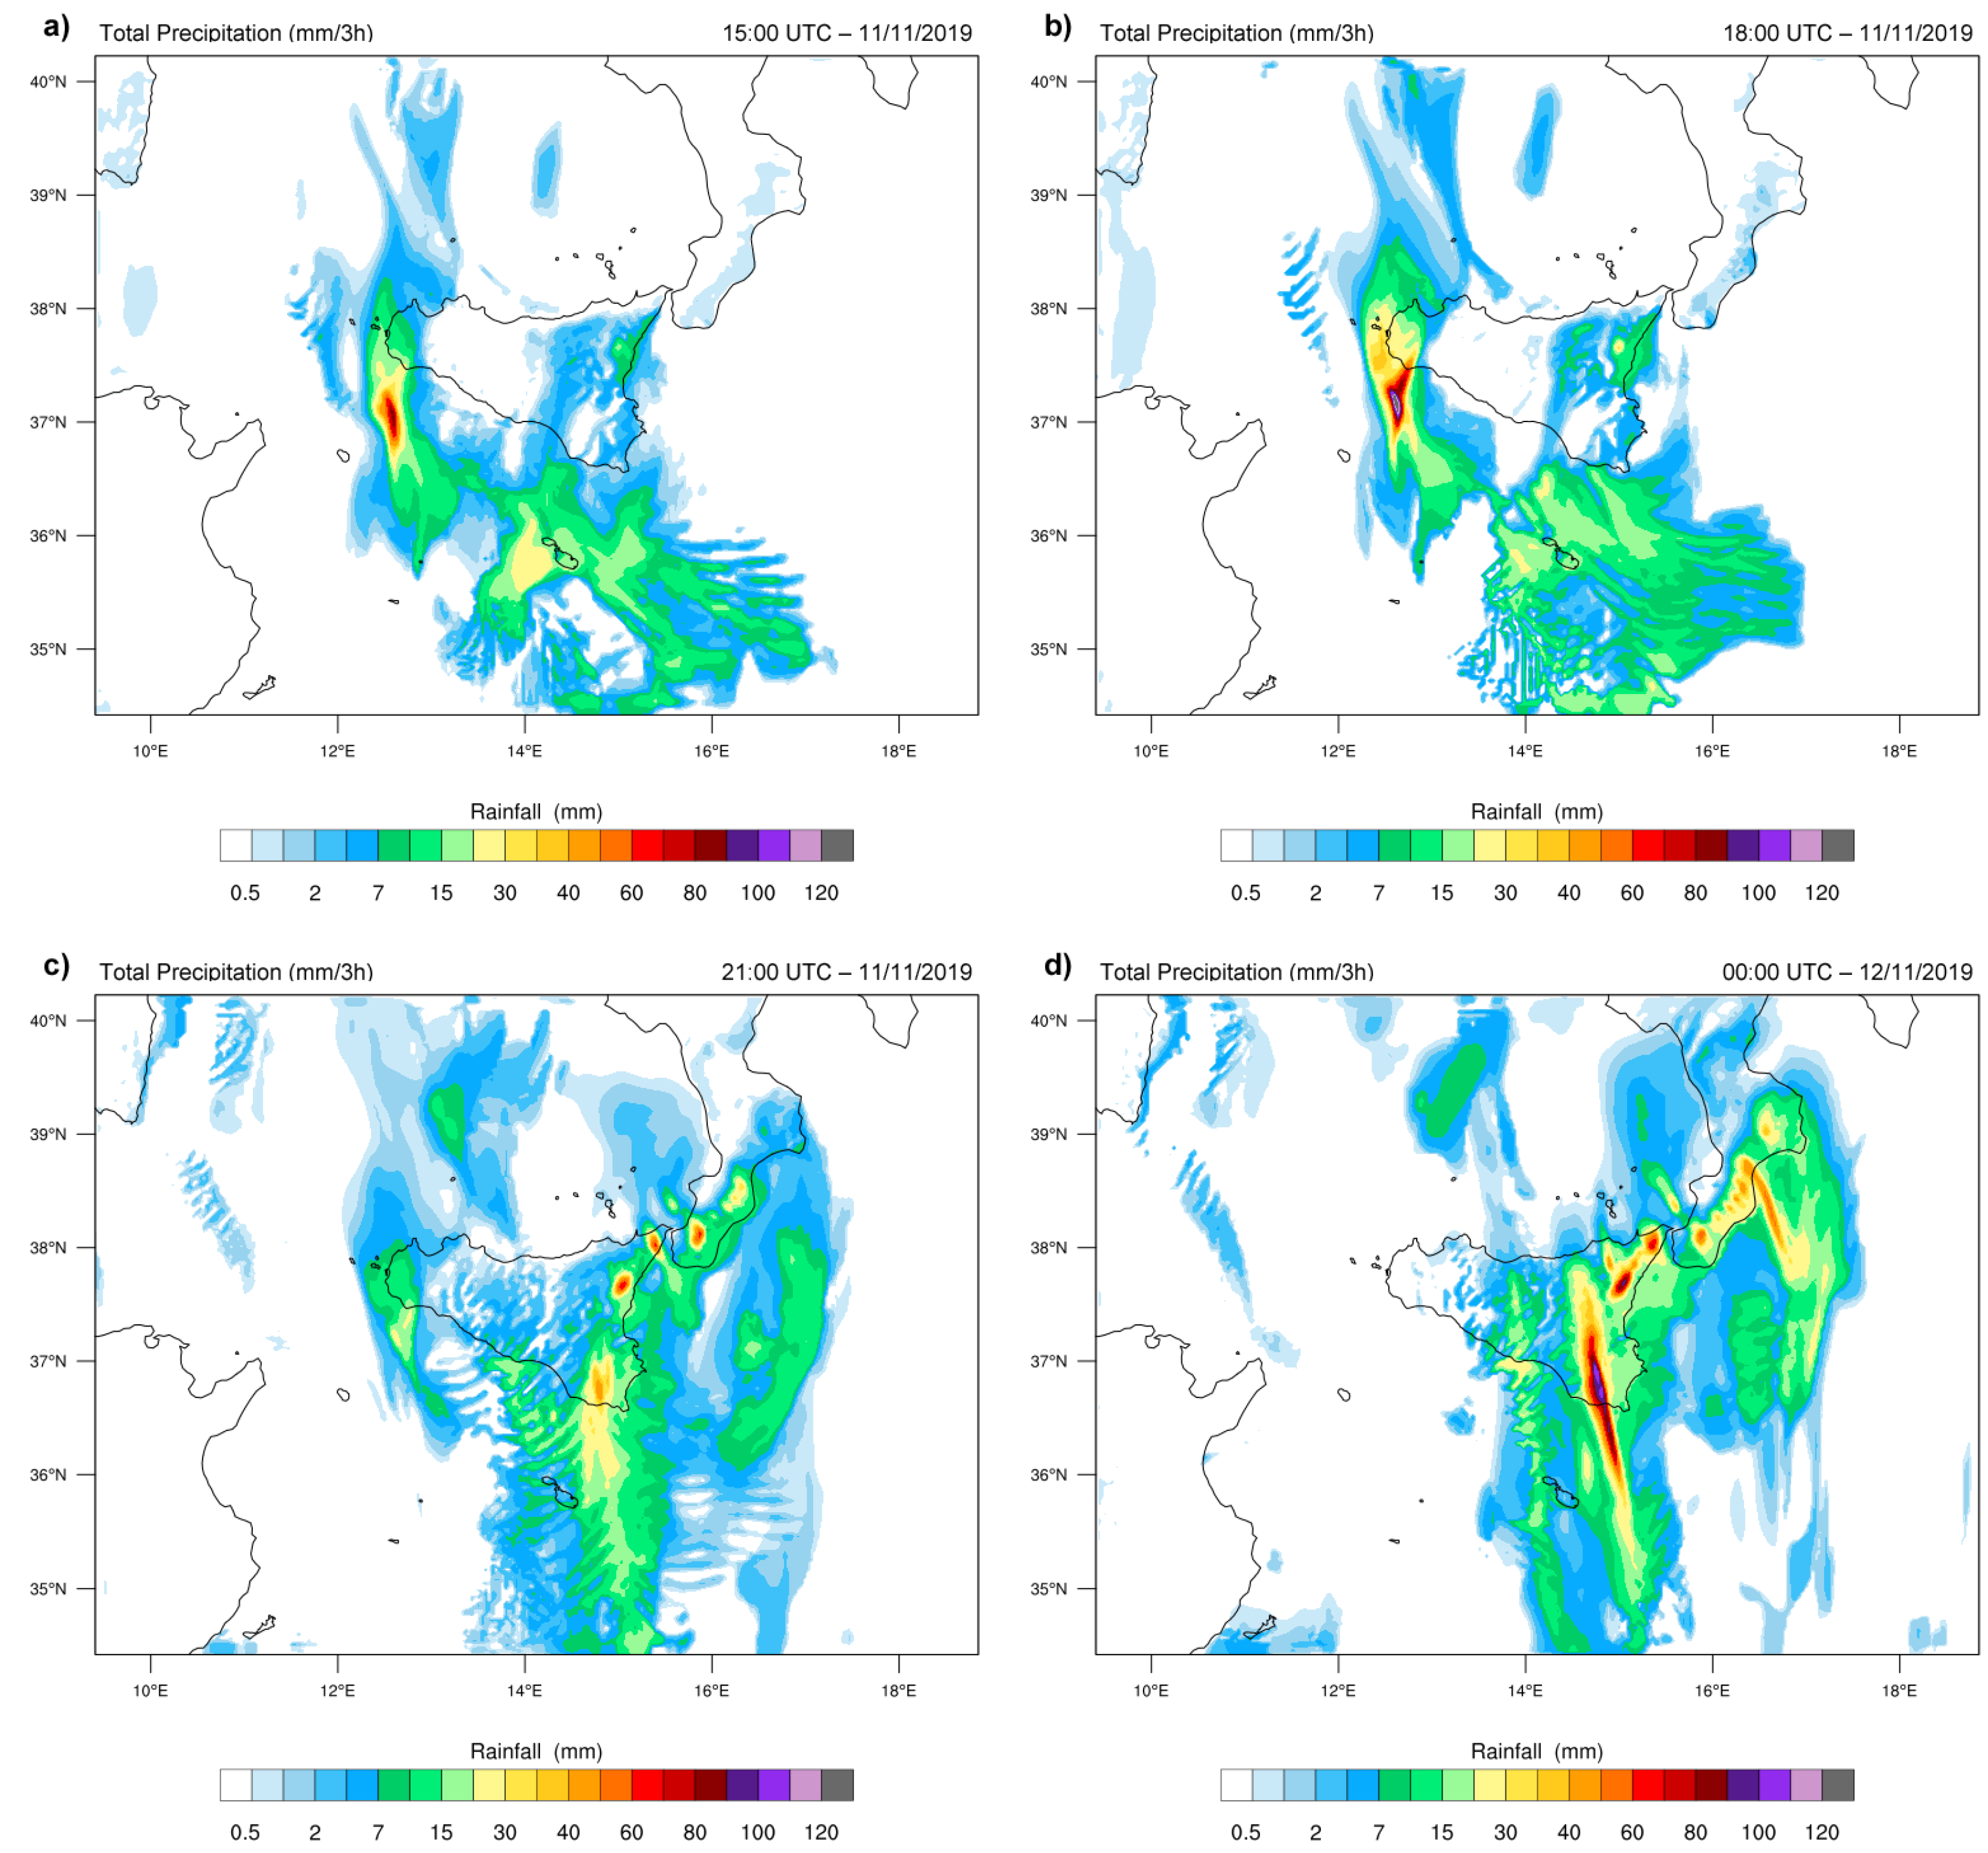
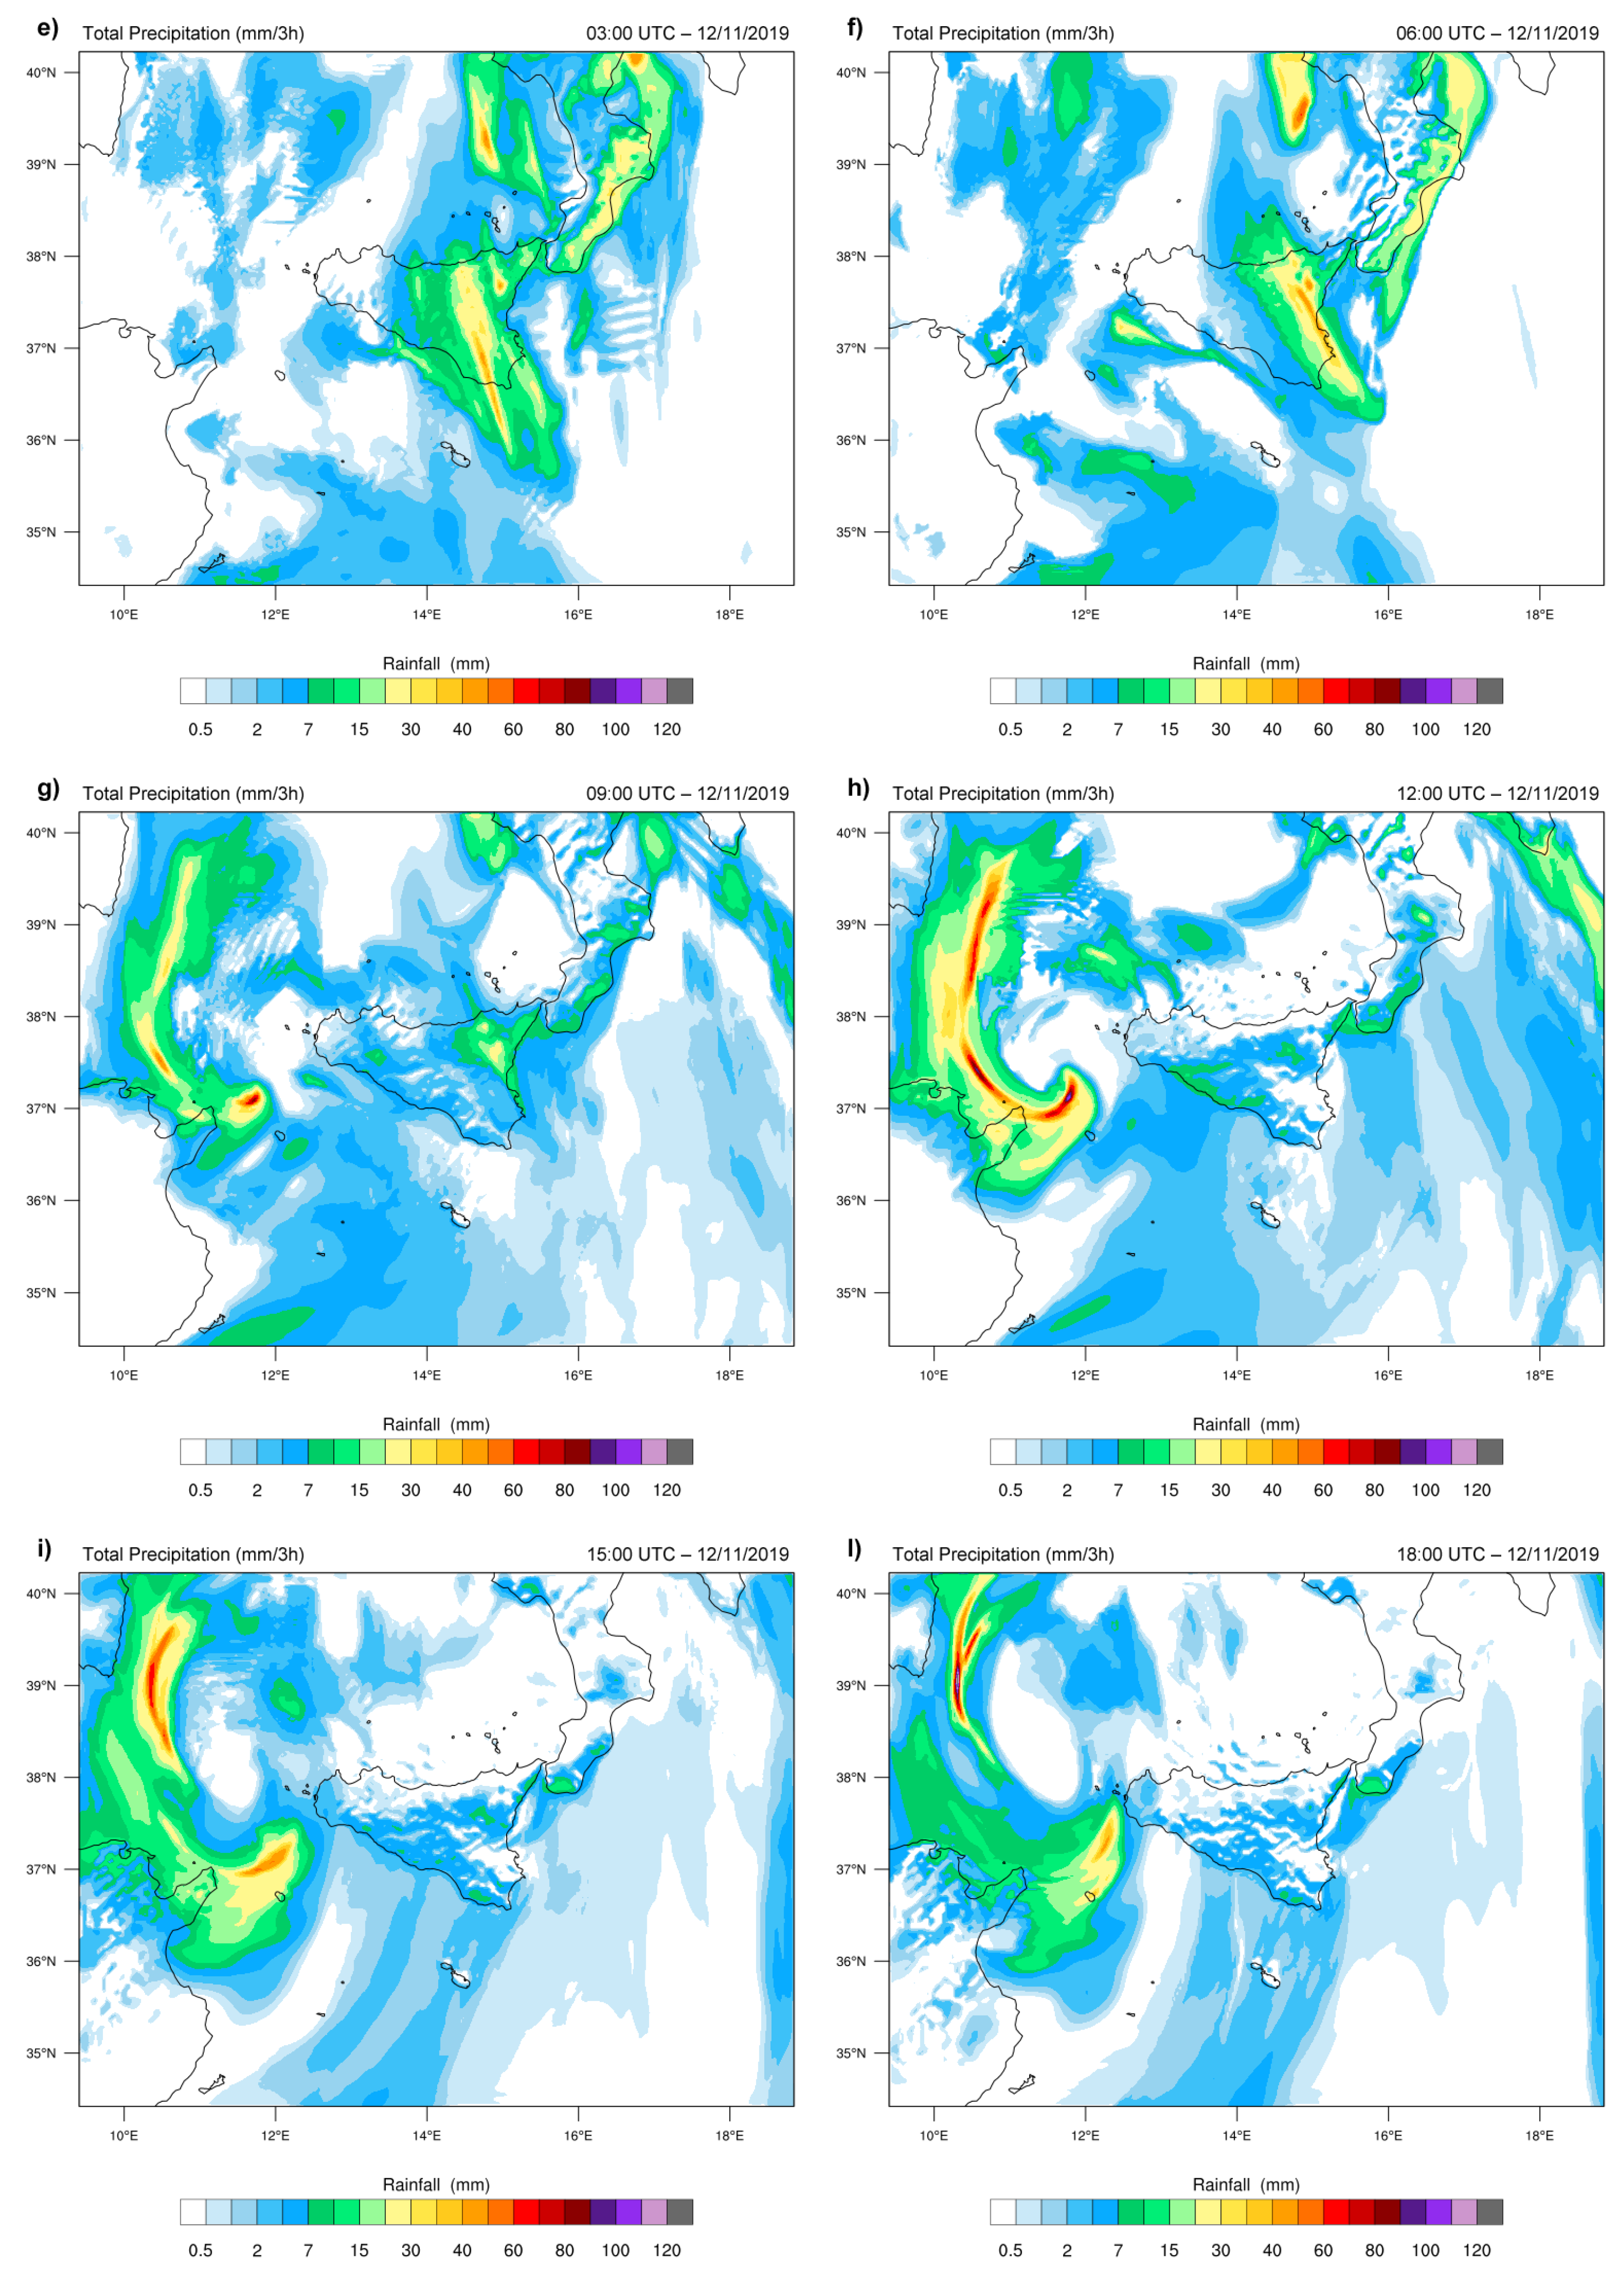
In this case, the rainfall accumulations forecasted, during the afternoon, affected only the western and eastern sectors of Sicily (panels a) and b)). In the evening, precipitations were expected in much of the regional territory. However, the most intense phenomena were expected in the eastern sector of Sicily, particularly close to the Etna area and the Iblei Mounts, in the intervals 18:00–21:00 UTC and 21:00–00:00 UTC (panels c) and d)), in which the simulation forecasted rainfall accumulations close or higher than 100 mm/3 h. In the early hours (00:00–03:00 and 03:00–06:00 UTC) of 12 November 2019, rainfall accumulations close to 30–40 mm/3 h on the central and eastern sectors of Sicily were expected (panels e) and f)). In the following hours, the forecasted rainfalls were in attenuation and extension in most of the Sicilian regional territory (from panel g) to panel n)).
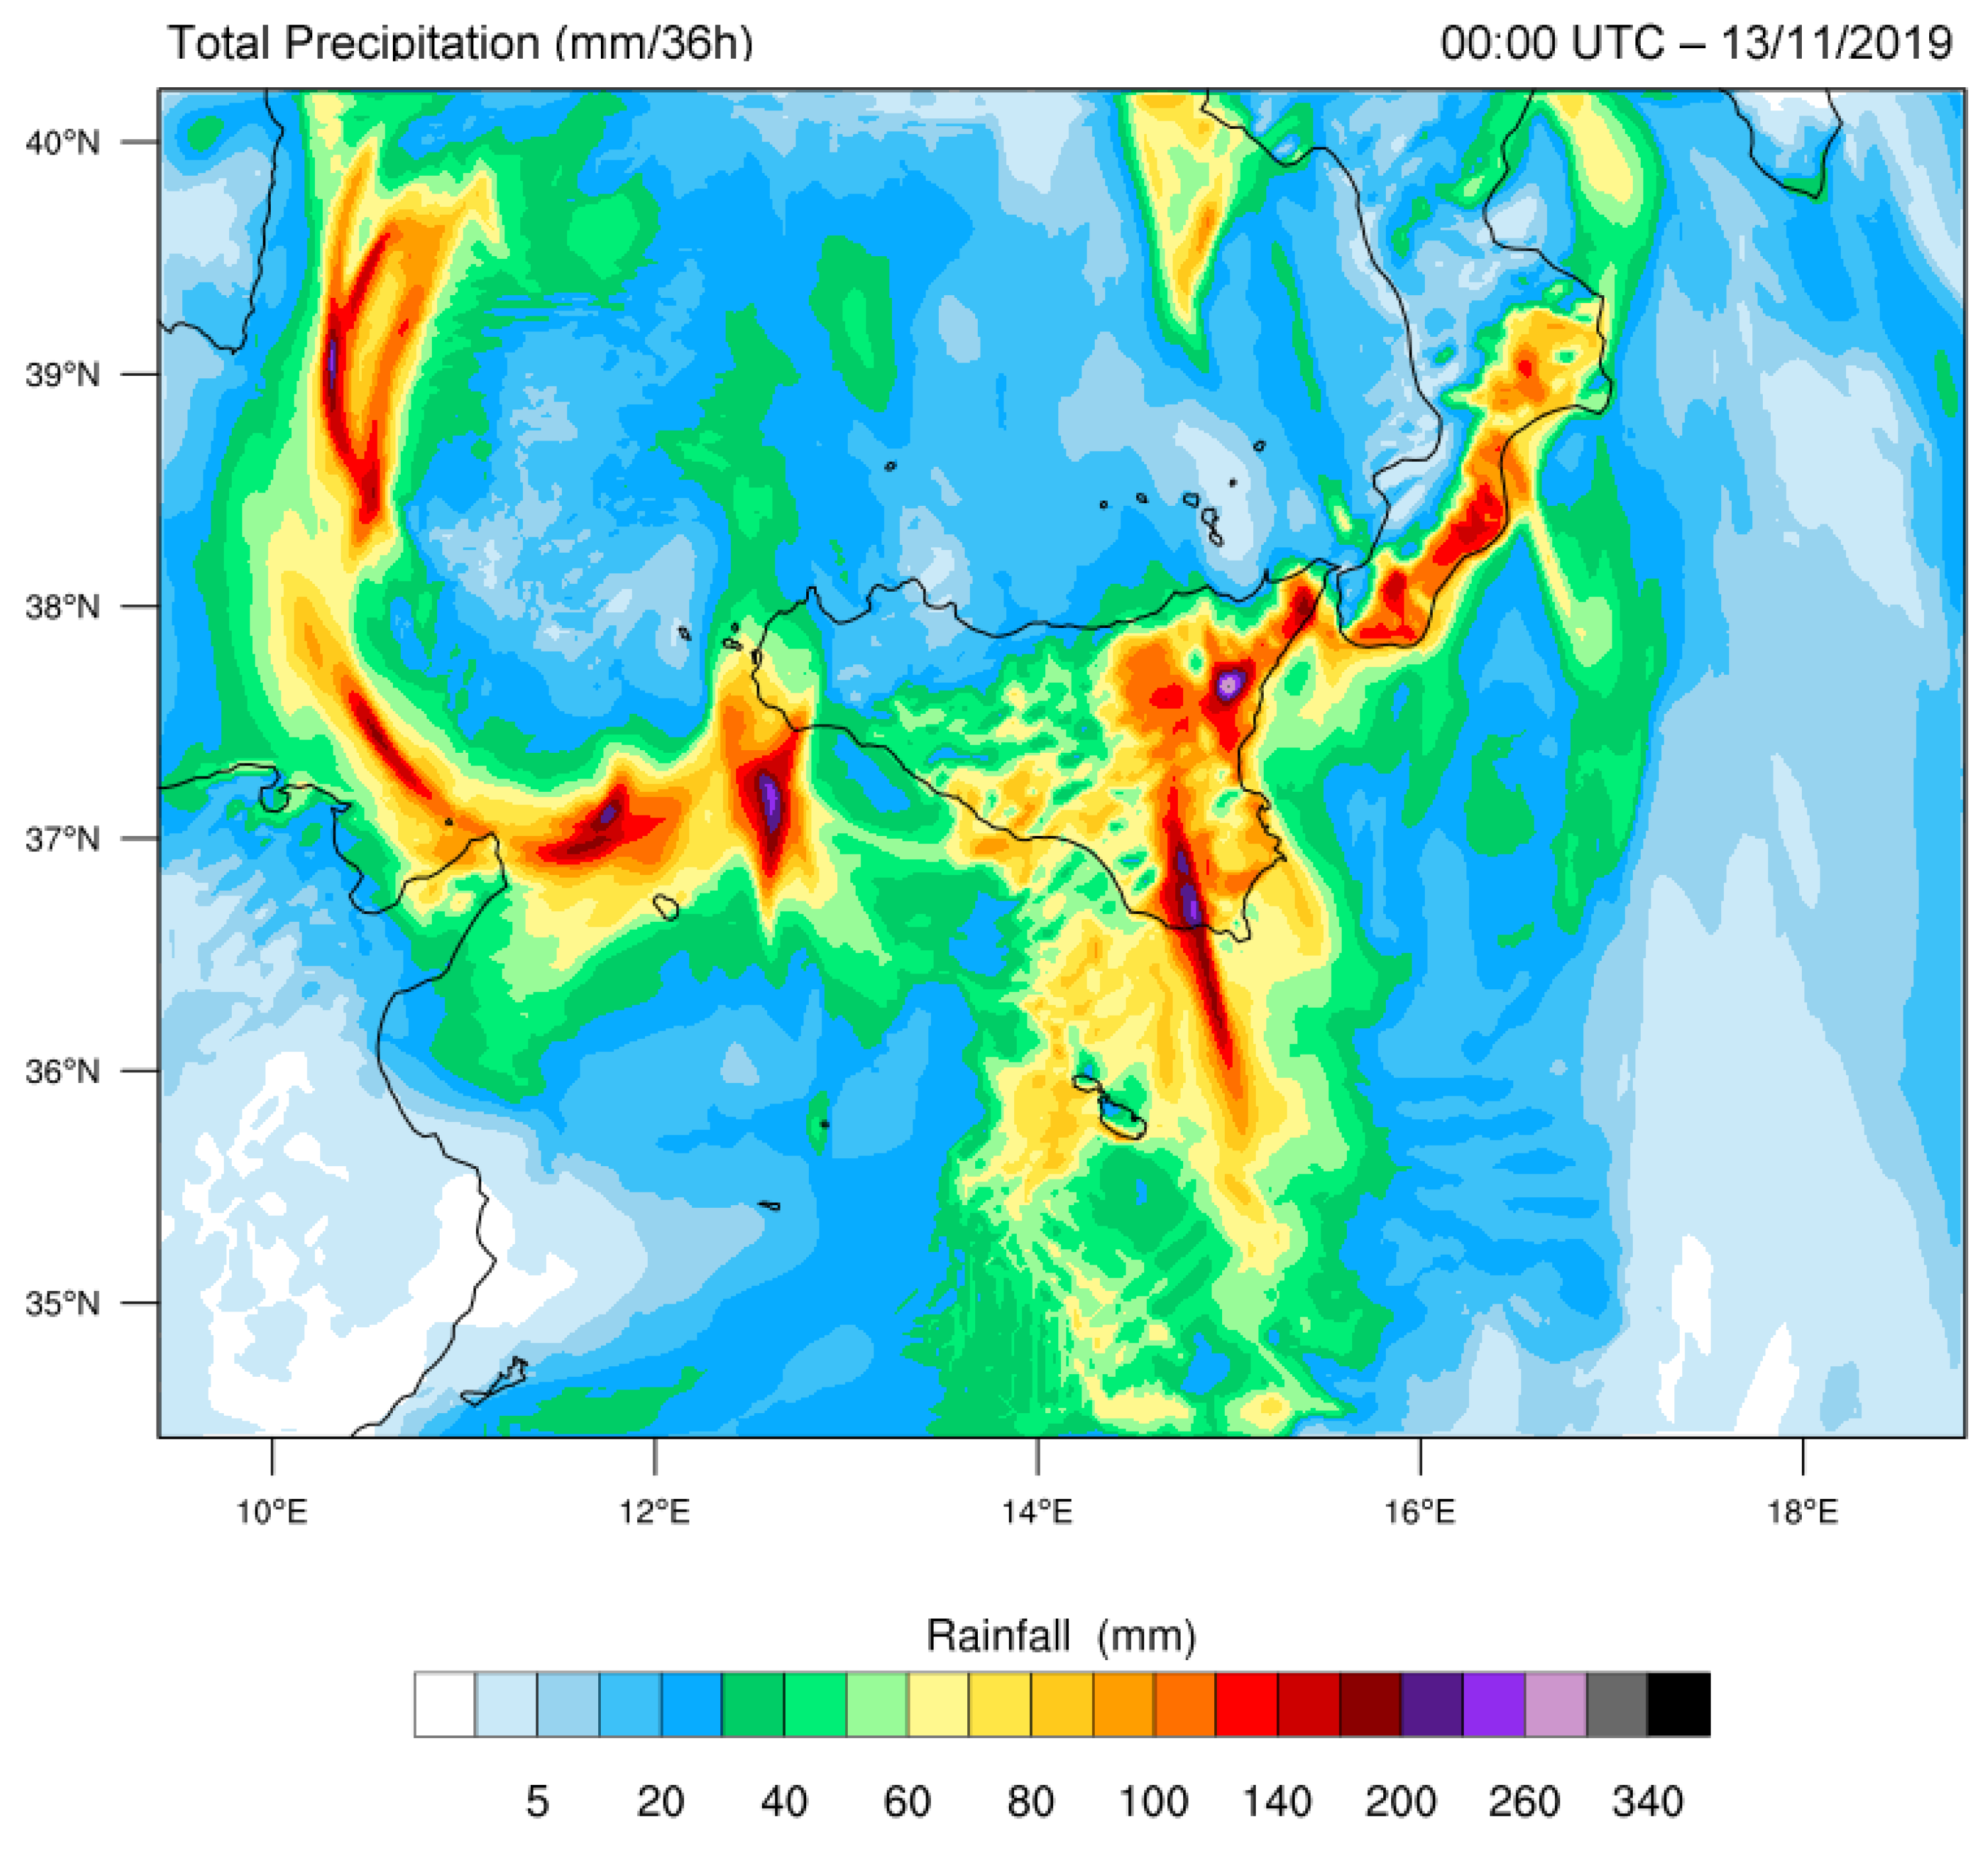
Figure 17 shows the rainfall accumulations map in 36 h. In this simulation, the highest rainfall accumulations were forecasted in the eastern sector of Sicily, particularly in the Etna area (with maximum peaks of about 300 mm/36 h) and in the provinces of Ragusa and Siracusa (with maximum peaks of about 220 mm/36 h).
In Table 3 a comparison between rainfall accumulations observed by the meteorological stations, total rainfall accumulations simulated by the WRF model without FDDA and total rainfall accumulations simulated by the WRF model with FDDA, starting from 12:00 UTC of 11 November 2019 to 00:00 UTC of 13 November 2019, was reported.
Considering the stations which observed rainfall accumulations close or higher to 100 mm/36, the simulations with FDDA forecasted total rainfall accumulations equal to: Licata (91.1), Agira (100.0 mm), Cesarò Vignazza (106.2 mm), Butera (62.3 mm), Bronte (123.0 mm), Gela (78.4 mm), Caronia Pomiere (93.9 mm) and Linguaglossa North Etna (283.5 mm).
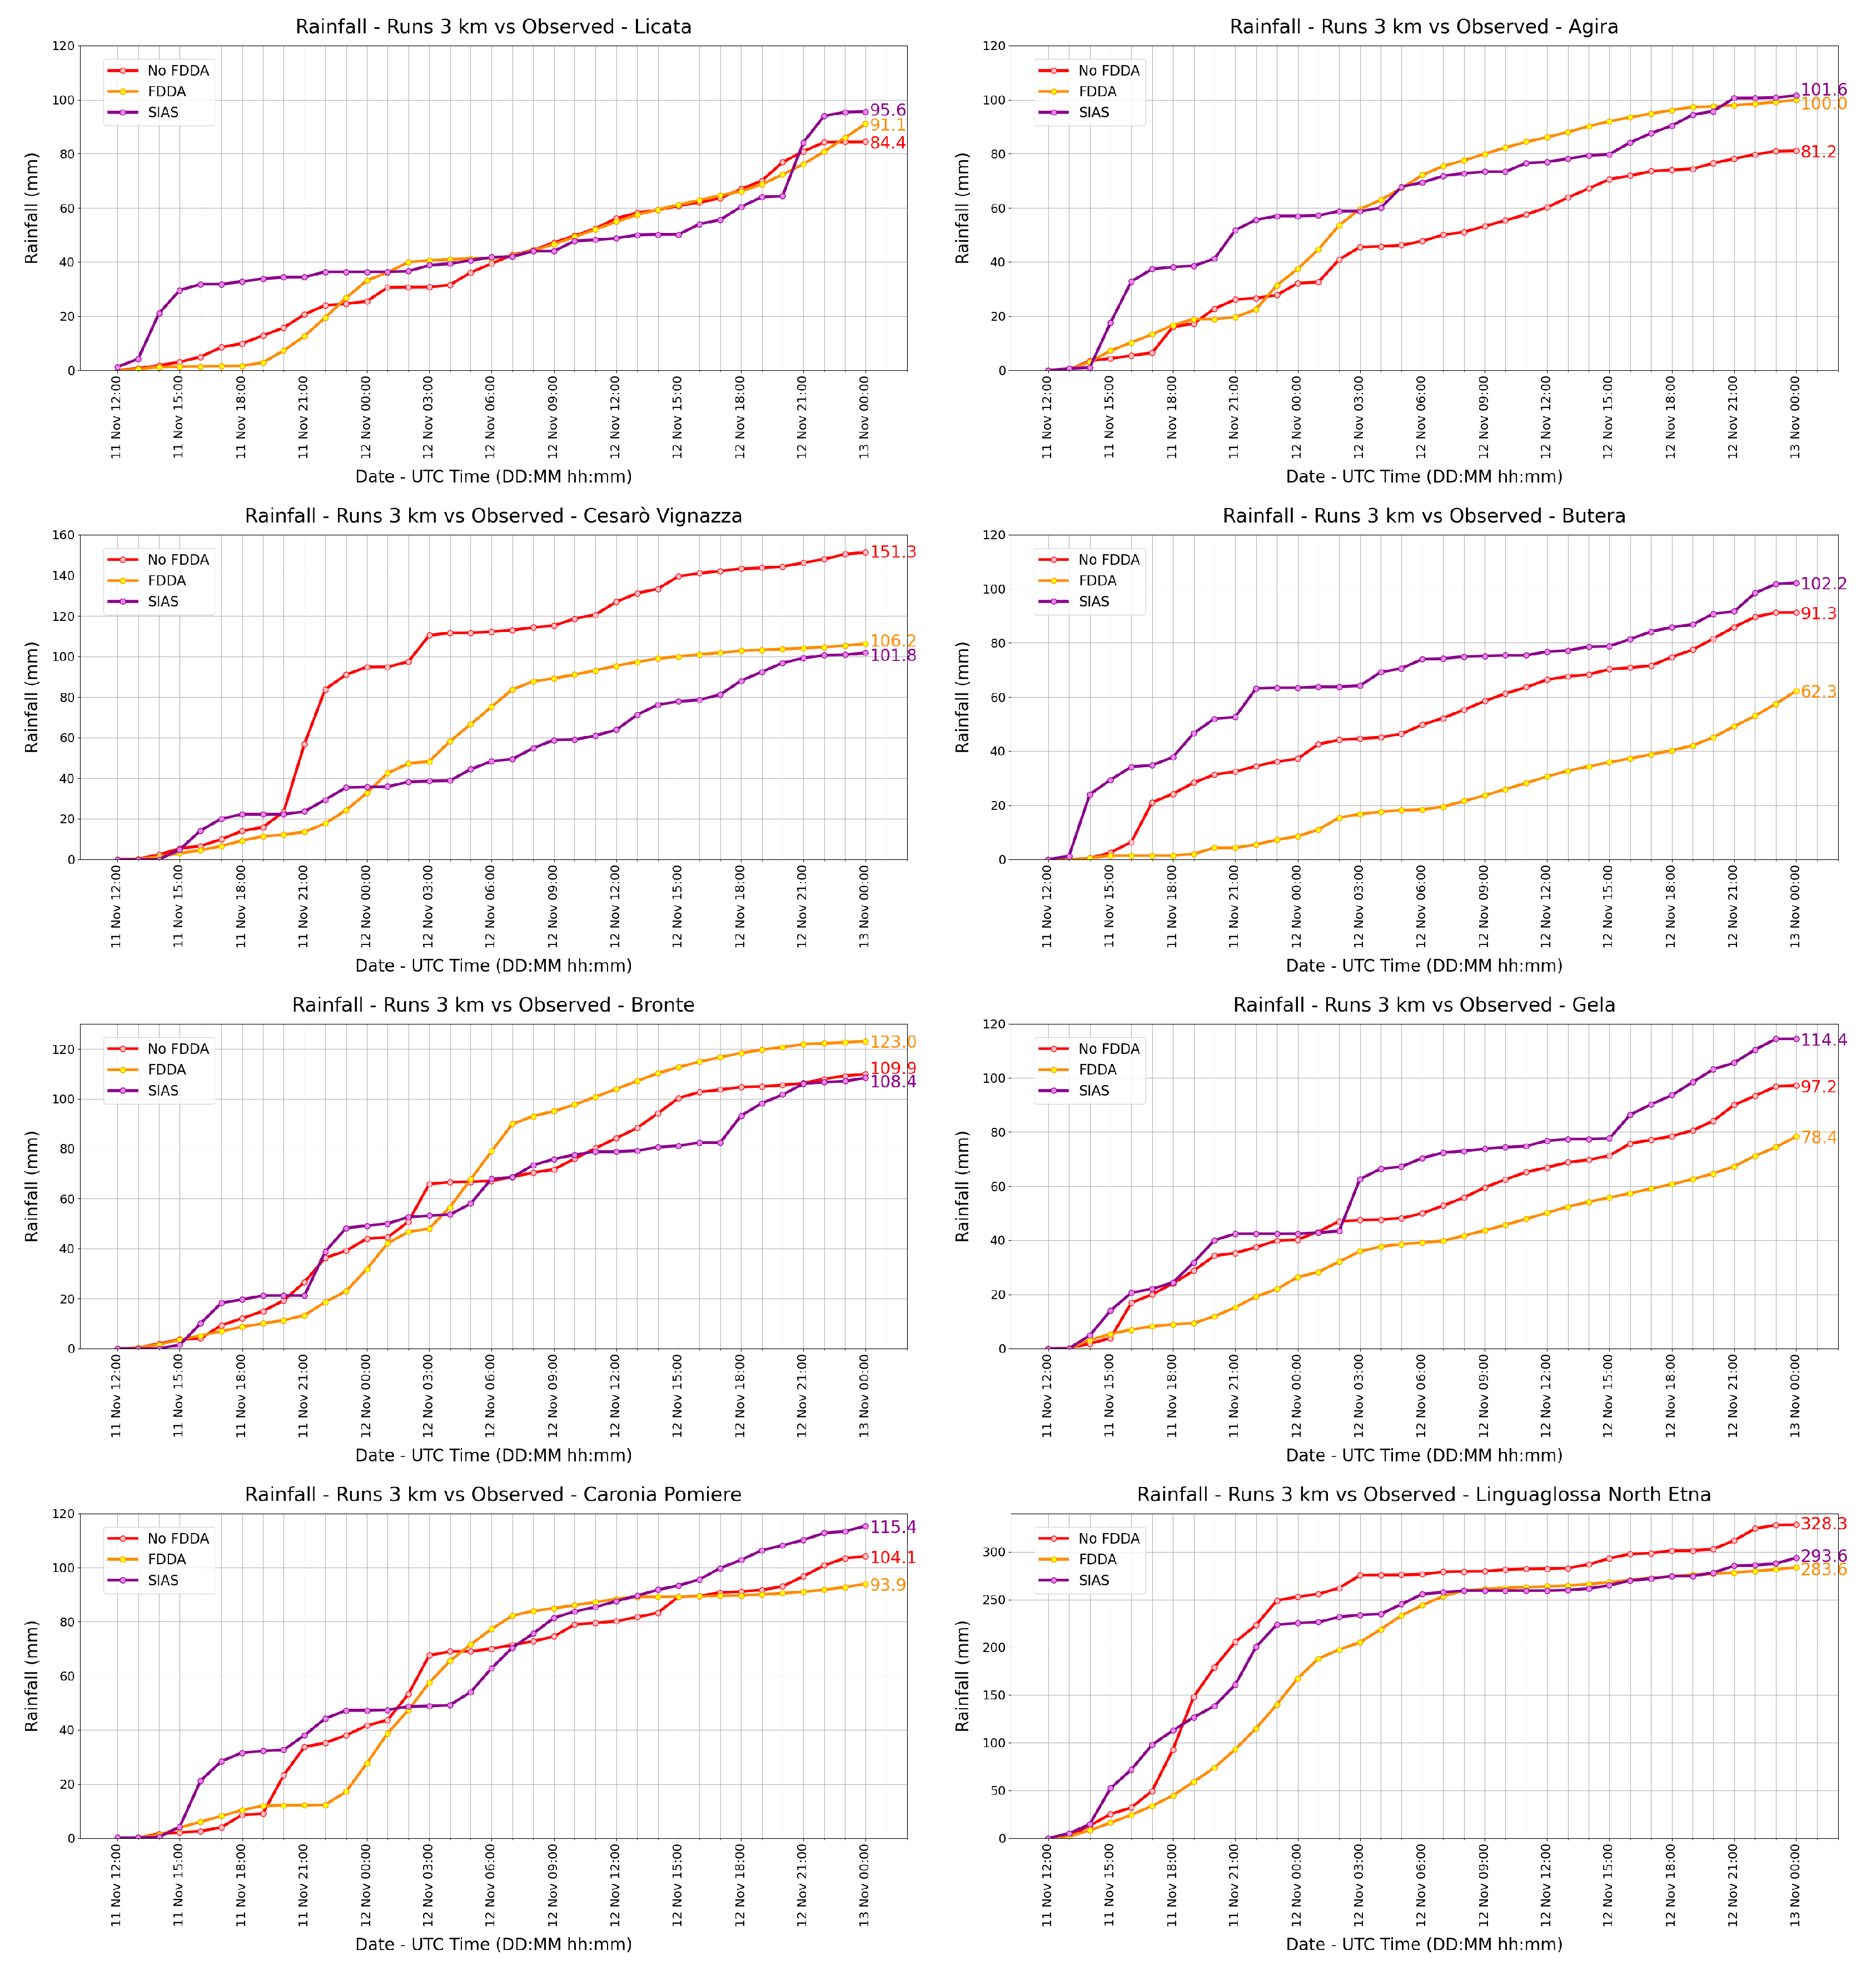
Figure 18 shows the comparison between hourly rainfall accumulations observed by the above-mentioned stations and data forecasted by the simulations in both configurations (with and without FDDA).
The comparison shows that the simulation with the use of the FDDA technique provides a better reproduction of the maximum rainfall accumulation recorded by the meteorological station of Linguaglossa North Etna. However, some points are less in accordance with the data observed.
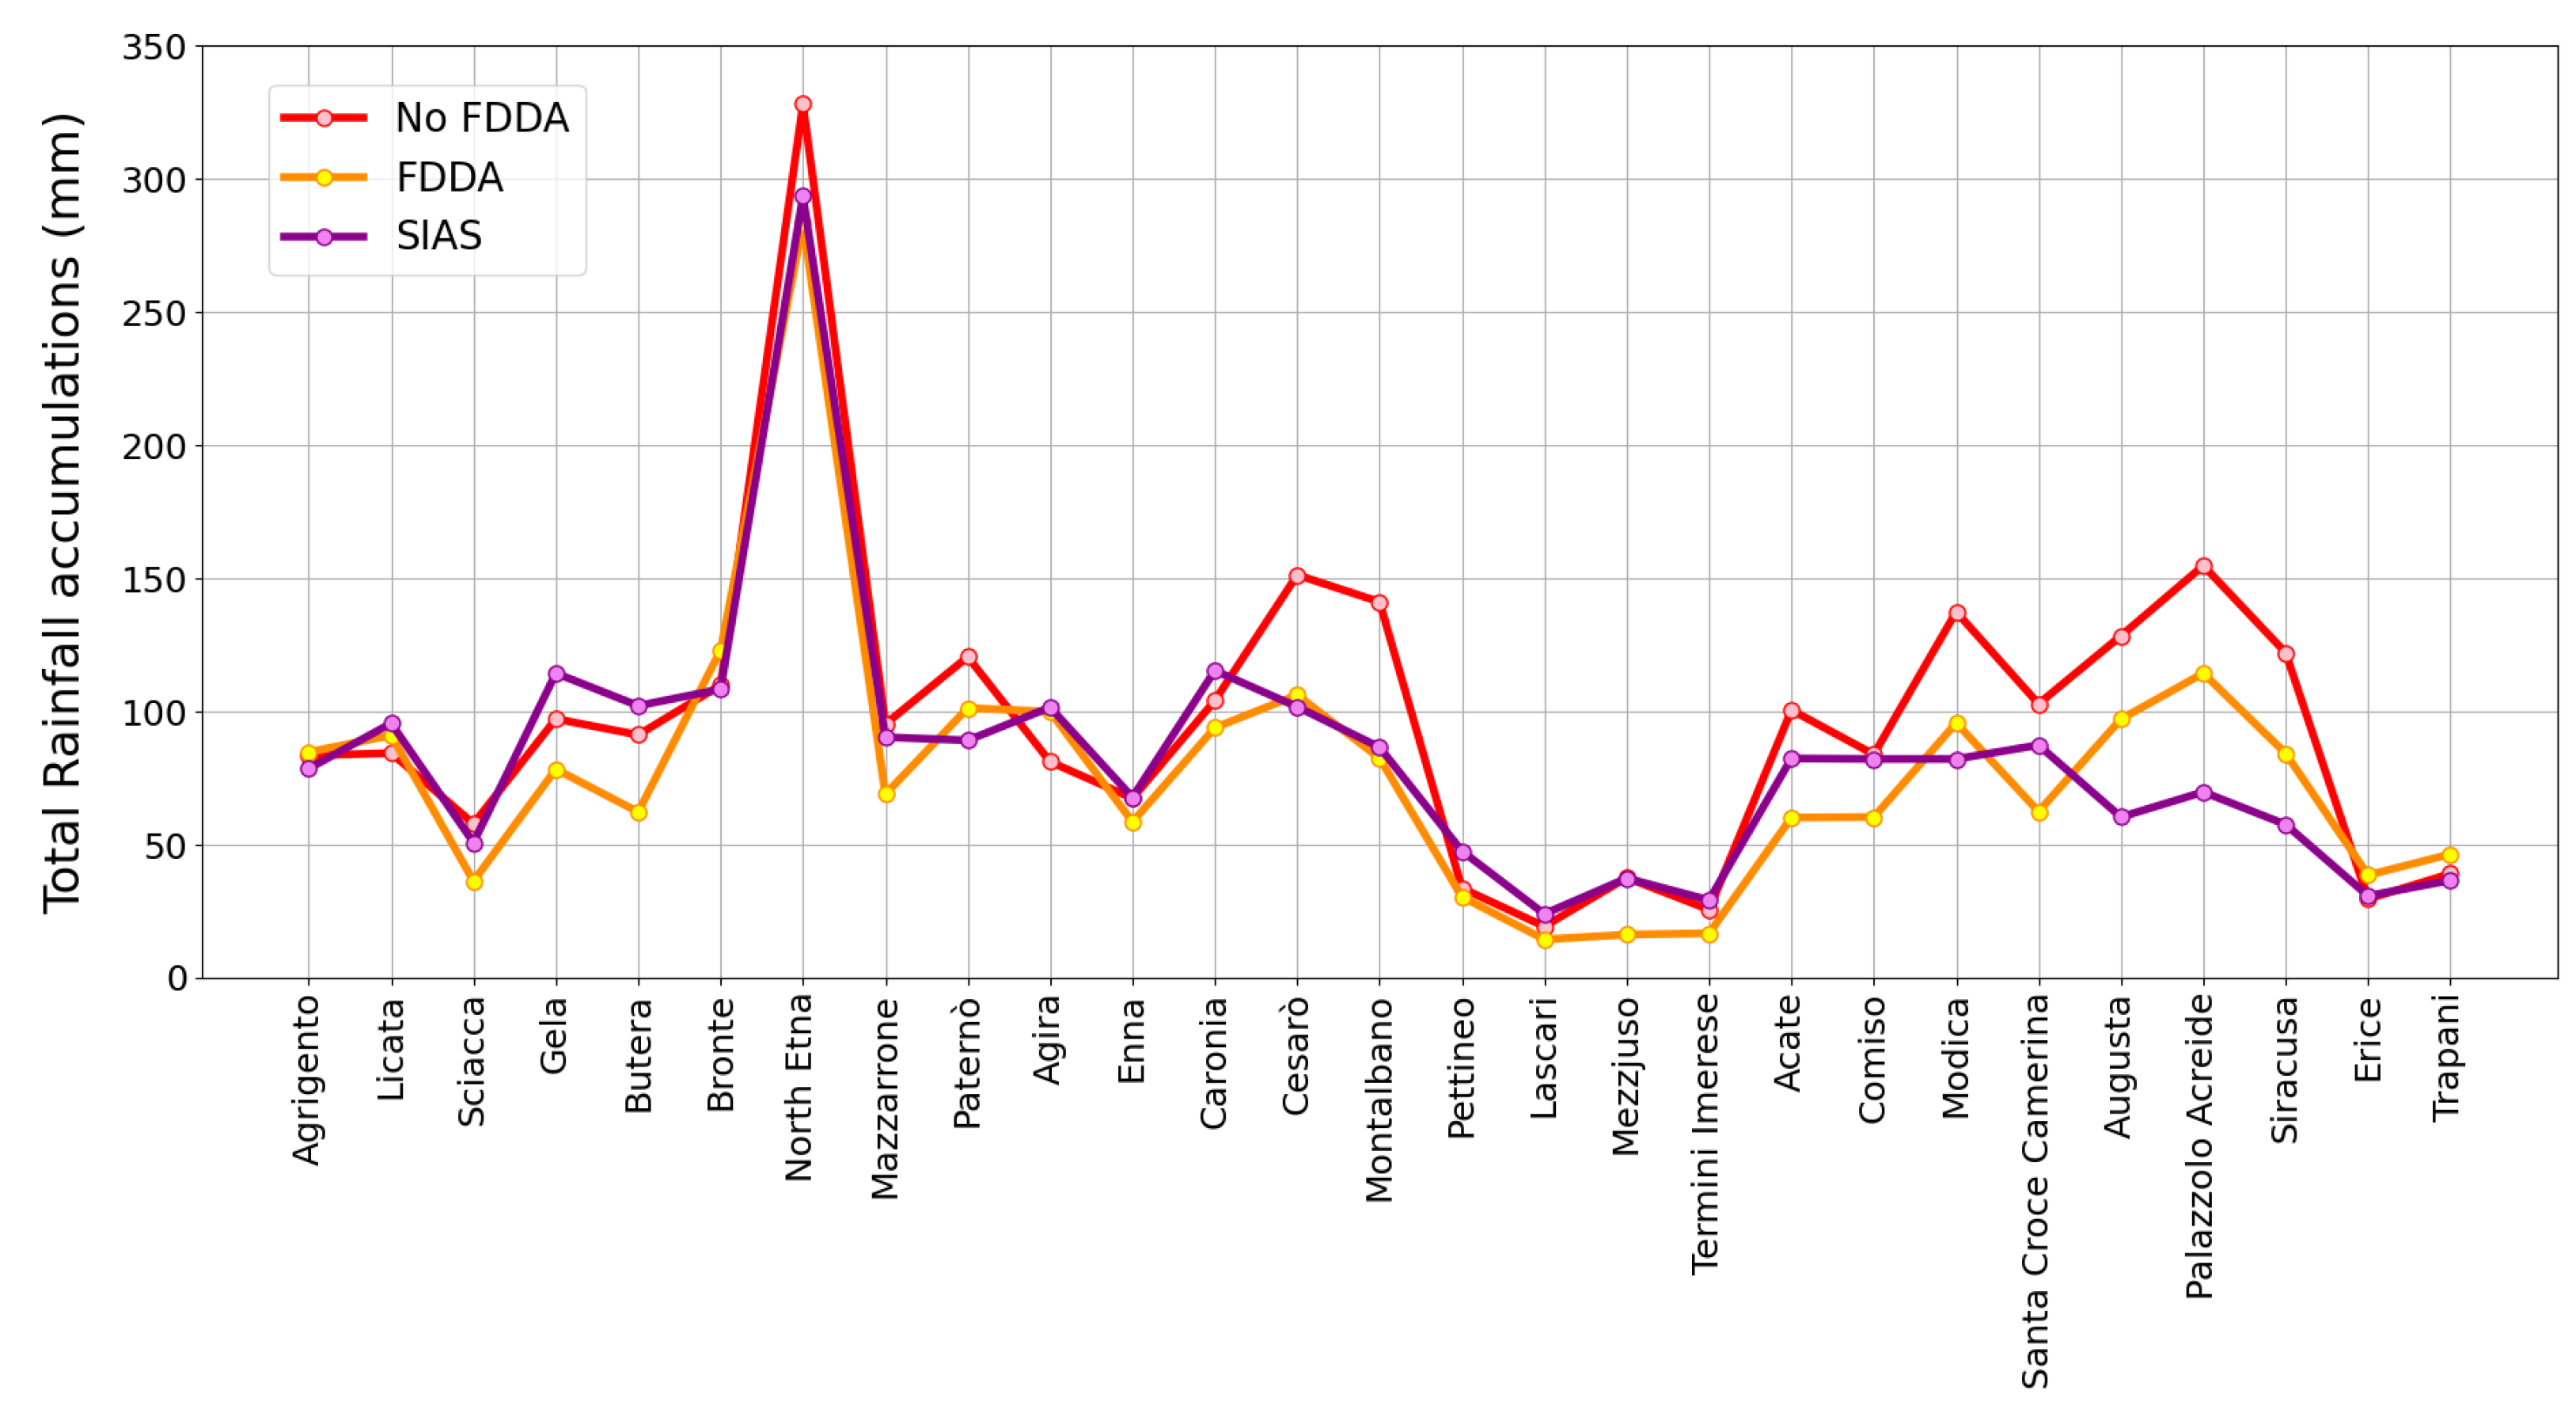
Furthermore, a comparison (see Figure 19) among the total rainfall accumulations observed from the 27 meteorological stations (purple line) and those forecasted from the two simulations (red line without FDDA and orange line with the FDDA technique) was carried out.
Figure 19 shows, in general, a good agreement between simulated data and those observed. The rainfall data obtained from the simulation with FDDA are closer to the observed data, while the rainfall data obtained without FDDA are often greater than those observed.
Finally, statistical methods were used, in order to verify the accuracy of the simulations of the WRF model. In particular, taking the observed values and the results of the two simulations into account, the root mean squared error (RMSE), and the yes/no dichotomous indices, obtained through the contingency table, were calculated.
As regards the calculation of the RMSE, the results show that the performance of the WRF simulation using the FDDA technique is better than that of the WRF without FDDA. In fact, with the FDDA, a value RMSE equal to 23.01% was obtained; with the simulation without FDDA, the value of the RMSE was 36.11%.
For yes/no dichotomous indexes, it was necessary to prepare a the contingency table of I × J elements (with I = 2 and J = 2). This table contains the absolute frequencies of all possible combinations of observed and simulated rainfall data pairs, in relation to the 27 selected stations, at hourly time intervals.
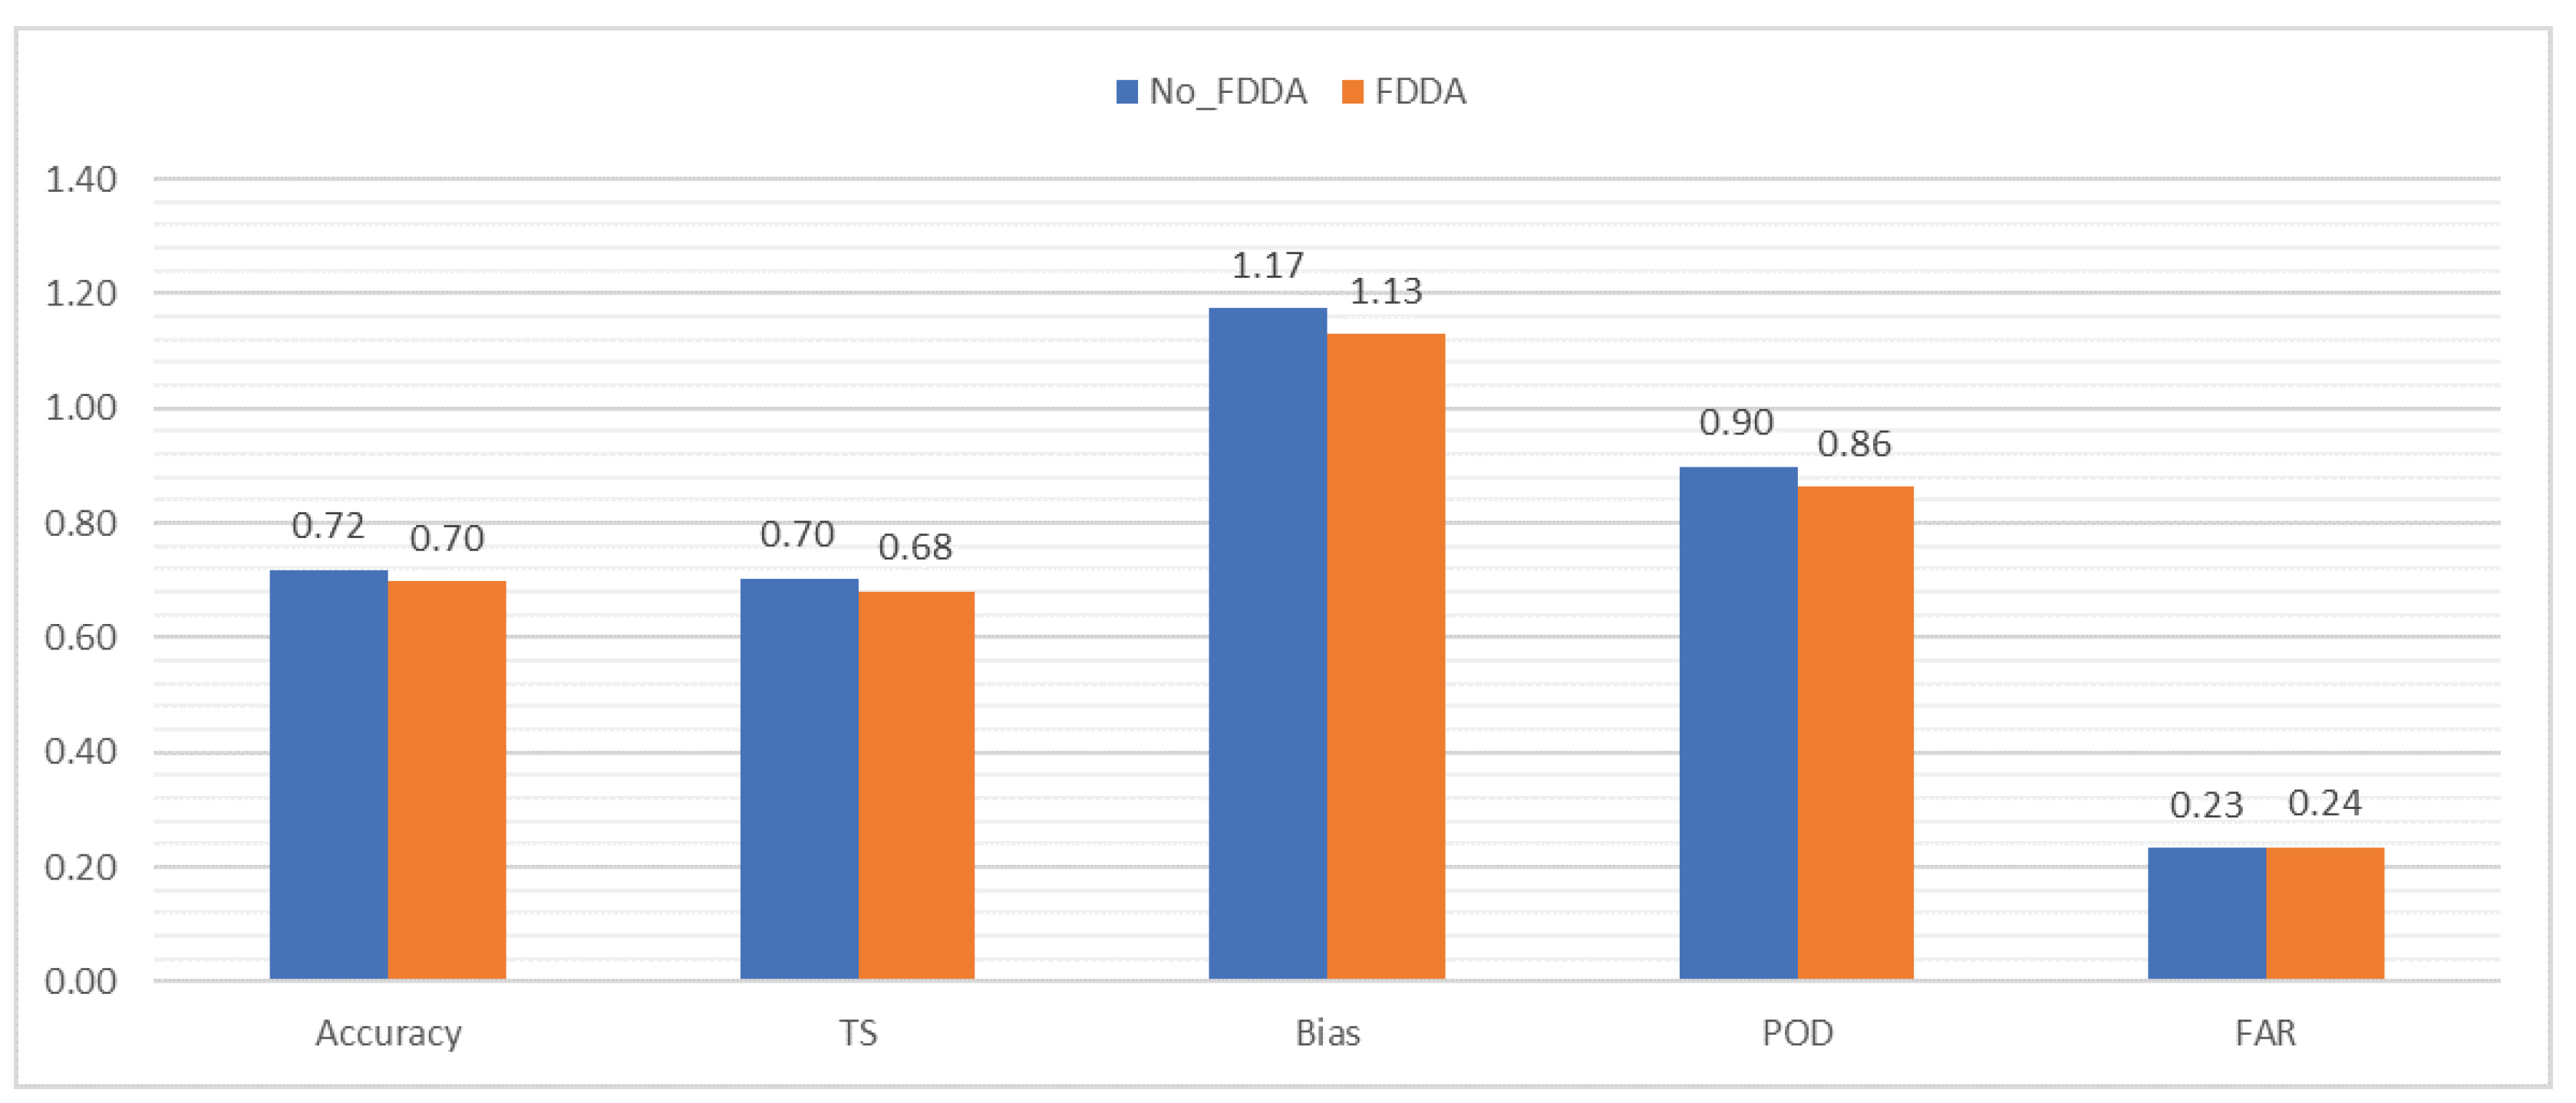
In Figure 20, values of dichotomous indices obtained, such as Accuracy, Threat Score (TS), BIAS, Probability Of Detection (POD), and False Alarms Rate (FAR), were reported.
From the diagram, it is possible to notice that, in both simulations, an “Accuracy” and a “TS” close to or higher than 70% were obtained. In addition, the value of POD was close to 90%. The value of BIAS > 1 indicates that both simulations showed a more frequent (albeit slight) prediction of events than those observed. This is also confirmed by the obtained value of the FAR (equal to 0.23 and 0.24, respectively).

4. Conclusions

In the present work, an intense weather event occurred in Sicily on 11 and 12 November 2019 was analyzed using the WRF model. The interest in this phenomenon is due to the fact that in the autumn period Sicily is often affected by severe meteorological events. In this regard, the Sicilian territory, during November 2019, was affected by three different relevant events on the following dates: 11–12, 16–17, and 23–24 November. Among these days, the most intense weather event was recorded on 11 and 12 November. In particular, the eastern sector of Sicily was the most affected by the event, where a V-shaped Storm occurred. The maximum peak of rainfall accumulation, equal to 293.6 mm/36 h, was observed by the weather station of Linguaglossa North Etna.
In this framework, two simulations using the WRF model with a horizontal grid spacing of 3 km (obtained with nesting technique) and physical parameterizations specifically optimized for Sicily, were carried out. The boundary conditions were obtained from the GFS global model. In the first simulation, in which the FDDA technique was not employed, the maximum rainfall accumulation expected in Linguaglossa North Etna was equal to 328.3 mm/36 h. In the second one, with the use of FDDA technique, the maximum rainfall accumulation expected, in the same place, was equal to 283.5 mm/36 h, in more accordance with observed data, with respect to the simulation without FDDA.
With the aim to evaluate the WRF model capability in the reproduction of this event, a comparison between rainfall simulated and those observed by 27 weather stations of the network belonging to the SIAS, was carried out. Moreover, in order to evaluate the performance of the two simulations (without and with the use of FDDA) statistical methods, such as RMSE and dichotomous indexes, were used. The performed analysis highlight that the simulation with the FDDA technique obtained an RMSE value equal to 23.01%. This result was better than that obtained from the simulation without FDDA (RMSE equal to 36.11%). Concerning the dichotomous indexes, both simulations obtained similar values. In particular, a good value, both for Accuracy and TS (about 70%), was obtained. POD value was about 90%. However, both simulations overestimated the event, albeit slightly. In fact, BIAS values were 1.17 for the simulation without FDDA and 1.13 for that with FDDA. This was confirmed also by the value of FAR, equal to 0.23 and 0.24, respectively for simulations without and with FDDA.
In conclusion, Sicily, a region characterized by a complex orography and surrounded by the Mediterranean Sea, in which the SSTs show an increase in the last few years, can represent a focal point for the study of severe weather events (e.g., V-shaped storms). In addition, it is shown that the WRF model, properly optimized for the territory under study, represents a valid tool for precise forecasts, including localized and extreme weather events. Therefore, the results obtained from the simulations highlight that the WRF model can be a valid support to help contain damage and reduce hydrogeological risk factors. Moreover, the simulation carried out with the FDDA technique has evidenced an improvement in the reproduction of the event (better value of RMSE), especially in the areas where the maximum rainfall peak has been observed by the network of meteorological stations taken into consideration. This result suggests that a multimodel approach can provide useful information both to the agencies in charge of the branch of the meteorological alert states (e.g., DRPC of Sicily) and all potential public and private stakeholders.

Author Contributions

All authors contributed to conceptualization, methodology, investigation, writing, reviewing, and editing of the present work. All authors have read and agreed to the published version of the manuscript.

Funding

This work is to be framed within the Progetto di Ricerca e Sviluppo “SECESTA ViaSafe: applicazione della rete di monitoraggio della ricaduta di cenere vulcanica dell’Etna alla gestione della mobilità nel territorio etneo”, CUP code G69J18001010007, project identification code 08CT6202000208 in the context of the Programma Operativo Nazionale “Ricerca e Innovazione” 2014–2020 (PON R&I 2014–2020).

Informed Consent Statement

Informed consent was obtained from all subjects involved in the study.

Data Availability Statement

Not applicable.

Acknowledgments

The authors thank the Servizio Informativo Agrometeorologico Siciliano (SIAS) and the Dipartimento Regionale di Protezione Civile (DRPC) of Sicily for rainfall accumulations data and maps.

Conflicts of Interest

The authors declare no conflict of interest.

References

  1. Lionello, P.; Scarascia, L. The relation between climate change in the Mediterranean region and global warming. Reg. Environ. Change 2018, 18, 1481–1493. [Google Scholar] [CrossRef]
  2. Ulbrich, U.; May, W.; Li, L.; Lionello, P.; Pinto, J.G.; Somot, S. The Mediterranean climate change under global warming. Dev. Earth Environ. Sci. 2006, 4, 399–415. [Google Scholar] [CrossRef]
  3. Giannakopoulos, C.; Le Sager, P.; Bindi, M.; Moriondo, M.; Kostopoulou, E.; Goodess, C.M. Climatic changes and associated impacts in the Mediterranean resulting from a 2 C global warming. Glob. Planet. Change 2009, 68, 209–224. [Google Scholar] [CrossRef]
  4. Paeth, H.; Hense, A. Mean versus extreme climate in the Mediterranean region and its sensitivity to future global warming conditions. Meteorol. Z. 2009, 329–347. [Google Scholar] [CrossRef] [PubMed]
  5. Fan, Y.; Lu, J.; Li, L. Mechanism of the Centennial Subpolar North Atlantic Cooling Trend in the FGOALS-g2 Historical Simulation. J. Geophys. Res. Ocean. 2021, 126, e2021JC017511. [Google Scholar] [CrossRef]
  6. Li, L.; Lozier, M.S.; Li, F. Century-long cooling trend in subpolar North Atlantic forced by atmosphere: An alternative explanation. Clim. Dyn. 2022, 58, 2249–2267. [Google Scholar] [CrossRef]
  7. Liang, Y.-C.; Yu, J.-Y.; Saltzman, E.S.; Wang, F. Linking the tropical Northern Hemisphere pattern to the Pacific warm blob and Atlantic cold blob. J. Clim. 2017, 30, 9041–9057. [Google Scholar] [CrossRef]
  8. Garcia-Monteiro, S.; Sobrino, J.A.; Julien, Y.; Soria, G.; Skokovic, D. Surface Temperature trends in the Mediterranean Sea from MODIS data during years 2003–2019. Reg. Stud. Mar. Sci. 2022, 49, 102086. [Google Scholar] [CrossRef]
  9. Juza, M.; Fernández-Mora, À.; Tintoré, J. Sub-Regional Marine Heat Waves in the Mediterranean Sea From Observations: Long-Term Surface Changes, Sub-Surface and Coastal Responses. Front. Mar. Sci. 2022, 9, 785771. [Google Scholar] [CrossRef]
  10. Caruso, C.G.; Lazzaro, G.; Longo, M.; Scirè Scappuzzo, S.; Italiano, F. Shallow sea monitoring systems for the “Distributed Laboratory over the Sea” in Panarea island. In Proceedings of the 2022 IEEE International Workshop on Metrology for the Sea, Milazzo, Italy, 3–5 October 2022; Learning to Measure Sea Health Parameters (MetroSea). MetroSea: Milazzo, Italy, 2022; pp. 424–428. [Google Scholar] [CrossRef]
  11. Longo, M.; Lazzaro, G.; Caruso, C.G.; Corbo, A.; Sciré Scappuzzo, S.; Italiano, F.; Gattuso, A.; Romano, D. Hydro-acoustic signals from the Panarea shallow hydrothermal field: New inferences of a direct link with Stromboli. Geol. Soc. London Spec. Publ. 2021, 519, SP519-2020. [Google Scholar] [CrossRef]
  12. Furcolo, P.; Pelosi, A.; Rossi, F. Statistical identification of orographic effects in the regional analysis of extreme rainfall. Hydrol. Process. 2016, 30, 1342–1353. [Google Scholar] [CrossRef]
  13. Grazzini, F.; Craig, G.C.; Keil, C.; Antolini, G.; Pavan, V. Extreme precipitation events over northern Italy. Part I: A systematic classification with machine-learning techniques. Q. J. R. Meteorol. Soc. 2020, 146, 69–85. [Google Scholar] [CrossRef] [Green Version]
  14. Lin, Y.-L.; Chiao, S.; Wang, T.-A.; Kaplan, M.L.; Weglarz, R.P. Some common ingredients for heavy orographic rainfall. Weather. Forecast. 2001, 16, 633–650. [Google Scholar] [CrossRef]
  15. Liotta, M.; Favara, R.; Valenza, M. Isotopic composition of the precipitations in the central Mediterranean: Origin marks and orographic precipitation effects. J. Geophys. Res. Atmos. 2006, 111, D19. [Google Scholar] [CrossRef] [Green Version]
  16. Rontu, L. Studies on Orographic Effects in a Numerical Weather Prediction Model; Finnish Meteorological Institute: Helsinki, Finland, 2007. [Google Scholar]
  17. Ntwali, D.; Ogwang, B.A.; Ongoma, V. The impacts of topography on spatial and temporal rainfall distribution over Rwanda based on WRF model. Atmos. Clim. Sci. 2016, 6, 145–157. [Google Scholar] [CrossRef] [Green Version]
  18. Lee, J.W.; Hong, S.Y. A numerical simulation study of orographic effects for a heavy rainfall event over Korea using the WRF model. Atmosphere 2006, 16, 319–332. [Google Scholar]
  19. Lagouvardos, K.; Karagiannidis, A.; Dafis, S.; Kalimeris, A.; Kotroni, V. Ianos—A hurricane in the Mediterranean. Bull. Am. Meteorol. Soc. 2022, 103, E1621–E1636. [Google Scholar] [CrossRef]
  20. Gonzalez-Aleman, J.J.; Pascale, S.; Gutierrez-Fernandez, J.; Murakami, H.; Gaertner, M.A.; Vecchi, G.A. Potential increase in hazard from Mediterranean hurricane activity with global warming. Geophys. Res. Lett. 2022, 46, 1754–1764. [Google Scholar] [CrossRef]
  21. Forestieri, A.; Lo Conti, F.; Blenkinsop, S.; Cannarozzo, M.; Fowler, H.J.; Noto, L.V. Regional frequency analysis of extreme rainfall in Sicily (Italy). Int. J. Climatol. 2018, 38, e698–e716. [Google Scholar] [CrossRef]
  22. Aronica, G.T.; Brigandí, G.; Morey, N. Flash floods and debris flow in the city area of Messina, north-east part of Sicily, Italy in October 2009: The case of the Giampilieri catchment. Nat. Hazards Earth Syst. Sci. 2012, 12, 1295–1309. [Google Scholar] [CrossRef]
  23. Cassola, F.; Ferrari, F.; Mazzino, A.; Lacorata, G.; Rotunno, R. Numerical simulations of Mediterranean heavy precipitation events with the WRF model: A verification exercise using different approaches. Atmos. Res. 2015, 164, 210–225. [Google Scholar] [CrossRef]
  24. Avolio, E.; Federico, S. WRF simulations for a heavy rainfall event in southern Italy: Verification and sensitivity tests. Atmos. Res. 2018, 209, 14–35. [Google Scholar] [CrossRef]
  25. Caccamo, M.T.; Castorina, G.; Colombo, F.; Insinga, V.; Maiorana, E.; Magazù, S. Weather forecast performances for complex orographic areas: Impact of different grid resolutions and of geographic data on heavy rainfall event simulations in Sicily. Atmos. Res. 2017, 198, 22–33. [Google Scholar] [CrossRef]
  26. Lagasio, M.; Parodi, A.; Procopio, R.; Rachidi, F.; Fiori, E. Lightning Potential Index performances in multimicrophysical cloud-resolving simulations of a back-building mesoscale convective system: The Genoa 2014 event. J. Geophys. Res. Atmos. 2017, 122, 4238–4257. [Google Scholar] [CrossRef]
  27. Coleman, J.; Law, K. Meteorology. In Reference Module in Earth Systems and Environmental Sciences; Elsevier: Amsterdam, The Netherlands, 2015. [Google Scholar] [CrossRef]
  28. Roger, S.R.; Pielke, A. Mesoscale Meteorological Modeling; Academic Press Inc: Cambridge, MA, USA, 2013; Volume 98. [Google Scholar]
  29. Delrieu, G.; Nicol, J.; Yates, E.; Kirstetter, P.-E.; Creutin, J.-D.; Anquetin, S.; Obled, C.; Saulnier, G.-M.; Ducrocq, V.; Gaume, E.; et al. The catastrophic flash-flood event of 8–9 September 2002 in the Gard Region, France: A first case study for the Cévennes–Vivarais Mediterranean Hydrometeorological Observatory. J. Hydrometeorol. 2005, 6, 34–52. [Google Scholar] [CrossRef] [Green Version]
  30. Ducrocq, V.; Braud, I.; Davolio, S.; Ferretti, R.; Flamant, C.; Jansa, A.; Kalthoff, N.; Richard, E.; Taupier-Letage, I.; Ayral, P.; et al. HyMeX-SOP1: The field campaign dedicated to heavy precipitation and flash flooding in the northwestern Mediterranean. Bull. Am. Meteorol. Soc. 2014, 95, 1083–1100. [Google Scholar] [CrossRef] [Green Version]
  31. Rebora, N.; Molini, L.; Casella, E.; Comellas, A.; Fiori, E.; Pignone, F.; Siccardi, F.; Silvestro, F.; Tanelli, S.; Parodi, A. Extreme rainfall in the Mediterranean: What can we learn from observations? J. Hydrometeorol. 2013, 14, 906–922. [Google Scholar] [CrossRef]
  32. Federico, S.; Torcasio, R.C.; Puca, S.; Vulpiani, G.; Comellas Prat, A.; Dietrich, S.; Avolio, E. Impact of radar reflectivity and lightning data assimilation on the rainfall forecast and predictability of a summer convective thunderstorm in Southern Italy. Atmosphere 2021, 12, 958. [Google Scholar] [CrossRef]
  33. Duffourg, F.; Nuissier, O.; Ducrocq, V.; Flamant, C.; Chazette, P.; Delanoë, J.; Doerenbecher, A.; Fourrié, N.; Di Girolamo, P.; Lac, C.; et al. Offshore deep convection initiation and maintenance during the HyMeX IOP 16a heavy precipitation event. Q. J. R. Meteorol. Soc. 2016, 142, 259–274. [Google Scholar] [CrossRef]
  34. Capecchi, V.; Antonini, A.; Benedetti, R.; Fibbi, L.; Melani, S.; Rovai, L.; Ricchi, A.; Cerrai, D. Assimilating X-and S-band Radar Data for a Heavy Precipitation Event in Italy. Water 2021, 13, 1727. [Google Scholar] [CrossRef]
  35. Ferretti, R.; Pichelli, E.; Gentile, S.; Maiello, I.; Cimini, D.; Davolio, S.; Miglietta, M.M.; Panegrossi, G.; Baldini, L.; Pasi, F.; et al. Overview of the first HyMeX Special Observation Period over Italy: Observations and model results. Hydrol. Earth Syst. Sci. 2014, 18, 1953–1977. [Google Scholar] [CrossRef] [Green Version]
  36. Fiori, E.; Comellas, A.; Molini, L.; Rebora, N.; Siccardi, F.; Gochis, D.J.; Tanelli, S.; Parodi, A. Analysis and hindcast simulations of an extreme rainfall event in the Mediterranean area: The Genoa 2011 case. Atmos. Res. 2014, 138, 13–29. [Google Scholar] [CrossRef] [Green Version]
  37. Fiori, E.; Ferraris, L.; Molini, L.; Siccardi, F.; Kranzlmueller, D.; Parodi, A. Triggering and evolution of a deep convective system in the Mediterranean Sea: Modelling and observations at a very fine scale. Q. J. R. Meteorol. Soc. 2017, 143, 927–941. [Google Scholar] [CrossRef]
  38. Lagasio, M.; Silvestro, F.; Campo, L.; Parodi, A. Predictive capability of a high-resolution hydrometeorological forecasting framework coupling WRF cycling 3dvar and Continuum. J. Hydrometeorol. 2019, 20, 1307–1337. [Google Scholar] [CrossRef]
  39. Poletti, M.L.; Silvestro, F.; Davolio, S.; Pignone, F.; Rebora, N. Using nowcasting technique and data assimilation in a meteorological model to improve very short range hydrological forecasts. Hydrol. Earth Syst. Sci. 2019, 23, 3823–3841. [Google Scholar] [CrossRef] [Green Version]
  40. Castorina, G.; Colombo, F.; Caccamo, M.T.; Cannuli, A.; Insinga, V.; Maiorana, E.; Magazù, S. Cultural Heritage and Natural Hazard: How WRF Model Can Help to Protect and Safe Archaeological Sites. Int. J. Res. Environ. Sci. 2017, 3, 37–42. [Google Scholar]
  41. Powers, J.G. The Weather Research and Forecasting Model Overview, System Efforts, and Future Directions. Bull. Am. Meteorol. Soc. 2017, 98, 1717–1737. [Google Scholar] [CrossRef]
  42. Colombo, F.; Castorina, G.; Caccamo, M.T.; Insinga, V.; Maiorana, E.; Magazù, S. IT Technologies for Science Application: Using Meteorological Local Area Model to Contrast the Hydrogeological Risks. Hydrol. Curr. Res. 2017, 8, 4. [Google Scholar] [CrossRef] [Green Version]
  43. Skamarock, W.C.; Klemp, J.B.; Dudhia, J.; Gill, D.O.; Liu, Z.; Berner, J.; Wang, W.; Powers, J.G.; Duda, M.G.; Barker, D.M.; et al. A Description of the Advanced Research WRF Model Version 4; Mesoscale and Microscale Meteorology Laboratory NCAR: Boulder, CO, USA, 2019. [Google Scholar]
  44. Ooyama, K.V. A thermodynamic foundation for modeling the moist atmosphere. J. Atmos. Sci. 1990, 47, 2580–2593. [Google Scholar] [CrossRef]
  45. Laprise, R. The Euler equations of motion with hydrostatic pressure as an independent variable. Mon. Weather Rev. 1992, 120, 197–207. [Google Scholar] [CrossRef]
  46. Skamarock, W.C.; Klemp, J.B.; Dudhia, J. Prototypes for the WRF (Weather Research and Forecasting) model. Am. Meteorol. Soc. 2001, J11–J15, preprints. [Google Scholar]
  47. Bonekamp, P.N.J.; Collier, E.; Immerzeel, W.W. The impact of spatial resolution, land use, and spinup time on resolving spatial precipitation patterns in the Himalayas. J. Hydrometeorol. 2018, 19, 1565–1581. [Google Scholar] [CrossRef] [Green Version]
  48. Kleczek, M.A.; Steeneveld, G.-J.; Holtslag, A.A.M. Evaluation of the weather research and forecasting mesoscale model for GABLS3: Impact of boundary-layer schemes, boundary conditions and spin-up. Bound.-Layer Meteorol. 2014, 152, 213–243. [Google Scholar] [CrossRef]
  49. Liu, Y.; Chen, Y.; Lu, Z.; WANG, J.; Chen, C.-N.; Rico-Ramirez, M.A.; Han, D. Optimal spin-up time exploration of the WRF model by using various hydrometeor species as the initial conditions. Agu Fall Meet. Abstr. 2020, 2020, A183-0007. Available online: https://ui.adsabs.harvard.edu/abs/2020AGUFMA183.0007L (accessed on 23 January 2023).
  50. Wang, S.; Huang, S.; Li, Y. Sensitive numerical simulation and analysis of rainstorm using nested WRF model. J. Hydrodyn. 2006, 18, 578–586. [Google Scholar] [CrossRef]
  51. Jee, J.B.; Kim, S. Sensitivity Study on High-Resolution WRF Precipitation Forecast for a Heavy Rainfall Event. Atmosphere 2017, 8, 96. [Google Scholar] [CrossRef] [Green Version]
  52. Wang, W.; Gill, D. WRF nesting. In WRF Tutorial; NCAR: Boulder, CO, USA, 2012. [Google Scholar]
  53. Emmanouil, G.; Vlachogiannis, D.; Sfetsos, A. Exploring the ability of the WRF-ARW atmospheric model to simulate different meteorological conditions in Greece. Atmos. Res. 2021, 247, 105226. [Google Scholar] [CrossRef]
  54. Castorina, G.; Caccamo, M.T.; Magazù, S. Study of convective motions and analysis of the impact of physical parametrization on the WRF-ARW forecast model. Atti Della Accad. Peloritana 2019, 97, A19. [Google Scholar]
  55. Castorina, G.; Caccamo, M.T.; Colombo, F.; Magazù, S. The Role of Physical Parameterizations on the Numerical Weather Prediction: Impact of Different Cumulus Schemes on Weather Forecasting on Complex Orographic Areas. Atmosphere 2021, 12, 616. [Google Scholar] [CrossRef]
  56. Castorina, G.; Caccamo, M.T.; Magazù, S.; Restuccia, L. Multiscale mathematical and physical model for the study of nucleation processes in meteorology. Atti Della Accad. Peloritana 2018, 96, A6. [Google Scholar]
  57. Castorina, G.; Caccamo, M.T.; Insinga, V.; Magazù, S.; Munaò, G.; Ortega, C.; Semprebello, A.; Rizza, U. Impact of the Different Grid Resolutions of the WRF Model for the Forecasting of the Flood Event of 15 July 2020 in Palermo (Italy). Atmosphere 2022, 13, 1717. [Google Scholar] [CrossRef]
  58. Iacono, M.J.; Delamere, J.S.; Mlawer, E.J.; Shephard, M.W.; Clough, S.A.; Collins, W.D. Radiative forcing by long-lived greenhouse gases: Calculations with the AER radiative transfer models. J. Geophys. Res. Atmos. 2008, 113, D13103. [Google Scholar] [CrossRef]
  59. Janjić, Z.I. The Step-Mountain Eta Coordinate Model: Further Developments of the Convection, Viscous Sublayer, and Turbulence Closure Schemes. Mon. Weather Rev. 1994, 122, 927–945. [Google Scholar] [CrossRef]
  60. Mesinger, F. Forecasting upper tropospheric turbulence within the framework of the Mellor-Yamada 2.5 closure. In Research Activities in Atmospheric and Oceanic Modelling; CAS/JSC WGNE Rep. No. 18; WMO: Geneva, Switzerland, 1993; pp. 4.28–4.29. [Google Scholar]
  61. Mukul Tewari, N.; Tewari, M.; Chen, F.; Wang, W.; Dudhia, J.; LeMone, M.; Mitchell, K.; Ek, M.; Gayno, G.; Wegiel, J.; et al. Implementation and verification of the unified NOAH land surface model in the WRF model. In Proceedings of the 20th Conference on Weather Analysis and Forecasting/16th Conference on Numerical Weather Prediction, Seattle, WA, USA, 10 January 2004; pp. 11–15. [Google Scholar]
  62. Thompson, G.; Field, P.R.; Rasmussen, R.M.; Hall, W.D. Explicit Forecasts of Winter Precipitation Using an Improved Bulk Microphysics Scheme. Part II: Implementation of a New Snow Parameterization. Mon. Weather Rev. 2008, 136, 5095–5115. [Google Scholar] [CrossRef]
  63. Kain, J.S. The Kain-Fritsch Convective Parameterization: An Update. J. Appl. Meteorol. 2004, 43, 170–181. [Google Scholar] [CrossRef]
  64. Villalba-Pradas, A.; Tapiador, F.J. Empirical values and assumptions in the convection schemes of numerical models. Geosci. Model Dev. 2022, 15, 3447–3518. [Google Scholar] [CrossRef]
  65. Somses, S.; Bopape, M.J.M.; Ndarana, T.; Fridlind, A.; Matsui, T.; Phaduli, E.; Limbo, A.; Maikhudumu, S.; Maisha, R.; Rakate, E. Convection Parametrization and Multi-Nesting Dependence of a Heavy Rainfall Event over Namibia with Weather Research and Forecasting (WRF) Model. Climate 2020, 8, 112. [Google Scholar] [CrossRef]
  66. Use of four-dimensional data assimilation in a limited-area mesoscale model Part II: Effects of data assimilation within the planetary boundary layer. Mon. Weather. Rev. 1991, 119, 734–754. [CrossRef]
  67. WRF Sensitivity Analysis in Wind and Temperature Fields Simulation for the Northern Sahara and the Mediterranean Basin. Atmosphere 2020, 11, 259. [CrossRef] [Green Version]
  68. Four dimensional data assimilation (FDDA) impacts on WRF performance in simulating inversion layer structure and distributions of CMAQ-simulated winter ozone concentrations in Uintah Basin. Atmos. Environ. 2018, 177, 75–92. [CrossRef]
  69. Hersbach, H.; Bell, B.; Berrisford, P.; Horányi, A.; Sabater, J.M.; Nicolas, J.; Radu, R.; Schepers, D.; Simmons, A.; Soci, C.; et al. Global reanalysis: Goodbye ERA-Interim, hello ERA5. ECMWF Newsl. 2019, 159, 17–24. [Google Scholar]
  70. Caccamo, M.T.; Castorina, G.; Catalano, F.; Magazù, S. Rüchardt’s experiment treated by Fourier transform. Eur. J. Phys. 2019, 40, 025703. [Google Scholar] [CrossRef]
  71. Castorina, G.; Caccamo, M.T.; Magazù, S. A new approach to the adiabatic piston problem through the arduino board and innovative frequency analysis procedures. In New Trends in Physics Education Research; Magazù, S., Ed.; Nova Science Publishers: Hauppauge, NY, USA, 2018; pp. 133–156. [Google Scholar]
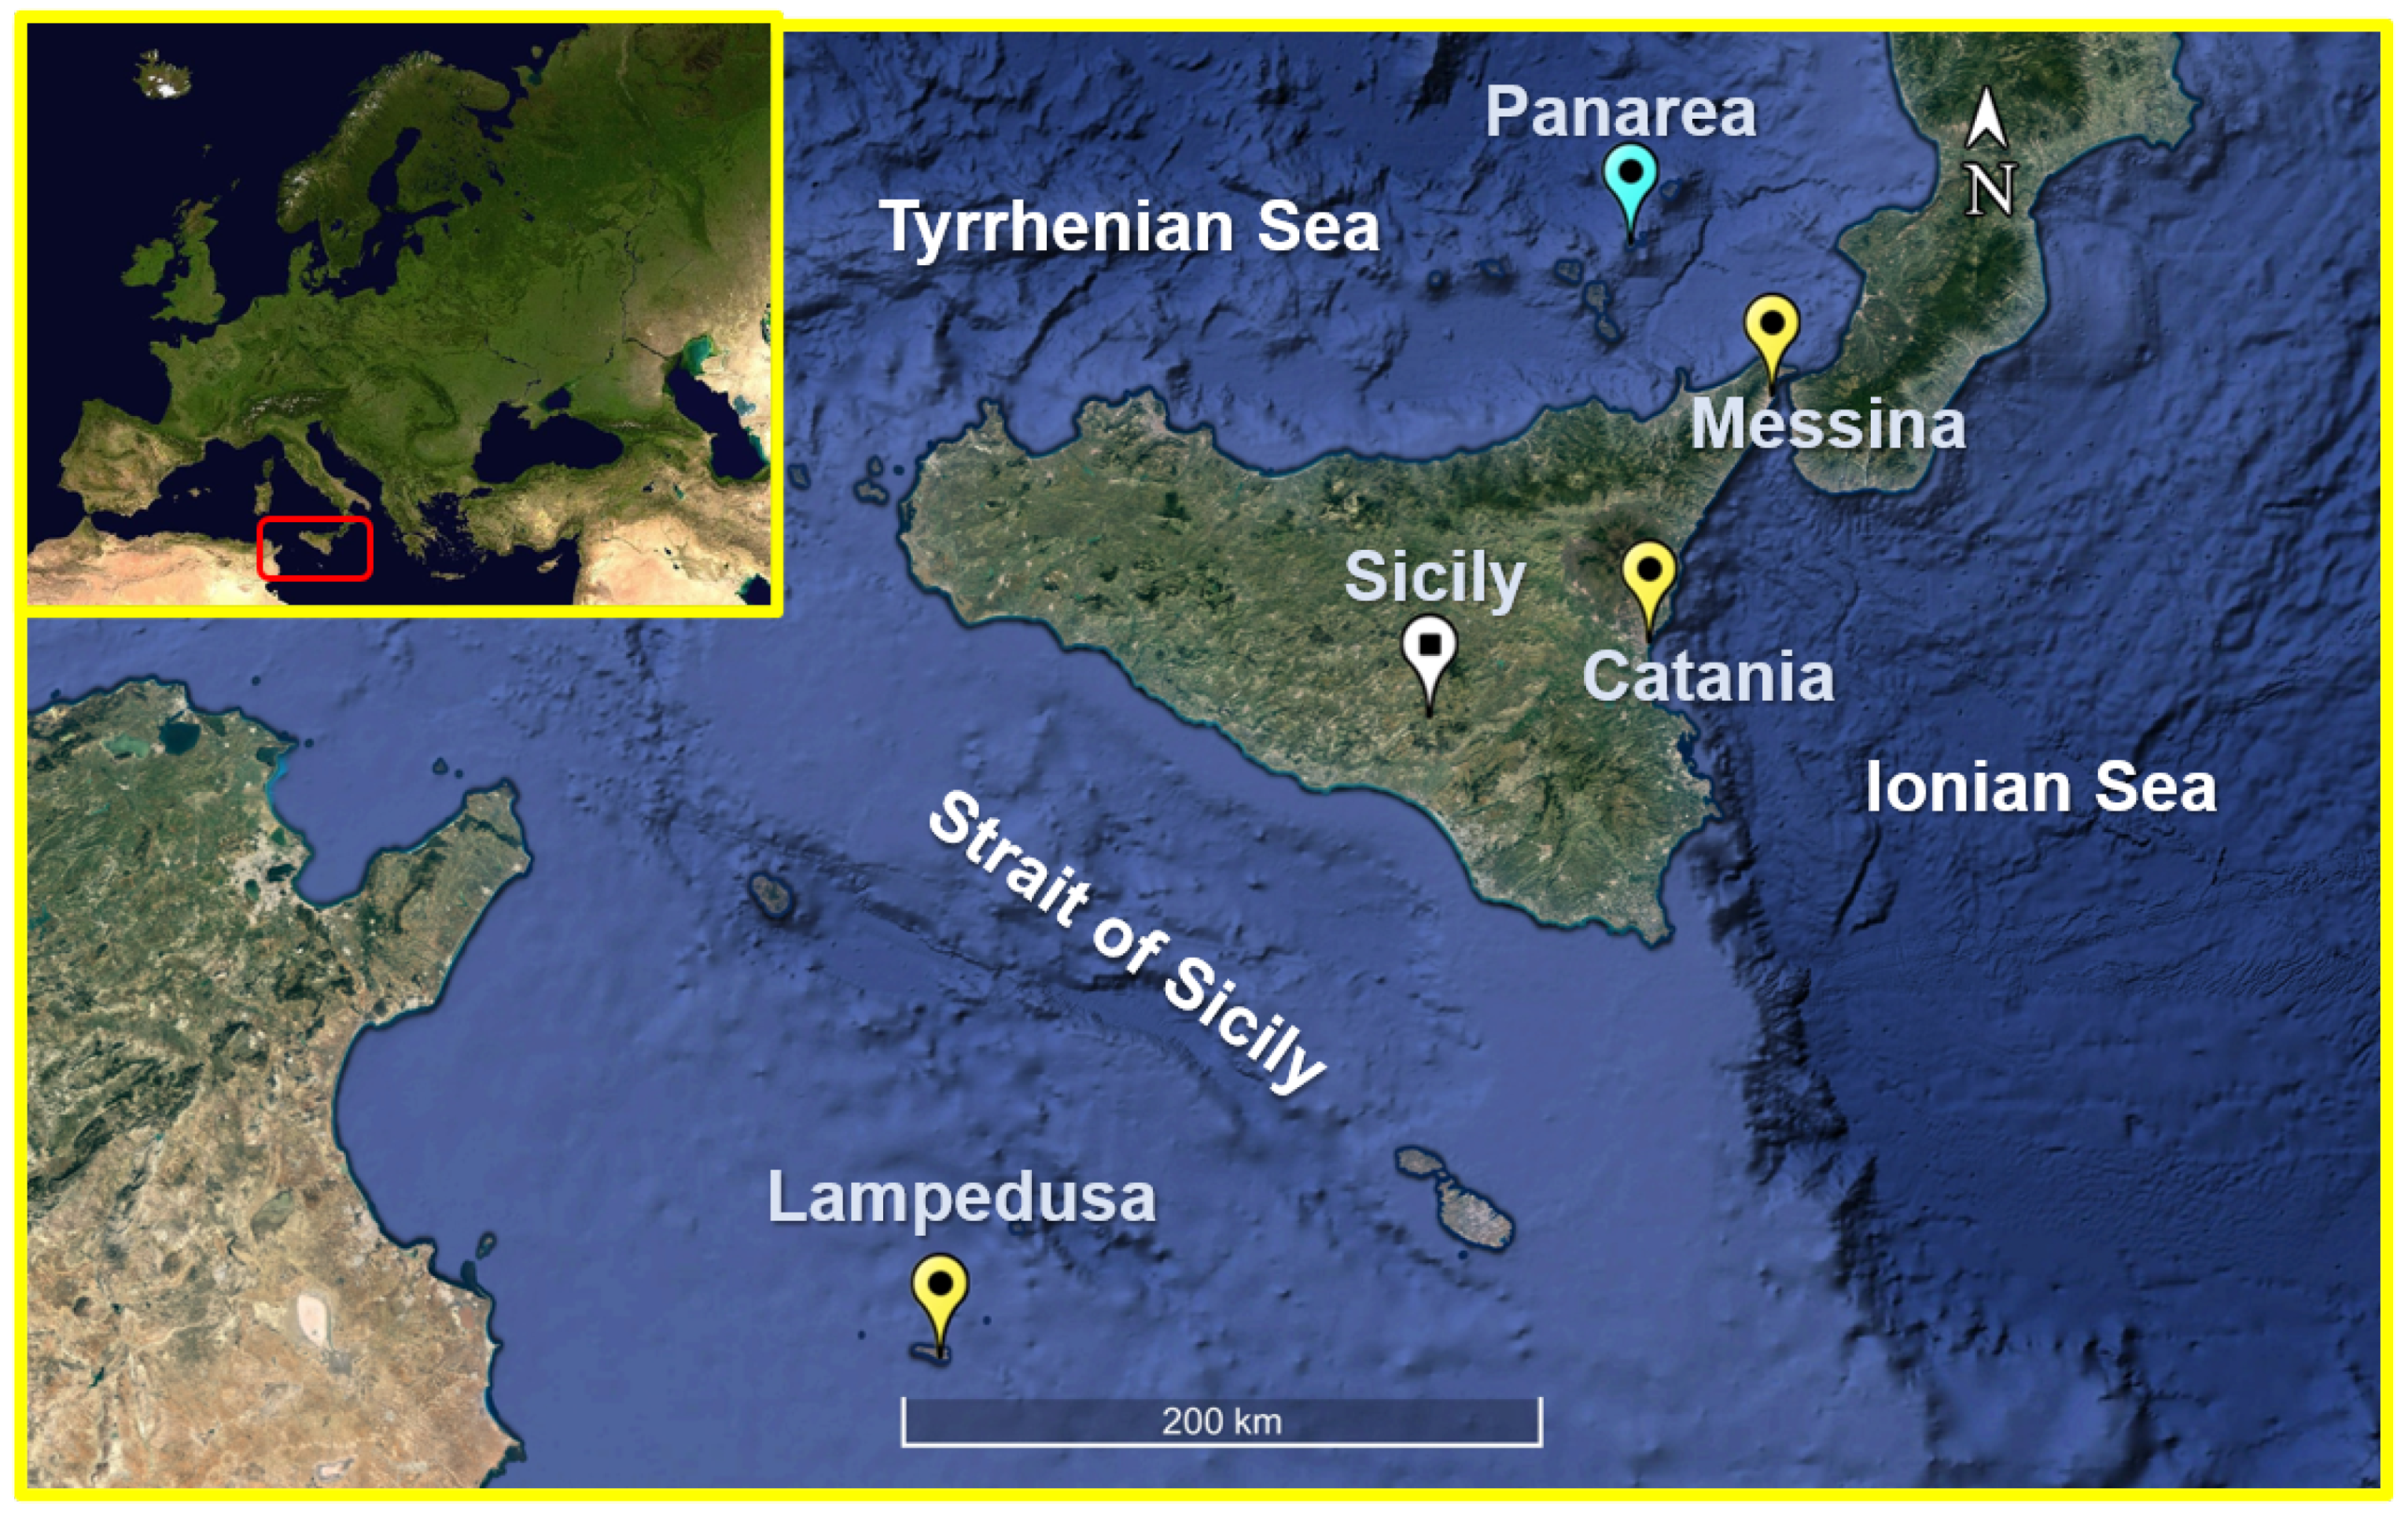
Figure 1. Map showing the position of the analyzed measuring stations in Sicily, belonging to ISPRA (yellow markers) and INGV (light blue marker) networks (edited from Google Earth).
Atmosphere 14 00390 g001
Figure 2. Charts showing the upward trend of sea surface temperatures from January 2010 to December 2022 (data available online on ISPRA website).
Atmosphere 14 00390 g002
Figure 3. Chart showing the upward trend of the autumn sea temperature from 2015 to 2021.
Atmosphere 14 00390 g003
Figure 4. Real-Time Global Sea Surface Temperature Analysis referred to 11 November 2019.
Atmosphere 14 00390 g004
Figure 5. Representation of the domains and the orography, passing from the parent domain to the nested one.
Atmosphere 14 00390 g005
Figure 6. The 500 hPa geopotential height (gpdm) at 00:00 UTC, 12:00 UTC of 11 November 2019 and 00:00 UTC, 12:00 UTC of 12 November 2019.
Atmosphere 14 00390 g006
Figure 7. Wind speed (m/s) at 500 hPa at 00:00 UTC, 12:00 UTC of 11 November 2019 and 00:00 UTC, 12:00 UTC of 12 November 2019.
Atmosphere 14 00390 g007
Figure 8. Temperature (°C) at 850 hPa at 00:00 UTC, 12:00 UTC of 11 November 2019 and 00:00 UTC, 12:00 UTC of 12 November 2019.
Atmosphere 14 00390 g008
Figure 9. Relative humidity (%) at 850 hPa at 00:00 UTC, 12:00 UTC of 11 November 2019 and 00:00 UTC, 12:00 UTC of 12 November 2019.
Atmosphere 14 00390 g009
Figure 10. Infrared satellite image at 15:00 UTC of 11 November 2019, in which the genesis of a V-shaped storm is shown. Image used for permission by ©EUMETSAT, Modified: wetterzentrale.de available online https://www.wetterzentrale.de/reanalysis.php-jaar=2019&maand=11&dag=11&uur=1500&var=44&map=1&model=sat (accessed on 11 November 2019).
Atmosphere 14 00390 g010
Figure 11. Cumulative rainfall (mm) in the 48 h from 00:00 UTC of 11 November to 00:00 UTC of 13 November 2019.
Atmosphere 14 00390 g011
Figure 12. Rainfall accumulations detected by the Linguaglossa North Etna weather station belonging to the Servizio Informativo Agrometeorologico Siciliano (SIAS).
Atmosphere 14 00390 g012
Figure 13. Maps showing rainfall accumulations (in mm) forecasted at intervals of three hours from 12:00 UTC of 11 November to 00:00 UTC of 13 November 2019.
Atmosphere 14 00390 g013aAtmosphere 14 00390 g013b
Figure 14. Map showing rainfall accumulations (in mm) forecasted for the entire event (36 h), from 12:00 UTC of 11 November to 00:00 UTC of 13 November 2019.
Atmosphere 14 00390 g014
Figure 15. Map showing the weather stations chosen in the Sicilian territory (edited from Google Earth).
Atmosphere 14 00390 g015
Figure 16. Maps showing rainfall accumulations (in mm) forecasted (with FDDA) at intervals of three hours from 12:00 UTC of 11 November to 00:00 UTC of 13 November 2019.
Atmosphere 14 00390 g016aAtmosphere 14 00390 g016bAtmosphere 14 00390 g016c
Figure 17. Map showing rainfall accumulations (in mm) forecasted (with FDDA) for the entire event (36 h), from 12:00 UTC of 11 November to 00:00 UTC of 13 November 2019.
Atmosphere 14 00390 g017
Figure 18. Charts showing the comparison between rainfall accumulations observed by the weather stations chosen in the Sicilian territory and those forecasted by two different simulations carried out using by WRF model.
Atmosphere 14 00390 g018
Figure 19. Chart showing the comparison between total rainfall accumulations observed by the weather stations chosen and those forecasted by two different simulations carried out by using WRF model.
Atmosphere 14 00390 g019
Figure 20. Bar histogram showing the values of the dichotomous indexes obtained from the comparison between observed rainfall data and those forecasted by the simulations performed (without and with FDDA).
Atmosphere 14 00390 g020
Table 1. Phisycal parameterizations of the WRF model adopted in this case study.
Namelist Variable9 km domain3 km domain
Long-wave Radiationra_lw_physicsRRTMG [58]RRTMG [58]
Short-wave Radiationra_sw_physicsRRTMG [58]RRTMG [58]
PBL Modelbl_pbl_physicsMYJ [59,60]MYJ [59,60]
Land–Surfacesf_surface_physicsNLSM [61]NLSM [61]
Microphysicsmp_physicsThompson [62]Thompson [62]
Cumuluscu_physicsKain–Fritsch [63]Explicit [64,65]
Table 2. Comparison among cumulative rainfall values (in mm) at the end of the event observed by the SIAS weather stations and those simulated by the WRF model.
StationsObservedWRF—No FDDA
Erice (TP)30.829.6
Trapani Fulgatore (TP)36.639.1
Lascari (PA)24.019.3
Mezzojuso (PA)37.437.6
Termini Imerese (PA)29.225.6
Caronia Pomiere (ME)115.4104.1
Cesarò Vignazza (ME)101.8151.3
Montalbano Elicona (ME) 86.6 141.2
Pettineo (ME)47.633.7
Bronte (CT)108.4109.9
Linguaglossa North Etna (CT)293.6328.3
Mazzarrone (CT)90.495.3
Paternò (CT) 89.2 120.6
Agira (EN)101.681.2
Enna (EN)67.867.4
Augusta (SR)60.4128.4
Palazzolo Acreide (SR)69.8154.8
Siracusa (SR) 57.6 122.1
Acate (RG)82.4100.6
Comiso (RG)82.283.9
Modica (RG) 82.2 137.5
Santa Croce Camerina (RG) 87.4 102.9
Gela (CL)114.497.2
Butera (CL)102.291.3
Agrigento Mandrascava (AG)78.683.5
Licata (AG)95.684.4
Sciacca (AG)50.857.9
Table 3. Comparison among cumulative rainfall values (in mm), at the end of the event, observed by the SIAS weather stations and those simulated by the WRF model, without and with FDDA technicque.
StationsObservedWRF—No FDDAWRF—FDDA
Erice (TP)30.829.638.6
Trapani Fulgatore (TP)36.639.146.5
Lascari (PA)24.019.314.4
Mezzojuso (PA)37.437.616.2
Termini Imerese (PA)29.225.616.7
Caronia Pomiere (ME)115.4104.193.9
Cesarò Vignazza (ME)101.8151.3106.2
Montalbano Elicona (ME) 86.6 141.2 82.5
Pettineo (ME)47.633.730.4
Bronte (CT)108.4109.9123.0
Linguaglossa North Etna (CT)293.6328.3283.5
Mazzarrone (CT)90.495.368.9
Paternò (CT) 89.2 120.6 101.3
Agira (EN)101.681.2100.0
Enna (EN)67.867.458.4
Augusta (SR)60.4128.497.2
Palazzolo Acreide (SR)69.8154.8114.4
Siracusa (SR) 57.6 122.1 84.3
Acate (RG)82.4100.660.2
Comiso (RG)82.283.960.4
Modica (RG) 82.2 137.5 95.7
Santa Croce Camerina (RG) 87.4 102.9 62.5
Gela (CL)114.497.278.4
Butera (CL)102.291.362.3
Agrigento Mandrascava (AG)78.683.584.8
Licata (AG)95.684.491.1
Sciacca (AG)50.857.936.3
Disclaimer/Publisher’s Note: The statements, opinions and data contained in all publications are solely those of the individual author(s) and contributor(s) and not of MDPI and/or the editor(s). MDPI and/or the editor(s) disclaim responsibility for any injury to people or property resulting from any ideas, methods, instructions or products referred to in the content.