Article

Examining Seasonality Based on Probabilistic Properties of Extreme Precipitation Timing in the Eastern United States

Environmental and Health Sciences Program, Spelman College, Atlanta, GA 30314-4399, USA
*
Author to whom correspondence should be addressed.
Atmosphere 2023, 14(2), 366; https://doi.org/10.3390/atmos14020366
Submission received: 30 December 2022 / Revised: 4 February 2023 / Accepted: 10 February 2023 / Published: 13 February 2023
(This article belongs to the Section Climatology)

Abstract

:
Global warming is likely to provoke extreme storms in the eastern United States (eUS), ultimately affecting the probabilistic distribution of the dates of daily maximum precipitation. In this study, probabilistic properties of timing of annual maximum precipitation (AMP) were studied using circular statistics at 583 sites in the eUS (1950–2019). A kernel circular density method was applied to examine distributional modes of timing of AMP. The results of circular median show that seasonality is pronounced across the eUS with many locations having their median date of occurrence in summer, and AMP seasonality is strong in the East North Central region. Similarly, results of circular density method applied to the distribution of AMP timing shows that around 90% of the sites have two or three modes of AMP seasonality in the eUS. Comparison of seasonality between two historical records of equal length (1950–1984 and 1985–2019) shows great spatial variability across the eUS. Temporal changes in seasonal modes for AMP dates revealed four different cases of seasonality changes: (i) weakening of seasonality, (ii) strengthening of seasonality, (iii) strong seasonality for both the old and recent periods, (iv) or uniform or no preferred seasonality for both periods. While a spatial coherence of seasonality changes was not observed, majority of sites showed strong seasonality (case iii) for old and recent periods mainly during summer and fall seasons.

1. Introduction

In a variable and changing climate, characterization of the seasonality of extreme precipitation and its temporal changes (nonstationarity) is critical to many hydrological and water resources management applications, including decision-making to stormwater management [1] as well as allocations of water for urban usage, agriculture, and ecosystems [2,3,4]. Consequently, characterization of changes in extreme precipitation seasonality over time provides an improved understanding of streamflow variability and helps develop flood risks mitigation and adaptation strategies under global climate change [5]. Limited past research has focused on characterization of extreme precipitation seasonality and its changes in a regional or national scale across the contiguous United States. Pryor & Schoof [5] used observations of daily precipitation around the conterminous USA to study the changes in seasonality. They used the percentile-based metric of annual precipitation accumulation to look at the shifts in the mean day of the year at selected percentiles over three periods of 1911–1940, 1941–1970, and 1971–2000. In some regions, they found a spatial pattern in the differences of 20–30 days in the mean days of the year in the 50th percentile of the annual total precipitation. However, their results were limited to cover the year-round events of selected extremes. Using Markovian precipitation models, Pal et al. [4] examined long-term trends in a local-based stations during the wet and dry seasons for the contiguous USA from 1930–2009. They found that the frequencies of precipitation days have increased for both wet and dry seasons in most regions of the country. Moreover, the results reported a robust coherent sign in many stations as they showed early and/or late shifts in the timing of dry and wet seasons. However, the study lacks the temporal analysis for the specific data points of extreme precipitation. Mallakpour and Villarini [3] studied the seasonality of annual maxima precipitation and seasonality of heavy precipitation frequency using a gridded data over the contiguous USA (1948–2012). The authors used the percentages of events occurring per season to report that the annual maximum precipitation and heavy precipitation frequency, showing strong and distinct seasonality patterns related to different meteorological processes. However, their approach was limited to show statistically significant results of seasonality and determine the shifts in timing. Dhakal et al. [6] characterized the extreme precipitation seasonality and its temporal changes for the contiguous USA over the period 1951–2014 and investigated their linkages to the large-scale climate variability indices of NAO, ENSO and PDO. The authors used the timing of annual maximum of total daily and monthly precipitation to look at the special pattern of events seasonality and its strength using the circular mean and mean resultant length. They found that many stations have their circular mean in summer and fall, with a 10–20-day shift in the recent period. They also reported a weak seasonality with low mean resultant length values, as well as weak connection to the climate variability. However, there is still a lack of study to comprehensively explore the extreme precipitation seasonality and its strength based on the events timing/date distribution. To this end, accurate assessment of extreme precipitation seasonality, strength of seasonality, and their nonstationarity by using a comprehensive circular statistical framework warrants analysis of changes in both timing and strength of seasonal modes in a single study. As stated by Dhakal et al. [1], the distribution of timing of extreme precipitation is often multimodal instead of being pre-defined by season, which impacts the strength of seasonality. There is still a lack of study exploring the seasonality of extreme precipitation in terms of changes in the calendar dates as well as the strength of distributional modes of timing of extreme precipitation events over the U. S. [1].
Circular statistics is a useful approach for the seasonality assessment of extreme events such as extreme precipitation [1]. One major advantage of using a circular statistical approach to model the timing of extreme events is its ability to provide better understanding of variables modeled as circular random processes (i.e., the timing of an event within a cycle). Few past studies have used circular statistical approaches for analysis of the timing of extreme precipitation events or seasonality by using two summary statistics based on mean and variability [3,5]. However, as shown by Dhakal et al. [1], for sites with more than one mode of seasonality (bimodal or multimodal seasonality), information from two summary statistics (mean and variability) could be incomplete and inconclusive. As shown by Hirschboeck [7], the length and number of precipitation windows within a year are greatly impacted by regional patterns of seasonal weather and atmospheric moisture pathways. To our knowledge, none of the previous studies have specifically explored the seasonality (date of extreme precipitation) to properly reflect the possible multimodality. Additionally, in many cases, changes in seasonality may be attributable to the changes in the distributional modes of timing of extreme precipitation events such as weakening, strengthening, emergence or dissipation of modes during different seasons or combination of two or more of these cases. In this study we used a comprehensive circular statistical method including a probabilistic approach to:
  • Characterize the spatial pattern of seasonality based on indices representing the timing of extreme precipitation events and strength of seasonality across the eastern United States.
  • Identify the significant season(s) of extreme precipitation to properly reflect the possible multimodality in the distribution of extreme precipitation timing.
  • Examine whether there have been temporal shifts in the distributional modes of timing of AMP. If there have, can it be attributable to either weakening, strengthening, emergence, or dissipation of seasonality modes during different seasons or a combination of two or more of these cases?

2. Materials and Methods

2.1. Data and Study Area

We used 752 stations of daily precipitation data (1-day or 24-h total) over the period 1950–2019 (n = 70) from the Historical Climatology Network database [8]. To maintain the quality control of precipitation data, the following two sets of screening criteria were used: (a) in each year, percentage of days with missing values should be no more than 10%, and (b) for an individual station, precipitation record length should be greater than or equal to 63 years. Based on these filtering criteria, 583 stations across the eastern United States (eUS) were retained for analysis in this study (Figure 1).
The study area of the current work covers the eastern half from the contiguous United States (eUS). We divided the study area into five regions based on the classification of NOAA—The National Centers for Environmental Information that divide the contiguous USA into nine climatically consistent regions (https://www.ncdc.noaa.gov/monitoring-references/maps/us-climate-regions.php (accessed on 12 December 2022)). The total number of stations used here are well and sufficiently distributed over the five selected regions (Figure 1) as follows: Central or Ohio Valley (134 stations), Northeast–Central or Upper Midwest (87 stations), Northeast (95 stations), South (150 stations), and Southeast (117 stations).

2.2. Methods

We defined the extreme precipitation event based on the block maximum approach. For each station, we generated the annual maximum daily precipitation series from 1 January to 31 December (AMP). AMP was estimated as the maximum value of 1-day (or 24-h) rainfall totals within each year.

2.2.1. Circular Statistics

We characterized the seasonality or timing of AMP events by using circular statistical approach [9,10]. In circular statistics, the date of occurrence of an event within a year is modeled as a circular random process characterized as a point or angle on the circumference of a unit circle [9]. As a first step, the Julian date (Di) on which the extreme precipitation event occurred was determined for each year; Di = 1 for January 1st and Di = 365 for December 31st (Di = 366 for leap year). The Julian date for each extreme precipitation event was then transformed into a circular variable by computing [1]:
α i = D i 2 π 365
where α i is the angular value (in radians) for the extreme event “i”. For example, if an AMP occurred on July 1st (Julian Date = 182) it would have a corresponding value of 3.133 radians (or ~179 degrees). The circular mean direction α ¯   representing mean date of occurrence of n extreme precipitation events is obtained by using [9]:
α ¯   = arctan ( S / C )
where S and C represent the polar coordinates of the mean date on a unit circle given by:
S = i = 1 i = n sin α i n
C = i = 1 i = n cos α i n
The mean resultant length ρ measures the strength of seasonality by representing the spread of n extreme precipitation event occurrences about the mean date is then computed as:
ρ = S 2 + C 2 n
Several published studies have used circular mean and mean resultant length to analyze seasonality of precipitation and streamflow records [1,6,11,12,13,14,15,16,17,18,19]. In this study, we used the circular median day of the year to provide simplified summary of annual maxima daily precipitation timing variability for the 1950–2019 period.

2.2.2. Circular Distribution Function

The total probability of a circular distribution is concentrated on the circumference of a unit circle [9]. The von Mises distribution is often used to model circular data and has the probability density function (PDF) shown below:
f ( θ ; μ , κ ) = 1 2 π I 0 ( κ ) e k cos ( θ μ ) ,   0 θ < 2 π
where θ is a mean direction parameter, and κ ≥ 0 is a concentration parameter. I 0 ( κ ) in the normalizing constant is the modified Bessel function of the first kind of order 0 [9]. The parameter κ is bandwidth that determines the concentration of θ values towards the mean direction μ. We used the global optimum bandwidth developed by Dhakal et al. [1] as the median of the 1000 sets of bandwidths, estimated for the entire period using the likelihood cross-validation method which selects a bandwidth maximizing the likelihood cross-validation function [20].
Significance of the probability density estimates was examined by using non-parametric bootstrap method. Uniform distribution obtained from 1000 resampled data was compared against point-by-point probability density estimates of variability. The significant mode of seasonality for the extreme precipitation was estimated based on the empirical probability distribution function for the calendar dates of AMP measured at each station. As such, the one-unit circle was divided into 365 points as each point refers to the Julian date of the year. Consequently, these days were separated to form the four seasons of the year: winter (December-January-February), spring (March-April-May), summer (June-July-August), and fall (September-October-November). The season is considered to have a significant mode of AMP timing when the number of significant days passes a certain number of days per season. Each continuous significant mode of the PDF is extracted and examined against a certain threshold of number of days per season. Here, we selected that a season is considered to be a significant mode when the number of significant days is at least twenty days per season.
Three different examples of circular density estimate of the AMP dates are presented in Supplementary Figure S1 for (a) Minneapolis, Minnesota, (b) Flemington, New Jersey, and (c) Corning, Arkansas. The individual AMP dates are plotted as dots along the perimeter of the inner circle and the irregular solid gray line represents the circular density estimates of the AMP dates. The dotted line represents median estimate for significance based on density estimates using resampled data (n = 1000). For Minneapolis site, the circular distribution appears to be unimodal with significant density spanning through June–September. The station of Flemington has a bimodal distribution with two significant periods of (June–August) and (August–September). The last example has a multi-modal distribution of three significant seasons: spring (March–May), fall (September), and winter (December–January). All the computations of circular statistics in this work were executed in R programming software by using the statistical package “circular” [21].

3. Results and Discussions

3.1. Characterization of the Seasonality of Extreme Precipitation

A preliminary assessment of seasonality is presented in Figure 2 based on an examination of total counts of AMP dates that fall on each month of the year over the 70-year historical record of all sites in the selected region. The boxplots in Figure 2 depict the regional percentage of these counts. From Figure 2, we can see that monthly counts exhibit remarkable diversity across the five regions of the study area. For example, for Central, Northeast-Central, and Northeast regions, the majority of extreme precipitation events occur during summer (JJA) and fall (in September). While for the South, in addition to the fall, there is significant portion of events occurring during winter (DJF). On the other hand, counts of stations in the Southeast region show close to uniform behavior with extreme precipitations occurring evenly throughout all the four seasons. Such complex behavior observed in seasonal distribution of extreme event counts warrants the need of a superior technique for more clear and accurate representation of seasonality. To this end, an ordinary linear statistical approach is limited to detect a spatial pattern of seasonality and lack the ability to identify the shift in timing of events characterized by several different modes.

3.1.1. Spatial Pattern of the Seasonality of Extreme Precipitation

The spatial pattern of seasonality of AMP represented by circular median day of the year is presented in Figure 3. It can be seen from Figure 3 that extreme precipitation events have distinct seasonality patterns for different climate regions across the eastern USA. The median dates of occurrence of AMP (Figure 3a) for majority of stations in the Central and Northeast-Central regions are during summer. In the Northeast, many stations have the median date of occurrence during summer except several locations in the state of Maine and alongside the Atlantic coastal line have their median date of AMP in fall. The sites in the west of South and east of Southeast regions observe the median date of occurrence of extreme precipitation in summer, while the rest of the locations in both regions show no patterns of AMP seasonality. Based on regional boxplots (Figure 3b), the regional median date of occurrence of AMP for Central is 19 July, East North Central is 21 July, Northeast is 20 August, South is 11 July, and Southeast is 12 August. It is worthy to note that both regions of South and Southeast revealed different patterns of AMP seasonality as an indication to the mechanisms that impact the timing of extreme precipitation at different seasons in the area [6] such as the tropical cyclones, atmospheric rivers, and snowfall. The results presented here are confirming to the findings of seasonal patterns of extreme precipitation in the previous studies [3,4,5,6]. However, documenting the AMP seasonality needs further analysis to discover the embedded significant seasonal modes in extreme precipitation.

3.1.2. Modality and Strength of Seasonality of Extreme Precipitation

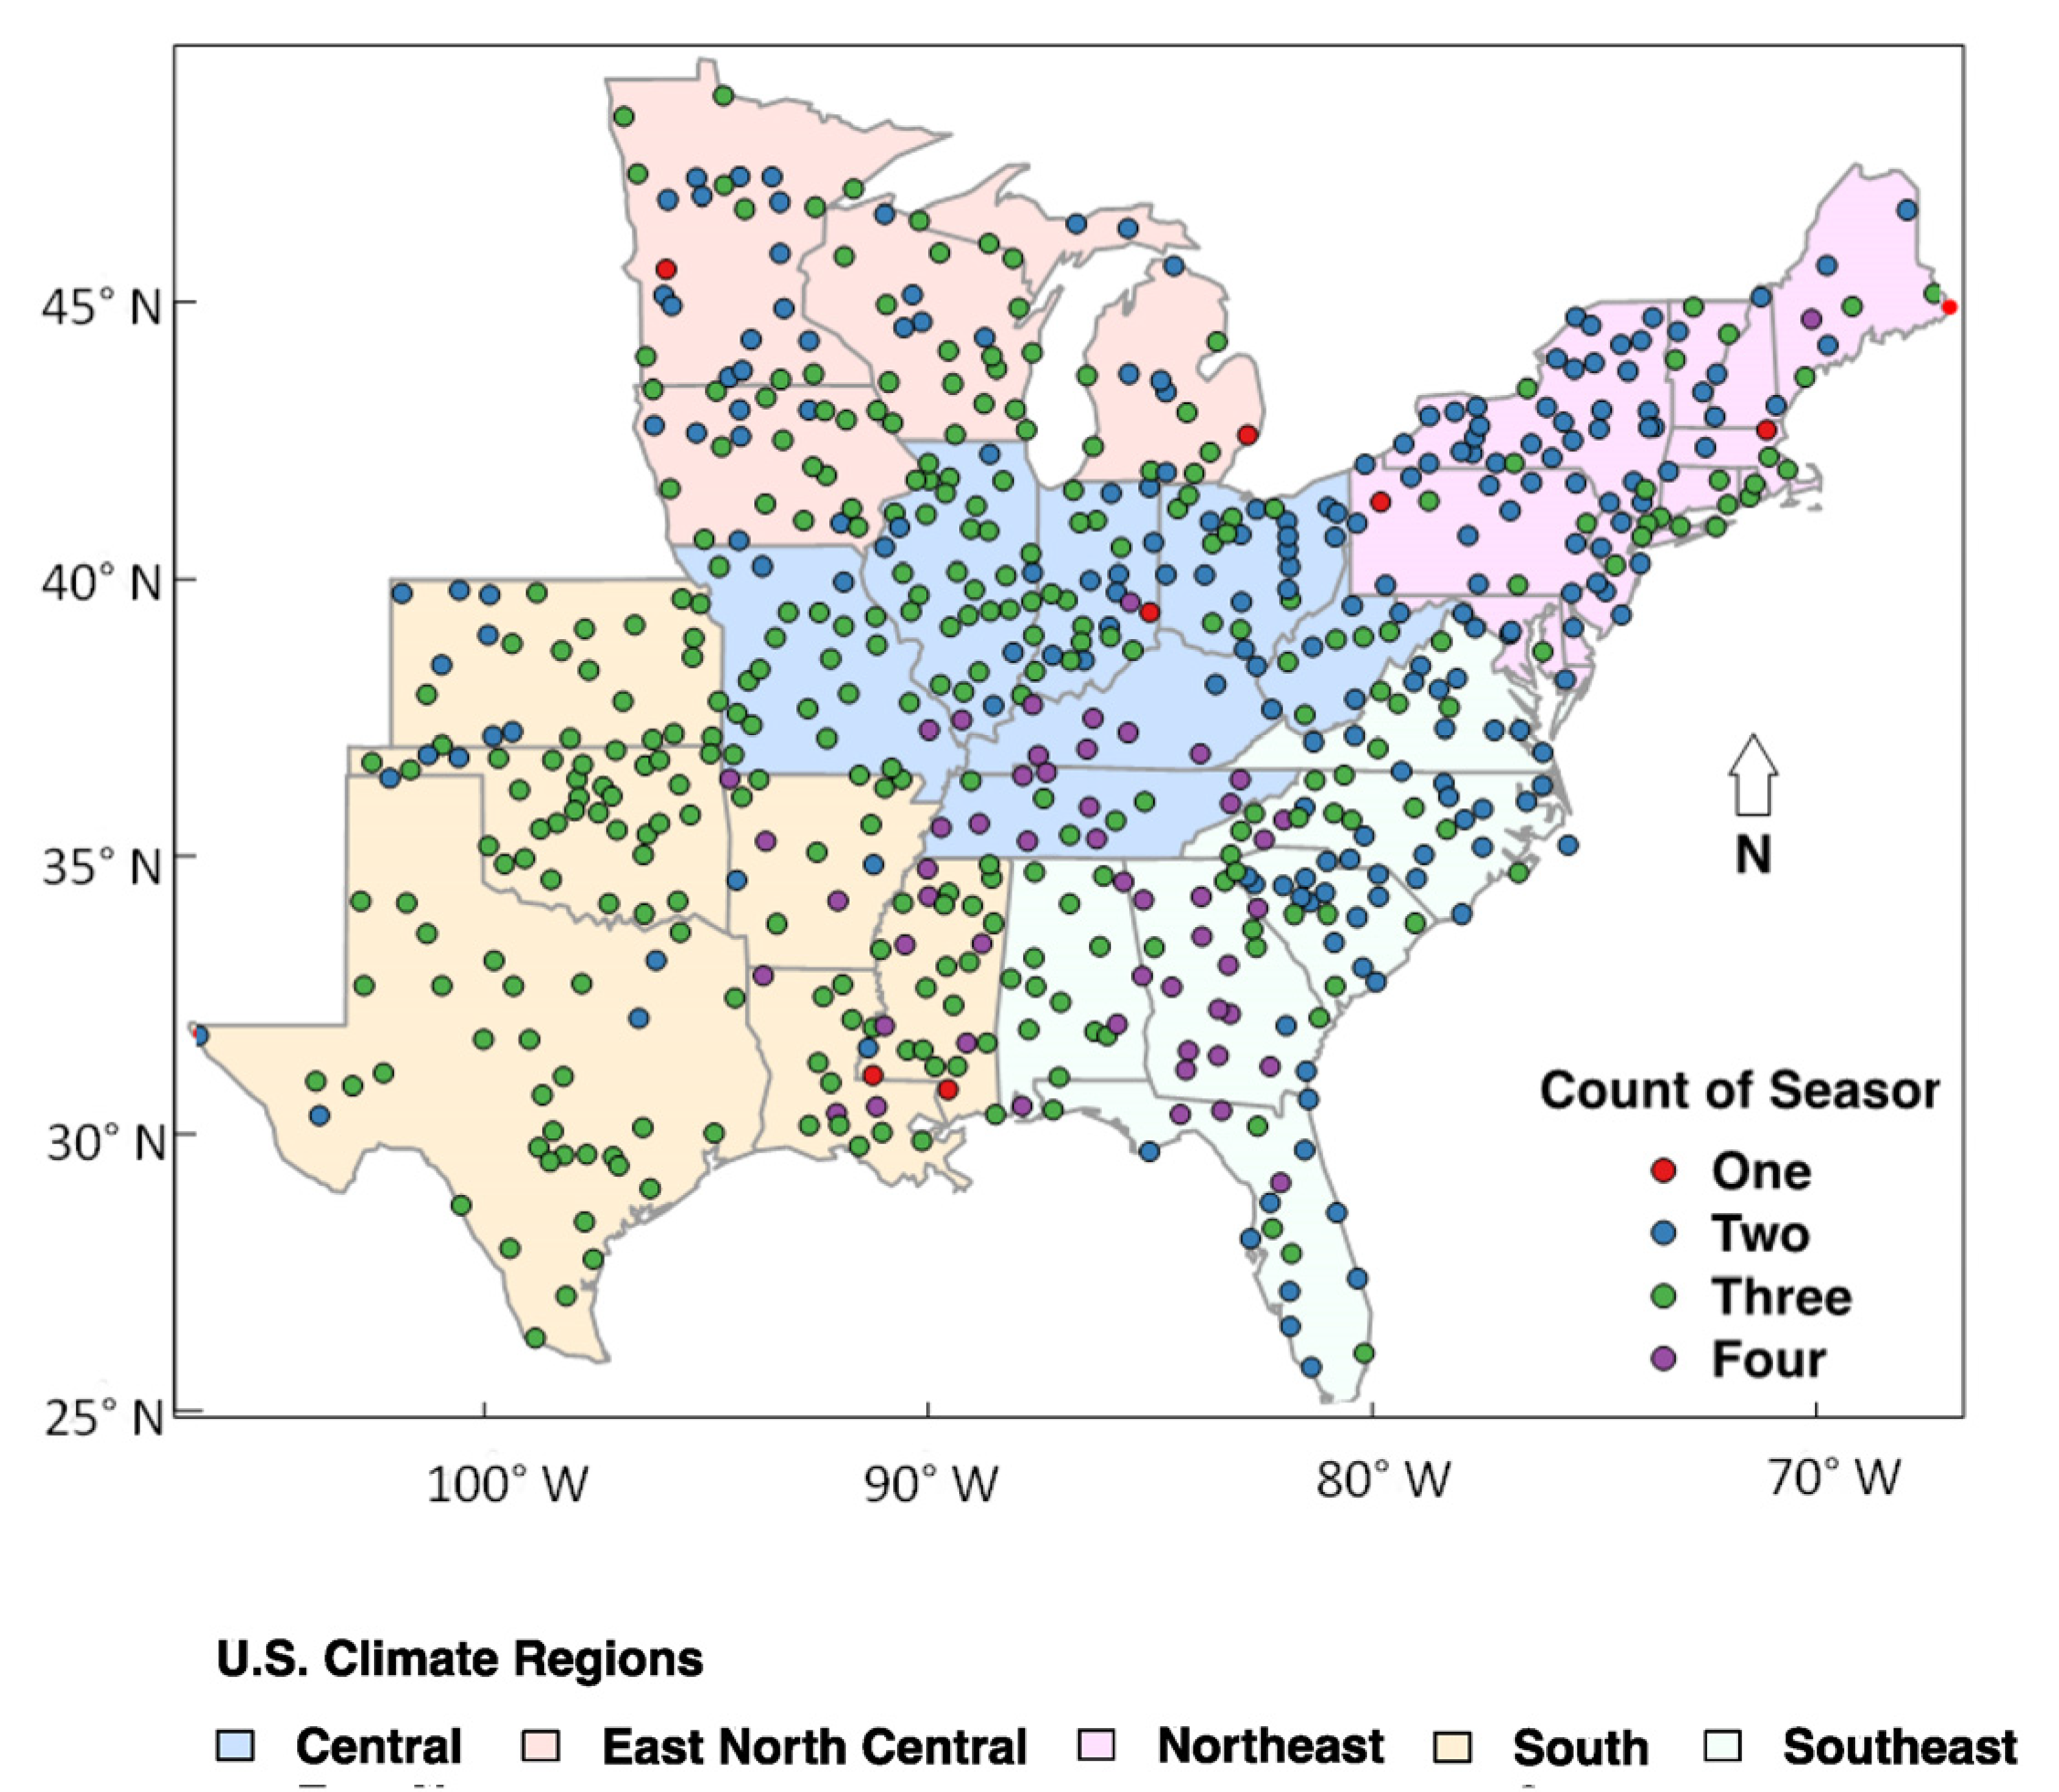
The analysis of significant modality of AMP timing seasonality and the strength of seasonality are carried out by using the statistical framework presented in Section 2.2.2. Kernel circular density was computed for each station based on the calendar dates of AMP. To assess the significance of the density estimates, the bootstrap technique was used as explained in Section 2.2.2. In general, we identified four different groups of extreme precipitation timings based on the number of seasons with significant seasonal modes for AMP dates; (i) Group 1, when the significant PDF mode of AMP dates stalled over only one season in the year, (ii) Group 2, when there are two separate significant modes occurring over two different seasons, (iii) Group 3, same as previous group but with three modes distributed over three seasons, (iv) Group 4, four modes over four different seasons. Figure 4 demonstrates that all locations have at least one significant season for the timing of AMP events. Overall results in Figure 4 show that 207 (36%) and 317 (54%) stations belong to Group 2 and Group 3, respectively. On the other hand, Group 4 is represented by 57 (9%) sites while only 7 (1%) sites have their AMP concentrated in one season (Group 1). Spatially, about 76% of the stations in Group 2 are distributed across the Central, Northeast, and Southeast regions, while only 8% of them are in the South region. For Group 3, most stations located in the Central and South regions represented 24% and 38% of this group, respectively. However, the Northeast-Central and Southeast regions included 14% and 16% of this group while the Northeast retained only 8% of stations. For Group 4, almost 98% of the sites are distributed in the Central, South, and Southeast regions. However, locations in Group 1 did not show a specific spatial pattern. Results presented here summate that the majority of sites experienced two or three seasons of AMP dates.
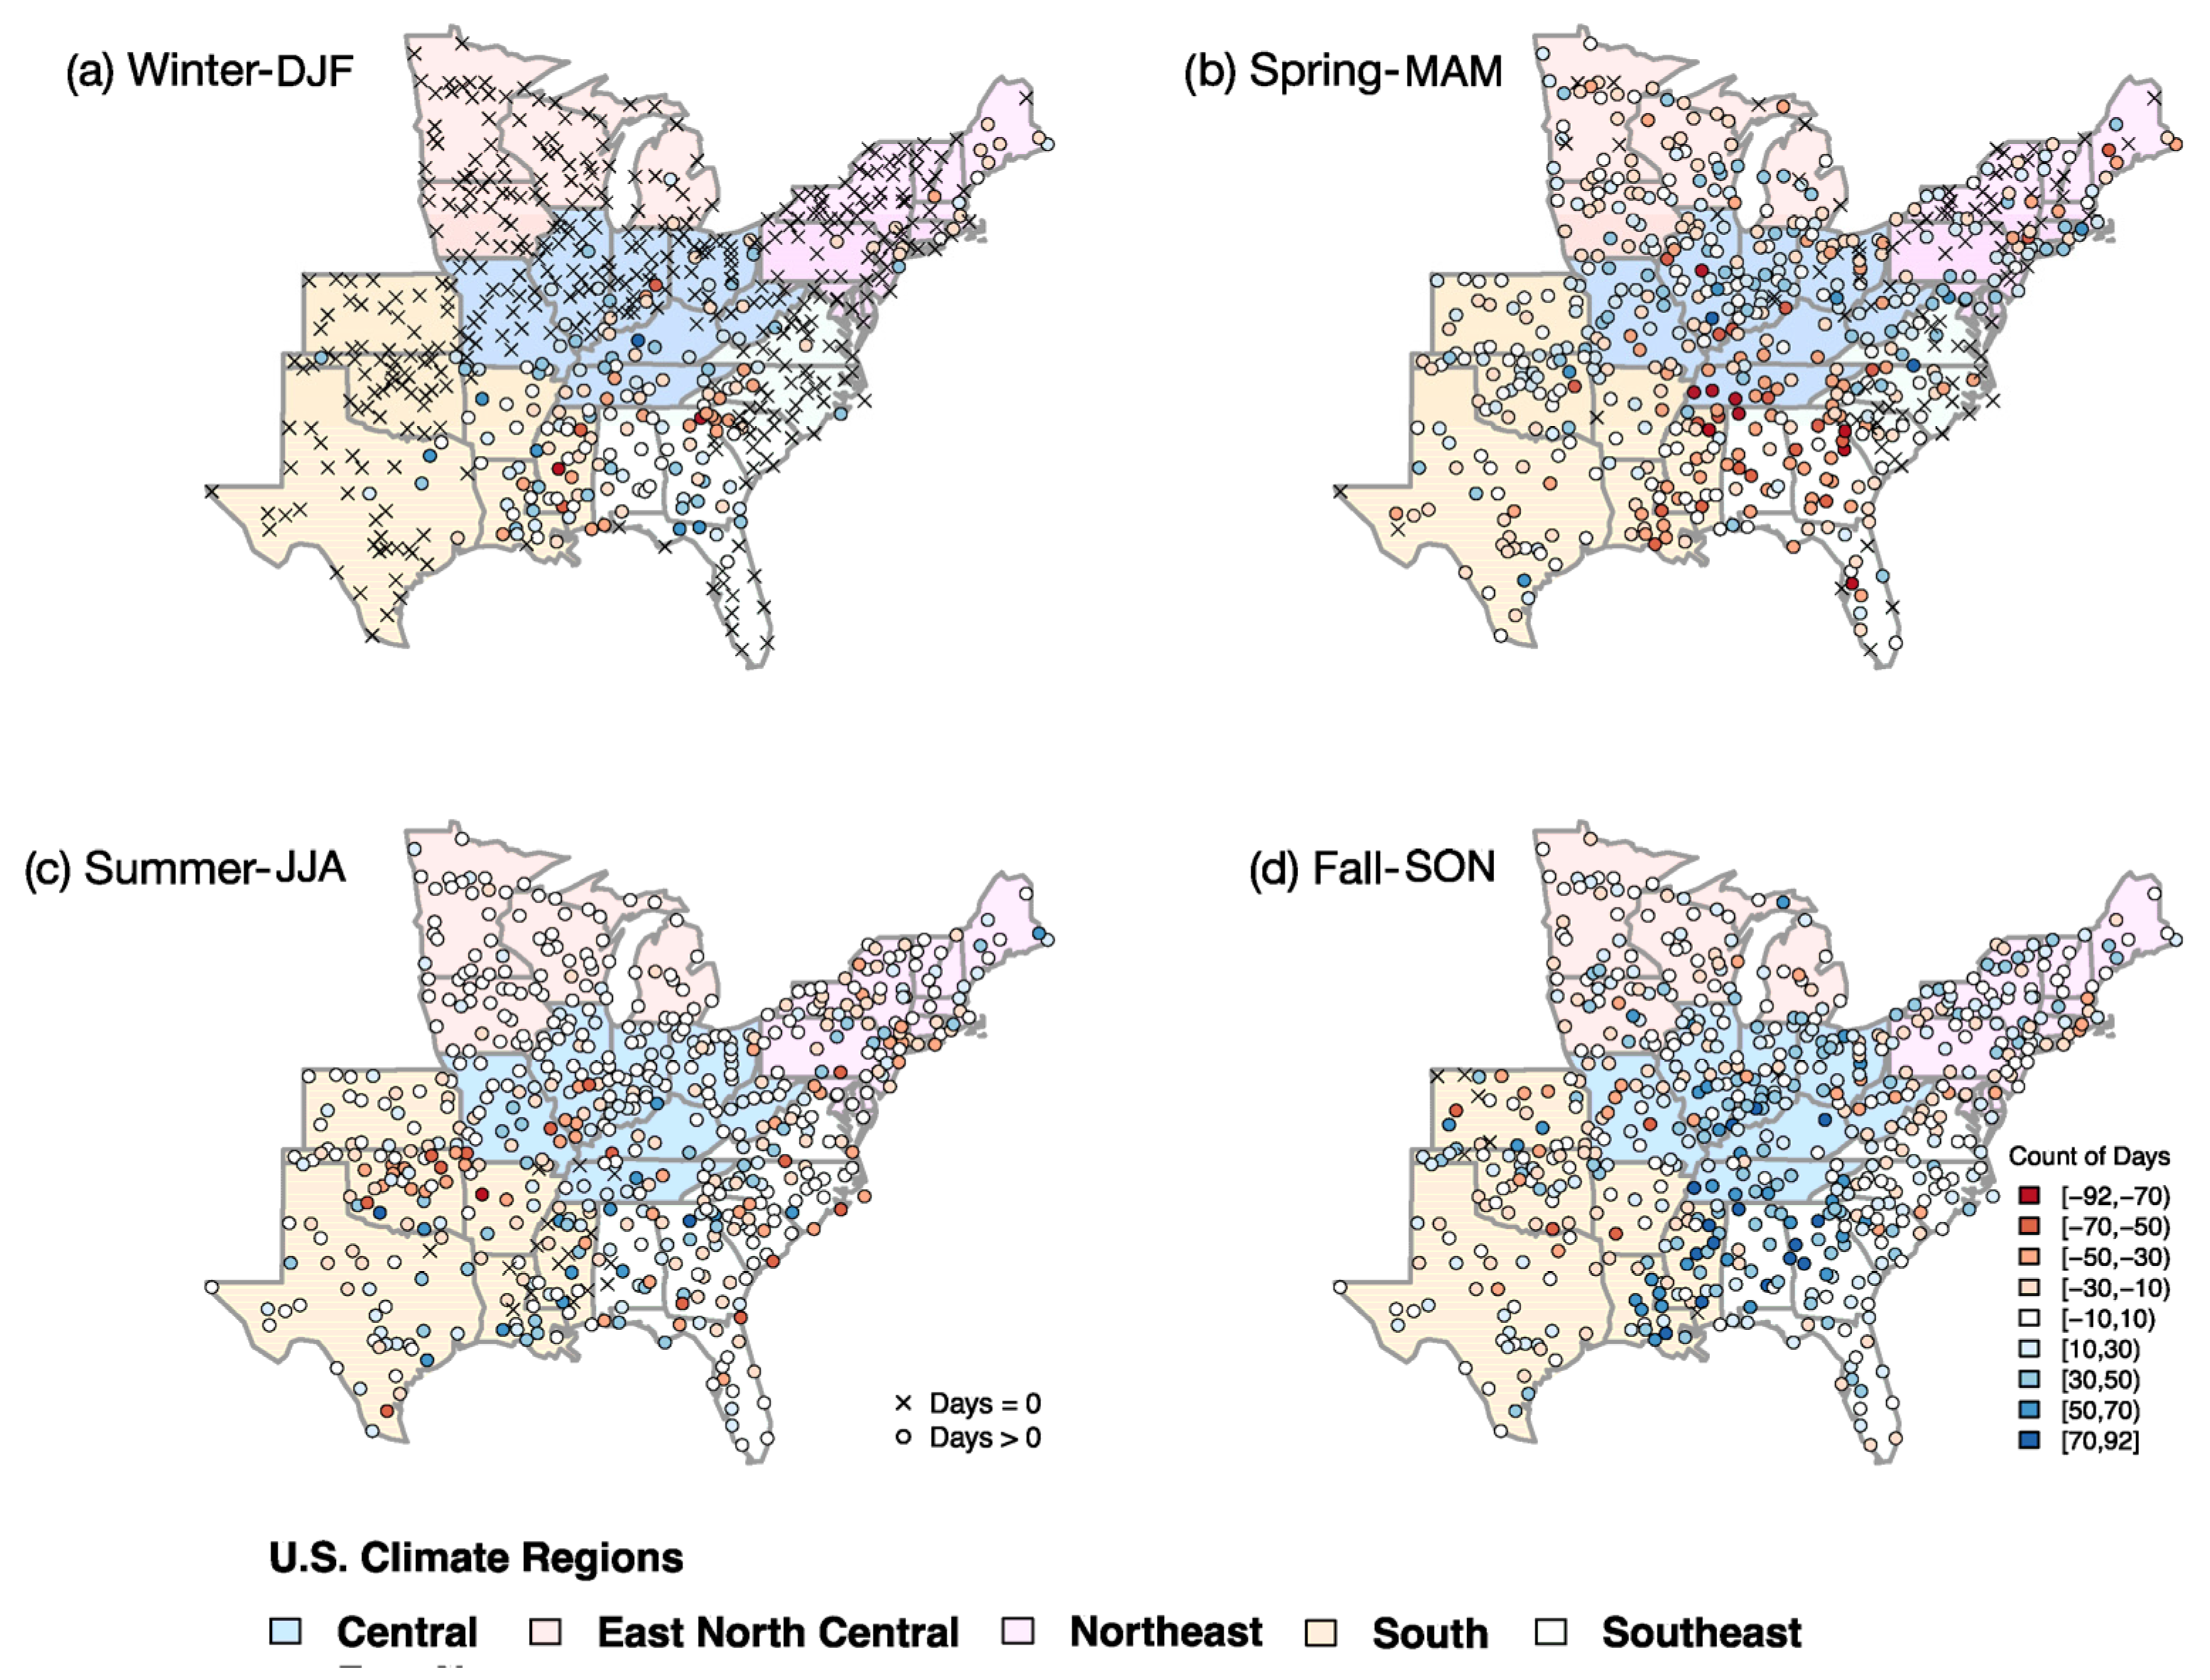
Figure 5 demonstrates the spatial pattern of the significant mode of AMP dates for each season. In winter, there are only 109 (~19%) out of 583 stations having a significant mode for AMP. About 72% of them are located alongside the Gulf coast and up the Mississippi River in the South region and the western half of the Southeast region. While the rest of sites are in the Central and Northeast regions with 20% and 8%, respectively, there is no significant mode for the extreme precipitation during winter in the Northeast–Central region. In spring, the number of sites with significant AMP mode increase to 385 (66%) across the eUS. The Central and South regions included 64% stations with significant mode in spring (26% and 38%, respectively). On the other hand, the Northeast-Central and Southeast regions contain moderate number of stations that has strong seasonality of AMP during spring with a percentage of total stations 15% and 16%, respectively, while the lowest number of locations with AMP timing during spring is ~6% in the Northeast. Both summer and fall represent strong seasonality of extreme precipitation timing as 536 (92%) and 550 (94%) stations across the study area have their significant mode this time. The southern climate region included the highest number of sites in summer (62%) and fall (46%) with non-significant seasonality mode, mainly clustered in the upper Mississippi River region and in the western corner of the high latitude region. As such, these results show the spatio-temporal pattern of AMP timing based on seasonal and regional classification in a local-based analysis.
We examined the strength of AMP seasonality by extracting and counting the number of days/points with a significant mode in a selected season. Figure 6 displays the spatial pattern for the length of modality of extreme precipitation over the four seasons in the eUS. Although the selected threshold of significant mode was 20 days in this study, a threshold of 30 days was used per season to consider it as a strong season for AMP. In winter, the season is as strong as most (73%) of the stations with significant AMP mode (109 stations) in the South and Southeast observed at least 30 days length in which points are exceeded the median values of 1000 resampled data points. In spring, 316 (82%) out of 385 stations with significant mode have strong seasonality of AMP, and 71% of them are included in the Central (28%) and South (43%), respectively. As such, the South is considered to be the region of strongest seasonality where strong modality is detected in 146 (97%) out of 150 stations, and 93% (136) of them observed a significant mode of 30 days or longer. On the other hand, the summer and fall are strong seasons for the AMP timing across the eUS as both seasons have 92% and 95% of total stations with significant mode, and 96% and 92% of the stations of these two groups, respectively, have modality of extreme precipitation with at least 30 days per season. However, the South and Southeast regions recorded the highest number of stations with weak seasonality in AMP dates (number of days is equal to or greater than 20 and less than 30) during summer as they included 91% (20 out of 22 stations). The Central, Northeast-Central, and Southern regions represented 85% (40 out of 47 stations) of weak AMP seasonality in fall. As a result, finding presented here approve the robustness and ability of this work to determine the spatio-temporal patterns of AMP seasonality and detect the strength of extreme precipitation seasonality.

3.2. Non-Stationarity in Seasonality of Extreme Precipitation

Temporal change in the seasonality of extreme precipitation was evaluated by dividing the extreme precipitation time series into two blocks of equal length (n = 35); old period (1950–1984) and recent period (1985–2019). The initial test of nonstationarity in seasonality is examined by calculating the regional percentage of monthly count of AMP dates across all the stations. Figure S2 displays the changes in the distribution of AMP dates between the old and the recent periods. Clear signals of shifting in AMP timing in summer in the old period toward fall in the recent period over the study area. However, this approach emphasis the limitations of such method [3] to detect and quantify the shift in extreme precipitation seasonality. Thus, to determine the temporal changes in seasonality of maxima timing for each station, we calculated the differences in circular statistics and density of AMP for each station (details in the next sections).

3.2.1. Temporal Change in Seasonality of Extreme Precipitation

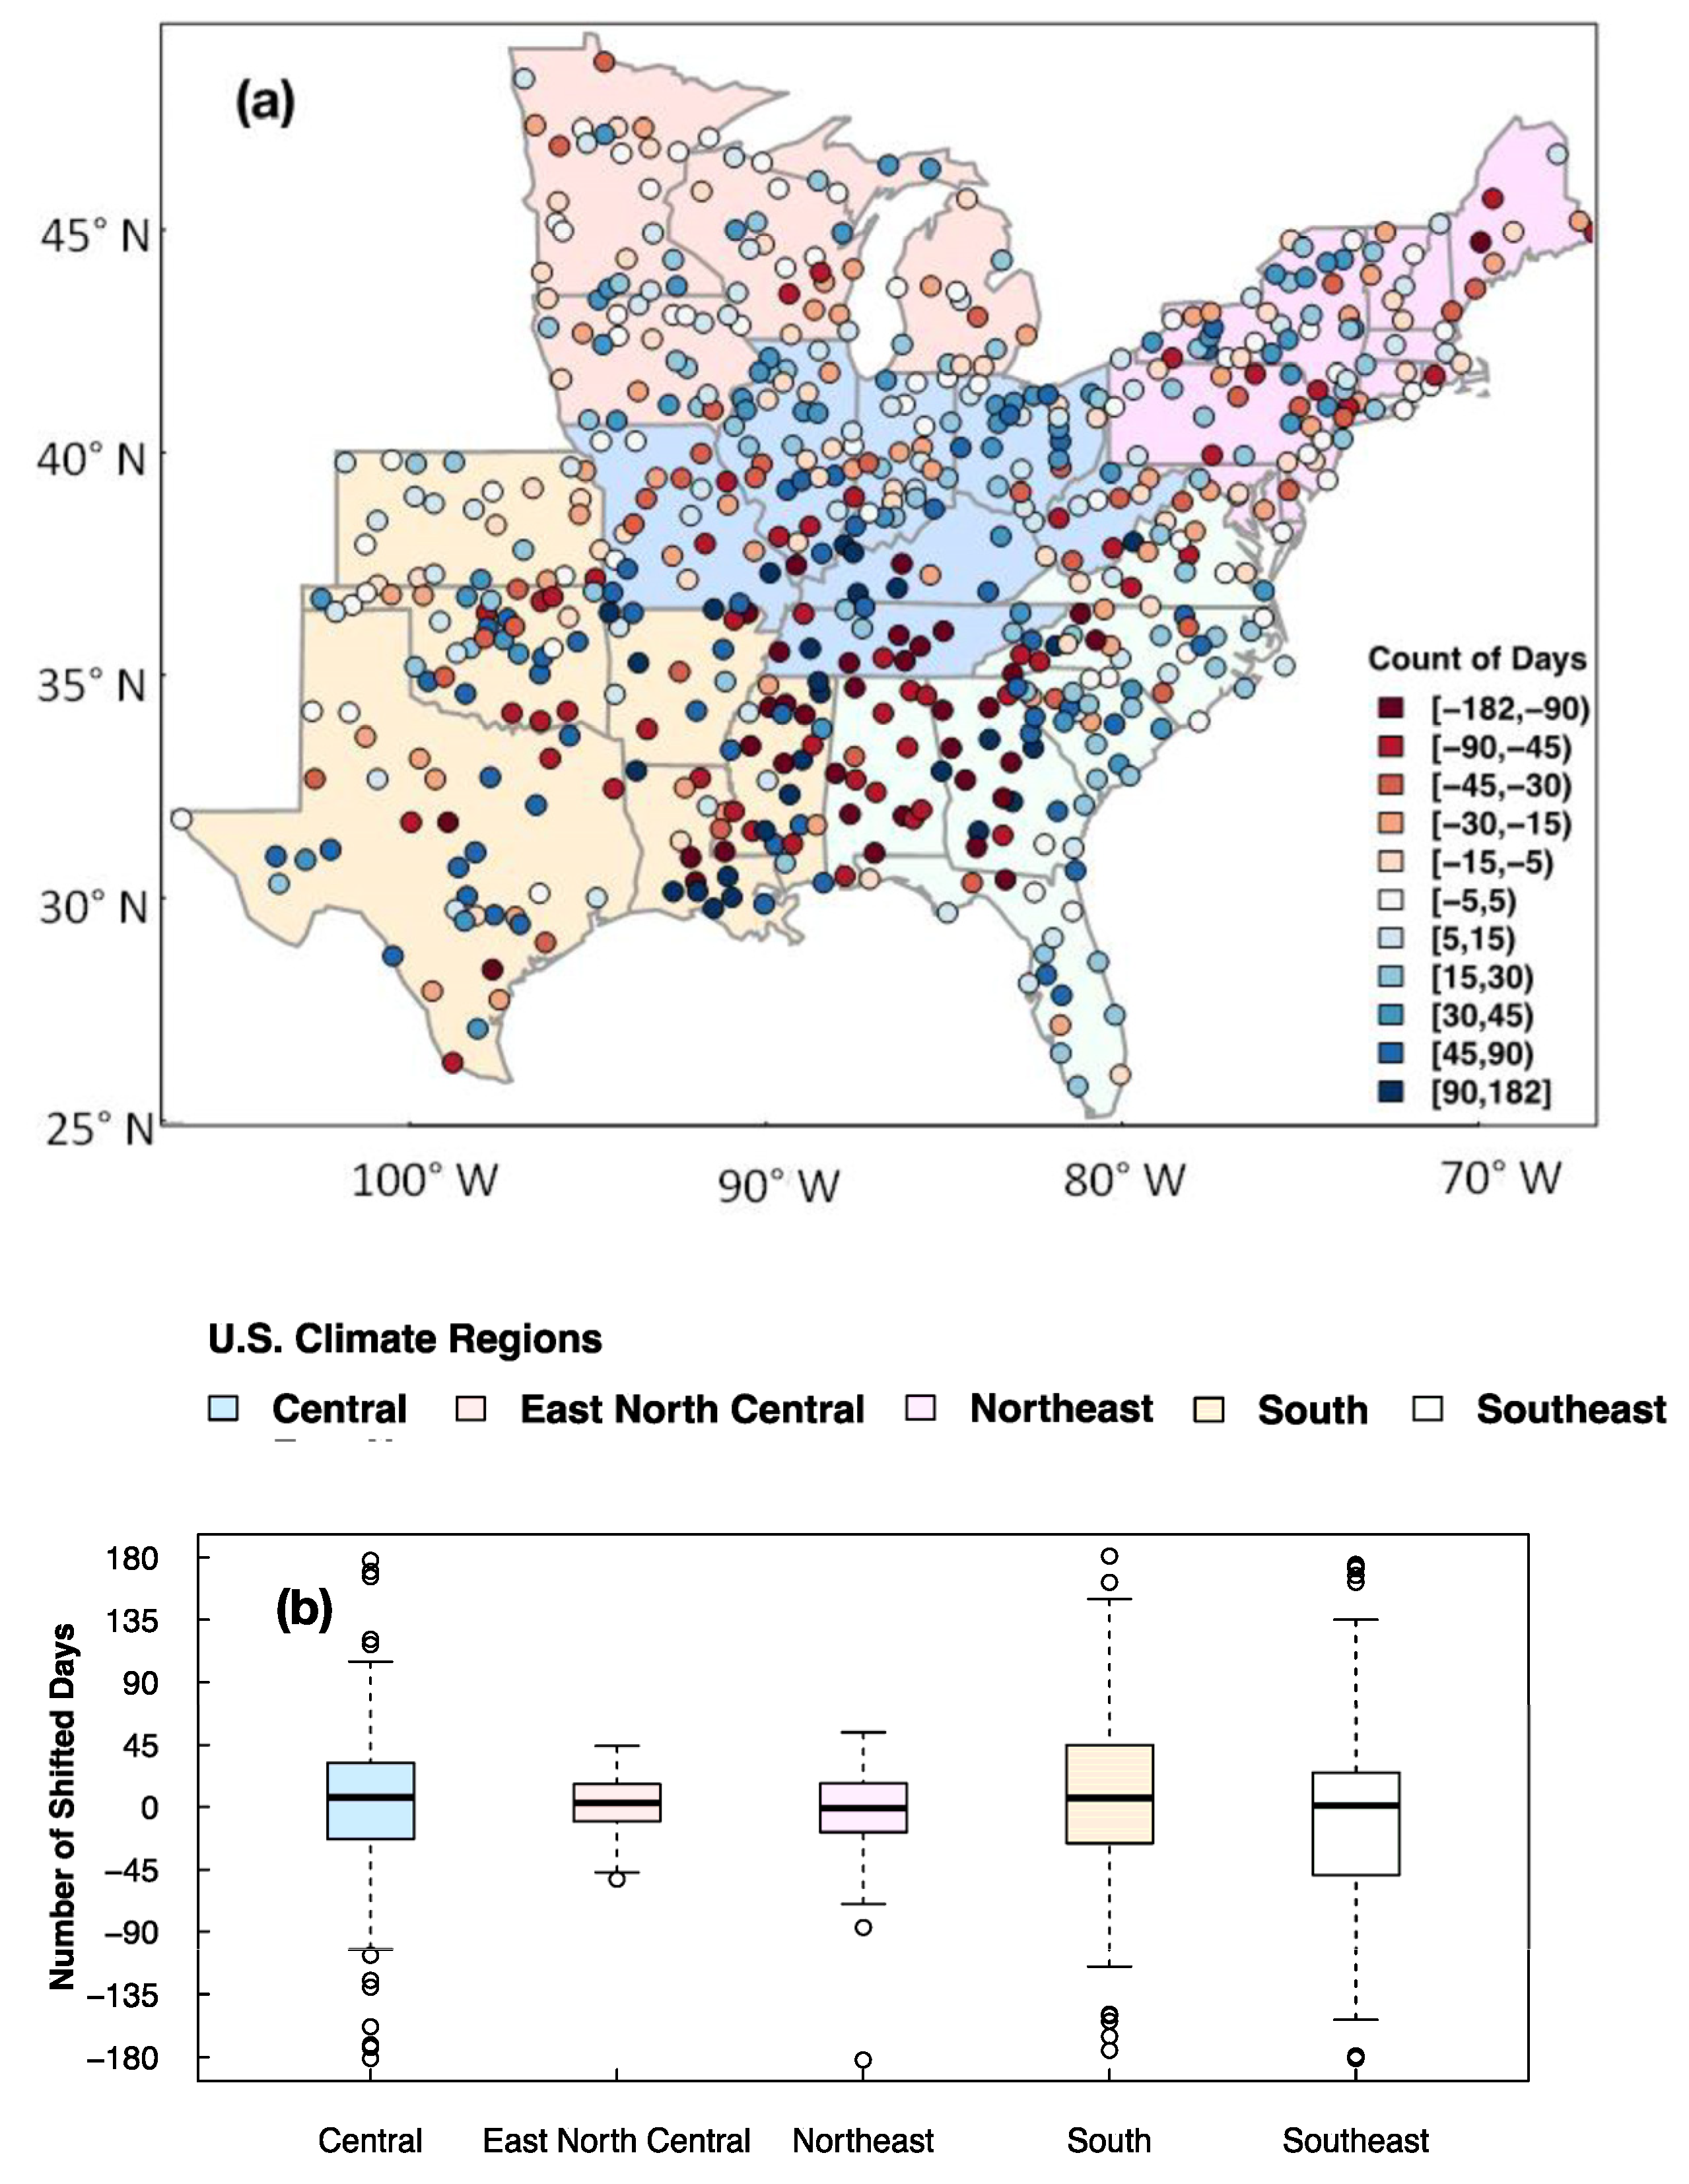
Temporal change in the seasonality of extreme precipitation was evaluated by extracting the difference in circular median between the old and recent periods. Spatial patterns of differences in the median date of occurrence (∆med) are presented in Figure 7. The historical difference in the median day of the year for AMP (∆med) shows mixed spatial pattern with stations showing negative and positive values spread throughout most of the regions (Figure 7a), negative values indicate median AMP date shifting earlier (represented by red filled circles in Figure 7b), and positive values indicate median AMP date shifting later (represented by blue filled circles in Figure 7b) for the recent period. It is observed that for 274 (303) stations, the median AMP date has shifted earlier (later) for the recent period. In case of at least 15-day shift in the median date of AMP between the two periods, there are a total of 394 out of 583 (~68%) exceeding the limit of shift, and 75% of these stations are located within the Central, South, and Southeast climate regions. Pockets of stations showing significant earlier shifts (30–182 days) in median AMP dates are concentrated in the Central, Southeast, and Southern regions; with 21%, 25%, and 32.5% of the stations having at least a 30-day early shift in the recent period. On the other hand, stations with significant later shifts in median AMP dates are distributed in 29%, 33%, and 21% of the sites in the Central, South, and Southeast regions, respectively. They are concentrated in the northern area of the Central region, along the coastal line of the Southeast region, and in the South, there are several clusters in the gulf area, and western part, and high latitude area. Based on the regional boxplot (Figure 7b), we did not observe notable differences in the median AMP dates between two periods in the Eastern, Northern–Central, and Northeast regions. A slight early (later) shift in median AMP date was observed in Central (South) regions for the recent period while a marked earlier shift (40–80 days) was observed in Southeast region (Figure 7b). As such, defining the shift in AMP timing is critical to make the decision of floods management and mitigation [1].

3.2.2. Changes in Modality and Strength of Seasonality of AMP Timing

To examine the potential shifts in modality and strength of seasonality for AMP, we applied the Kernel circular density at each station for the old and recent periods separately. To assess the significance of the density estimates, the bootstrap technique was used as explained in Section 2.2.2. We have identified four different cases of changes in seasonal modes for AMP dates: (i) weakening of seasonality as the mode changed from significant in the old period to insignificant in the recent period; (ii) strengthening of seasonality as the mode changed from insignificant in the old period to significant in the recent period; (iii) strong seasonality for both the old and recent periods; (iv) uniform or no-preferred season(s) in both periods. To spatially visualize the stations showing the changes in seasonal modes for AMP dates, we extracted the significant and unique mode per season (with no overlapping density estimates) in every period for each station (Figure 8). A station showing unique seasonal mode for the old period represents the case where the seasonal mode has weakened over time. Similarly, a station showing unique seasonal mode for the recent period represents the case where the seasonal mode has strengthened over time. As a result, both cases indicate a nonstationarity in the seasonality of AMP timing. However, the two other cases refer to no change over time in the season of extreme precipitation dates. Figure 8 displays the spatial pattern of stations with shift/non-shift over time in the unique seasonal mode for winter, spring, summer, and fall.
For winter the total number of stations with shift in their mode is 92 (~16% of total stations) stations. They are equally divided between the two categories of weakened and strengthened seasonality. Most of the stations with weakened seasonality are clustered in the Southeastern (40%) and Northeastern (~25%) regions, while stations with strengthening seasonality of AMP dates are mostly distributed in the Central (38%), South (30%), and Southeast (26%) regions. On the other hand, the number of stations with no-shift in their unique seasonal mode between the old and recent periods is 491 out of 583 sites. There is approximately 70% out of the total stations with uniform distribution that expanded across the study region, while 14% of the stations have a strong season of AMP in both the old and recent periods which are concentrated in the upper Mississippi areas of Southeast, South, and Central regions. In spring, the total number of sites with weakened seasonality of AMP timing is 98, mostly grouped in the Southeast, Central, and Northeast-Central regions with approximately 31%, 24%, 20% of the total stations, respectively. While the total number of stations with strengthened seasonality in the recent period increased to 118 sites, about 83% of them are almost evenly distributed across the Central, Northeast-Central, and Northeast regions. On the other hand, a number of stations with no-shift in their modes is 277 with significant season of AMP and 90 sites with uniform distribution. For the stations having unique seasonal mode, about 47% and 24% are in the South and Central regions, respectively. Stations with uniform distribution for the AMP in both periods are distributed with 43% and 32% across the Northeast and Southeast regions, respectively. In summer, there is a significant increase in the number of stations with strong season of AMP dates for both old and recent periods as they represent about 86% of the total number of stations, which are equally separated across the study region. There are only 16 out of 583 stations having no-shift in their insignificant modes of AMP seasonality, and 12 of them are in the Southern region. On the other hand, stations with shift in their modes included 24 (42) stations with weakened (strengthened) seasonality of AMP dates, about 84 (86) % of them are distributed over the South and Southeast regions. Similarly, for fall, the number of stations with strong season of AMP dates for both old and recent periods represent about 80% of the total number of stations, which are equally separated across the study regions. Furthermore, there are 7 stations with uniform distribution in both periods and six of them are in the South region. On the other hand, there are 23 stations with weakened seasonality of extreme precipitation timing and almost half of them are concentrated in the Central region. While stations with strengthened seasonality increased by approximately 400% (number of stations is 88), ~85% of them are within the Central (32%), South (32%), and Southeast (21%) regions.
To examine the changes in the strength of seasonality of AMP dates, we extracted the points/days with a unique seasonal mode for each sub-period and calculated the difference in the number of days between the old and recent periods at each location. The results in Figure 9 are determined by subtracting the number of significant points per season in the old period from the recent period. The positive values refer to strengthening the seasonality of AMP as there is an increase in the number of significant days per season in the recent period, while negative values imply that AMP seasonality has recently weakened due to the decrease in the significant days per season. We considered a shift in the number of significant days between the two periods when the subtraction product exceeds 10 days. Figure 9 shows the spatial pattern of the difference in the number of significant days between the old and recent periods. In winter, the locations with no change in the strength of AMP seasonality represent ~70% (406 out of 583) of total locations, which are almost evenly distributed across the study region. On the other hand, stations with changes in strength of AMP seasonality are divided into two groups of strengthened and weakened AMP seasonality in the recent period. The group of weakened AMP seasonality has 85 (~15% of total stations) sites spread over the regions of Central, South, and Southeast, with two pronounced clusters in the gulf coast in the South, and the western high latitude areas from the Southeast region. Meanwhile, the other group of weakened AMP seasonality contain 92 (15% of total stations) stations that are distributed across the Central, Northeast, South, and Southeast regions, with a noticeable concentration in the states of Florida and Georgia within the Southeast region. In spring, the number of stations with no change in the strength of AMP seasonality is 179 (~31% of total stations) stations of which half are included in the South and Southeast regions. Locations with strengthened seasonality represent about 28% (161 stations) of all studied locations, and they are more favored in the regions of Northeast, East North Central, and Central than in the South and Southeast. Stations with weakened seasonality represent about 42% (243 stations) of total studied stations, and about 75% of them are included in the Central, South, and Southeast regions. It is worth noting that a discernible pattern of stations with weakened seasonality appears in a cluster of stations in the Gulf Coast area and upper Mississippi areas in the South region, and most of the locations in the Southeast region. Moreover, more than half of stations in the South observed a weakened seasonality for the recent period. In summer, the scenario of no change in the AMP seasonality is about 50% (287) of total stations in the study area, and about 70% of them are distributed over the Central, Northeast- Central, and Northeast. Additionally, the Northeast-Central is considered the strongest seasonality region with AMP during summer for the old and recent periods as almost 90% of the stations have significant seasonal mode in both periods. On the other hand, there are 138 stations observing strengthened AMP seasonality in the recent period with about 80% of them distributed in the Central, South, and Southeast regions. The number of stations with weakened AMP seasonality is 158 that are located everywhere in the study region except the Northeast-Central. In fall, the number of stations with no change in the strength of seasonality of AMP dates include 180 stations that are distributed over the study region. There is an increase of 165% in the number of stations (266) with strengthened seasonality, and around 75% of them are concentrated in the Central, South, and Southeast regions. Consequently, the number of stations with weakened seasonality of AMP decreased by more than 175% with 137 stations that are spatially spread over the study region with a majority concentrated in Southeast. Lastly, the results presented here showed the ability of the probabilistic approach to identify the non-stationarity in the seasonality of AMP timing and changes in the strength of seasonality.

4. Summary and Conclusions

Characterization of the seasonality of extreme precipitation and its temporal changes is rarely dealt with by the published literature [1,22]. Additionally, there is lack of study evaluating the seasonality (date of extreme precipitation) to properly reflect the extreme precipitation timing multimodality. In this study, we used a fresh statistical framework based on a circular approach to examine the seasonality in dates of annual daily maximum precipitation (AMP) and their temporal changes over the period 1950–2019 for 583 stations across the eastern United States. Key findings from this study are summarized as follows:
  • Assessment of seasonality in terms of circular median (representing median calendar date of AMP) shows mixed seasonality pattern across the eastern USA. All climate regions within the eastern U. S. display distinct pattern of circular median for the AMP dates with majority of stations experiencing their maxima mostly during summer and fall seasons.
  • Using the nonparametric circular density approach, we identified four different groups of seasonal modes for AMP timing in the eastern USA; (i) Group 1, when the significant PDF mode of AMP dates stalled over only one season in the year, (ii) Group 2, when there are two separate significant modes occurring over two different seasons, (iii) Group 3, same as previous group but with three modes distributed over three seasons, (iv) Group 4, four modes over four different seasons. Around 90% of the study sites have two or three different seasons of AMP (fall under Group 2 or Group 3). Most of Group 2 sites are in the Northeast while sites with three AMP seasons (Group 3) spread across the Central, East North Central, and South regions.
  • An assessment of nonstationary in modality and strength of seasonality for AMP dates between two historical records of equal length (1950–1984 and 1985–2019) revealed four different cases of changes in seasonal modes for AMP dates: (i) weakening of seasonality as the mode changed from significant in the old period to insignificant in the recent period, (ii) strengthening of seasonality as the mode changed from insignificant in the old period to significant in the recent period, (iii) strong seasonality for both the old and recent periods, (iv) uniform or no preferred seasonality for both periods. As expected, a great spatial variability (was observed in modality and strength changes for AMP dates for cases (i) and (ii). While a spatial coherence of change across a large area is not visible, a noticeable pattern of weakened seasonality during the recent period was observed in the Gulf Coast area and upper Mississippi areas in the Southern region, and most of the locations in the Southeastern region. On the other hand, majority of sites showed significant modes (strong seasonality) for old and recent periods during both summer and fall seasons (case iii).
Overall, our study builds upon the previous studies by providing a comprehensive assessment of the seasonality of extreme precipitation, the strength of seasonality, and their temporal changes across the eastern USA. Results from our study might be helpful for several sustainable water resource management tasks such as scheduling of seasonality-based stormwater management decisions [1], flood risk mitigation, and prediction of future precipitation seasonality. We have not made any attempt to explore physical mechanisms affecting spatial variations in the influence of global climate events (e.g., atmospheric moisture contents such as tropical cyclones and atmospheric rivers) on extreme precipitation seasonality [23].

Supplementary Materials

The following supporting information can be downloaded at: https://www.mdpi.com/article/10.3390/atmos14020366/s1, Figure S1. Empirical Probability Density Function (EPDF) estimates based on the calendar dates of annual maximum daily precipitation for: (a) Minneapolis, Minnesota, (b) Flemington, New Jersey, (c) Corning, Arkansas. Bandwidth for the kernel density estimates is evaluated using the likelihood cross-validation method. Probability density estimates are assessed for significance based on density estimates using resampled data. A median estimate is obtained from the ensemble of distributions resulting from bootstrap resampling (n = 1000); Figure S2. Distribution of the month of occurrence of annual maxima daily precipitation, in 1950–1984 (white) and 1985–2019 (gray) for the selected sites and regions presented in Figure 1. In all panels, boxplots show the median, interquartile range, and full range.

Author Contributions

Conceptualization, N.D.; methodology, A.A.; software, A.A.; formal analysis, A.A.; investigation, A.A.; writing—original draft preparation, A.A.; writing—review and editing, A.A. and N.D.; supervision, N.D.; funding acquisition, N.D. All authors made contributions to the study and writing of the manuscript. All authors have read and agreed to the published version of the manuscript.

Funding

This research was funded by National Science Foundation (NSF) under award number HBCU-EiR-1901426.

Institutional Review Board Statement

Not applicable.

Informed Consent Statement

Not applicable.

Data Availability Statement

The used data in this study are obtained from the Historical Climatology Network database.

Conflicts of Interest

The authors declare no conflict of interest.

References

  1. Dhakal, N.; Jain, S.; Gray, A.; Dandy, M.; Stancioff, E. Nonstationarity in seasonality of extreme precipitation: A nonparametric circular statistical approach and its application. Water Resour. Res. 2015, 51, 4499–4515. [Google Scholar] [CrossRef]
  2. Abdullah, N.; Jain, S. Multi-index summer flow regime characterization to inform environmental flow contexts: A New England case study. Ecol. Indic. 2020, 111, 106008. [Google Scholar] [CrossRef]
  3. Mallakpour, I.; Villarini, G. Analysis of changes in the magnitude, frequency, and seasonality of heavy precipitation over the contiguous USA. Theor. Appl. Climatol. 2017, 130, 345–363. [Google Scholar] [CrossRef]
  4. Pal, I.; Anderson, B.T.; Salvucci, G.D.; Gianotti, D.J. Shifting seasonality and increasing frequency of precipitation in wet and dry seasons across the US. Geophys. Res. Lett. 2013, 40, 4030–4035. [Google Scholar] [CrossRef]
  5. Pryor, S.C.; Schoof, J.T. Changes in the seasonality of precipitation over the contiguous USA. J. Geophys. Res. Atmos. 2008, 113, D21108. [Google Scholar] [CrossRef]
  6. Dhakal, N.; Tharu, B.; Aljoda, A. Changing seasonality of daily and monthly precipitation extremes for the contiguous USA and possible connections with large-scale climate patterns. Int. J. Climatol. 2023. [Google Scholar] [CrossRef]
  7. Hirschboeck, K.K. Climate and floods. Natl. Water Summ. 1988, 89, 67–88. [Google Scholar]
  8. Easterling, D.R.; Peterson, T.C.; Karl, T.R. On the development and use of homogenized climate datasets. J. Clim. 1996, 9, 1429–1434. [Google Scholar] [CrossRef]
  9. Jammalamadaka, S.R.; Sengupta, A. Topics in Circular Statistics; World Scientific Publishing Company Incorporated: Singapore, 2001; Volume 5. [Google Scholar]
  10. Mardia, K.V. Statistics of Directional Data; Academic Press: New York, NY, USA, 1972. [Google Scholar]
  11. Bayliss, A.C.; Jones, R.C. Peaks-Over-Threshold Flood Database; Institute of Hydrology: Roorkee, India, 1993. [Google Scholar]
  12. Bloschl, G.; Hall, J.; Parajka, J.; Perdigao, R.A.P.; Merz, B.; Arheimer, B.; Aronica, G.T.; Bilibashi, A.; Bonacci, O.; Borga, M.; et al. Changing climate shifts timing of European floods. Science 2017, 357, 588–590. [Google Scholar] [CrossRef] [PubMed]
  13. Burn, D.H. Catchment similarity for regional flood frequency analysis using seasonality measures. J. Hydrol. 1997, 202, 212–230. [Google Scholar] [CrossRef]
  14. Dhakal, N.; Palmer, R.N. Changing River flood timing in the Northeastern and Upper Midwest United States: Weakening of seasonality over time? Water 2020, 12, 1951. [Google Scholar] [CrossRef]
  15. Gu, X.; Zhang, Q.; Singh, V.P.; Shi, P. Nonstationarity in timing of extreme precipitation across China and impact of tropical cyclones. Glob. Planet. Chang. 2017, 149, 153–165. [Google Scholar] [CrossRef]
  16. Parajka, J.; Kohnová, S.; Merz, R.; Szolgay, J.; Hlavčová, K.; Blöschl, G. Comparative analysis of the seasonality of hydrological characteristics in Slovakia and Austria. Hydrol. Sci. J. 2009, 54, 456–473. [Google Scholar] [CrossRef]
  17. Parajka, J.; Kohnová, S.; Bálint, G.; Barbuc, M.; Borga, M.; Claps, P.; Blöschl, G. Seasonal characteristics of flood regimes across the Alpine–Carpathian range. J. Hydrol. 2010, 394, 78–89. [Google Scholar] [CrossRef] [PubMed]
  18. Villarini, G. On the seasonality of flooding across the continental United States. Adv. Water Resour. 2016, 87, 80–91. [Google Scholar] [CrossRef]
  19. Ye, S.; Li, H.Y.; Leung, L.R.; Guo, J.; Ran, Q.; Demissie, Y.; Sivapalan, M. Understanding flood seasonality and its temporal shifts within the contiguous United States. J. Hydrometeorol. 2017, 18, 1997–2009. [Google Scholar] [CrossRef]
  20. Oliveira, M.; Crujeiras, R.M.; Rodríguez-Casal, A. Nonparametric circular methods for exploring environmental data. Environ. Ecol. Stat. 2013, 20, 1–17. [Google Scholar] [CrossRef]
  21. Lund, U.; Agostinelli, C.; Agostinelli, M.C. Package ‘Circular’. Repos. CRAN 2017, 775, Version 0.4-95. Available online: https://r-forge.r-project.org/projects/circular/ (accessed on 5 January 2023).
  22. Iliopoulou, T.; Koutsoyiannis, D.; Montanari, A. Characterizing and modeling seasonality in extreme rainfall. Water Resour. Res. 2018, 54, 6242–6258. [Google Scholar] [CrossRef]
  23. Deng, S.; Yang, N.; Li, M.; Cheng, L.; Chen, Z.; Chen, Y.; Chen, T.; Liu, X. Rainfall seasonality changes and its possible teleconnections with global climate events in China. Clim. Dyn. 2019, 53, 3529–3546. [Google Scholar] [CrossRef]
Figure 1. The eastern United States (eUS) with the locations of 583 Historical Climatology Network precipitation stations across the study region. Different colors represent five climatically consistent regions within eUS [Central (Ohio Valley), Northeast–Central (Upper Midwest), Northeast, South, and Southeast] (https://www.ncdc.noaa.gov/monitoring-references/maps/us-climate-regions.php (accessed on 12 December 2022)).
Atmosphere 14 00366 g001
Figure 2. The percentage of station monthly count of annual maximum precipitation (AMP) timing over 70 years (1950–2019).
Atmosphere 14 00366 g002
Figure 3. (a) Spatial patterns of median day of year of annual maximum daily precipitation during the study period of 1950–2019. (b) Regional distribution of median day of year of annual maximum daily.
Atmosphere 14 00366 g003
Figure 4. The number of seasonal significant mode of empirical probability distribution function estimates based on the calendar dates of annual maximum daily precipitation. The season considers as a significant mode when the number of significant days is at least twenty days per season. Probability density estimates are assessed for significance based on density estimates using resampled data. A median estimate is obtained from the ensemble of distributions resulting from bootstrap resampling (N = 1000). Bandwidth for the kernel density estimates is evaluated using the likelihood cross-validation method.
Atmosphere 14 00366 g004
Figure 5. Seasonal significant mode of empirical probability distribution function estimates based on the calendar dates of annual maximum daily precipitation. The season is considered a significant mode when the number of significant days is at least twenty days per season.
Atmosphere 14 00366 g005
Figure 6. The strength of station-by-station seasonal mode. The season is strong when the significant empirical probability distribution function lasts for 92 days. The threshold of the significant mode for the season is 20 days.
Atmosphere 14 00366 g006
Figure 7. (a) Spatial patterns of temporal changes in the median day of year for two 35-year blocks (1950–1984 and 1985–2019) of annual maximum daily precipitation. (b) Regional distribution of shifting in median day of year of annual maximum daily precipitation, boxplots show the median, interquartile range, and full range.
Atmosphere 14 00366 g007
Figure 8. Seasonal distribution (modality) of AMP timing at a local scale based on the calendar dates of two 35-year blocks (1950–1984 and 1985–2019) of annual maximum daily precipitation. The season is considered as a significant mode when the number of significant days is at least twenty days per season.
Atmosphere 14 00366 g008
Figure 9. Temporal change in strength of seasonal modes of AMP for two 35-year blocks (1950–1984 and 1985–2019) of annual maximum daily precipitation.
Atmosphere 14 00366 g009
Disclaimer/Publisher’s Note: The statements, opinions and data contained in all publications are solely those of the individual author(s) and contributor(s) and not of MDPI and/or the editor(s). MDPI and/or the editor(s) disclaim responsibility for any injury to people or property resulting from any ideas, methods, instructions or products referred to in the content.