Article

Spatial Distribution and Trends of Wind Energy at Various Time Scales over the South China Sea

1
College of Ocean and Meteorology, Guangdong Ocean University, Zhanjiang 524088, China
2
South China Sea Institute of Marine Meteorology (SIMM), Guangdong Ocean University, Zhanjiang 524088, China
3
CMA-GDOU Joint Laboratory for Marine Meteorology, Guangdong Ocean University, Zhanjiang 524088, China
4
Key Laboratory of Climate, Resources and Environment in Continental Shelf Sea and Deep Sea of Department of Education of Guangdong Province, Guangdong Ocean University, Zhanjiang 524088, China
5
College of Coastal Agricultural Sciences, Guangdong Ocean University, Zhanjiang 524088, China
*
Author to whom correspondence should be addressed.
Atmosphere 2023, 14(2), 362; https://doi.org/10.3390/atmos14020362
Submission received: 22 December 2022 / Revised: 9 February 2023 / Accepted: 10 February 2023 / Published: 12 February 2023
(This article belongs to the Special Issue Advances in Computational Wind Engineering and Wind Energy)

Abstract

:
In this study, the spatial distribution and trends of wind energy (as measured by wind and wind power density) were investigated from 1979 to 2021 across various time scales over the South China Sea (SCS)by utilizing ERA5 reanalysis data. The results indicate that the SCS possesses abundant wind energy. In addition, due to the fact that the East Asian monsoon dominates the SCS, the wind energy exhibits obvious seasonal changes. It is in winter and autumn that the winter monsoon (i.e., the northeast wind) prevails over the SCS. Here, the wind energy is abundant and reaches its maximum in December. In summer, the summer monsoon (i.e., the southwest wind) prevails over the SCS. Here, the wind energy is abundant over the southwestern SCS. In spring, however, the wind energy is poor. The annual mean wind energy shows a decreasing trend along the northern coast and an increasing trend over the central SCS. The trends of seasonal mean wind energy in winter, spring, and summer demonstrate a similar pattern to the annual mean wind energy. With respect to the intensity of the trends, they are strongest in winter, followed by spring and autumn, and weakest in summer. The trend of wind energy in autumn almost demonstrates the opposite pattern in comparison with the other seasons, i.e., both decreasing and increasing trends over the northern and southern SCS, respectively. The decreasing trend of wind energy along the northern coast of the SCS occurs in February, April, July, September, and November, whereas the increasing trend over the central SCS appears from the period of December to June. The spatial distribution and trends of wind energy over the SCS can help with issuing a more informed recommendation with respect to offshore wind energy planning.

1. Introduction

In recent years, the energy crisis has become a worldwide problem. In addition, the pollution and greenhouse gases that are caused by fossil energy consumption are serious. In order to achieve a carbon peak, as well as to achieve carbon neutrality, the development of renewable energy instead of fossil energy has become an effective measure by which to cope with energy shortages and climate change. Wind energy, as a new and green energy, plays an important role in effectively dealing with the increasing demand for energy, as well engendering further reduction in environmental pollution [1]. Due to the advantages of lower visual and sound impacts, as well as the higher energy potential of offshore wind energy and the imbalanced distribution of onshore wind energy [2], it is necessary to call for more offshore wind farm deployment. Traditional energy is poor, but the coastal areas of China are capable of providing abundant offshore wind energy. In order to meet the huge energy demand for the economically developed coastal areas of China, it is extremely urgently needed to develop offshore wind energy in order to improve the energy structure of the country, as well as to ensure economic development and further improvements in environmental quality [3].
Wind data obtained from observation stations, wind towers, and satellite inversions, as well as radar and reanalysis data are all widely used to evaluate wind energy. Chen et al. [4] evaluated the potential of nearshore wind for the Shenzhen coastal region by using buoy observational data. Wu [5] used the recorded wind data from meteorological stations and found that wind energy was abundant in the coastal islands, but poor on the Chinese mainland. Furthermore, wind energy in winter has been found to be more abundant than that in the summer. The China Meteorological Administration (CMA) implemented the project “Detailed Survey and Evaluation of National Wind Energy” in 2008, which delivered a series of important research results. However, the observation data used in the research of wind energy possess an obvious disadvantage, due to the sparse distribution of meteorological stations (50–200 km), different observation periods, and short time series [6,7]. More specifically, it is difficult to obtain wind data from the sea due to the limitation of natural conditions, as well as due to the fact that meteorological stations are mainly located on land [8,9].
With the development of satellite, radar, and numerical models, the wind data are now more diverse. Certain studies have used satellite data—such as from the QuikSCAT satellite, WindSAT satellite, ASCAT satellite, and the C-bandSAR satellite—in order to investigate the distribution of wind energy in China [10,11,12,13]. Although the satellite data can make up for the lack of data over the sea, the inversion wind obtained from satellite data generally possesses low accuracy, especially near the shore. Moreover, certain studies have used numerical models in order to simulate regional wind energy [14,15,16,17,18,19,20]. Wind data derived from numerical simulations are not only related to the numerical model, but also to the numerical assimilation technology and assimilated data used. Moreover, due to the limitation of computing power, it is difficult to simulate the wind with a high enough resolution and long enough time series. Based on advanced numerical models and the data assimilation system, the reanalysis data that are now being obtained are highly reliable. Jin et al. [21] combined reanalysis data (CFSR) with WMO (World Meteorological Organization) marine observation data and indicated that the reanalysis data possessed high accuracy. Wu et al. [22] evaluated the NCEP-CFSv2, ERA5, and CCMP wind datasets against buoy observations and found that the ERA5 wind slightly outperformed the other wind products. Hong et al. [23] demonstrated that the wind from ERA5 data was in good agreement with airport observations. The reanalysis data possess high quality and are widely used for the evaluation of wind energy [24].
The evaluation of wind energy mainly involves analyzing the regional distribution and changes in the near-surface wind speed and wind power densities [25,26,27,28,29,30,31]. Wang et al. [32] found that China’s offshore wind energy was abundant in Fujian, Zhejiang, and the Guangdong coastal sea area. Moreover, the monsoon in autumn and winter was stronger than in spring and summer, whereby the strongest wind was in December and the weakest wind in May. Wen et al. [33] indicated, by using reanalysis data from 1958 to 2012, that the Luzon Strait and the Taiwan Strait possess a higher wind energy potential than other areas. The change in wind energy was found to be controlled by the near-surface wind. Vautard et al. [34] found that the surface wind speed had declined over almost all continental areas in the northern mid-latitudes [30]. Moreover, Guo et al. [35] suggested, through using 652 instances of observational data, that the annual mean of the near-surface wind in China decreased at an annual rate of 0.018 m·s−1 during 1969–2005. Additionally, the decreasing trends of wind speed were the largest in spring, and the smallest in summer. However, Jiang et al. [36] indicated that the wind speed decreased significantly in winter, followed by spring, and then summer. Moreover, the decreasing trend also varied with region; there were weak increasing trends in the Sichuan Basin and the coastal areas of China, as well as decreasing trends in northwestern China, Inner Mongolia, and northeastern China [37,38,39,40,41]. Zhang et al. [13] suggested that the significant wind speed variability in the South China Sea (SCS) was observed during the El Niño events. In addition, Adekunle et al. [42] showed that strong trends of wind power existed in the Luzon strait in the northern SCS, as well as the Xisha, Zhongsha, Luzon, and Liyue banks in the central SCS. Furthermore, insignificant and negative trends dominated the southern SCS, as indicated by the reanalysis data from 1976 to 2005.
The wind energy over the SCS is rich, and the coastal areas along the SCS are economically developed with a large energy demand. Therefore, it is important to research the spatial distribution and trends of wind energy over the SCS for the planning and construction of offshore wind energy. However, most studies have thus far focused on the spatial–temporal distributions and the trends of wind energy on land [43,44], whereas wind energy over the SCS at various time scales has rarely been investigated. Indeed, it has not been investigated using long time series or high resolution data, thus resulting in the fact that the spatial distribution and trends of wind energy at various time scales are not clear. The purpose of this study is to analyze and reveal the spatial distribution and trends of wind energy (as measured by wind and wind power density) at various time scales over the SCS by using high-resolution ERA5 reanalysis data from 1979 to 2021 for providing a scientific foundation for the development and utilization of wind energy over the SCS. The paper is organized as follows: In Section 2, the data and methods are introduced. The spatial distribution of wind energy over the SCS is presented in Section 3. In Section 4, the change in wind energy is analyzed. Lastly, the conclusion and discussion are given in Section 5.

2. Data and Methods

2.1. Data

The monthly ERA5 reanalysis data are provided by the European Centre for Medium-Range Weather Forecasts (ECMWF), and were produced using the 4D-Var data assimilation in CY41R2 of the ECMWF’s Integrated Forecast System (IFS) [35]. ERA5 reanalysis data are widely used in the assessment of wind energy and possess a good agreement with observed wind [23,24]. The ERA5 reanalysis data from 1979 to 2021 were downloaded with a 0.25° × 0.25° horizontal resolution to examine the spatial distribution and variation of trends in wind energy over the SCS.

2.2. Method

Although 10 m wind has been used to measure wind energy in previous studies [13,34,41], the hub height of wind turbines is generally considered to be between 70 and 100 m for wind energy studies [45]. In this study, a height of 100 m was selected for the purpose of assessing wind energy. The wind and wind power density were taken as the measure of wind energy.

2.2.1. Mean Wind

The mean wind was calculated at various time scales, which included annual, seasonal, and monthly mean winds. The year was divided into four seasons: winter (December–February), spring (March–May), summer (June–August), and autumn (September–November). The mean wind was calculated as follows:
V ¯ = 1 n i = 1 n u i 2 + v i 2
where V ¯ is the mean wind (unit: m·s−1), u i and v i are the zonal and meridional winds at i record, respectively, and n is the sample size of the time series. Regarding the annual mean wind, n is the sample size of the time series from 1979 to 2021. Regarding the seasonal mean wind, n represents the sample size of the time series in the same season from 1979 to 2021. Regarding the monthly mean wind, n is the sample size of the time series in the same month from 1979 to 2021.

2.2.2. Mean Wind Power Density

The mean wind power density was also calculated at various time scales and expressed as follows:
W ¯ = 1 2 ρ 1 n i = 1 n ( u i 2 + v i 2 ) 3
where W ¯ is the mean wind power density (unit: W·m−2), ρ is the air density (which can be taken as a constant of 1.225 kg·m−3 due to small changes), u i and v i are the zonal and meridional winds at i record, respectively, and n is the sample size of the time series. The methods of the annual, seasonal, and monthly mean wind power density were similar to those of the mean wind.

2.2.3. Linear Regression Method

The linear regression method was employed in order to investigate and analyze the variation trends of wind energy at various time scales. The linear regression equation can be written as:
x i = a + b t i ( i = 1 , 2 , , n )
where x i is the dependent variable and represents the wind or wind power density. t i is the independent variable and represents the time at i record. a is the regression constant, and b is the regression coefficient, which represents the estimated linear trends of the mean wind or mean wind power density at various time scales.
The regression constant a and the regression coefficient b were calculated by the least square estimation and can be written as follows:
b = i = 1 n x i t i 1 n ( i = 1 n x i ) ( i = 1 n t i ) i = 1 n t i 2 1 n ( i = 1 n t i ) 2 a = x ¯ b t ¯ , x ¯ = 1 n i = 1 n x i , t ¯ = 1 n i = 1 n t i
where n is the sample size of the time series. The linear variation trend of each grid point over the SCS was calculated by this method. Moreover, the positive and negative values of the regression coefficient b denote increasing and decreasing trends, respectively.

2.2.4. Student’s t-Test

Student’s t-test was used to examine whether the slope of the linear regression line was significant. Compute a t statistic as follows:
t = b S
where b is the regression coefficient, and S is the standard deviation of regression coefficient b. The null assumption (H0) is b = 0 ,   and the alternative assumption (H1) is b ≠ 0. The significance level α is set as 0.05 (i.e., a 95% confidence level) and t = 0.05 = 2.021 depending on the t distribution table. If t t = 0.05 , accept the null assumption (H0). If t > t = 0.05 , accept the alternative assumption (H1).

2.3. Workflow

In order to clarify the spatial distribution and trends of wind energy (as measured by wind and wind power density) at various time scales over the SCS from 1979 to 2021, the ERA5 reanalysis data and statistical methods were used. The flowchart used in order to achieve the steps of this work is displayed in Figure 1. The 100 m wind of a 0.25 × 0.25 horizontal resolution from the ERA5 monthly mean reanalysis data was selected in order to calculate the wind energy, which was produced by using the 4D-Var data assimilation obtained from the CY41R2 of the ECMWF’s Integrated Forecast System (IFS) [35]. Firstly, the wind energy over the SCS was evaluated on three time scales: year, season, and month. These time scales were calculated using the method of the mean wind and the mean wind power density in order to reveal the spatial distribution of wind energy. Secondly, the linear regression associated with Student’s t-test was utilized to investigate the variation in trends of wind energy over the SCS. Finally, the spatial distribution of wind energy over the SCS over the next 5 years was predicted, depending on the trends in wind energy obtained.

3. Spatial Distribution of Wind Energy over the SCS

3.1. Annual Mean Distribution

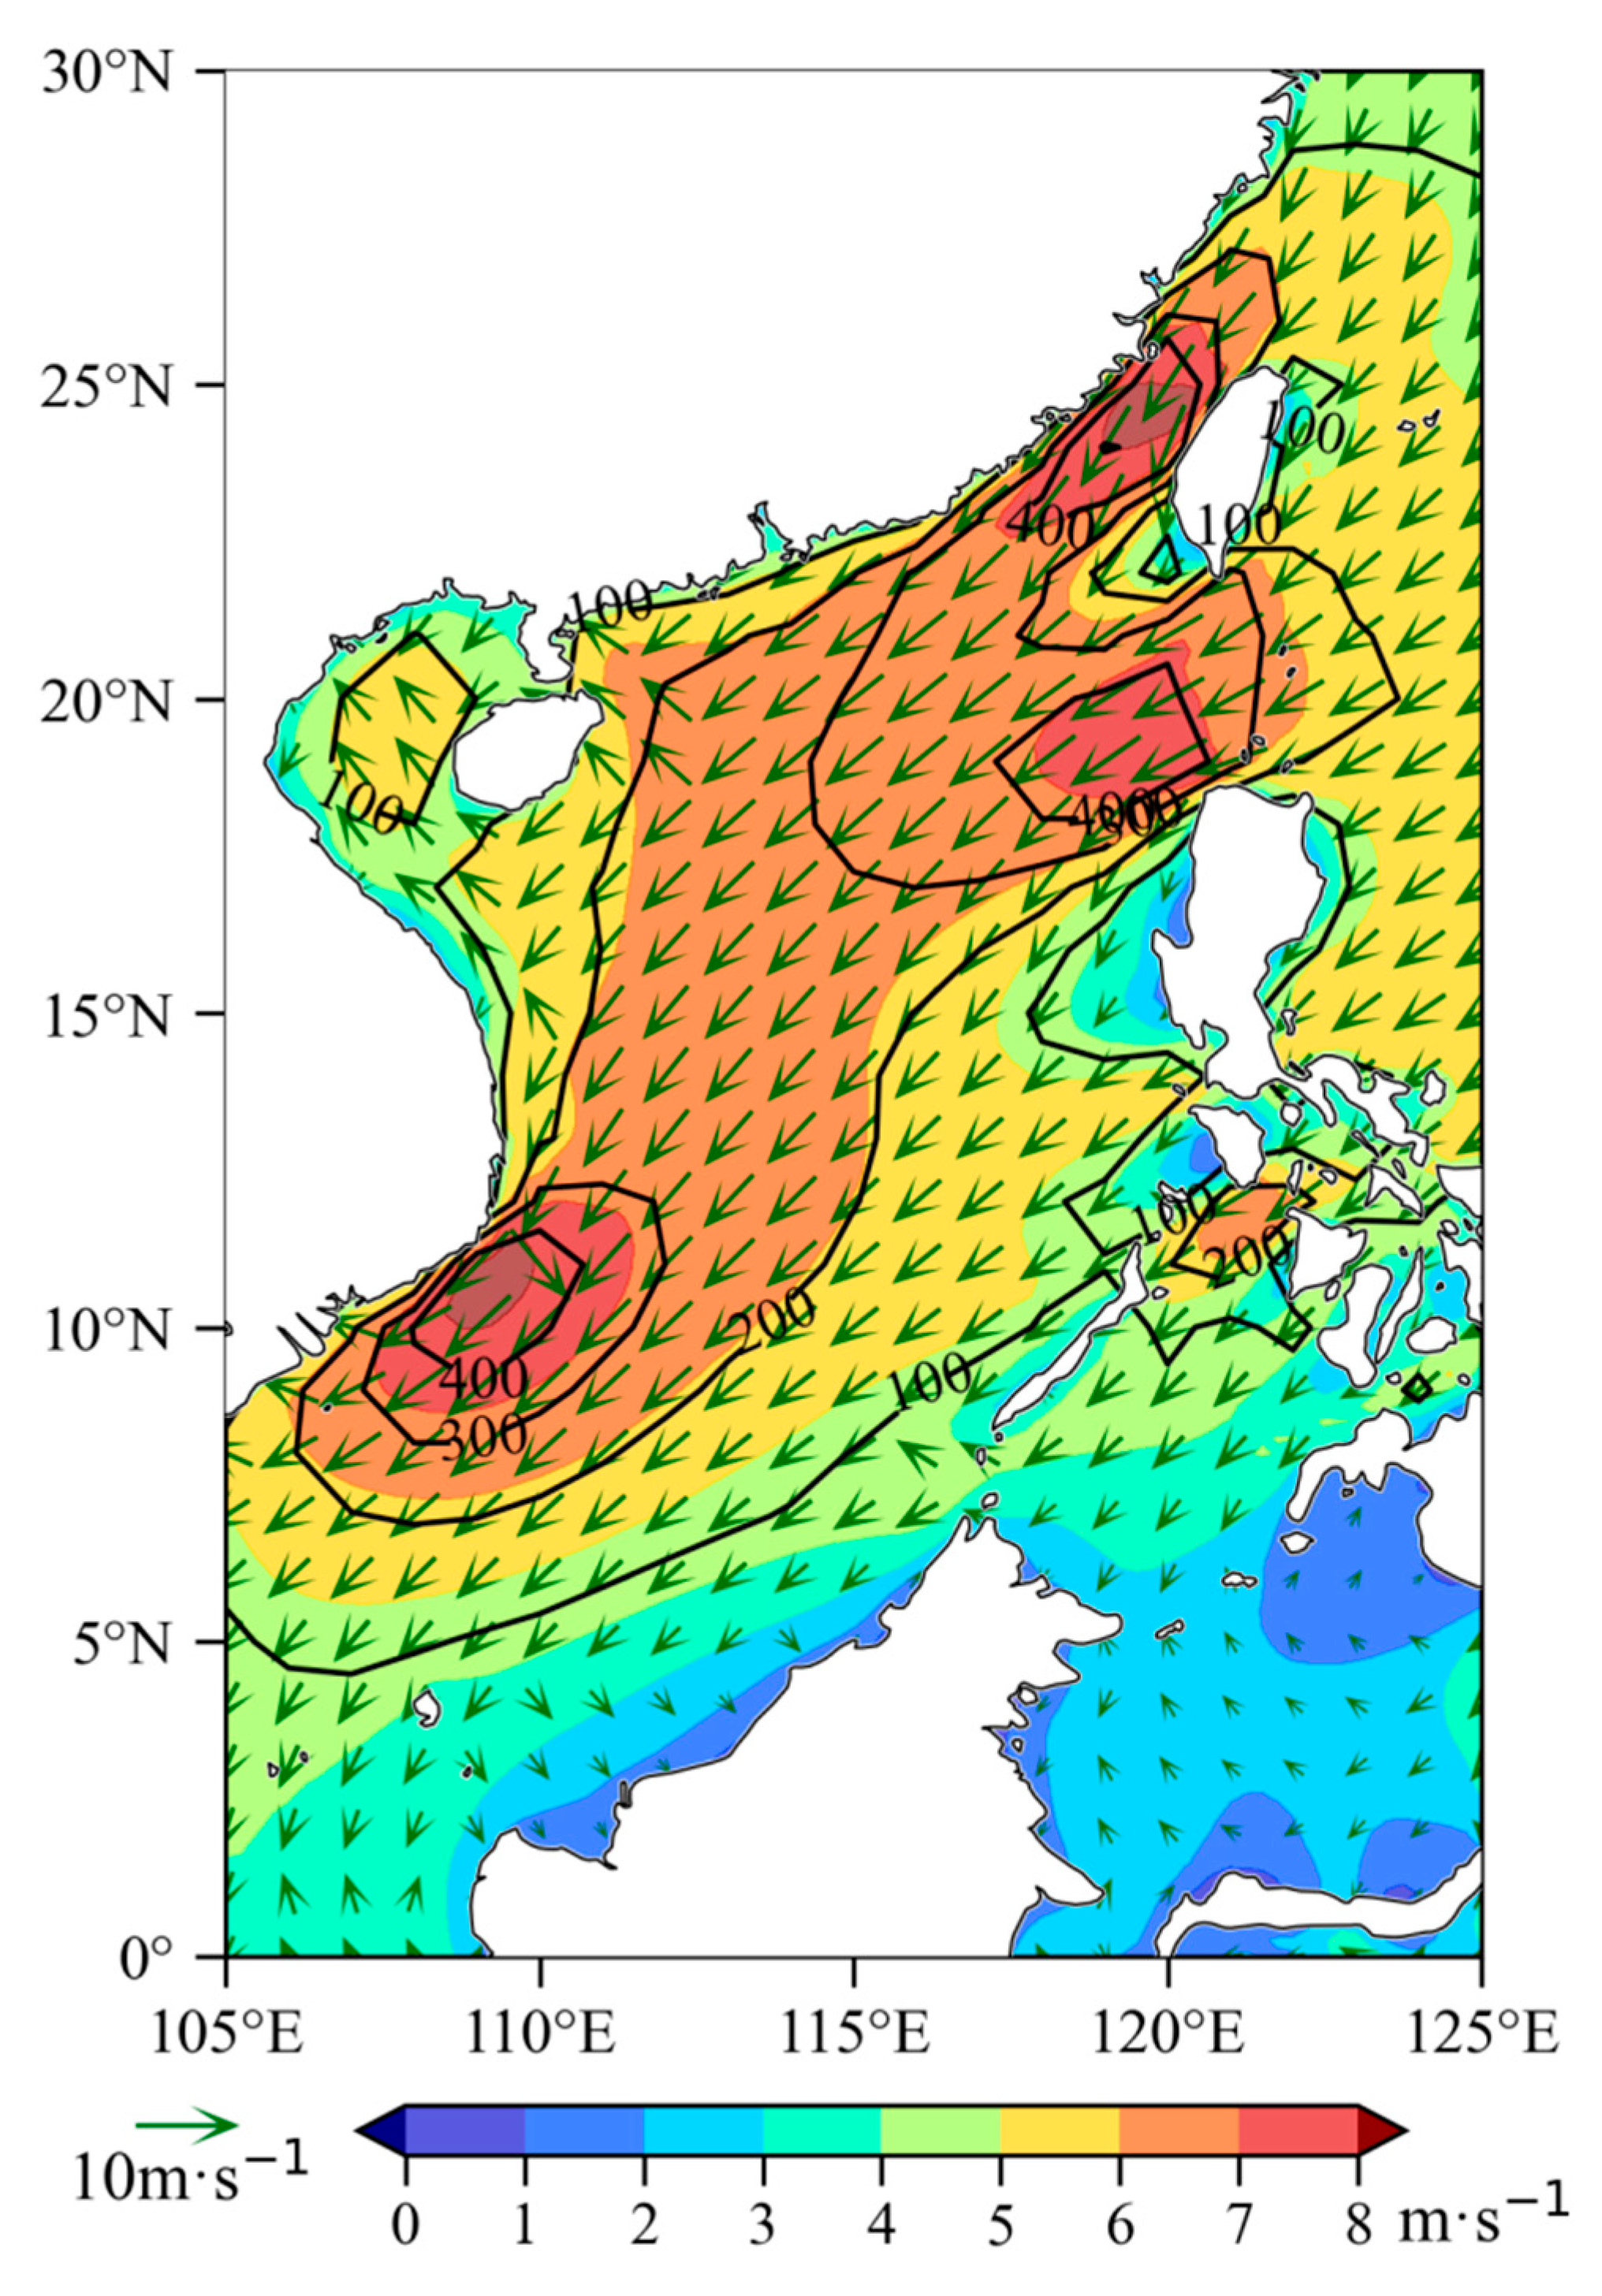
Figure 2 shows the annual mean distribution of the wind and wind power density over the SCS during 1979–2021. The northeast wind controls most areas of the SCS, indicating that the annual mean wind of the SCS is mainly dominated by the winter monsoon (i.e., the northeast wind). The annual mean wind speed ranges between 5 m·s−1 and 8 m·s−1 and is stronger than the surrounding areas. There are three strong centers, located in the Taiwan Strait, the Bashi Channel, and the southwestern SCS, wherein the annual mean wind speed values are more than 7 m·s−1. The annual mean wind power density over the SCS generally exceeds 100 W·m−2. In addition, there are three strong centers that exceed 400 W·m−2, which corresponds to a strong wind speed. The Wind Energy and Solar Energy Resources Evaluation Center of CMA in their “Detailed Survey and Evaluation of National Wind Energy” found that Inner Mongolia and Xinjiang are the provinces in China with the most abundant onshore wind energy, ranging between 100 W·m−2 and 200 W·m−2. The annual mean wind power density over the SCS is generally higher than that over most areas in mainland China. Therefore, the SCS possesses abundant wind energy with a great development potential and utilization value.

3.2. Seasonal Mean Distribution

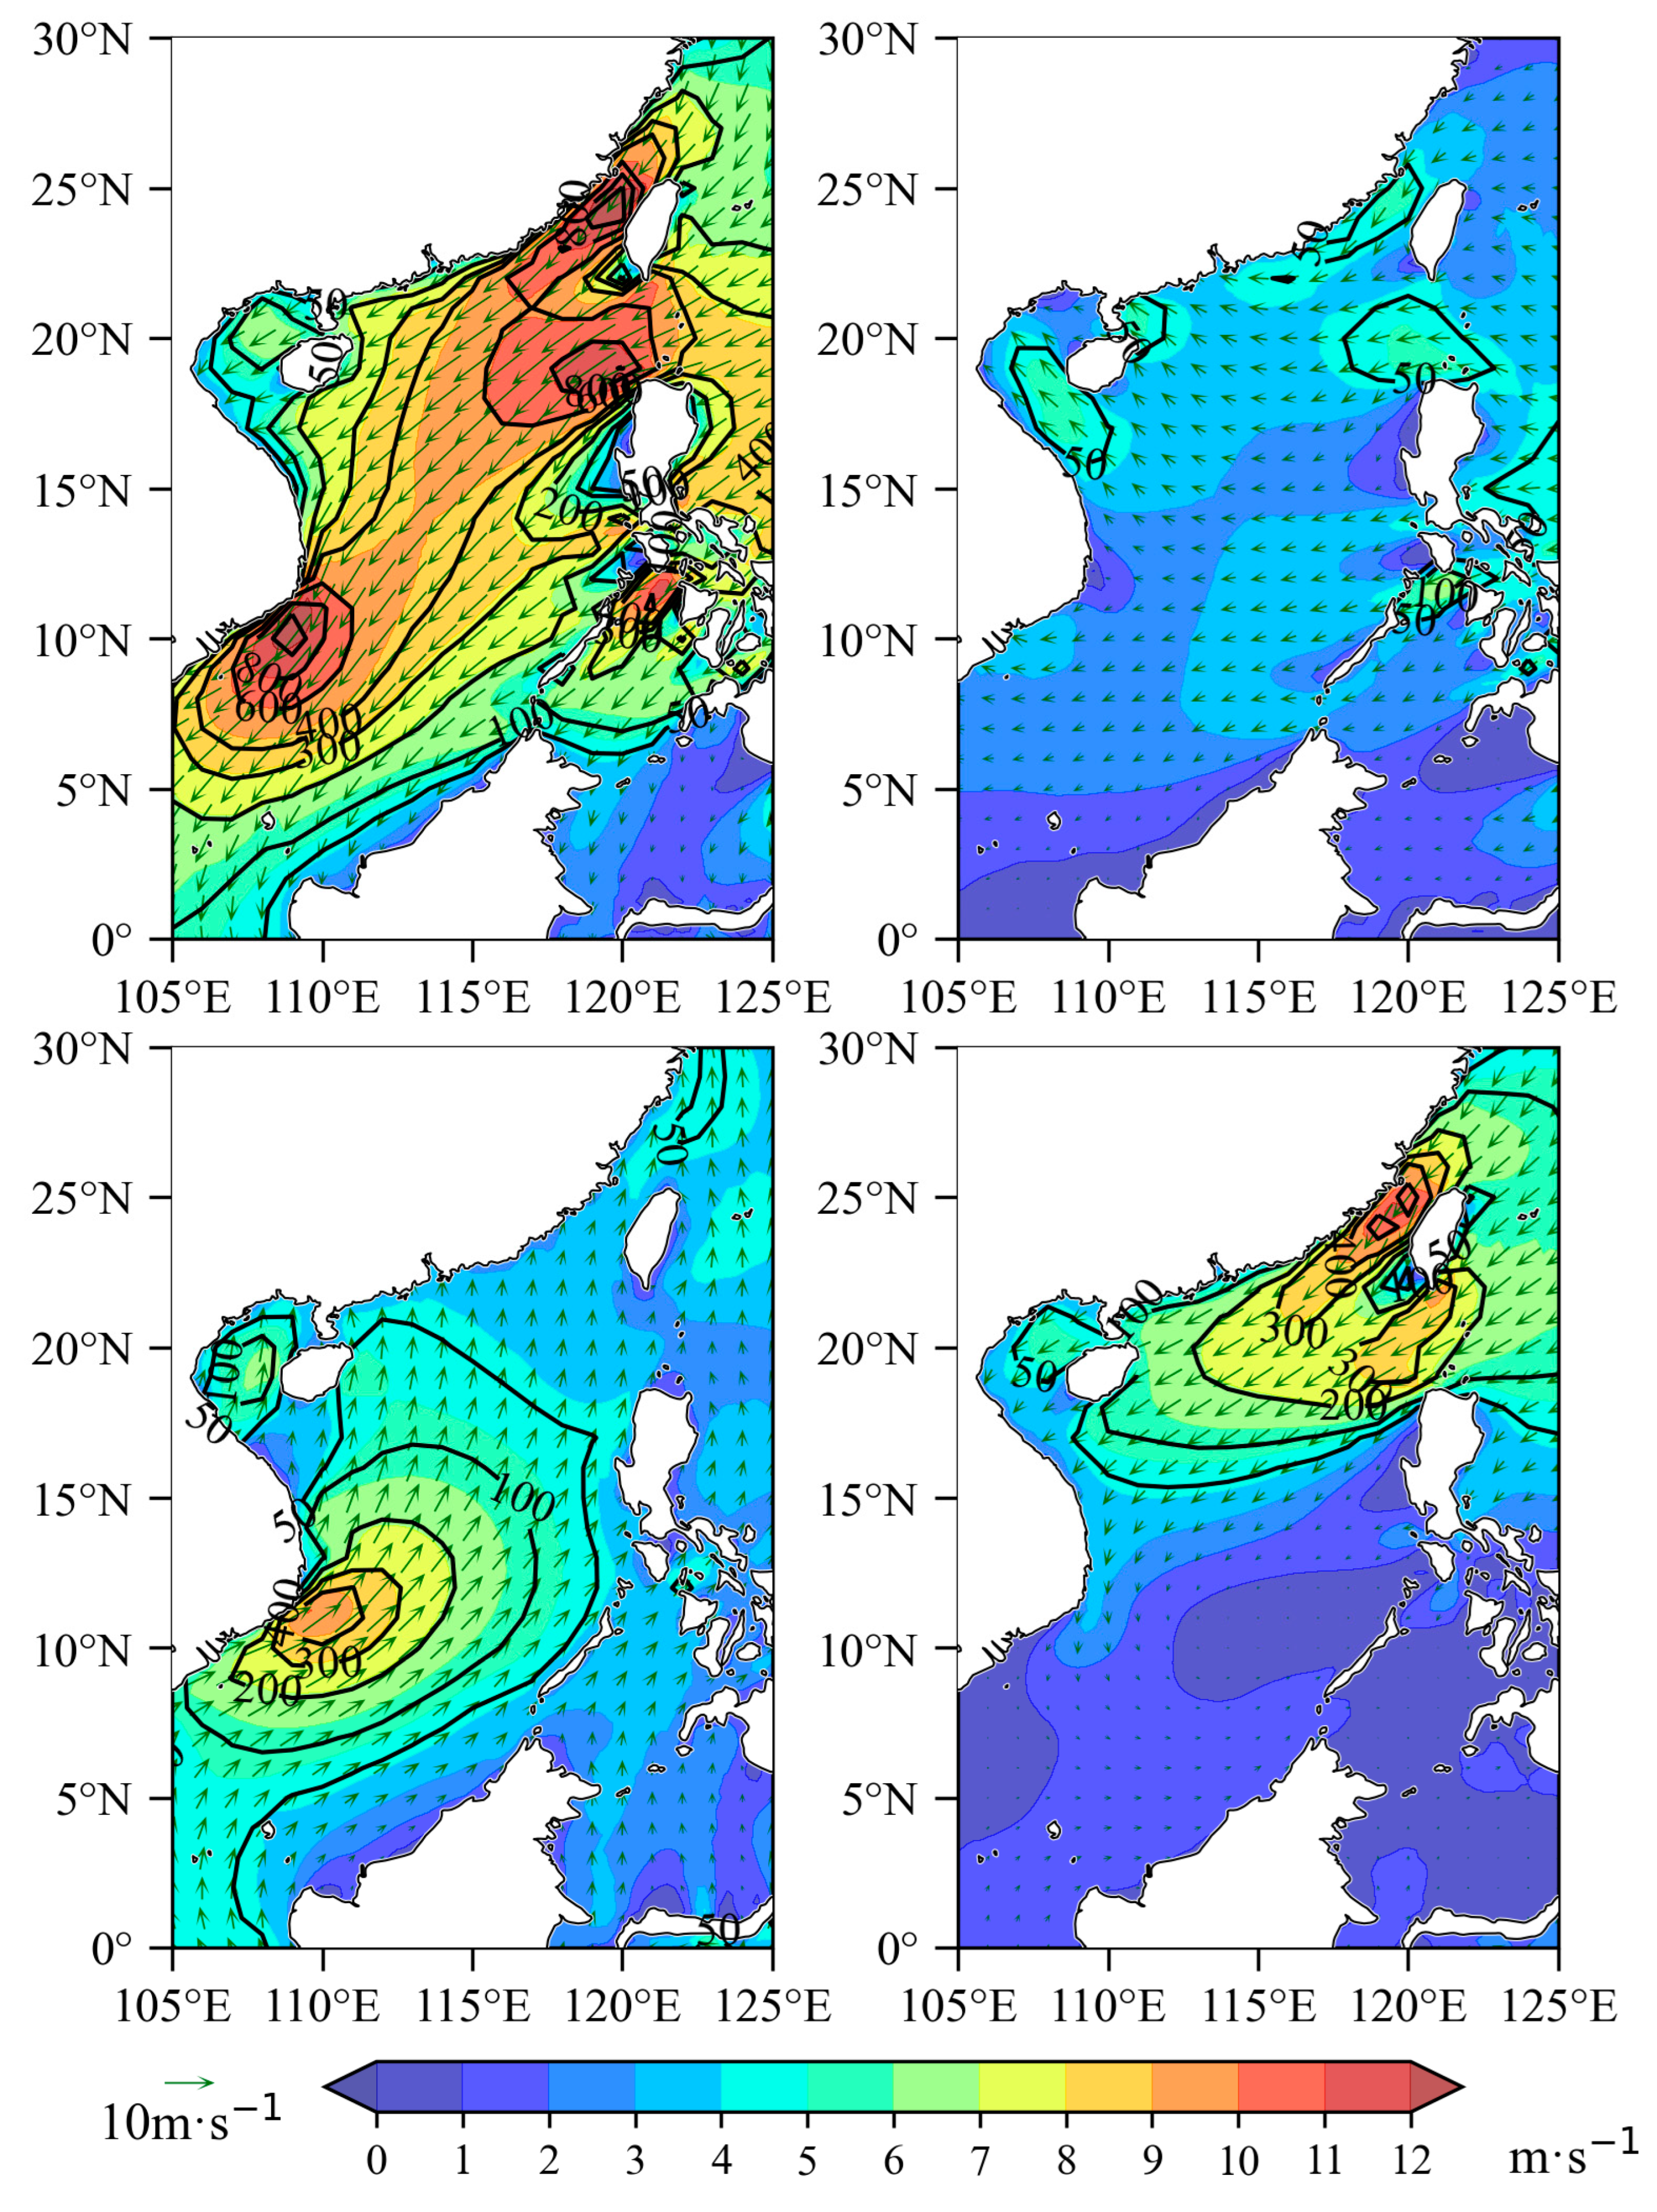
The seasonal mean wind and wind power density over the SCS during 1979–2021 are displayed in Figure 3. In winter (December–February, Figure 3a), the SCS prevails with respect to the northeast wind, which is affected by the winter monsoon. The mean wind speed is generally greater than 7 m·s−1. In addition, the mean wind power density is more than 300 W·m−2 and reaches up to 800 W·m−2 in the Taiwan Strait and the Bashi Channel. These patterns in winter, with respect to the mean wind and wind power density, are similar to that of the annual mean distribution (Figure 2). In spring (March–May, Figure 3b), the east or southeast wind dominate the SCS, but the wind and wind power density are weak, generally less than 6 m·s−1 and 100 W·m−2, respectively. In summer (June–August, Figure 3c), the SCS is dominated by the summer monsoon (i.e., the southwest wind). The wind speed and wind power density are larger over the southwestern SCS, and smaller over the northern SCS. Of particular note is the fact that the wind speed and wind power density are small in the Taiwan Strait, which shows a greater difference in comparison with the other seasons. In autumn (September–November, Figure 3d), the winter monsoon (i.e., the northeast wind) appears over the northern SCS. The wind speed and wind power density over the northern SCS are relatively large, with two strong centers in the Taiwan Strait (more than 10 m·s−1 and 500 W·m−2) and the Bashi Channel (more than 9 m·s−1 and 300 W·m−2). As the SCS lies in the East Asian monsoon belt, the wind and wind power density change seasonally. Furthermore, the autumn and winter are mainly affected by the winter monsoon in the SCS, where the wind energy is abundant. In summer, the SCS is dominated by the summer monsoon, and the wind energy is abundant over the southwestern SCS. In spring, however, the wind energy is low.

3.3. Monthly Mean Distribution

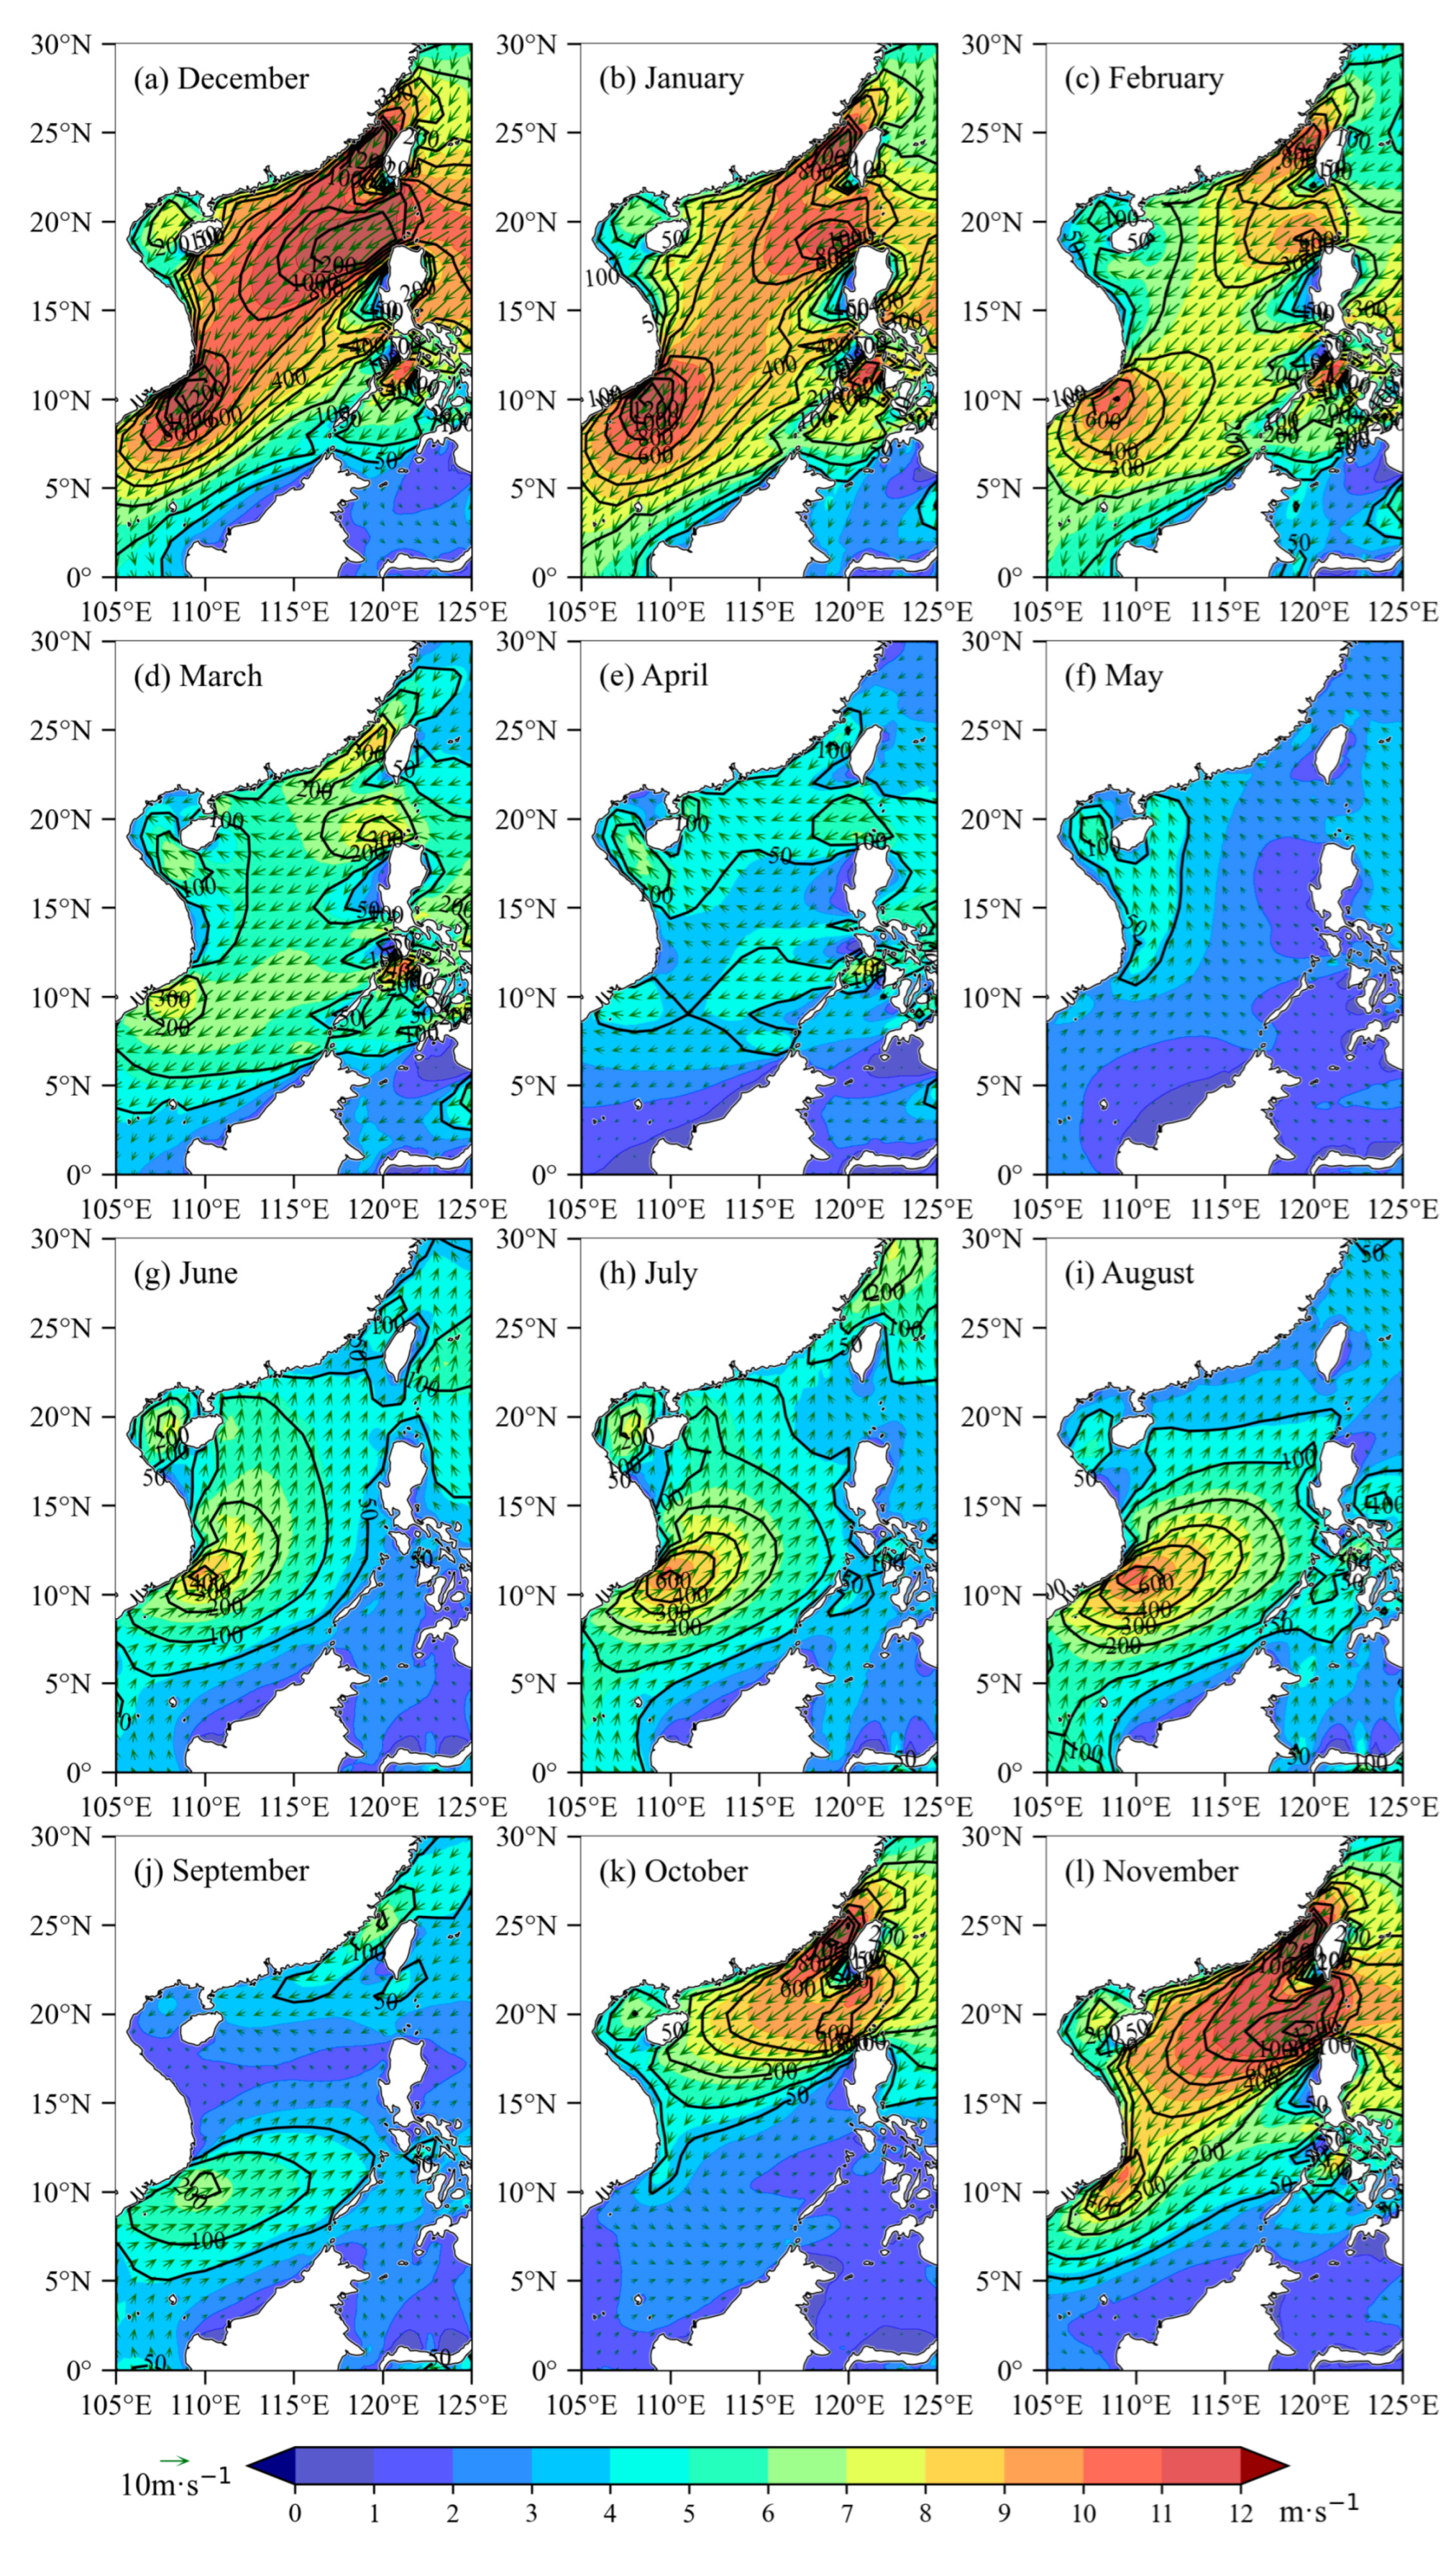
Figure 4 shows the monthly mean distribution of wind and wind power density over the SCS during 1979–2021. The patterns of wind and wind power density over the SCS from December to February (Figure 4a–c) are similar to those found in winter (Figure 3a); furthermore, their intensity varies greatly between the different months. Moreover, the wind and wind power density are at their highest in December. The mean wind speed and wind power density are generally more than 7 m·s−1 and 200 W·m−2 over the SCS, respectively. In addition, the center of the Taiwan Strait reaches 13 m·s−1 and 1400 W·m−2. The mean wind speed and wind power density weaken gradually from December to January, and then sharply increase from January to February. From March to May (Figure 4d–f), the wind over the SCS changes from the winter monsoon to the summer monsoon. In March, the winter monsoon also prevails over the SCS, but the wind speed weakens greatly (less than 8 m·s−1), which, in turn, is associated with a weak wind power density (about 50–300 W·m−2). In April and May, the wind changes to the summer monsoon; further, the wind speed and wind power density are generally less than 6 m·s−1 and 100 W·m−2, respectively. From June to August (Figure 4g–i), the summer monsoon dominates the SCS. The centers of wind and the wind power density are located over the southwestern SCS and also enhance slightly. However, the wind speed over the northern SCS weakens. From September to November (Figure 4j–l), the wind and wind power density over the SCS possess great differences. In September, the winter monsoon and summer monsoon prevail over the northern and southern SCS, respectively. From September to November, the northeast wind increases sharply over the northern SCS. The wind speed and wind power density generally exceed 5 m·s−1 and 100 W·m−2 in November, whose patterns were found to be similar to those found in winter. These results indicate that the change in the winter monsoon and the summer monsoon appear in May and September, thereby resulting in both the weakest wind speed and wind power density. In other words: the winter monsoon dominates from October to April, with abundant wind energy, whereas the summer monsoon dominates from June to August, and the wind energy is abundant over the southwestern SCS.

4. Trends of Wind Energy

4.1. Trends of Annual Mean Wind Energy

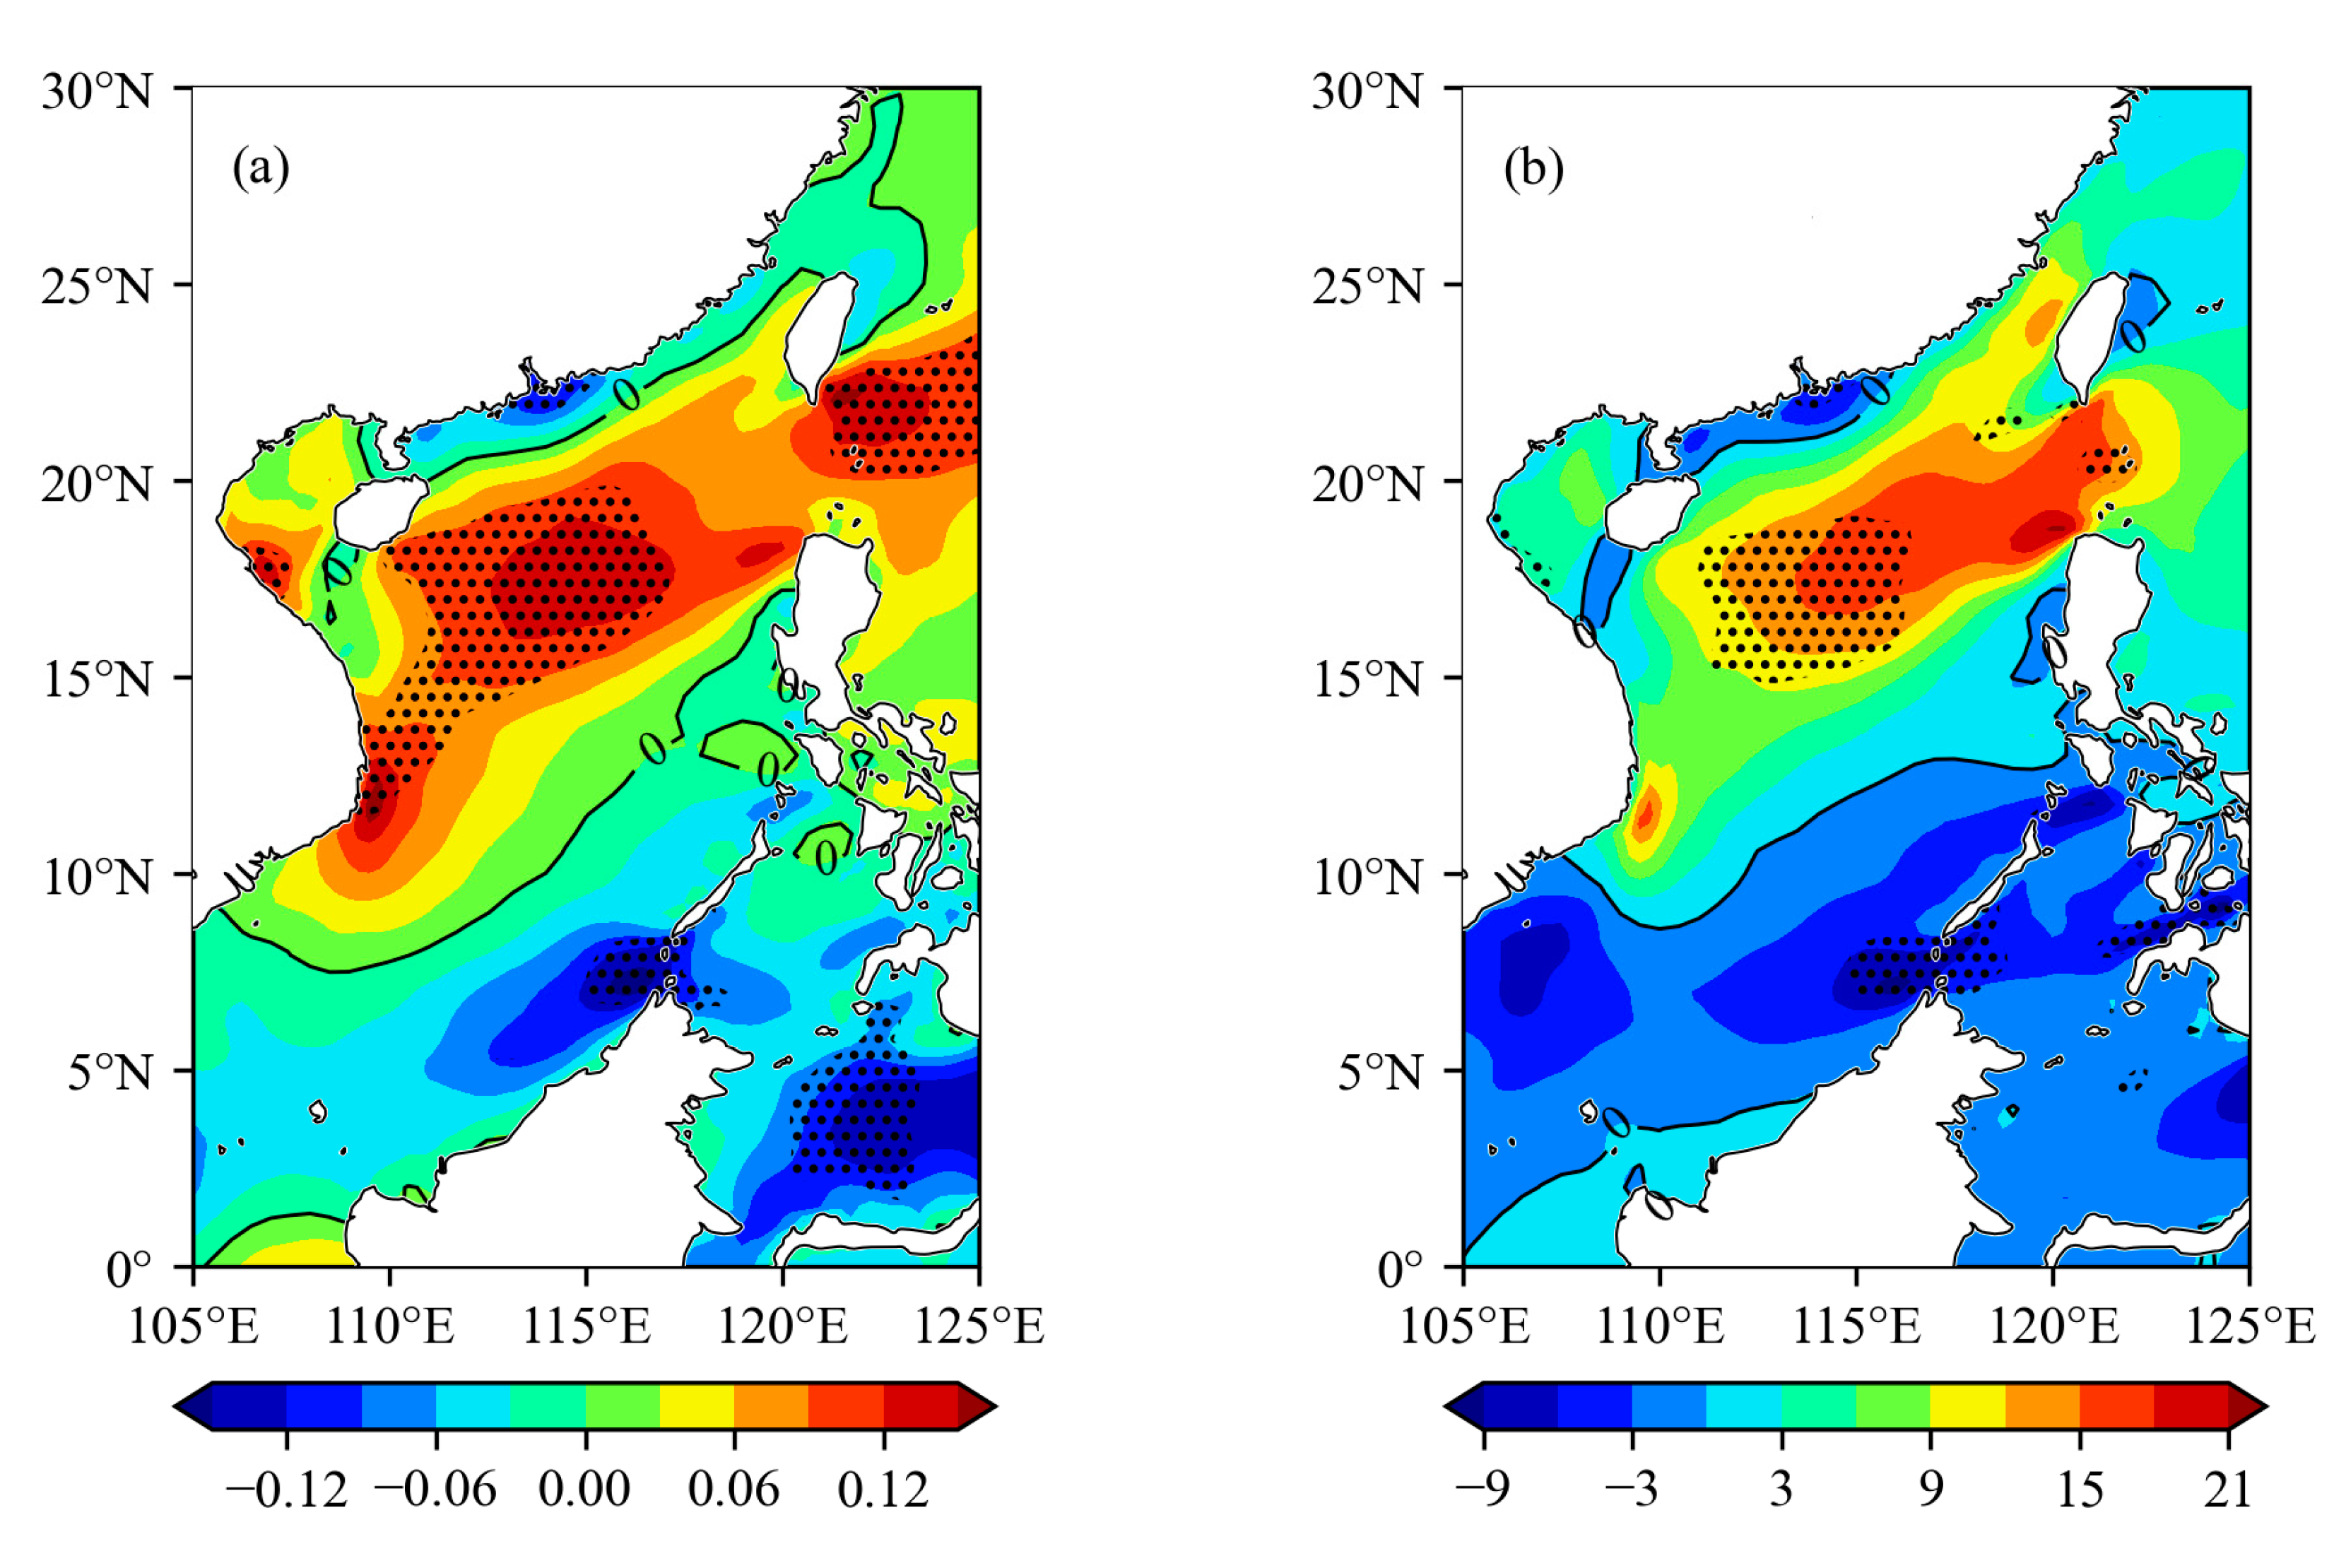
Figure 5 shows the linear variation trends of the annual mean wind and wind power density over the SCS during 1979–2021. Both the annual mean wind and wind power density over the central SCS, whose centers are located around Xisha Islands and Zhongsha Islands, show significant increasing trends. Those along the northern coast and over the southern SCS show decreasing trends with respect to the significant region being located in the Pearl River Estuary and western Guangdong. These results indicate that the wind energy increases over the central SCS and weakens along the northern coast of the SCS, which should be considered in the future planning and construction of wind farms.

4.2. Trends of Seasonal Mean Wind Energy

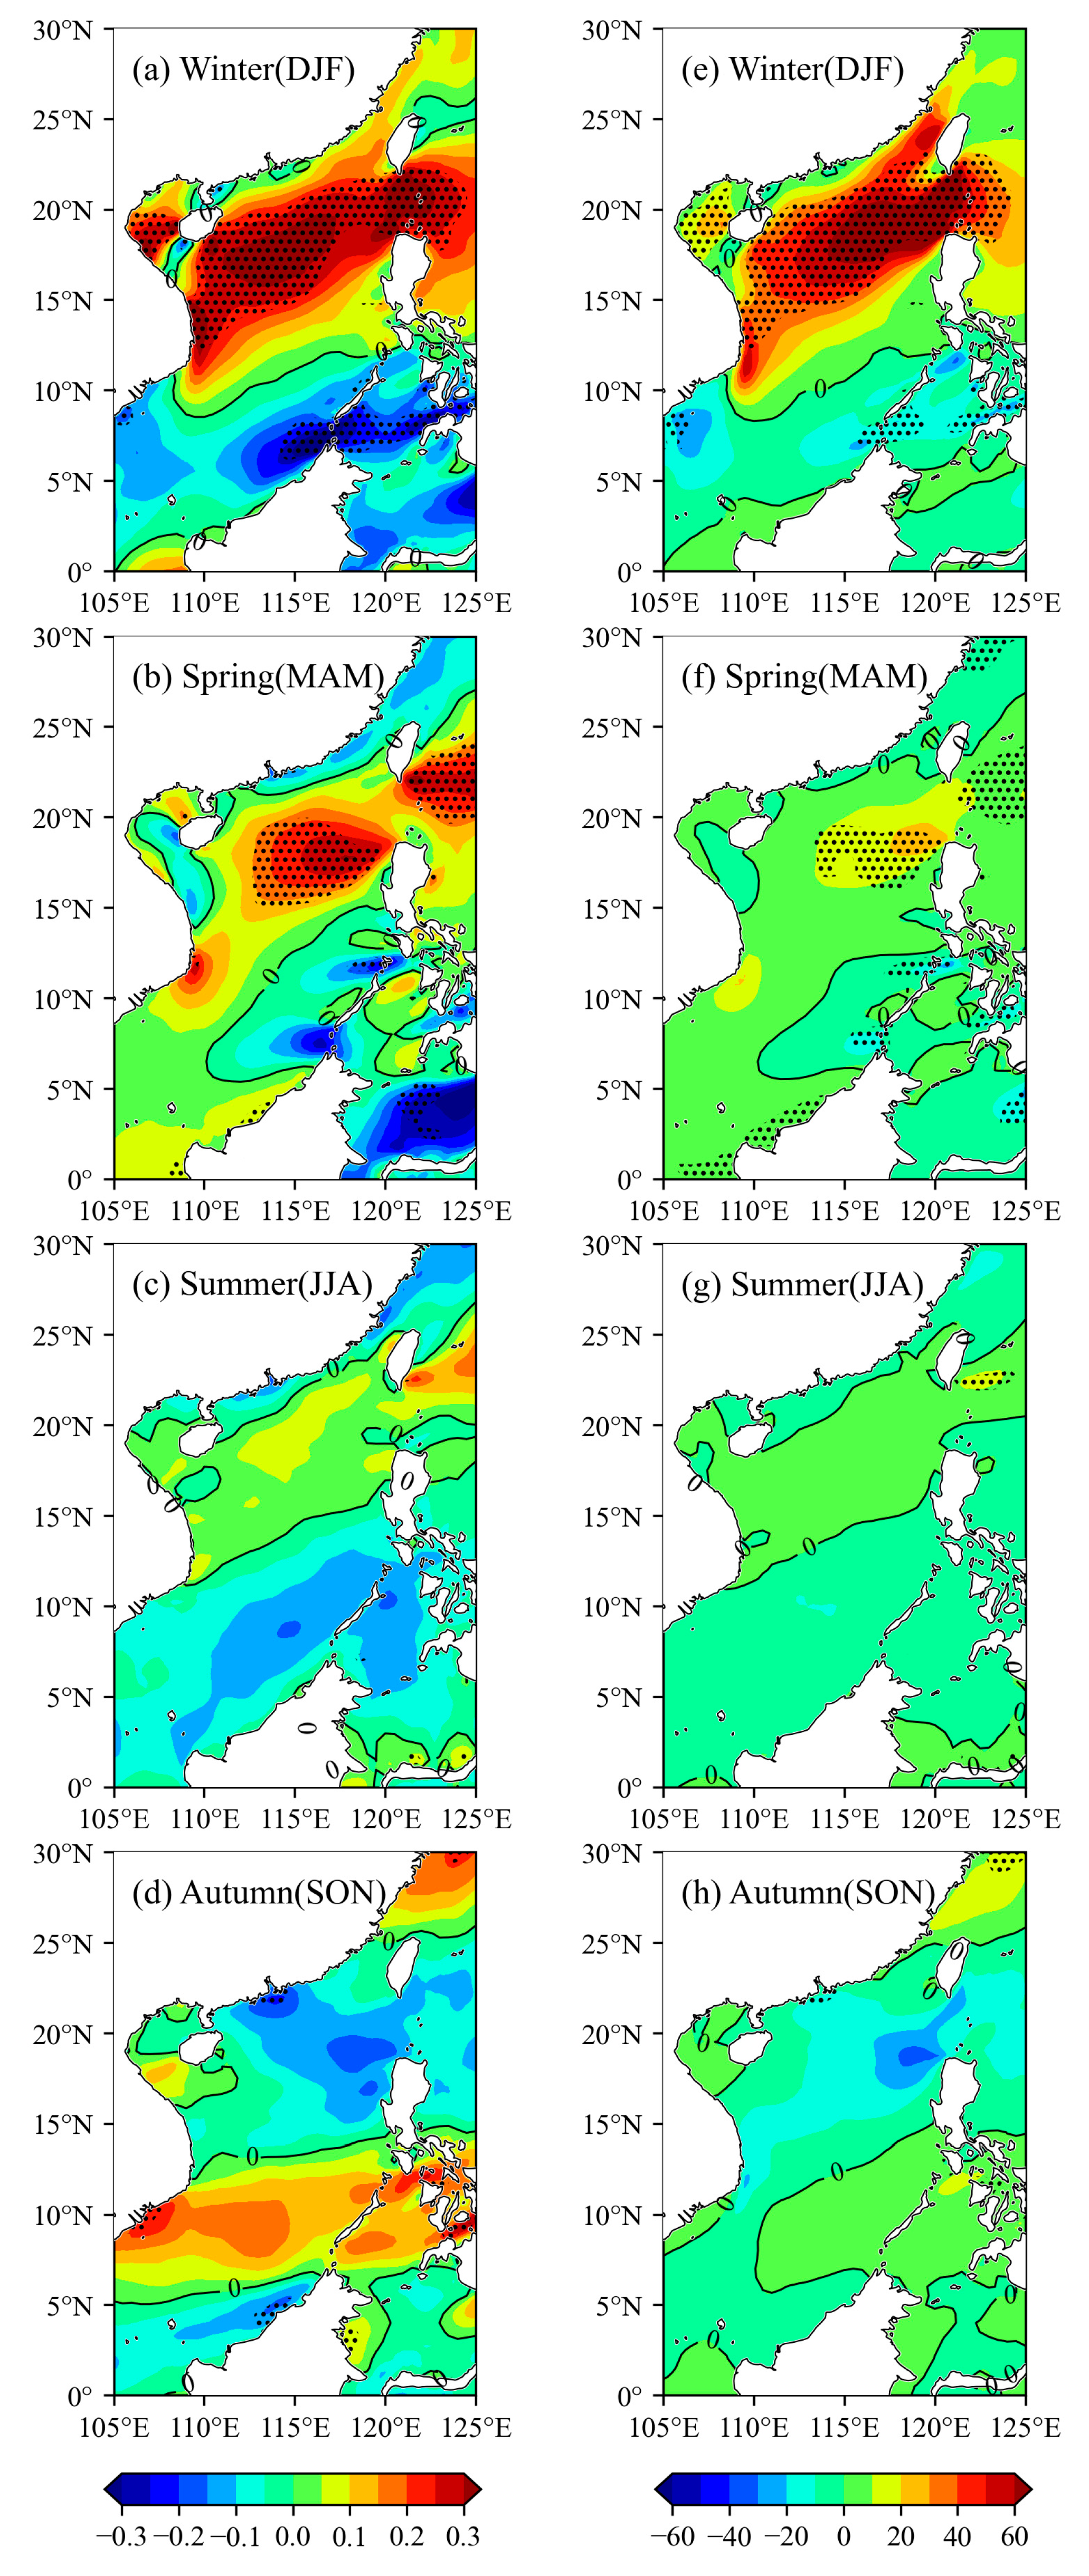
Figure 6 displays the linear trends of the seasonal mean wind and wind power density over the SCS during 1979–2021. Although the patterns regarding variation trends with respect to the seasonal mean wind and wind power density in winter, spring, and summer (Figure 6a–c,e–g) are similar to those of the annual mean wind and wind power density (Figure 5a), those intensities still differ considerably. From winter to summer, the increasing trends of the seasonal mean wind speed and wind power density gradually weaken over the central SCS; further, the increasing trends become more insignificant in the summer. However, the decreasing trends along the northern coast of the SCS change greatly—which is distributed along the western coast of Guangdong in winter, the eastern coast of Guangdong in spring, and the whole coast of Guangdong in summer—but the decreasing trends, generally, are insignificant. The patterns in autumn regarding the trends of the seasonal mean wind (Figure 6d) and the wind power density (Figure 6h) almost show the opposite trend with respect to the other seasons, except along the northern coast of the SCS, which shows decreasing and increasing trends over the northern and southern SCS, respectively. Of particular note are the decreasing trends that are strong and significant along the northern coast of the SCS, which may result in the significant decreasing trends found with respect to the annual mean wind energy. These results indicate that the trends of the seasonal mean wind energy demonstrate great differences between the different seasons. The significant increasing trends over the central SCS mainly occur in winter and spring. The significant decreasing trends along the northern coast of the SCS occur mainly in autumn. Furthermore, the trends are the weakest in the summer.

4.3. Trends of Monthly Mean Wind Energy

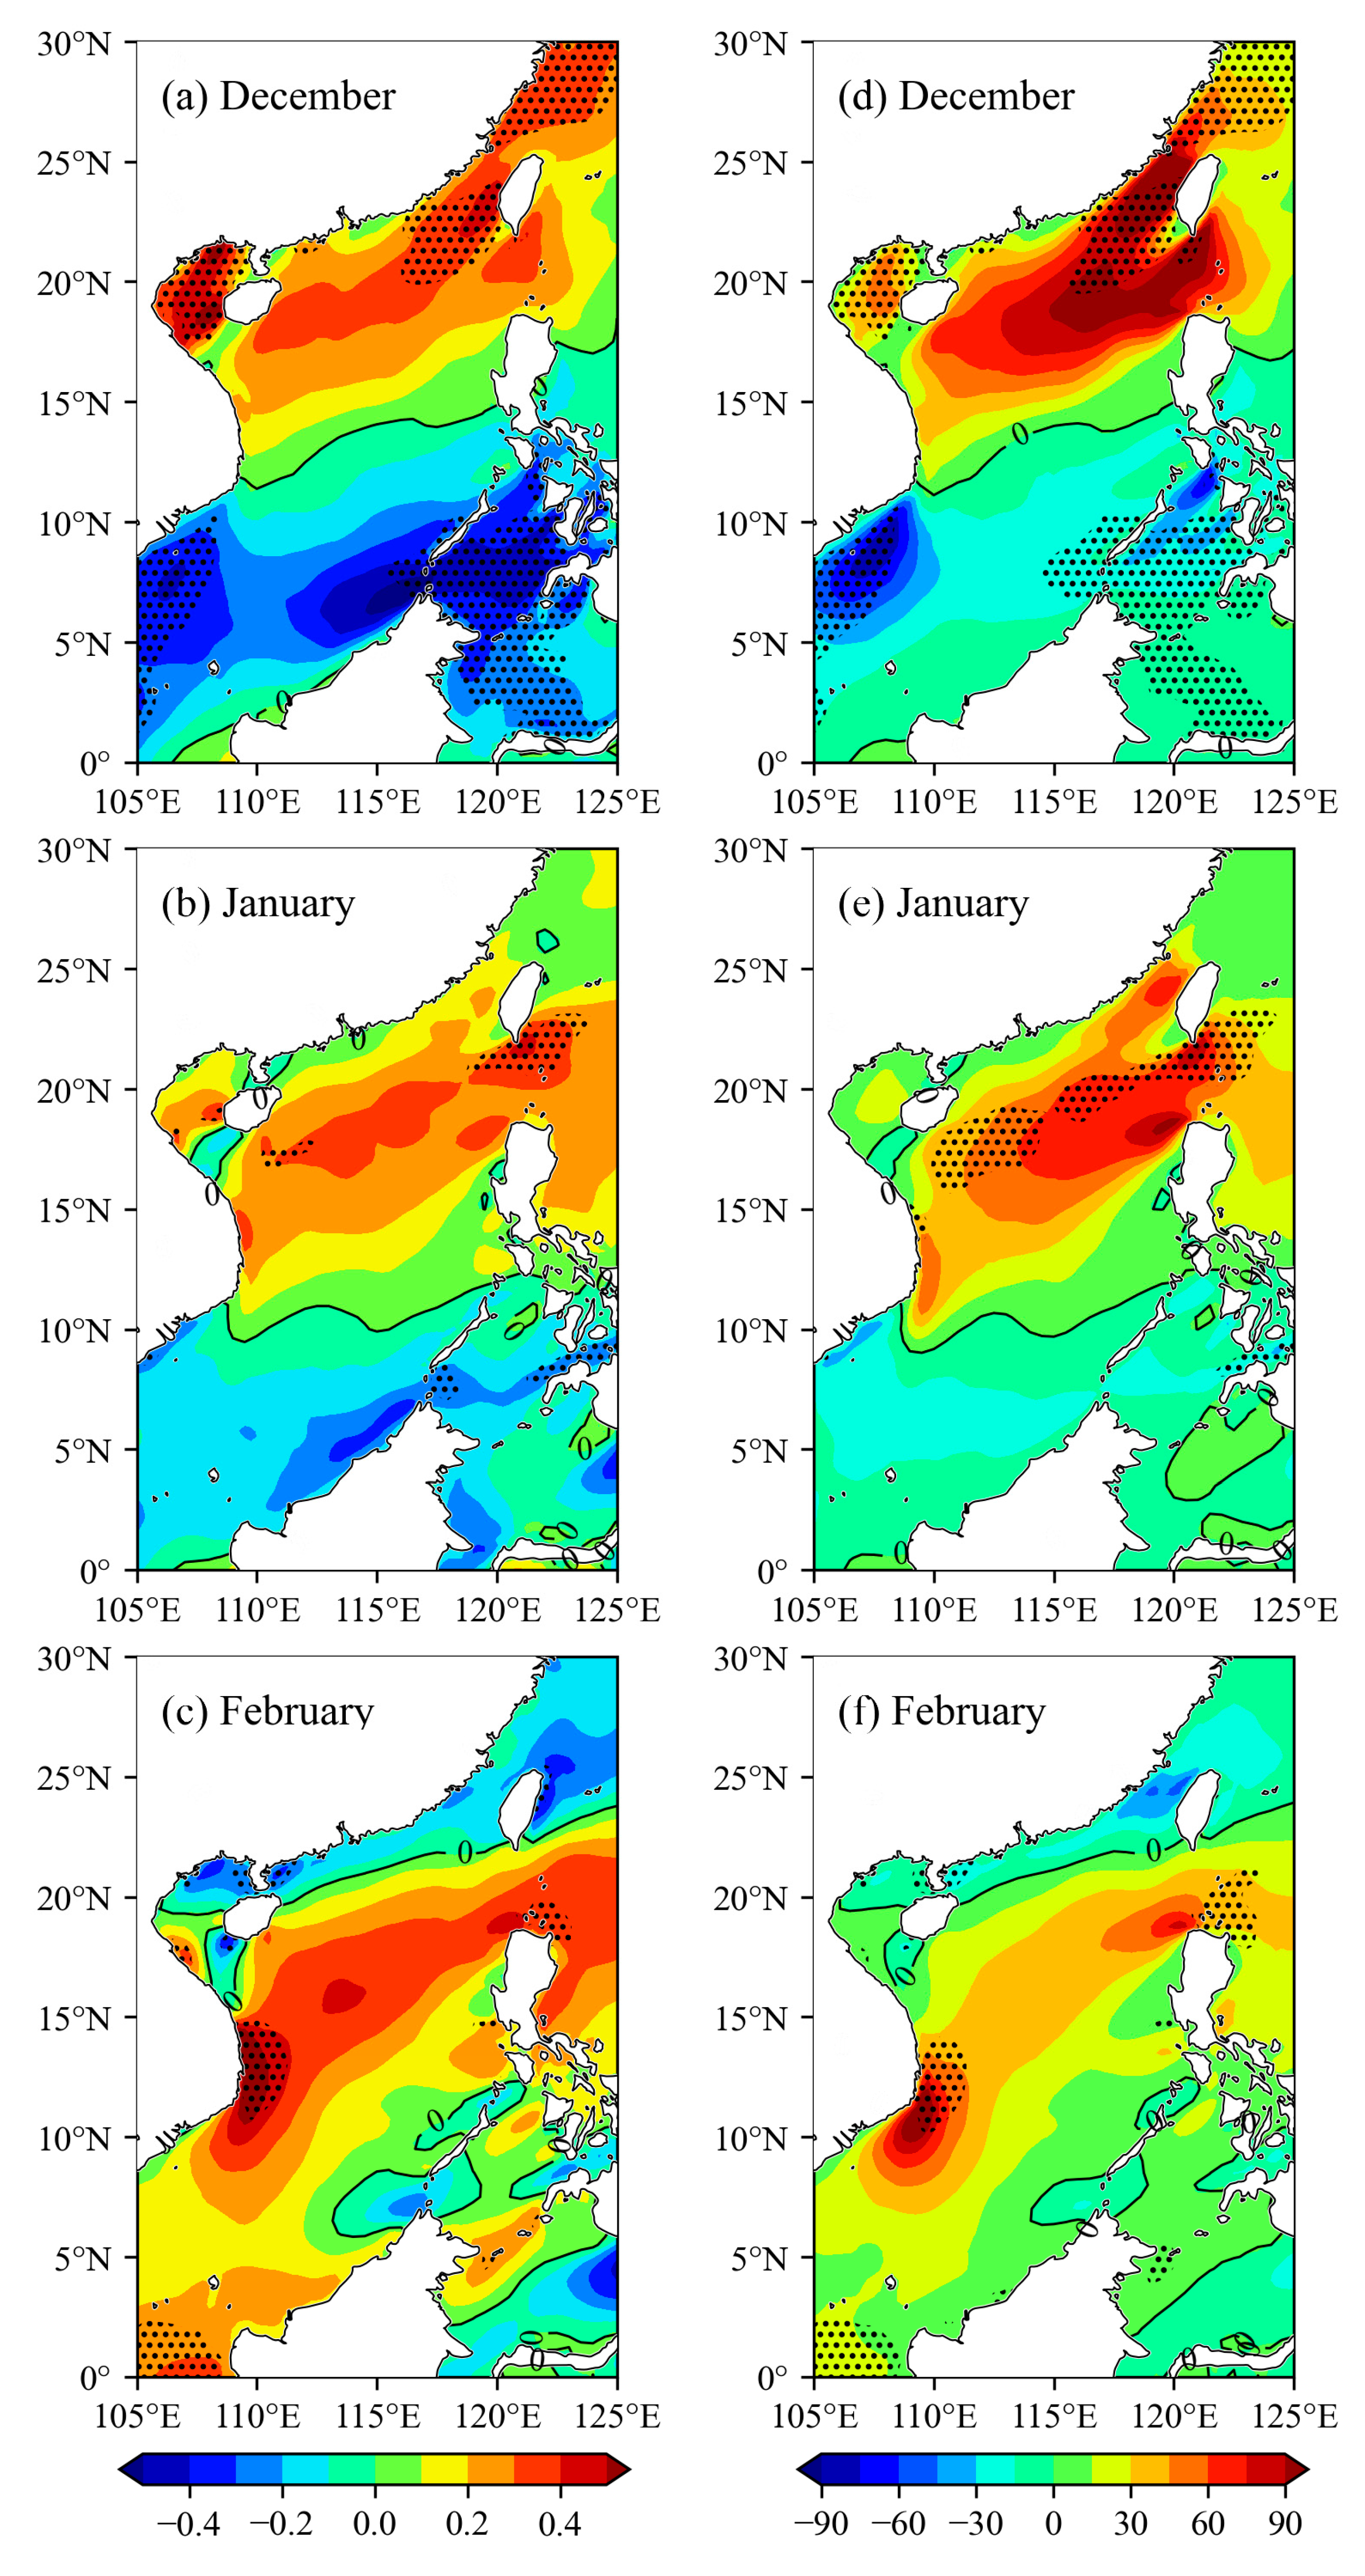
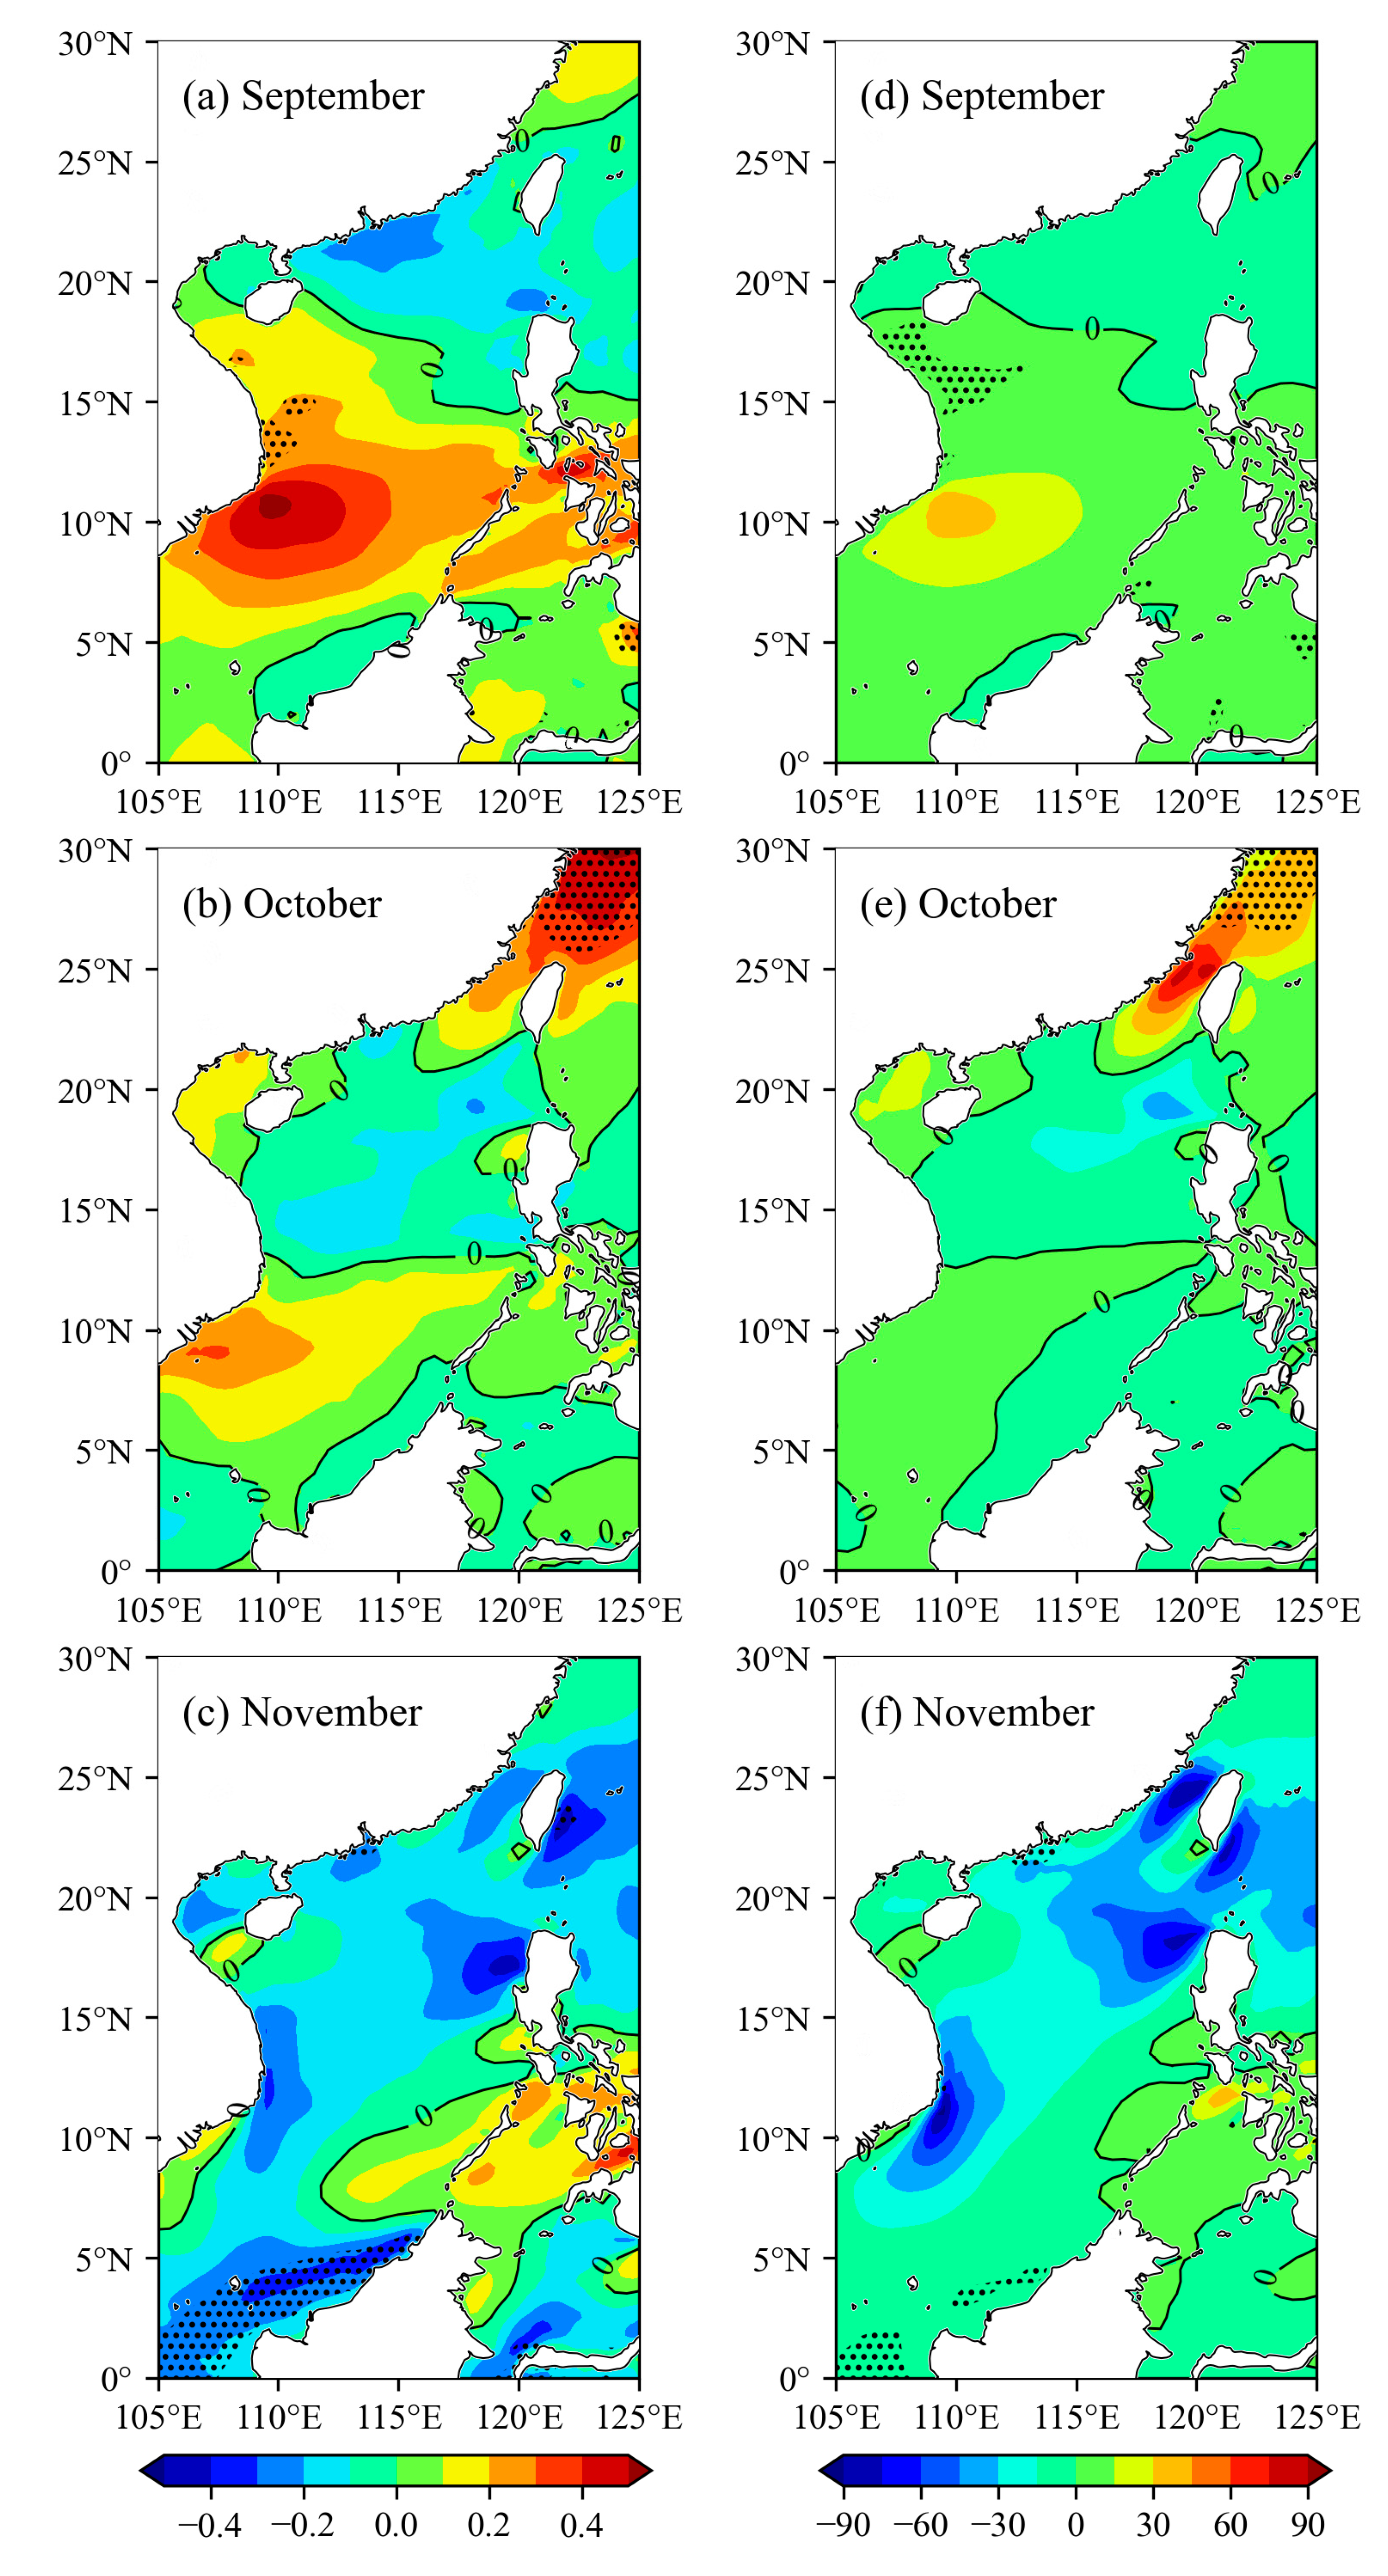
The monthly mean wind and wind power density over the SCS during 1979–2021 are displayed in Figure 7, Figure 8, Figure 9 and Figure 10. From December to February (Figure 7), the increasing trends of wind (Figure 7a–c) and wind power density (Figure 7d–f) over the central SCS move gradually to the southern SCS. Meanwhile, the increasing trends along the northern coast of the SCS change to decreasing trends. Furthermore, the decreasing trends strengthen greatly and become significant in February along the western coast of Guangdong. When compared with the trends in winter (Figure 6a,e), it can be found that the decreasing trends of the wind speed and wind power density along the northern coast of the SCS are mainly as a result of the decreasing trends in February.
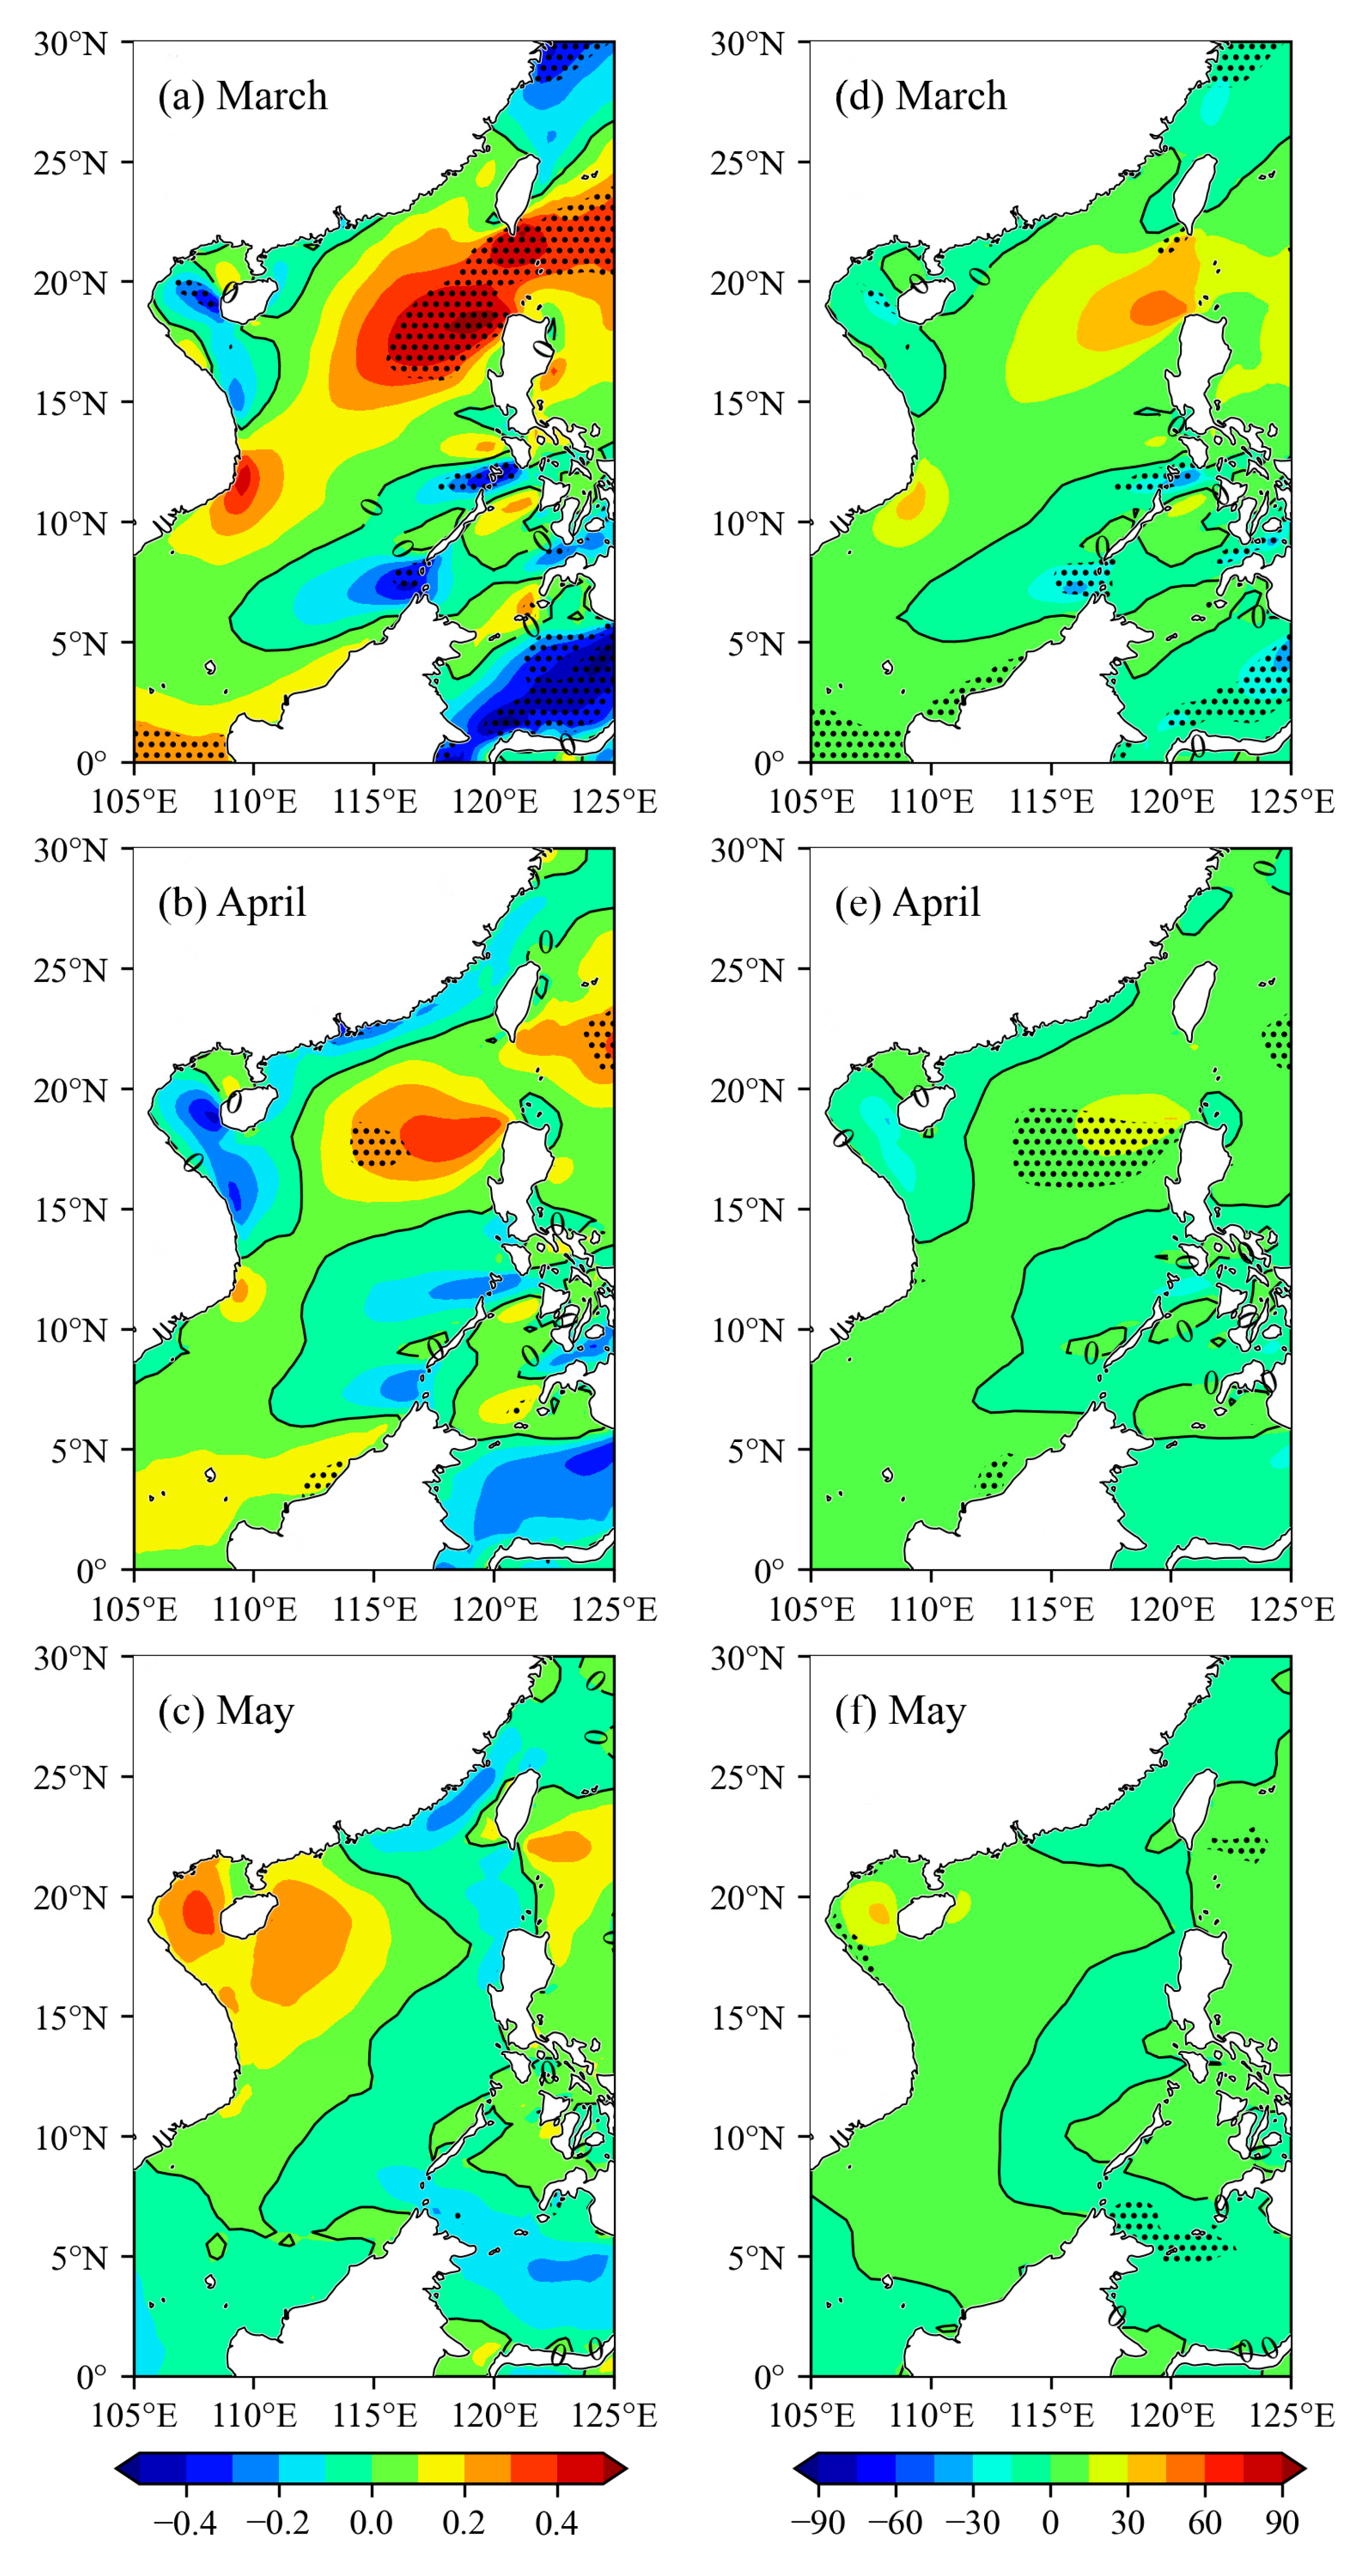
The trends over the SCS, during the period of 1979–2021, with respect to the monthly mean wind (Figure 8a–c) and wind power density (Figure 8d–f) demonstrate great differences from March to May. In March, the increasing trends of the mean wind (Figure 8a) and wind power density (Figure 8d) are mainly distributed over the central SCS, whereby the decreasing trends mainly appear over the northwestern and southeastern SCS. The pattern of their trends in April (Figure 8b,e) is similar to that observed in March, while both the increasing trends over the central SCS and the decreasing trends over the northwestern and southeastern SCS weaken. The trends in May (Figure 8c,f) differ greatly with those found in March and April, whereby the increasing trends are distributed over the western SCS and the decreasing trends appear over the eastern SCS. The decreasing trends in spring along eastern Guangdong in spring (Figure 6b,f) are mainly as a result of the decreasing trends in April and May.
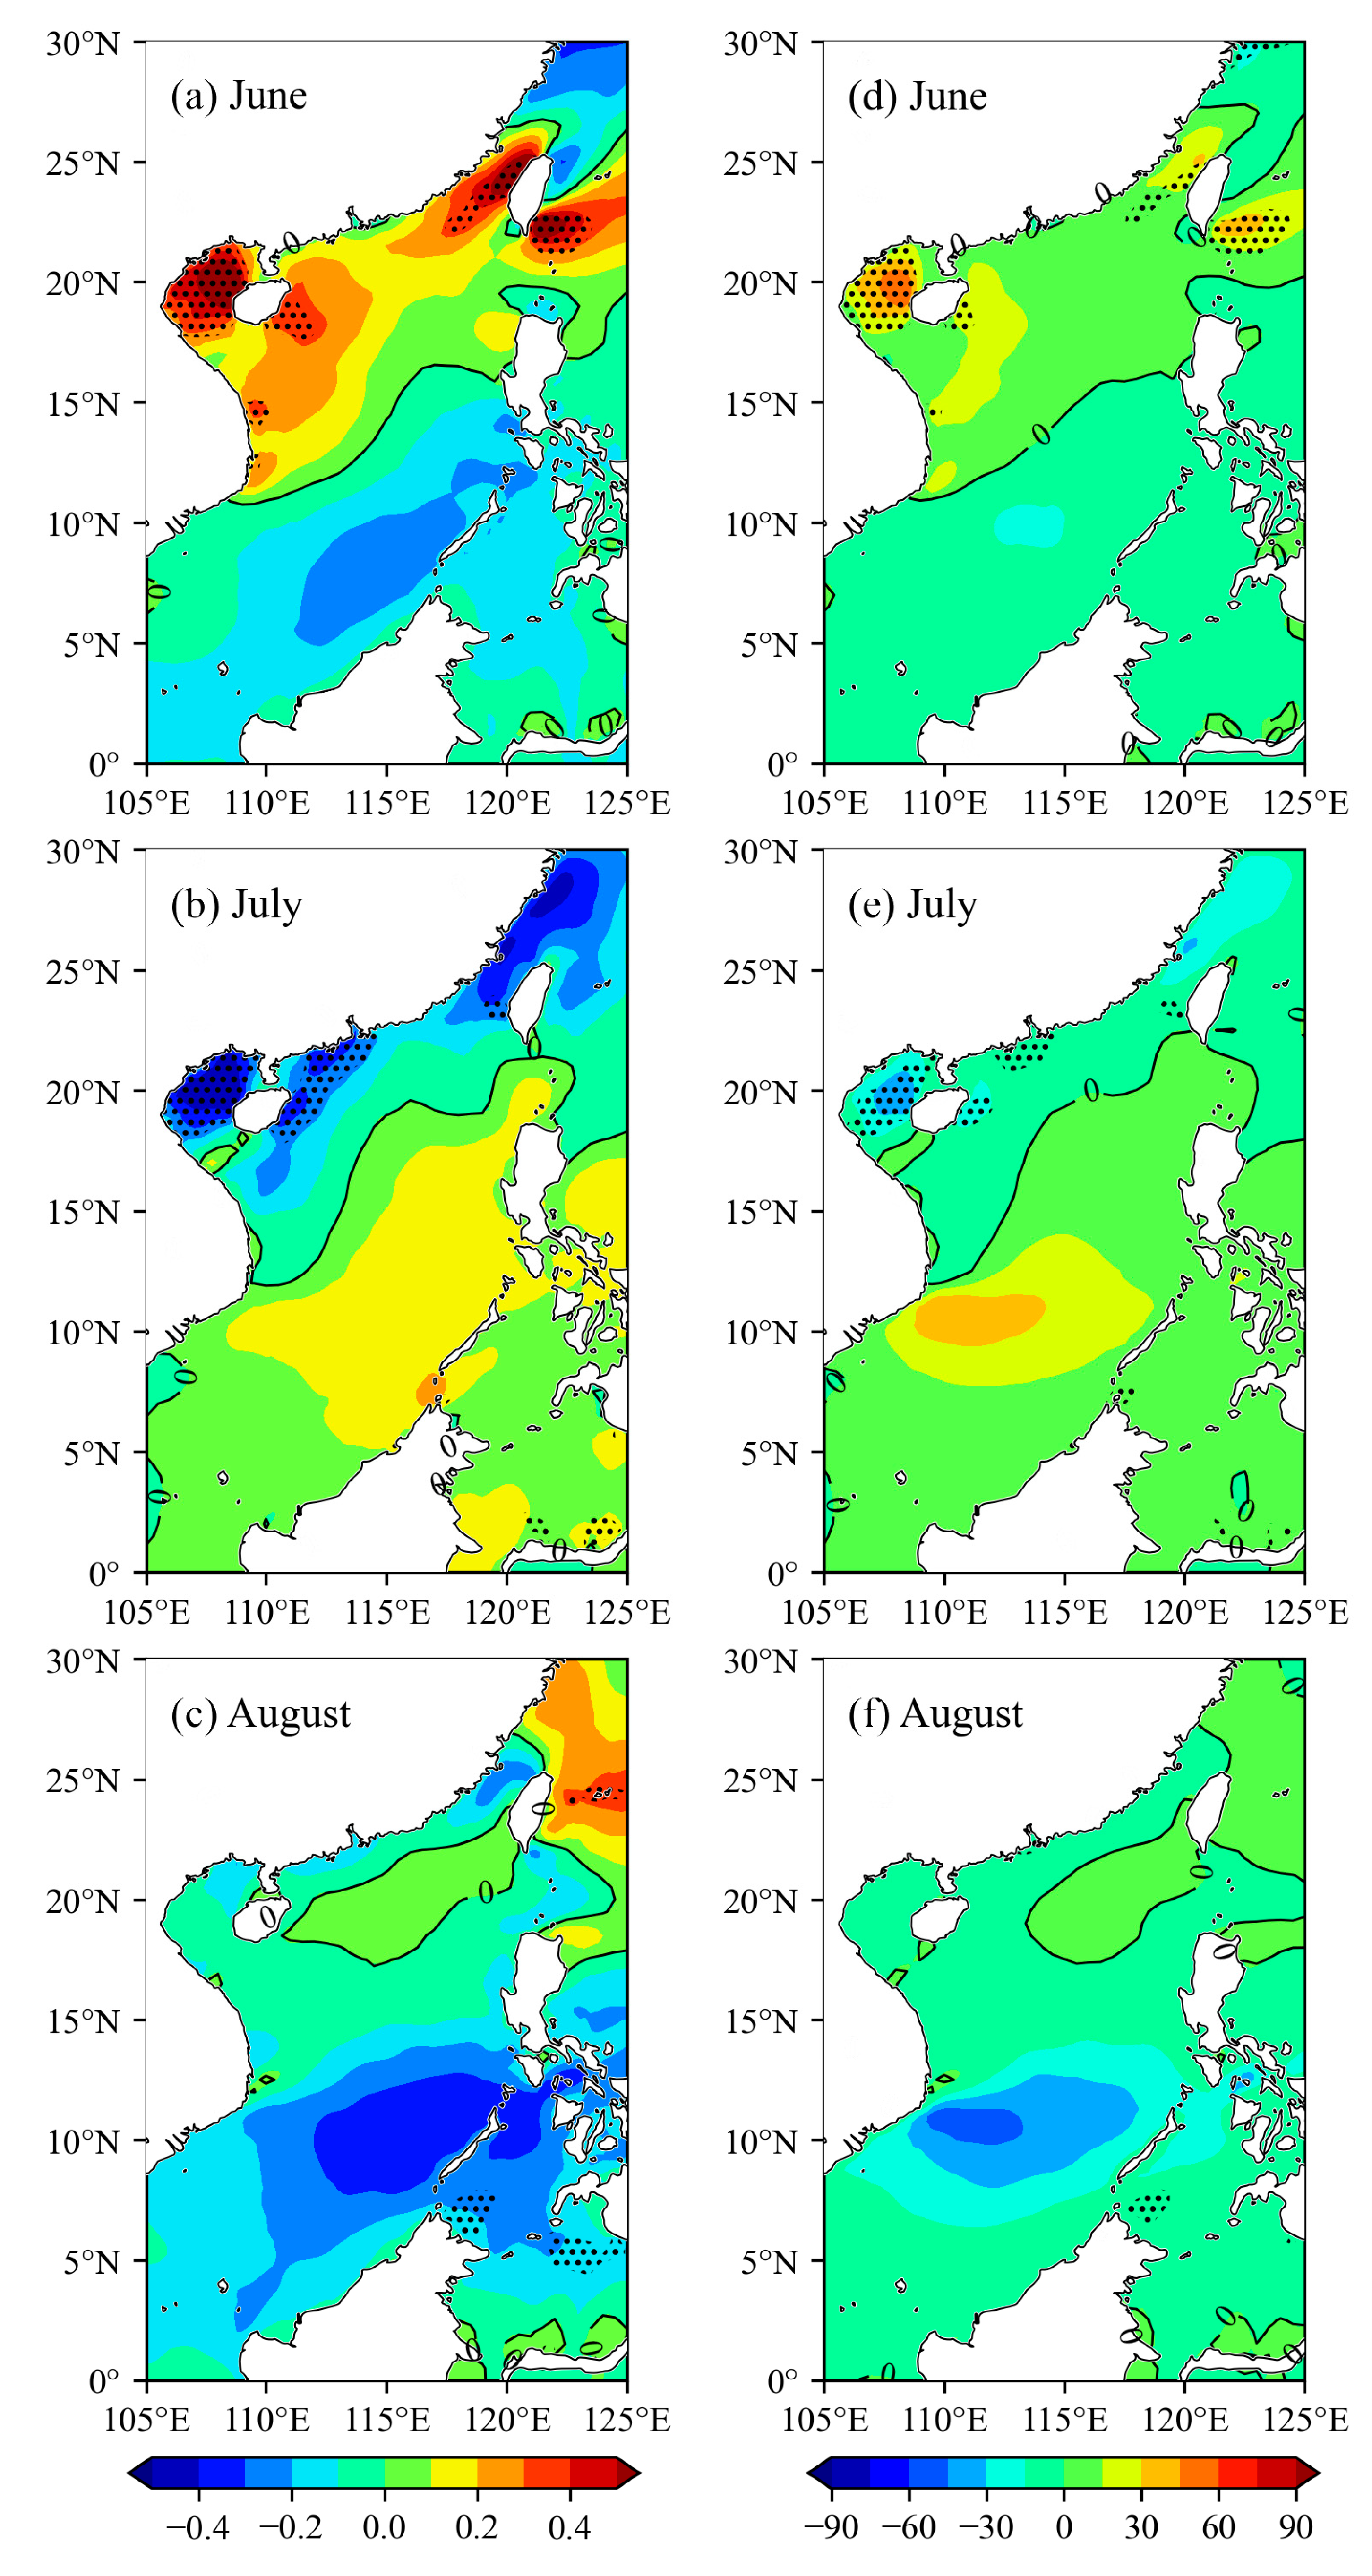
From June to August, the trends over the SCS during 1979–2021 with respect to the monthly mean wind (Figure 9a–c) and wind power density (Figure 9d–f) are also evidently different. The trends of the monthly mean wind (Figure 9a) and wind power density (Figure 9d) in June increase significantly over the central SCS, but decrease over the southern SCS. The trends in July (Figure 9b,e) generally show opposite trends with those in June. However, there is notably a significant decrease along the coast of Guangdong. In August, the trends of the monthly mean wind (Figure 9c) and wind power density (Figure 9f) over the SCS are generally weak. The only exception is found in the increasing trends over the central SCS, as the other areas show decreasing trends. Although the increasing or decreasing trends of the wind speed (Figure 6c) and wind power density (Figure 6g) in summer are weak, the trends in June and July are strong. This is most likely due to the fact that the opposite trends in June and July lead to the weak trends in summer.
Figure 10 shows the trends of the monthly mean wind and wind power density from September to November. In September, the northeastern and southwestern SCS show decreasing and increasing trends, respectively. From September to November, the decreasing trends over the northeastern SCS expand to the south and the increasing trends over the southwestern SCS narrow; as such, the trends gradually weaken. In November, the monthly mean wind and wind power density demonstrate decreasing trends over the most areas of the SCS, apart from the increasing trends over the southeastern SCS.

4.4. Prediction of Spatial Distribution of Wind Energy over the SCS

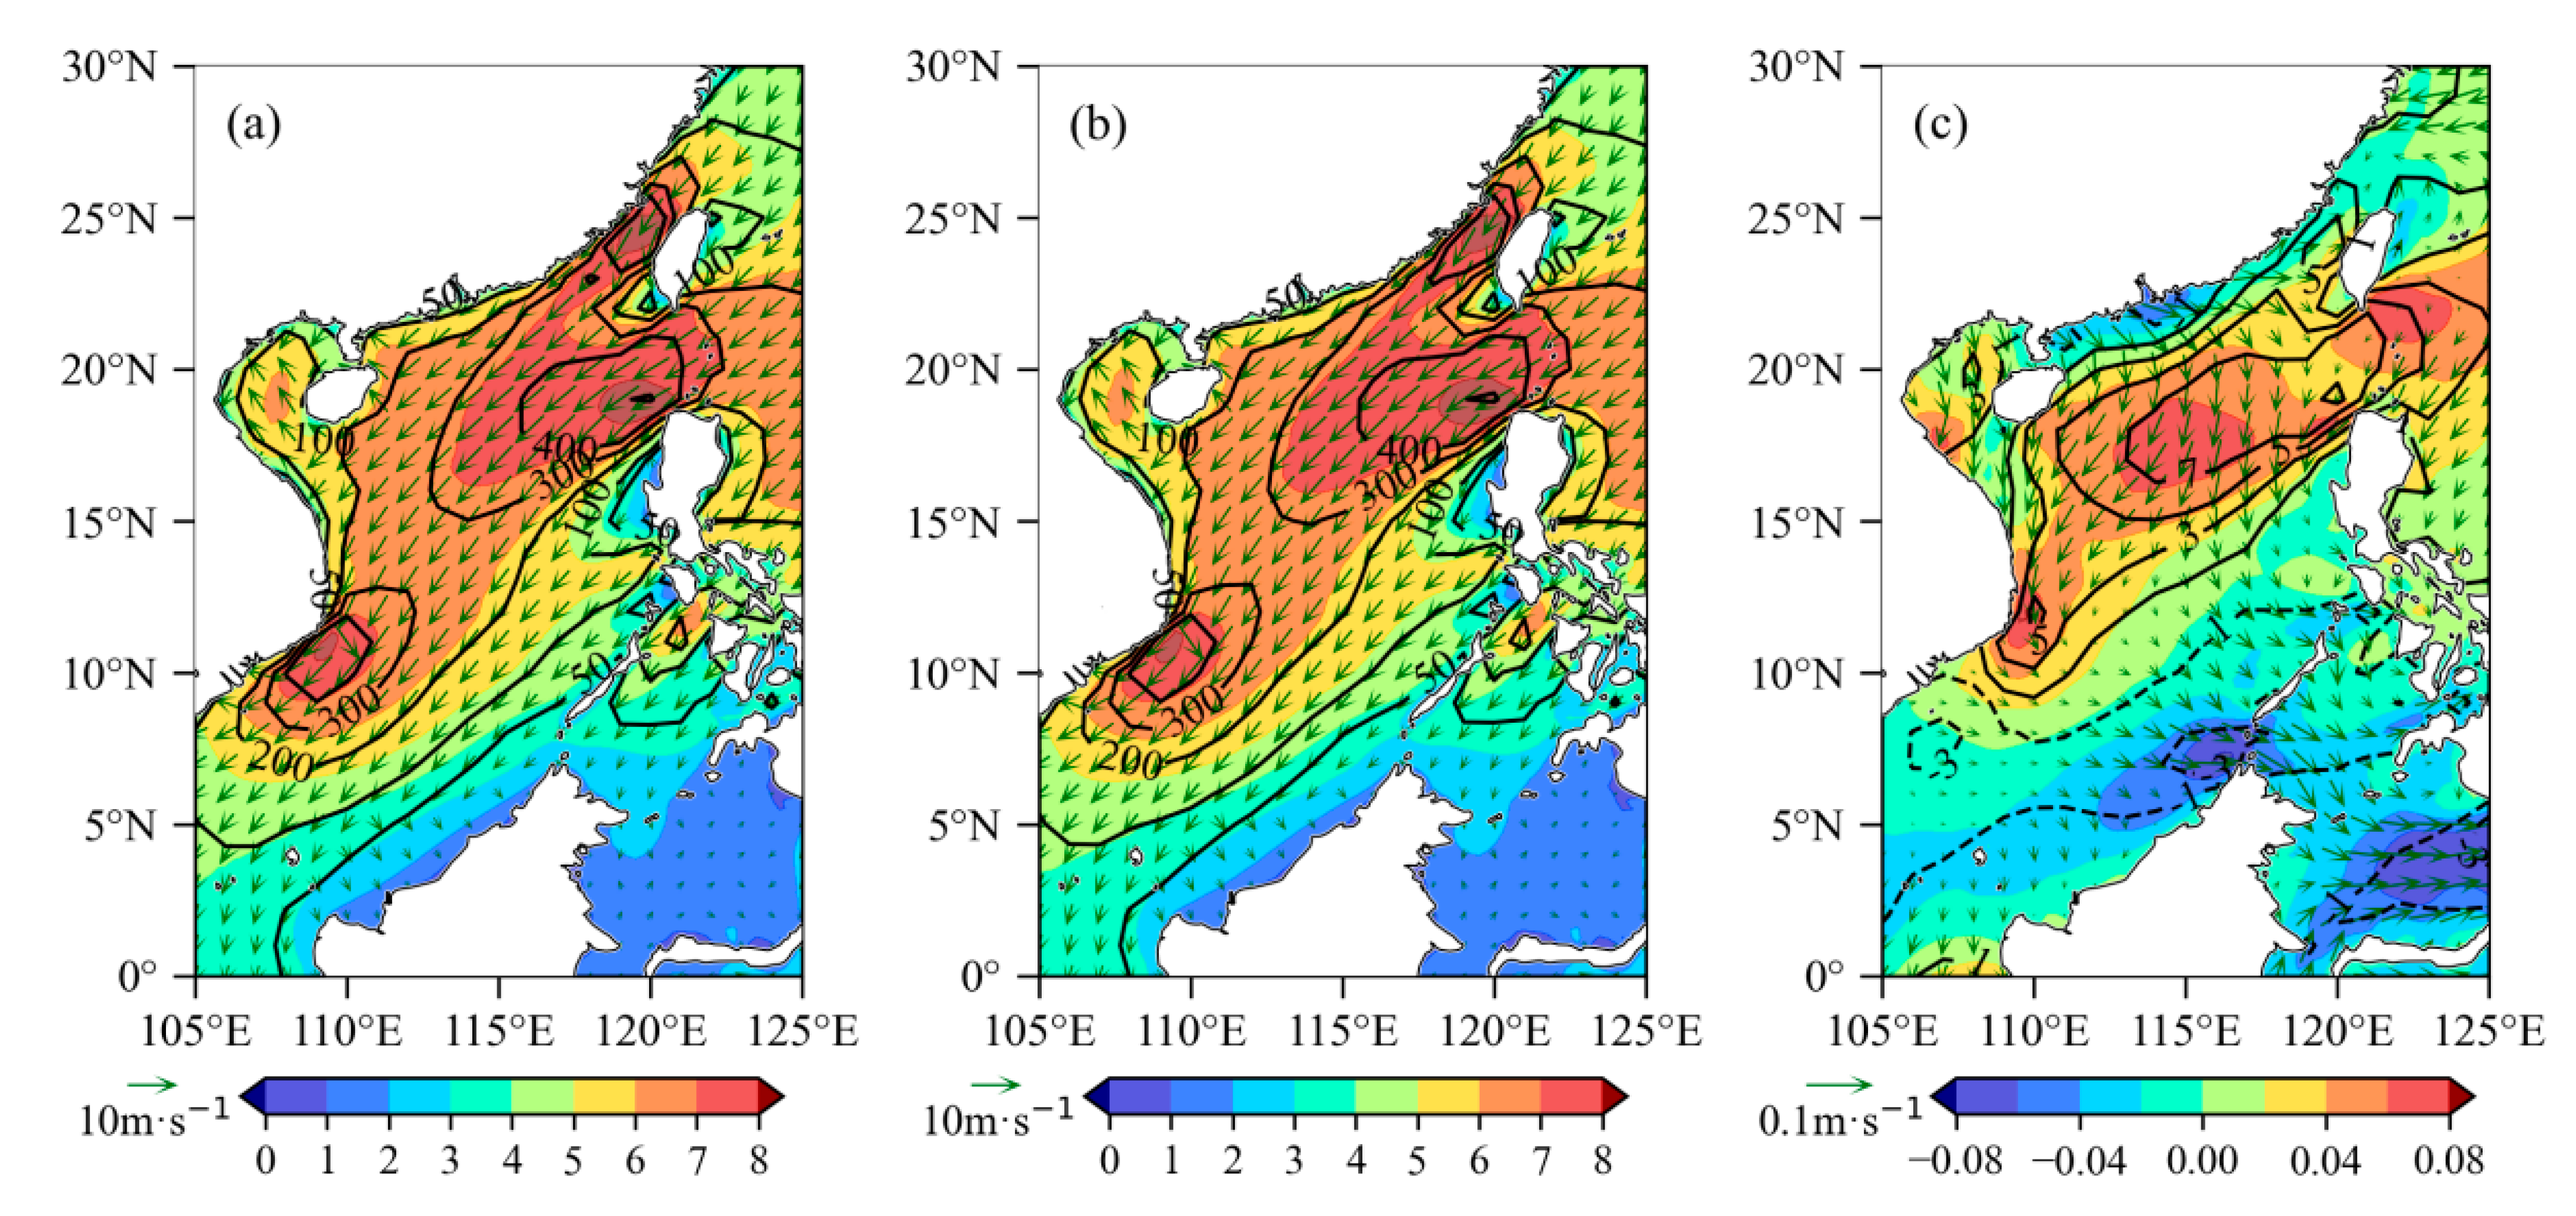
The annual mean wind energy over the SCS in the next 5 years was predicted based on the linear regression model of the annual mean wind and wind power density. The annual mean wind and wind power density in 2021 were taken as the starting year. This was chosen because 2021 is the latest year in which the ERA5 data can be obtained wholly. Figure 11 shows the spatial distribution of the annual mean wind and wind power density over the SCS in 2021, as well as in regard to the next 5 years and the respective differences. The annual mean wind and wind power density in 2021 (Figure 11a) is distributed in a similar manner to the annual mean distribution from 1979 to 2021 (Figure 2). The only exception is that the annual mean wind and wind power density in 2021 were found to be generally higher. Moreover, the patterns of the annual mean wind and wind power density in the next 5 years (Figure 11b) are predicted to be similar to those in 2021. When combined with the differences between the next 5 years and 2021 (Figure 11c), it can be observed that the wind energy weakens over the northern and southern SCS, but enhances in the central SCS.

5. Conclusion and Discussion

The spatial distribution and variation trends over the SCS from 1979 to 2021 with respect to wind energy (as measured by wind and wind power density) through various time scales are investigated via the use of high-resolution ERA5 reanalysis data.
The annual mean wind over the SCS is mainly dominated by the winter monsoon (i.e., the northeast wind) with values more than 5 m·s−1. The annual mean wind power density over the SCS generally exceeds 100 W·m−2, with three strong centers exceeding 400 W·m−2 in the Taiwan Strait, the Bashi Channel, and the southwestern SCS. The spatial distribution of wind energy in the northern and central SCS is similar to the results obtained by Wen et al. [33]. Moreover, the southwestern SCS possesses abundant wind energy. The annual mean wind and wind power density over the SCS are stronger than those found in most areas in mainland China, thereby indicating that the SCS possesses abundant wind energy—which, in turn, entails great development potential and utilization value. The East Asian monsoon dominates the SCS, thereby resulting in the wind energy demonstrating an evident seasonal change. In winter, the winter monsoon (northeast wind) prevails over the SCS. In addition, the wind energy is abundant over the whole SCS; moreover, the strongest wind is found over the northeastern and southwestern SCS. In spring, the wind energy is poor throughout. In summer, the SCS is dominated by the summer monsoon, and the wind energy is most abundant over the southwestern SCS. In autumn, the wind energy is abundant over the northern SCS and is dominated by the winter monsoon. These results, however, show certain differences with the study of Adekunle et al. [42], who found that the strongest wind energy in winter was found around Zhongsha, whereas in summer they found that the strongest wind energy over the central SCS was around the Zhongsha and Liyue banks. Having said that, this most likely resulted from certain differences in the time series and selected data that they utilized. From October to March, the winter monsoon (i.e., the northeast wind) dominates the SCS; furthermore, the patterns of wind and wind power density are similar to those found in winter or autumn. In addition, the wind energy reaches its maximum in December. From June to August, the SCS is dominated by the summer monsoon (i.e., the southwest wind). Here, the abundant wind energy is distributed over the southwestern SCS. May and September are the months in which the winter and summer monsoon change; as such, the wind and wind power density decrease to their lowest in May. These results are generally consistent with those established by Wen et al. [33].
The annual mean wind energy has demonstrated decreasing trends along the northern coast and increasing trends over the central SCS. Having said this, the trends of wind energy vary greatly between the different seasons. Although the patterns regarding the variation trends of seasonal mean wind energy in winter, spring, and summer are similar to that of the annual mean wind energy, these intensities still differ considerably. That is to say that they are strongest in winter, followed by spring and autumn, and then weakest in the summer. These findings are generally consistent with Jiang et al. [46], while they represent certain differences with the findings of Zhang et al. [13], who observed the strongest variability in summer and winter. The significant increasing trends of wind energy over the central SCS mainly occur in winter and spring. The pattern in the variation trends of wind energy in autumn almost shows the opposite trend with the other seasons, which show decreasing and increasing trends over the northern and southern SCS, respectively. Most notably, the decreasing trends are significant along the northern coast of the SCS, which may result in the significant decreasing trends of the annual mean wind energy. During each month, the decreasing trends of wind energy over the northern coast of the SCS occur in February, April, July, September, and November, whereby the increasing trends of wind energy over the central SCS appear from December to June. These results, however, present certain differences with other studies. Zhang et al. [13] found that the decreasing trends of wind energy over the northern coast of the SCS appear from October to December, January, and February. The increasing trends of wind energy over the central SCS appear from March to June, then to September and October. The annual mean wind energy over the SCS in the next 5 years was predicted based on the linear regression model of the annual mean wind and wind power density. The results show that the wind energy weakens over the northern and southern SCS and then enhances in the central SCS.
In this study, by obtaining the spatial distribution and trends regarding the wind energy over the SCS, one can issue a more informed recommendation with respect to offshore wind power planning. The development of wind energy in China is mainly distributed along the northern coast, as well as in the islands or reefs of the central SCS. Furthermore, these regions possess abundant wind energy and are suitable for the purposes of wind farm construction. While the wind energy demonstrates unbalanced distribution in certain seasons—i.e., it is most abundant in the autumn and winter, from October to March—it can provide a reference for wind energy absorption and energy scheduling. The variation trends of wind energy are important factors that should be considered in the long-term planning and top-down design of wind energy. Generally, the wind energy shows increasing trends over the central SCS, whereas decreasing trends are shown along the northern coast of the SCS. The central SCS not only possesses abundant wind energy, but also shows increasing trends with respect to wind energy, thereby providing favorable conditions for wind energy development. Although the northern coast of the SCS demonstrates decreasing trends, the decreasing trends generally occur in the spring and summer, which is when the overall wind energy is poor. Furthermore, though the wind energy in these seasons is poor, the decreasing trends will most likely entail little impact on the development and construction of wind energy. Having said this, they should still be taken seriously. In addition, the mechanism regarding the variation trends of wind energy should be further investigated for a more rigorous scientific prediction of wind energy and its future uses.

Author Contributions

Conceptualization, S.Z. and T.Z.; methodology, S.Z. and T.Z.; software, H.W. (Hanwei Weng) and X.Y.; formal analysis, S.Z., X.Y. and H.W. (Hanwei Weng); data curation, H.W. (Hanwei Weng) and J.S.; writing—original draft preparation, S.Z., T.Z. and R.T.; writing—review and editing, S.Z., T.Z., X.Y. and R.T.; visualization, S.Z., H.W. (Hanwei Weng) and H.W. (Hao Wang). All authors have read and agreed to the published version of the manuscript.

Funding

This research was jointly funded by National Key Research and Development Program of China (Grant number 2021YFC3101801); Youth Innovative Talents Program of Guangdong Colleges and Universities (Grant number 2022KQNCX026); National Natural Science Foundation of China (Grant number 41976200, 42276019); State Key Program of National Natural Science Foundation of China (Grant number 42130605); College Student Innovation Team Project of Guangdong Ocean University (Grant number 010404032101); 2022 Guangdong College Student Innovation and Entrepreneurship Project (Grant number 010413032201); Guangdong Ocean University PhD. Scientific Research Program (Grant number R19045).

Institutional Review Board Statement

Not applicable.

Informed Consent Statement

Not applicable.

Data Availability Statement

Acknowledgments

The authors would like to express their sincere thanks to funding organizations, and special thanks go to ECMWF for providing ERA5 data. We would like to thank the reviewers for their valuable suggestions and comments.

Conflicts of Interest

The authors declare no conflict of interest.

References

  1. Díaz, C.H. Guedes Soares. Review of the current status, technology and future trends of offshore wind farms. Ocean Eng. 2020, 209, 107381. [Google Scholar] [CrossRef]
  2. Renewables Consulting Group. GWEC 2020. Glob. Offshore Wind Rep. 2020, 2020, 130. [Google Scholar]
  3. Lee, J.; Zhao, F. GWEC global wind report 2019. Wind Energy Technol. 2020, 78. [Google Scholar]
  4. Chen, X.P.; Wang, K.M.; Zhang, Z.H.; Zeng, Y.D.; Zhang, Y.; O’Driscoll, K. An assessment of wind and wave climate as potential sources of renewable energy in the nearshore Shenzhen coastal zone of the South China Sea. Energy 2017, 134, 789–801. [Google Scholar] [CrossRef]
  5. Wu, K.J. Calculation and Analysis of Wind Energy Resources in Guangdong Province. Trop. Weather 1989, 1, 79–84. (In Chinese) [Google Scholar]
  6. Zhang, X.Z.; Xu, J.W. China Offshore Wind Energy Resources Assessment. Wind Energy 2009, 3, 44–47. (In Chinese) [Google Scholar]
  7. Li, X.Q. Research on Wind Farm Site Selection Based on Wind Resource Assessment. Strateg. Emerg. Ind. China 2018, 40, 16. (In Chinese) [Google Scholar]
  8. Srensen, B. A New Method for Estimating Off-shore Wind Potentials. Int. J. Green Energy 2008, 5, 139–147. [Google Scholar] [CrossRef]
  9. Sheridan, B.; Baker, S.D.; Pearre, N.S.; Firestone, J.; Kempton, W. Calculating the Offshore Wind Power Resource. Robust Assessment Methods Applied to the US Atlantic Coast. Renew. Energy 2012, 43, 224–233. [Google Scholar] [CrossRef]
  10. Xu, J.W.; Luo, Y.; Zhang, X.Z.; Zhu, R. China Offshore Wind Energy Resources Assessment with the QuikSCAT Data. Soc. Photo-Opt. Instrum. Eng. 2008, 7105, 80–89. [Google Scholar]
  11. Guo, Q.Y.; Huang, R.; Zhuang, L.W.; Zhang, K.Y.; Huang, J.F. Assessment of China’s Offshore Wind Resources Based on the Integration of Multiple Satellite Data and Meteorological Data. Remote Sens. 2019, 11, 2680. [Google Scholar] [CrossRef]
  12. Bruun Christiansen, M.; Koch, W.; Horstmann, J.; Hasager, C.B.; Nielsen, M. Wind resource assessment from C-band SAR. Remote Sens. Environ. 2006, 105, 68–81. [Google Scholar] [CrossRef]
  13. Zhang, Y.S.; Cheng, Y.C.; Li, Y.Z. Variability of Wind Energy in the South China Sea. In Proceedings of the 2022 Photonics & Electromagnetics Research Symposium (PIERS), Hangzhou, China, 25–29 April 2022; pp. 456–459. [Google Scholar]
  14. Chang, R.; Zhu, R.; Merete Badger Charlotte Bay Hasager Xing, X.H.; Jiang, Y.R. Offshore Wind Resources Assessment from Multiple Satellite Data and WRF Modeling over South China Sea. Remote Sens. 2015, 7, 467–487. [Google Scholar] [CrossRef]
  15. He, J.; Chan, P.W.; Li, Q.; Lee, C.W. Spatiotemporal analysis of offshore wind field characteristics and energy potential in Hong Kong. Energy 2020, 201, 117622. [Google Scholar] [CrossRef]
  16. Dong, S.; Gong, Y.J.; Wang, Z.F.; Incecik, A. Wind and wave energy resources assessment around the Yangtze River Delta. Ocean Eng. 2019, 182, 75–89. [Google Scholar] [CrossRef]
  17. Wu, W.F.; Li, P.L.; Zhai, F.G.; Gu, Y.Z.; Liu, Z.Z. Evaluation of different wind resources in simulating wave height for the Bohai, Yellow, and East China Seas (BYES) with SWAN model. Continent. Shelf Res. 2020, 207, 104217. [Google Scholar] [CrossRef]
  18. Chen, Z.; Guo, J.H.; Li, W.; Zhang, F.; Xiao, C.; Pan, Z.R. Changes in wind energy potential over China using a regional climate model ensemble. Renew. Sustain. Energy Rev. 2022, 159, 112219. [Google Scholar]
  19. Wang, Z.F.; Duan, C.L.; Dong, S. Long-term wind and wave energy resource assessment in the South China sea based on 30-year hindcast data. Ocean Eng. 2018, 163, 58–75. [Google Scholar] [CrossRef]
  20. Zhu, R.; Zhang, D.; Wang, Y.D.; Xing, X.H.; Li, Z.C. Assessment of wind energy potential in China. Eng. Sci. 2009, 7, 18–26. [Google Scholar]
  21. Jin, S.L.; Feng, S.L.; Wang, B.; Hu, J.; Ma, Z.Q.; Song, Z.P. Assessment of offshore wind resource in China using CFSR data. Adv. Mater. Res. 2014, 1070–1072, 303–308. [Google Scholar]
  22. Wu, S.M.; Liu, J.L.; Zhang, G.; Han, B.; Wu, R.H.; Chen, D. Evaluation of NCEP-CFSv2, ERA5, and CCMP wind datasets against buoy observations over Zhejiang nearshore waters. Ocean Eng. 2022, 259, 111832. [Google Scholar] [CrossRef]
  23. Hong, B.; Zhang, J. Long-Term Trends of Sea Surface Wind in the Northern South China Sea under the Background of Climate Change. J. Mar. Sci. Eng. 2021, 9, 752. [Google Scholar] [CrossRef]
  24. Olauson, J. ERA5: The new champion of wind power modelling? Renew. Energy 2018, 126, 322–331. [Google Scholar] [CrossRef]
  25. Groisman, P.Y.; Knight, R.W.; Karl, T.R.; Easterling, D.R.; Sun, B.; Lawrimore, J.H. Contemporary Changes of the Hydrological Cycle over the Contiguous United States: Trends Derived from In Situ Observations. Am. Meteorol. Soc. 2004, 5, 64–85. [Google Scholar] [CrossRef]
  26. Pryor, S.C.; Barthelmie, R.J.; Kjellström, E. Potential climate change impact on wind energy resources in northern Europe: Analyses using a regional climate model. Clim. Dyn. 2005, 25, 815–835. [Google Scholar] [CrossRef]
  27. Pryor, S.C.; Schoof, J.T.; Barthelmie, R.J. Climate change impacts on wind speeds and wind energy density in northern Europe: Empirical downscaling of multiple AOGCMs. Clim. Res. 2005, 29, 183–198. [Google Scholar] [CrossRef]
  28. Sailor, D.J.; Smith, M.; Hart, M. Climate change implications for wind power resources in the Northwest United States. Renew. Energy 2008, 33, 2393–2406. [Google Scholar] [CrossRef]
  29. García-Bustamante, E.; González-Rouco, J.F.; Jiménez, P.A.; Navarro, J.; Montávez, J.P. A comparison of methodologies for monthly wind energy estimation. Wind Energy 2009, 12, 640–659. [Google Scholar] [CrossRef]
  30. McVicar, T.R.; Roderick, M.L.; Donohue, R.J.; Li, L.T.; Van Niel, T.G.; Thomas, A.; Grieser, J.; Jhajharia, D.; Himri, Y.; Mahowald, N.M.; et al. Global review and synthesis of trends in observed terrestrial near-surface wind speeds: Implications for evaporation. J. Hydrol. 2012, 416–417, 182–205. [Google Scholar] [CrossRef]
  31. Soldatenko, S.; Karlin, L. The Climate Change Impact on Russia’s Wind Energy Resource: Current Areas of Research. Energy Power Eng. 2014, 6, 371–385. [Google Scholar] [CrossRef]
  32. Wang, J.; Li, X.; Han, X.; Zhang, Y.F.; Wang, C.Q. Analysis of the spatial and temporal distribution characteristics of offshore wind energy resources in China. Ocean Forecast 2022, 39, 55–61. (In Chinese) [Google Scholar]
  33. Wen, Y.; Kamranzad, B.; Lin, P.Z. Assessment of long-term offshore wind energy potential in the south and southeast coasts of China based on a 55-year dataset. Energy 2021, 224, 120225. [Google Scholar] [CrossRef]
  34. Vautard, R.; Cattiaux, J.; Yiou, P.; Thépaut, J.-N.; Ciais, P. Northern Hemisphere atmospheric stilling partly attributed to an increase in surface roughness. Nat. Geosci. 2010, 3, 756–761. [Google Scholar] [CrossRef]
  35. Guo, H.; Xu, M.; Hu, Q. Changes in near-surface wind speed in China: 1969-2005. Int. J. Climatol. A J. R. Meteorol. Soc. 2011, 31, 349–358. [Google Scholar] [CrossRef]
  36. Jiang, Y.; Luo, Y.; Zhao, Z.; Tao, S. Changes in wind speed over China during 1956-2004. Theor. Appl. Cfimatol. 2009, 99, 421–430. [Google Scholar] [CrossRef]
  37. Zha, J.L.; Wu, J.; Zhao, D.M.; Tang, J.P. A possible recovery of the near-surface wind speed in Eastern China during winter after 2000 and the potential causes. Theor. Appl. Cfimatol. 2019, 136, 119–134. [Google Scholar] [CrossRef]
  38. Xu, M.; Chang, C.-P.; Fu, C.; Qi, Y.; Robock, A.; Robinson, D.; Zhang, H.-m. Steady decline of east Asian monsoon winds, 1969–2000: Evidence from direct ground measurements of wind speed. J. Geophys. Res. Atmos. 2006, 111. [Google Scholar] [CrossRef]
  39. Liu, M.; Shen, Y.; Yan, Z.; Liu, C. Trend in pan evaporation and its attribution over the past 50 years in China. J. Geogr. Sci. 2010, 20, 557–568. [Google Scholar] [CrossRef]
  40. Liu, Z.; Xu, Z.; Yao, Z.; Huang, H. Comparison of surface variables from ERA and NCEP reanalysis with station data over eastern China. Theor. Appl. Cfimatol. 2011, 107, 611–621. [Google Scholar] [CrossRef]
  41. Shi, P.J.; Zhang, G.F.; Kong, F.; Ye, Q. Wind Speed Change Zoning of China from 1961-2012. Prog. Clim. Chang. Res. 2015, 11, 387–394. (In Chinese) [Google Scholar]
  42. Adekunle, O.; Lin, X.P.; Zhao, D.L.; Wang, Z.F. Wind Energy Potentials and Its Trend in the South China Sea. Energy Environ. Res. 2016, 6, 36. [Google Scholar]
  43. Liu, Y.Y.; Zhang, D.Y.; Zhang, Y.Z.; Wang, G.Q. Analysis of the spatial and temporal change characteristics and influencing factors of wind energy resources in Hexi Corridor from 1958 to 2012. Agric. Resour. Reg. China 2016, 37, 188–195. (In Chinese) [Google Scholar]
  44. Zhao, K.; Jiang, Y.; Li, C.B.; Wu, J.; Huang, F.X. Study on Long-term Change Characteristics of Wind Energy in 3 Typical Regions of China. Renew. Energy 2015, 33, 1853–1860. (In Chinese) [Google Scholar]
  45. de Sousa Gomes, M.S.; de Paiva, J.M.F.; da Silva Moris, V.A.; Nunes, A.O. Proposal of a methodology to use offshore wind energy on the southeast coast of Brazil. Energy 2019, 185, 327–336. [Google Scholar] [CrossRef]
  46. Jiang, B.; Wei, Y.L.; Ding, J.; Zhang, R.; Liu, Y.X.; Wang, X.Y.; Fang, Y.Z. Trends of sea surface wind energy over the South China Sea. J. Oceanol. Limnol. 2019, 37, 1510–1522. [Google Scholar] [CrossRef]
Figure 1. The flowchart utilized for this work.
Atmosphere 14 00362 g001
Figure 2. The annual mean distribution of wind (shaded, vector, and unit: m·s−1) and wind power density (contour, unit: W·m−2) over the SCS from 1979 to 2021.
Atmosphere 14 00362 g002
Figure 3. The seasonal mean distribution of wind (shaded, vector, and unit: m·s−1) and wind power density (contour, unit: W·m−2) over the SCS from 1979 to 2021.
Atmosphere 14 00362 g003
Figure 4. The monthly mean distribution of wind (shaded, vector, and unit: m·s−1) and wind power density (contour, unit: W·m−2) over the SCS from 1979 to 2021.
Atmosphere 14 00362 g004
Figure 5. The linear variation trends of the annual mean wind ((a), unit: m·s−1·(10a)−1) and wind power density ((b), unit: W·m−2·(10a)−1) over the SCS from 1979 to 2021. The black dots indicate the significant areas with more than a 95% confidence level (which was achieved by using Student’s t-test).
Atmosphere 14 00362 g005
Figure 6. The linear variation trends of the seasonal mean wind ((ad), unit: m·s−1·(10a)−1) and the wind power density ((bh), unit: W·m−2·(10a)−1) over the SCS from 1979 to 2021. The black dots indicate the significant areas with more than a 95% confidence level (which was achieved through using Student’s t-test). Moreover, (a,e): winter; (b,f): spring; (c,g): summer; and (d,h): autumn.
Atmosphere 14 00362 g006
Figure 7. The linear variation trends of the monthly mean wind ((ac), unit: m·s−1·(10a)−1) and wind power density ((bf), unit: W·m−2·(10a)−1) over the SCS from 1979 to 2021. The black dots indicate the significant areas with more than a 95% confidence level (which was achieved by using Student’s t-test). (a,d): December; (b,e): January; and (c,f): February.
Atmosphere 14 00362 g007
Figure 8. As in Figure 7, but for March (a,d), April (b,e), and May (c,f).
Atmosphere 14 00362 g008
Figure 9. As in Figure 7, but for June (a,d), July (b,e), and August (c,f).
Atmosphere 14 00362 g009
Figure 10. As in Figure 7, but for September (a,d), October (b,e) and November (c,f).
Atmosphere 14 00362 g010
Figure 11. The annual mean distribution of wind (shaded, vector, unit: m·s−1) and wind power density (contour, unit: W·m−2) over the SCS in 2021 (a), the next 5 years (b), and their differences between the next 5 years and 2021 (c).
Atmosphere 14 00362 g011
Disclaimer/Publisher’s Note: The statements, opinions and data contained in all publications are solely those of the individual author(s) and contributor(s) and not of MDPI and/or the editor(s). MDPI and/or the editor(s) disclaim responsibility for any injury to people or property resulting from any ideas, methods, instructions or products referred to in the content.