


Spatiotemporal Evolution and Drivers of the Four Ionospheric Storms over the American Sector during the August 2018 Geomagnetic Storm


Abstract
:1. Introduction
2. Data and Methodology
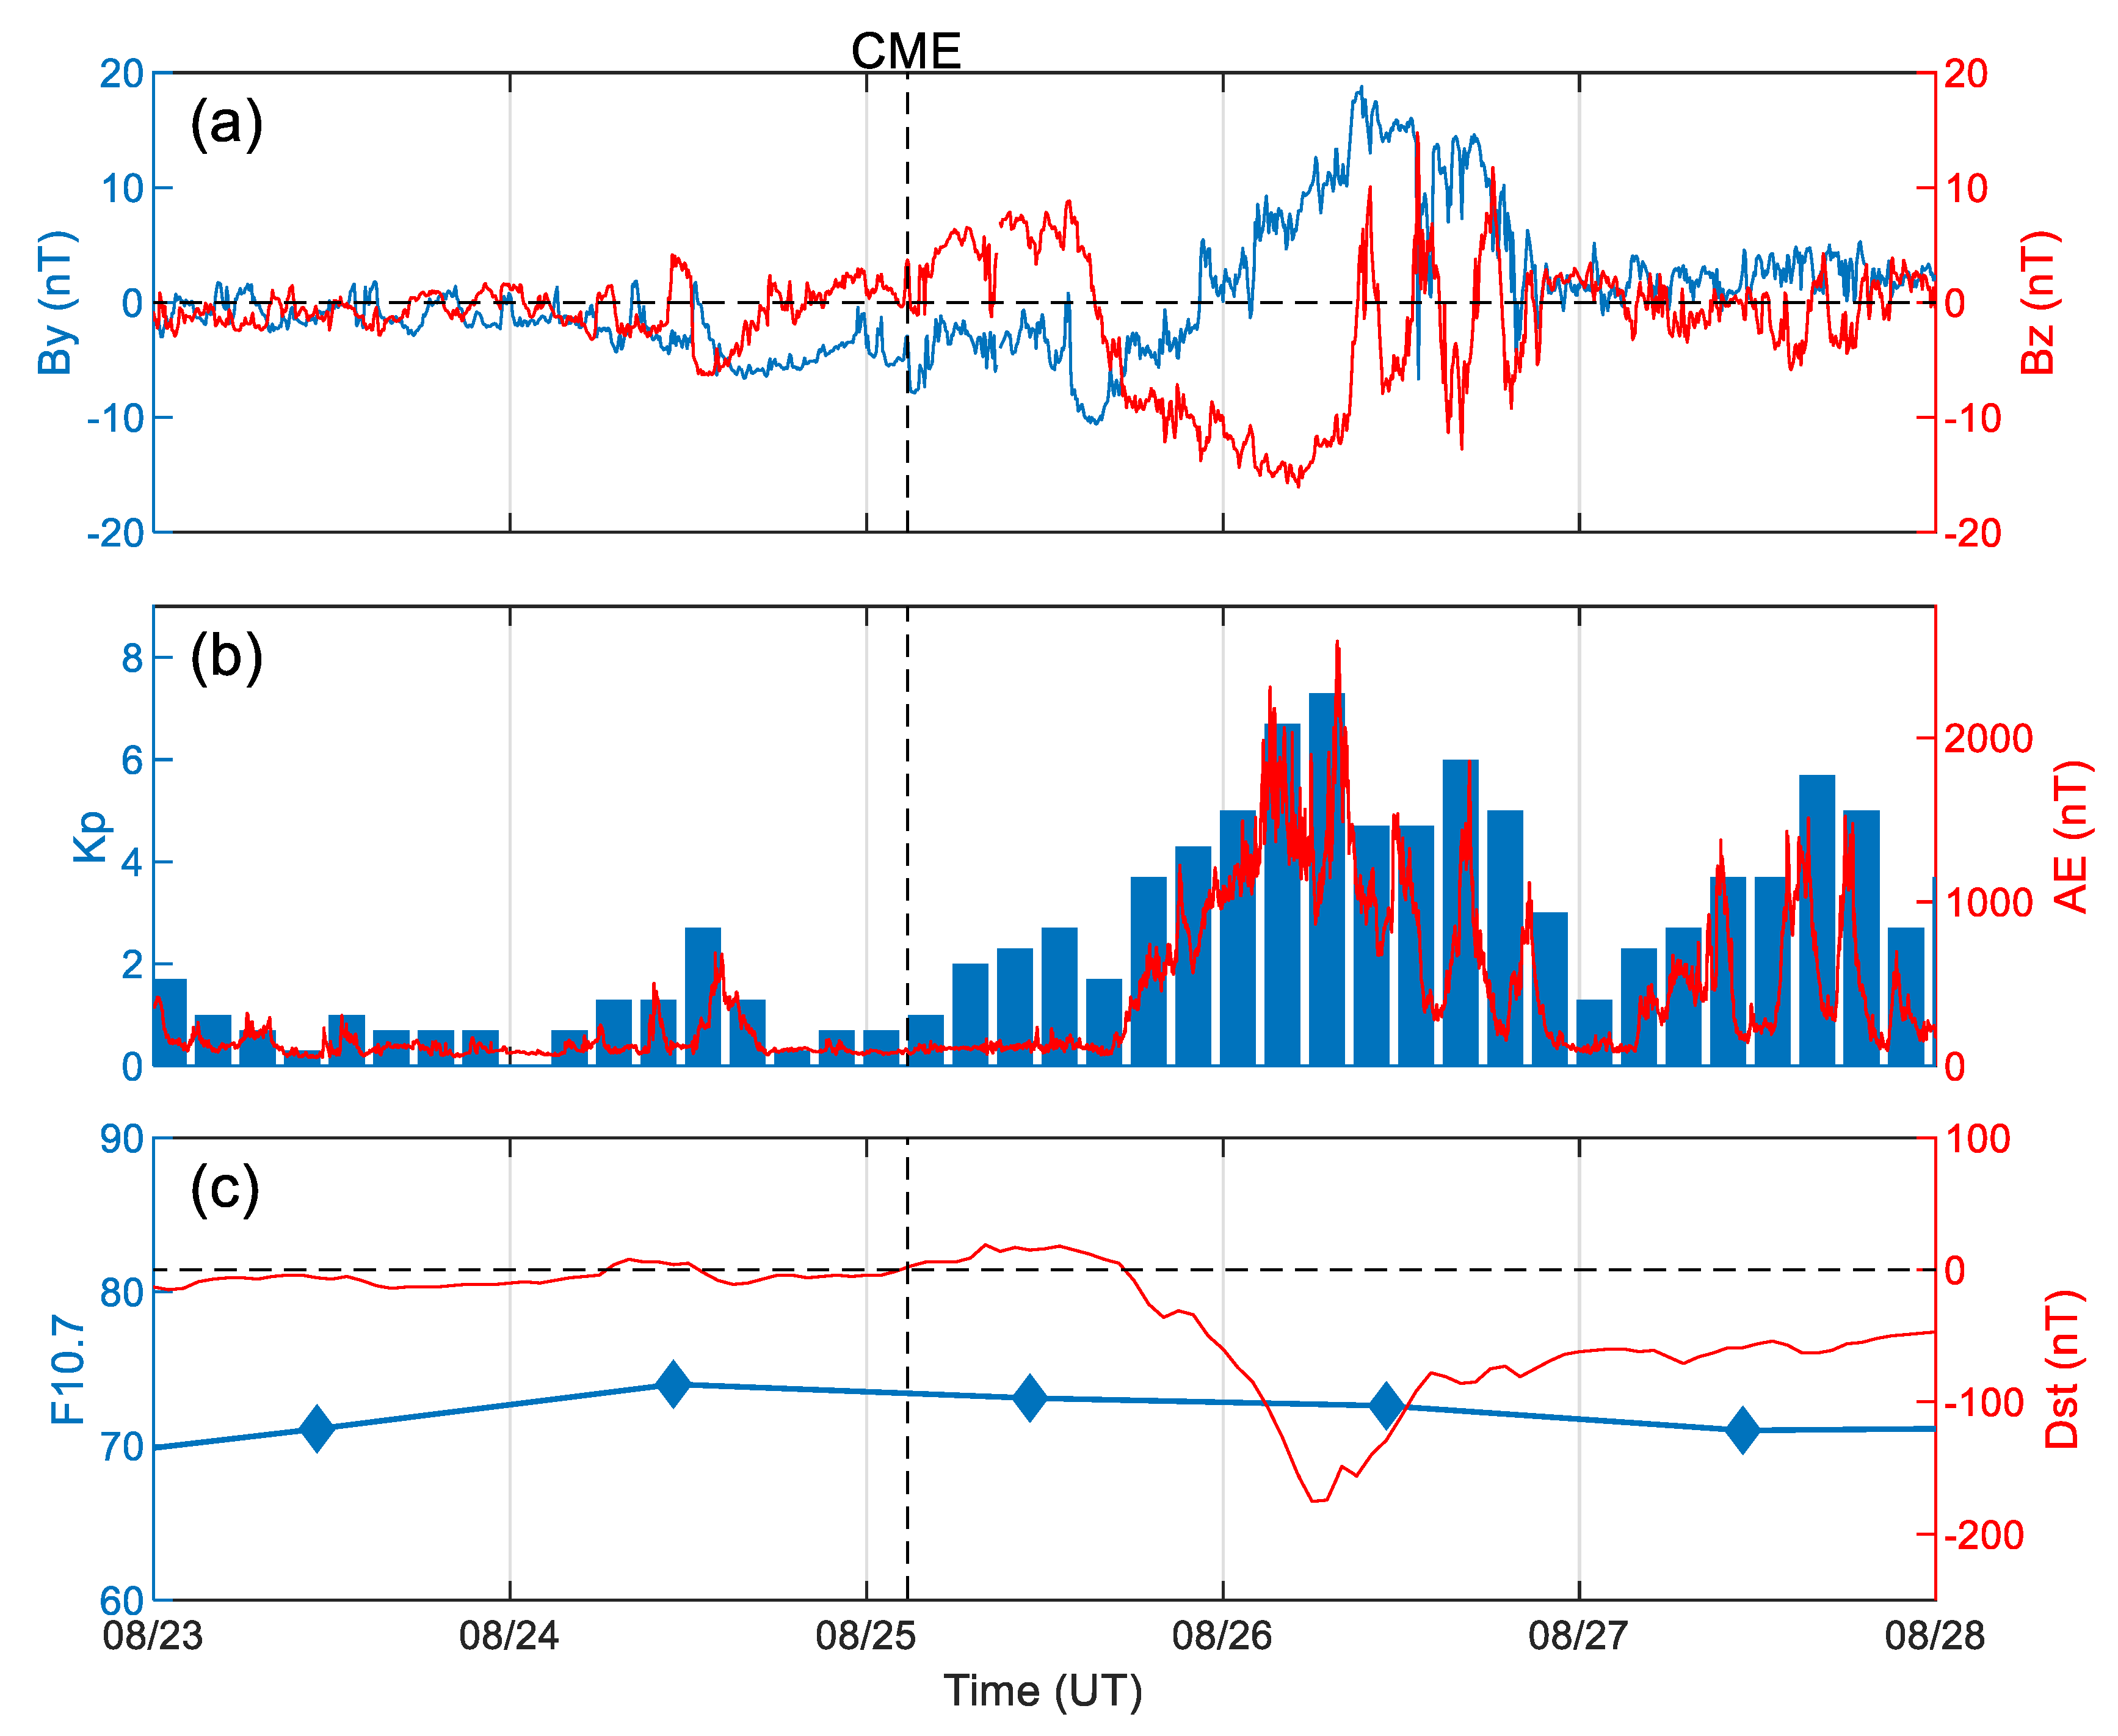
2.1. Geomagnetic Environment Indices
2.2. GNSS VTEC
2.3. Thermospheric ∑O/N2 Composition
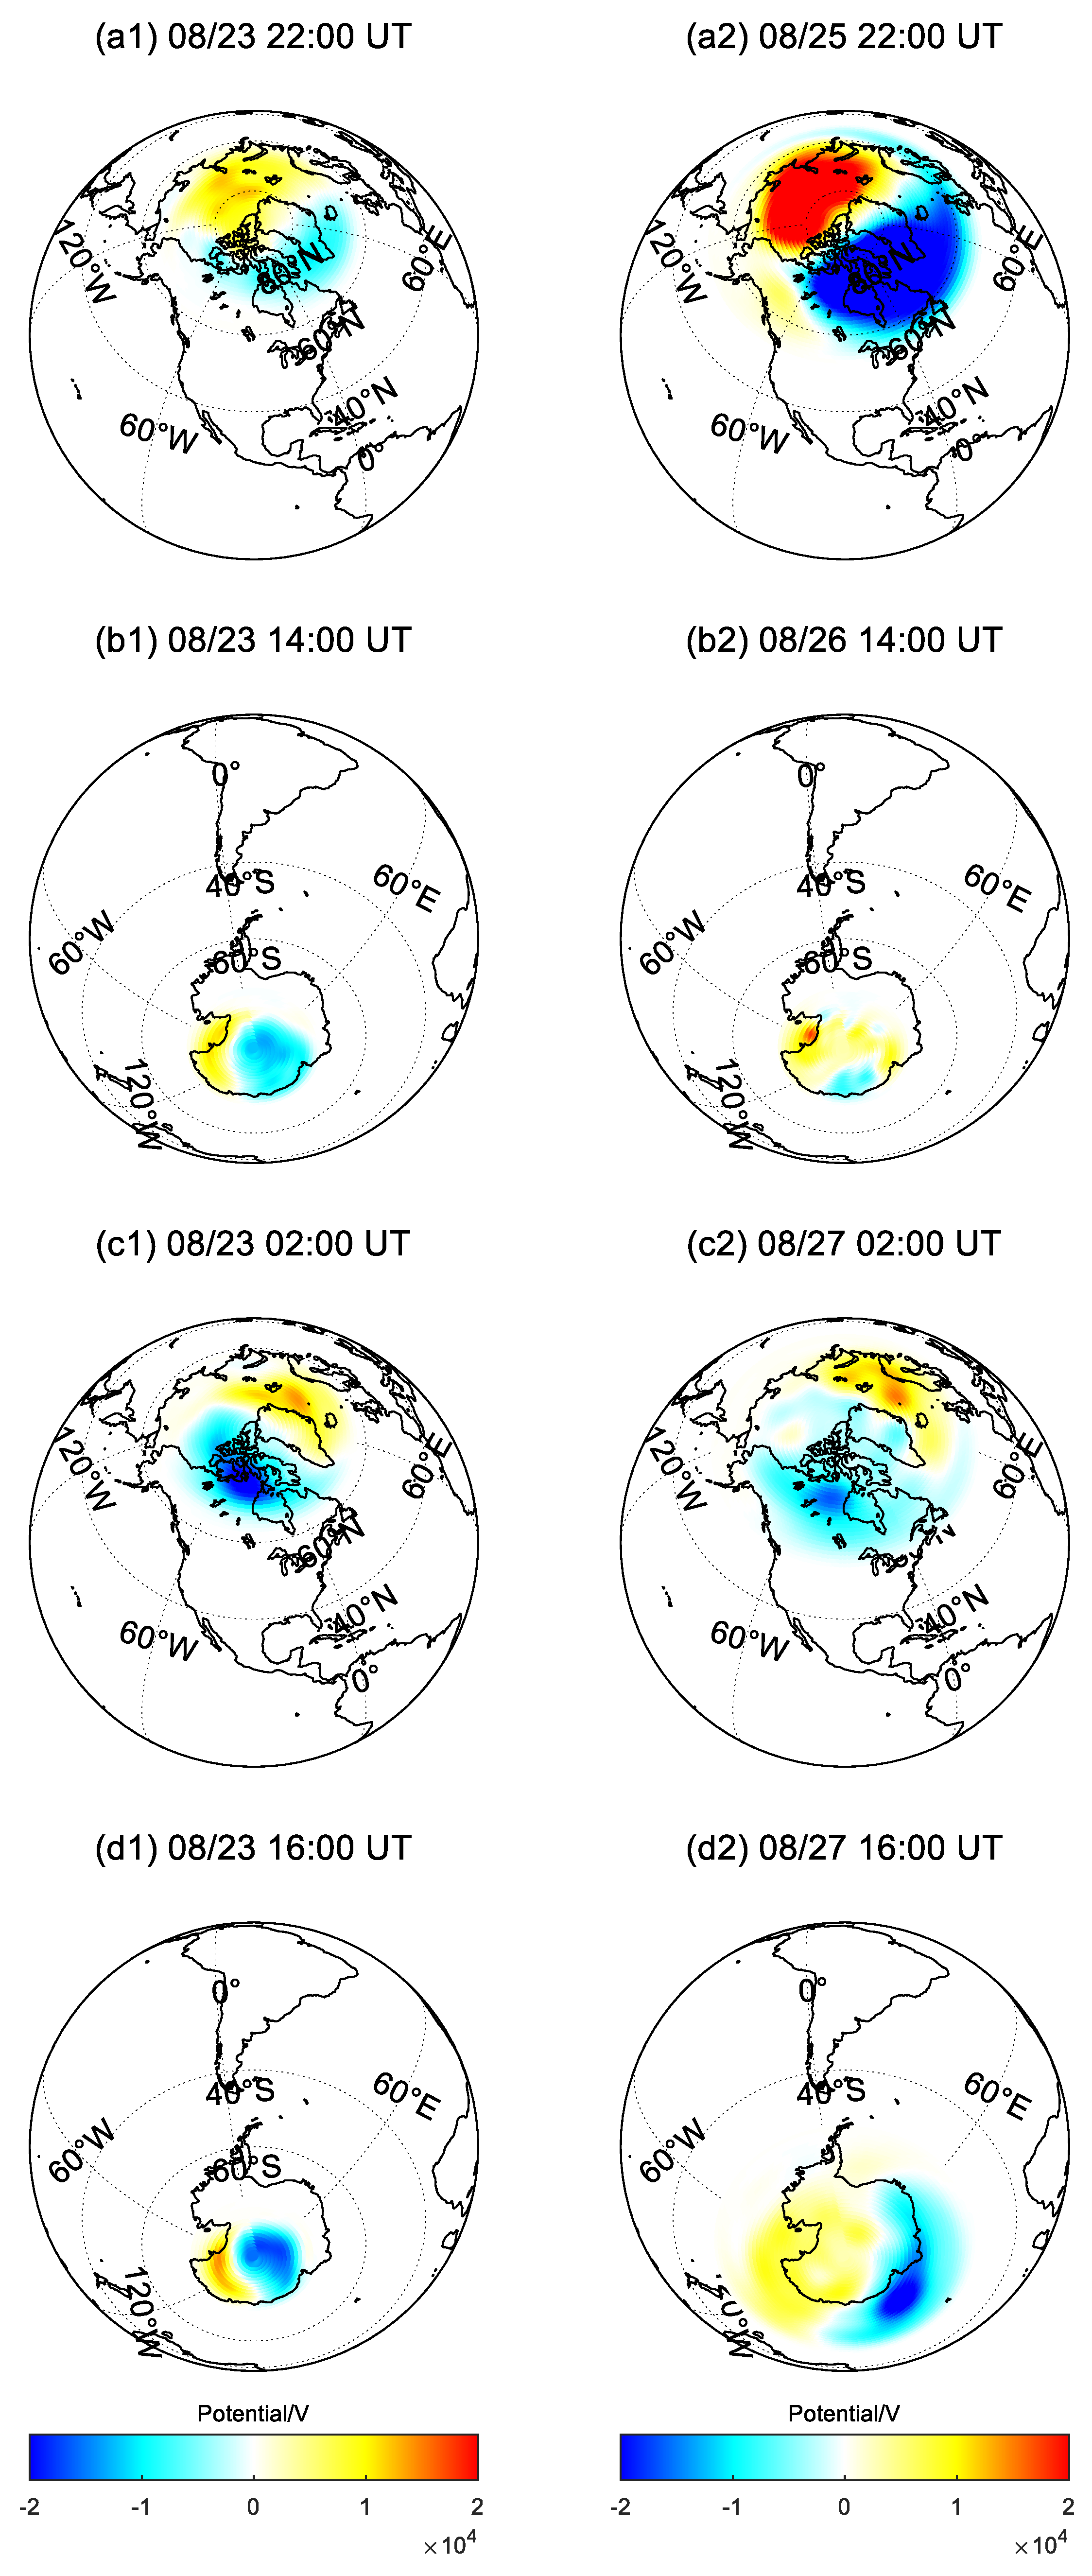
2.4. Polar Cap Potential Map
3. Results
3.1. Event Overview
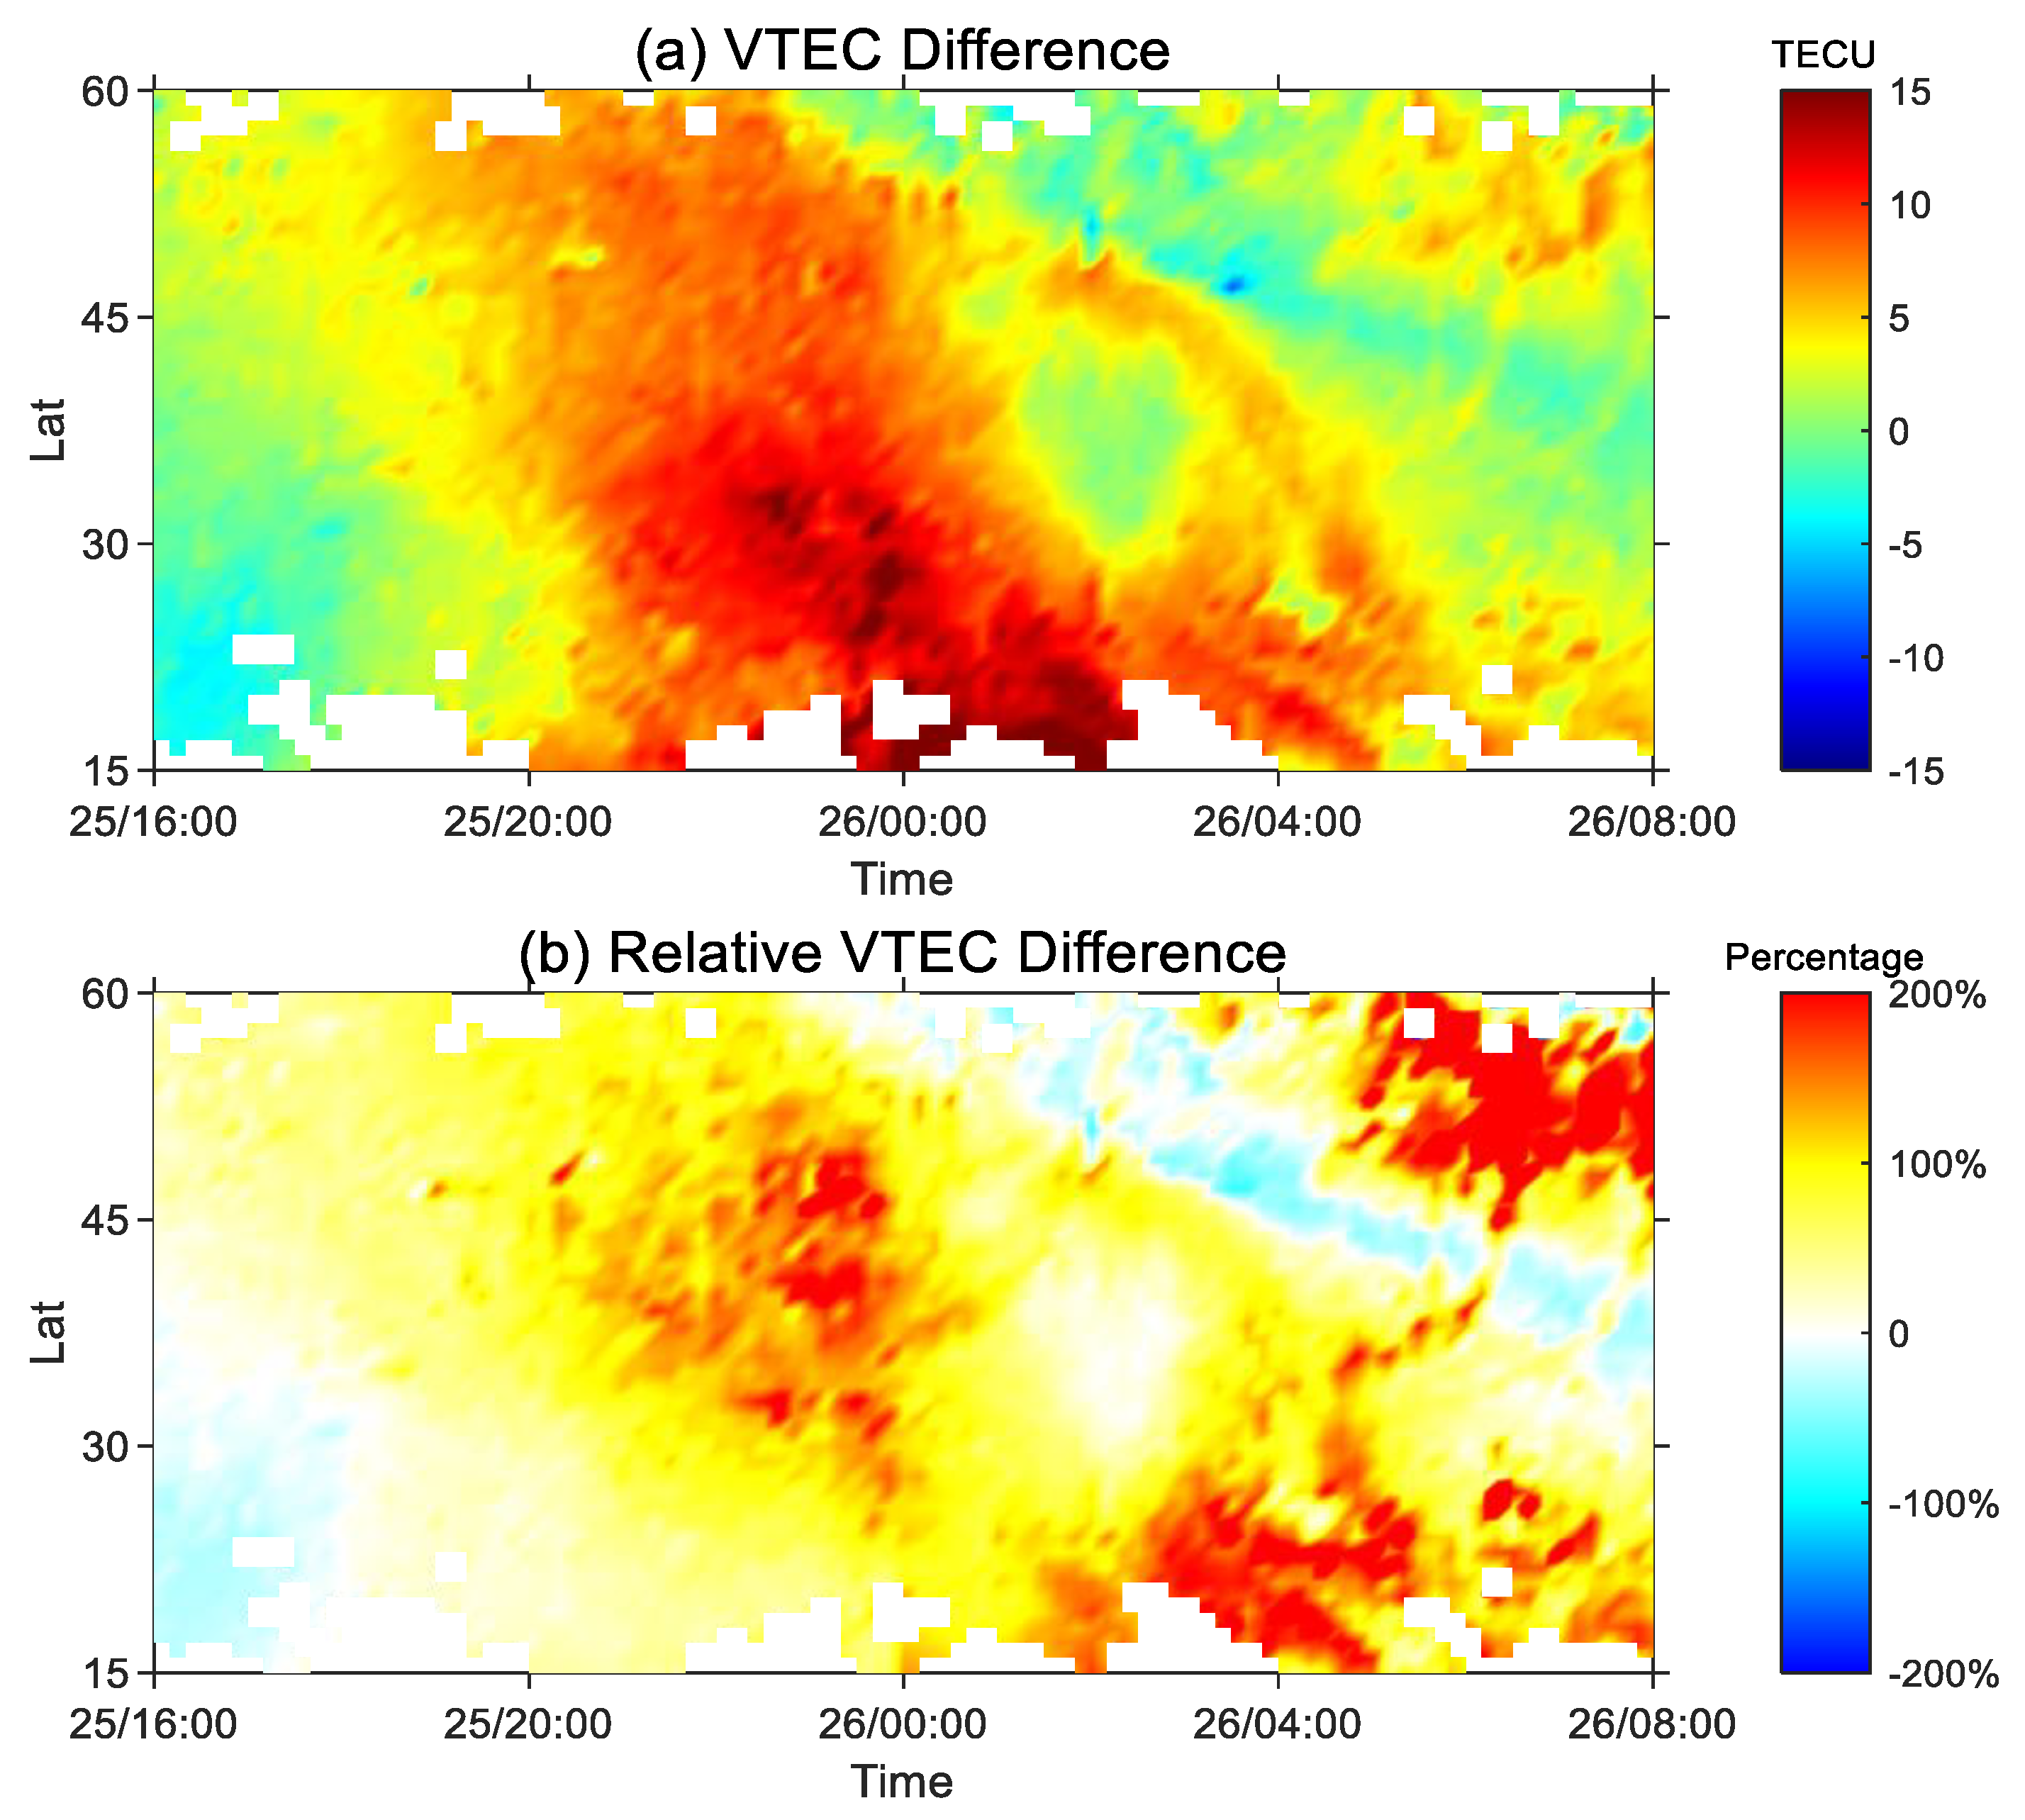
3.2. Storm-1
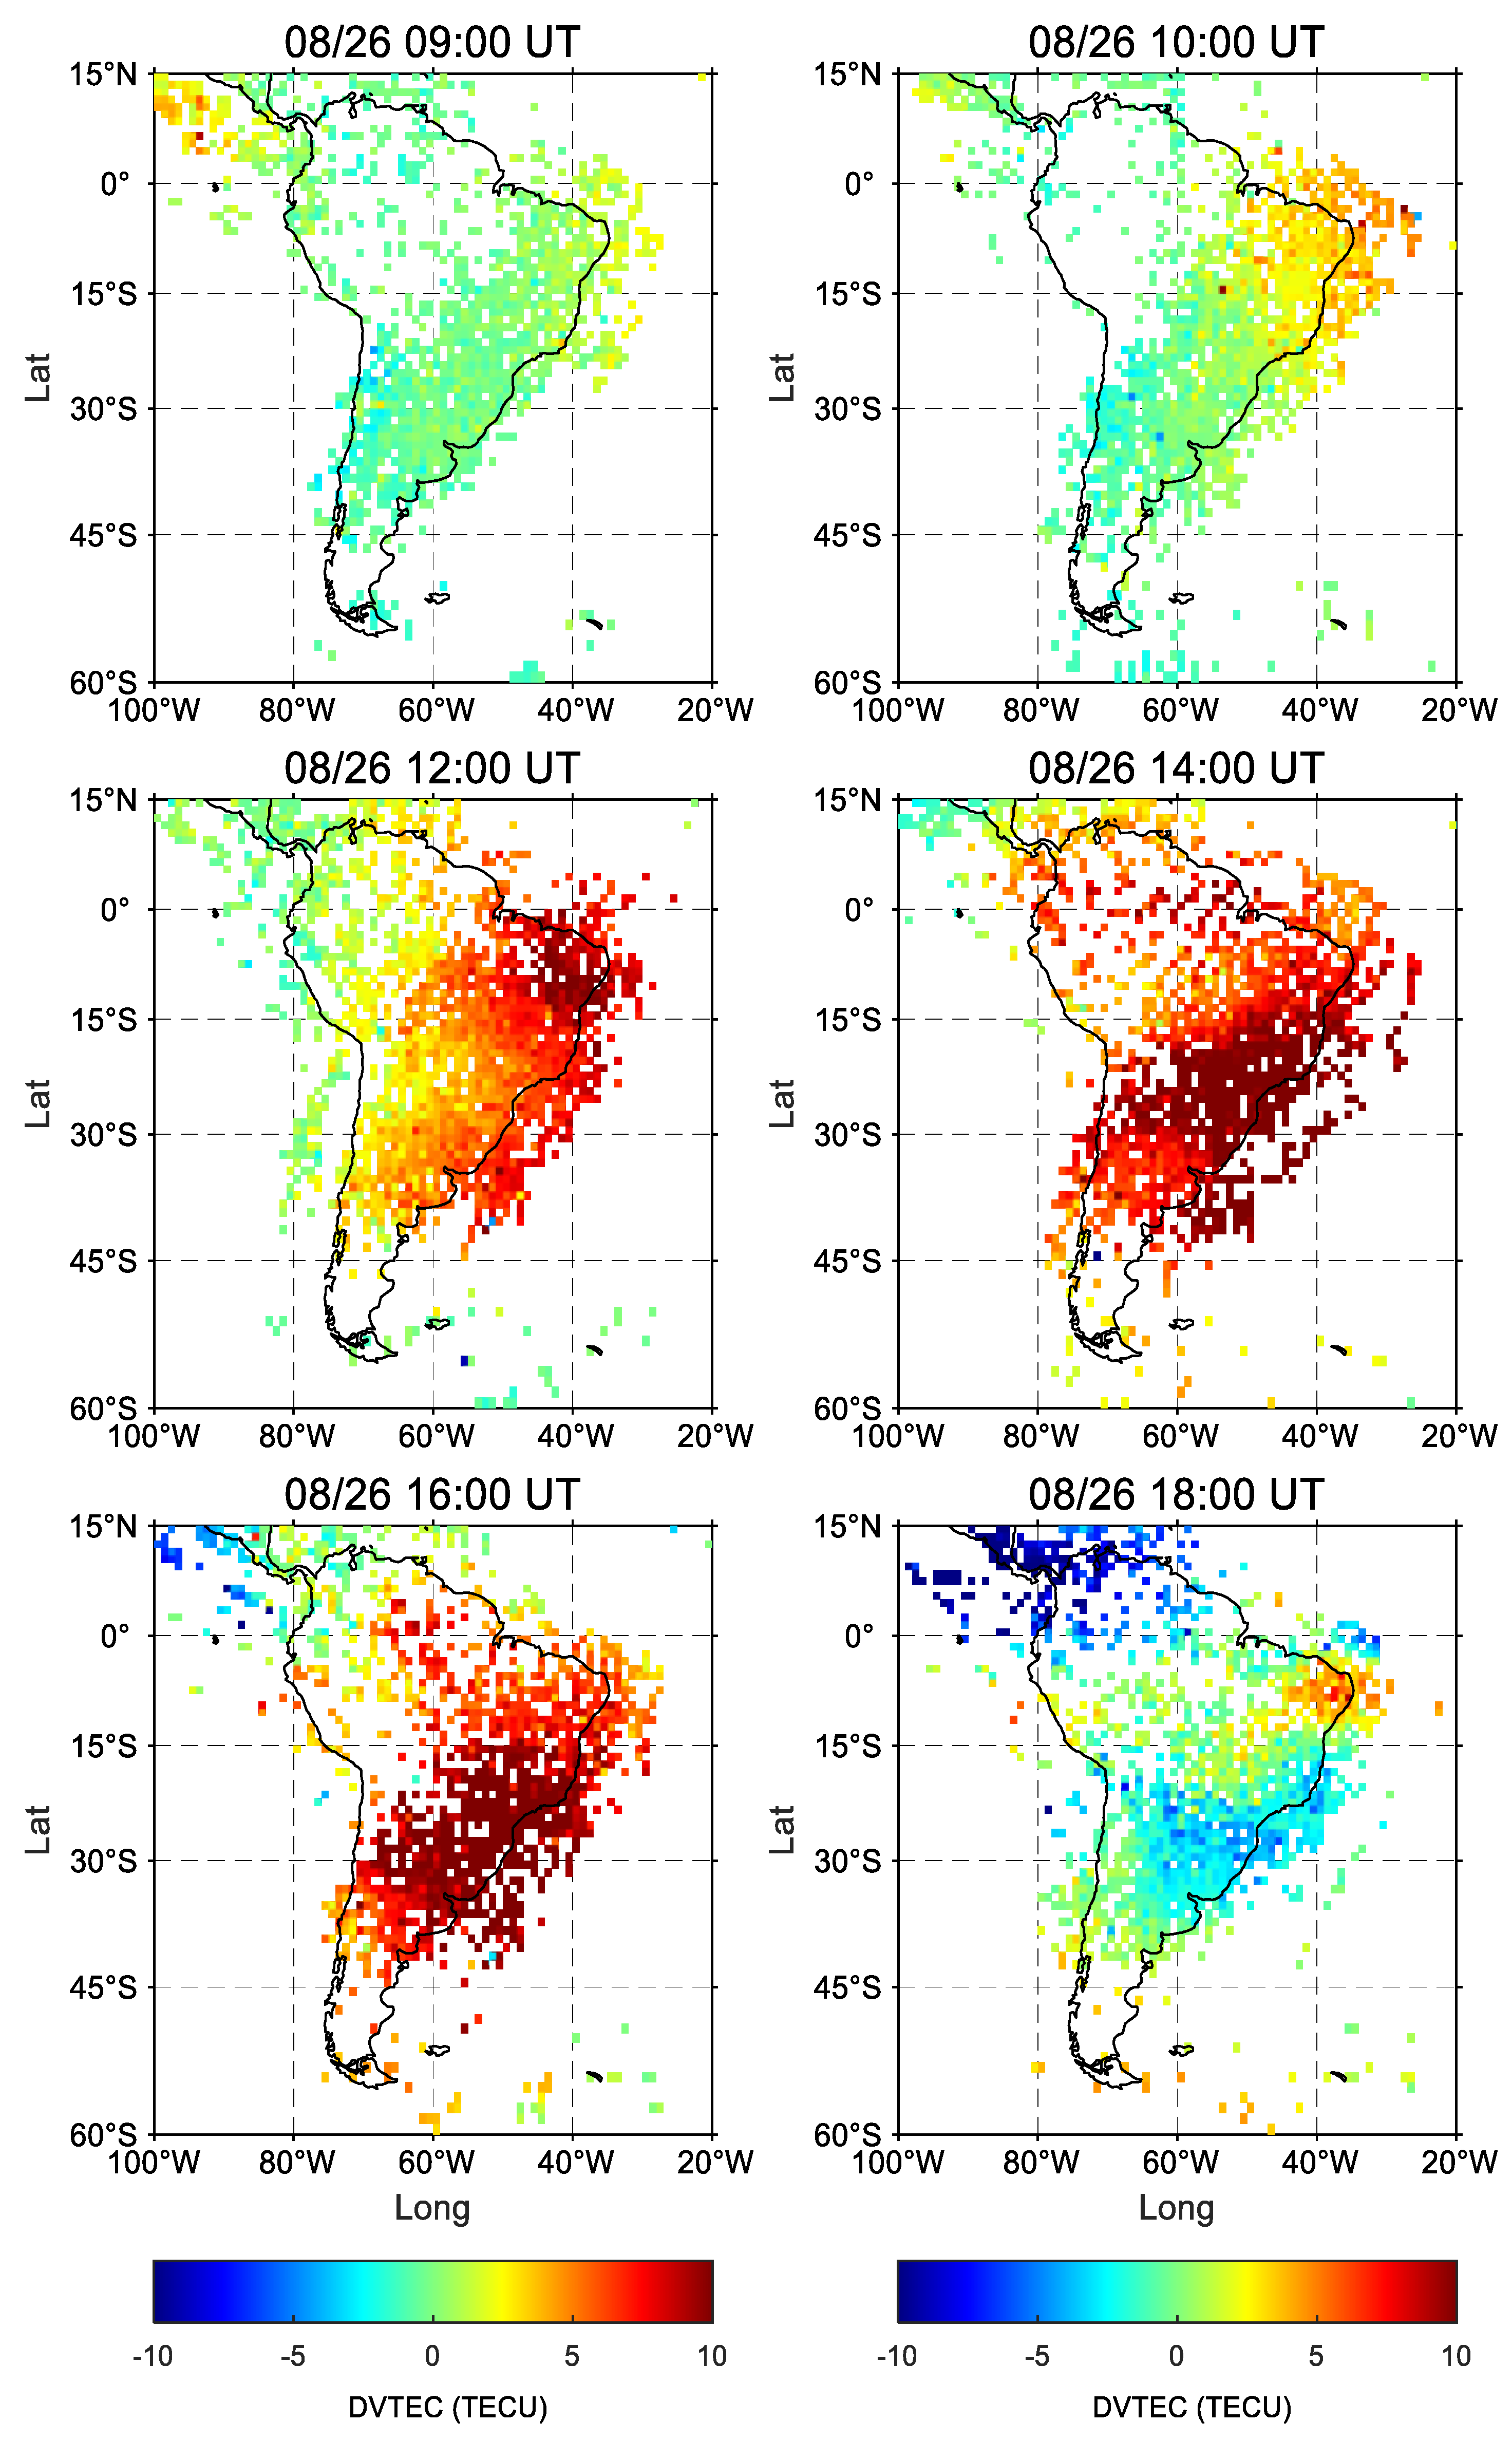
3.3. Storm-2
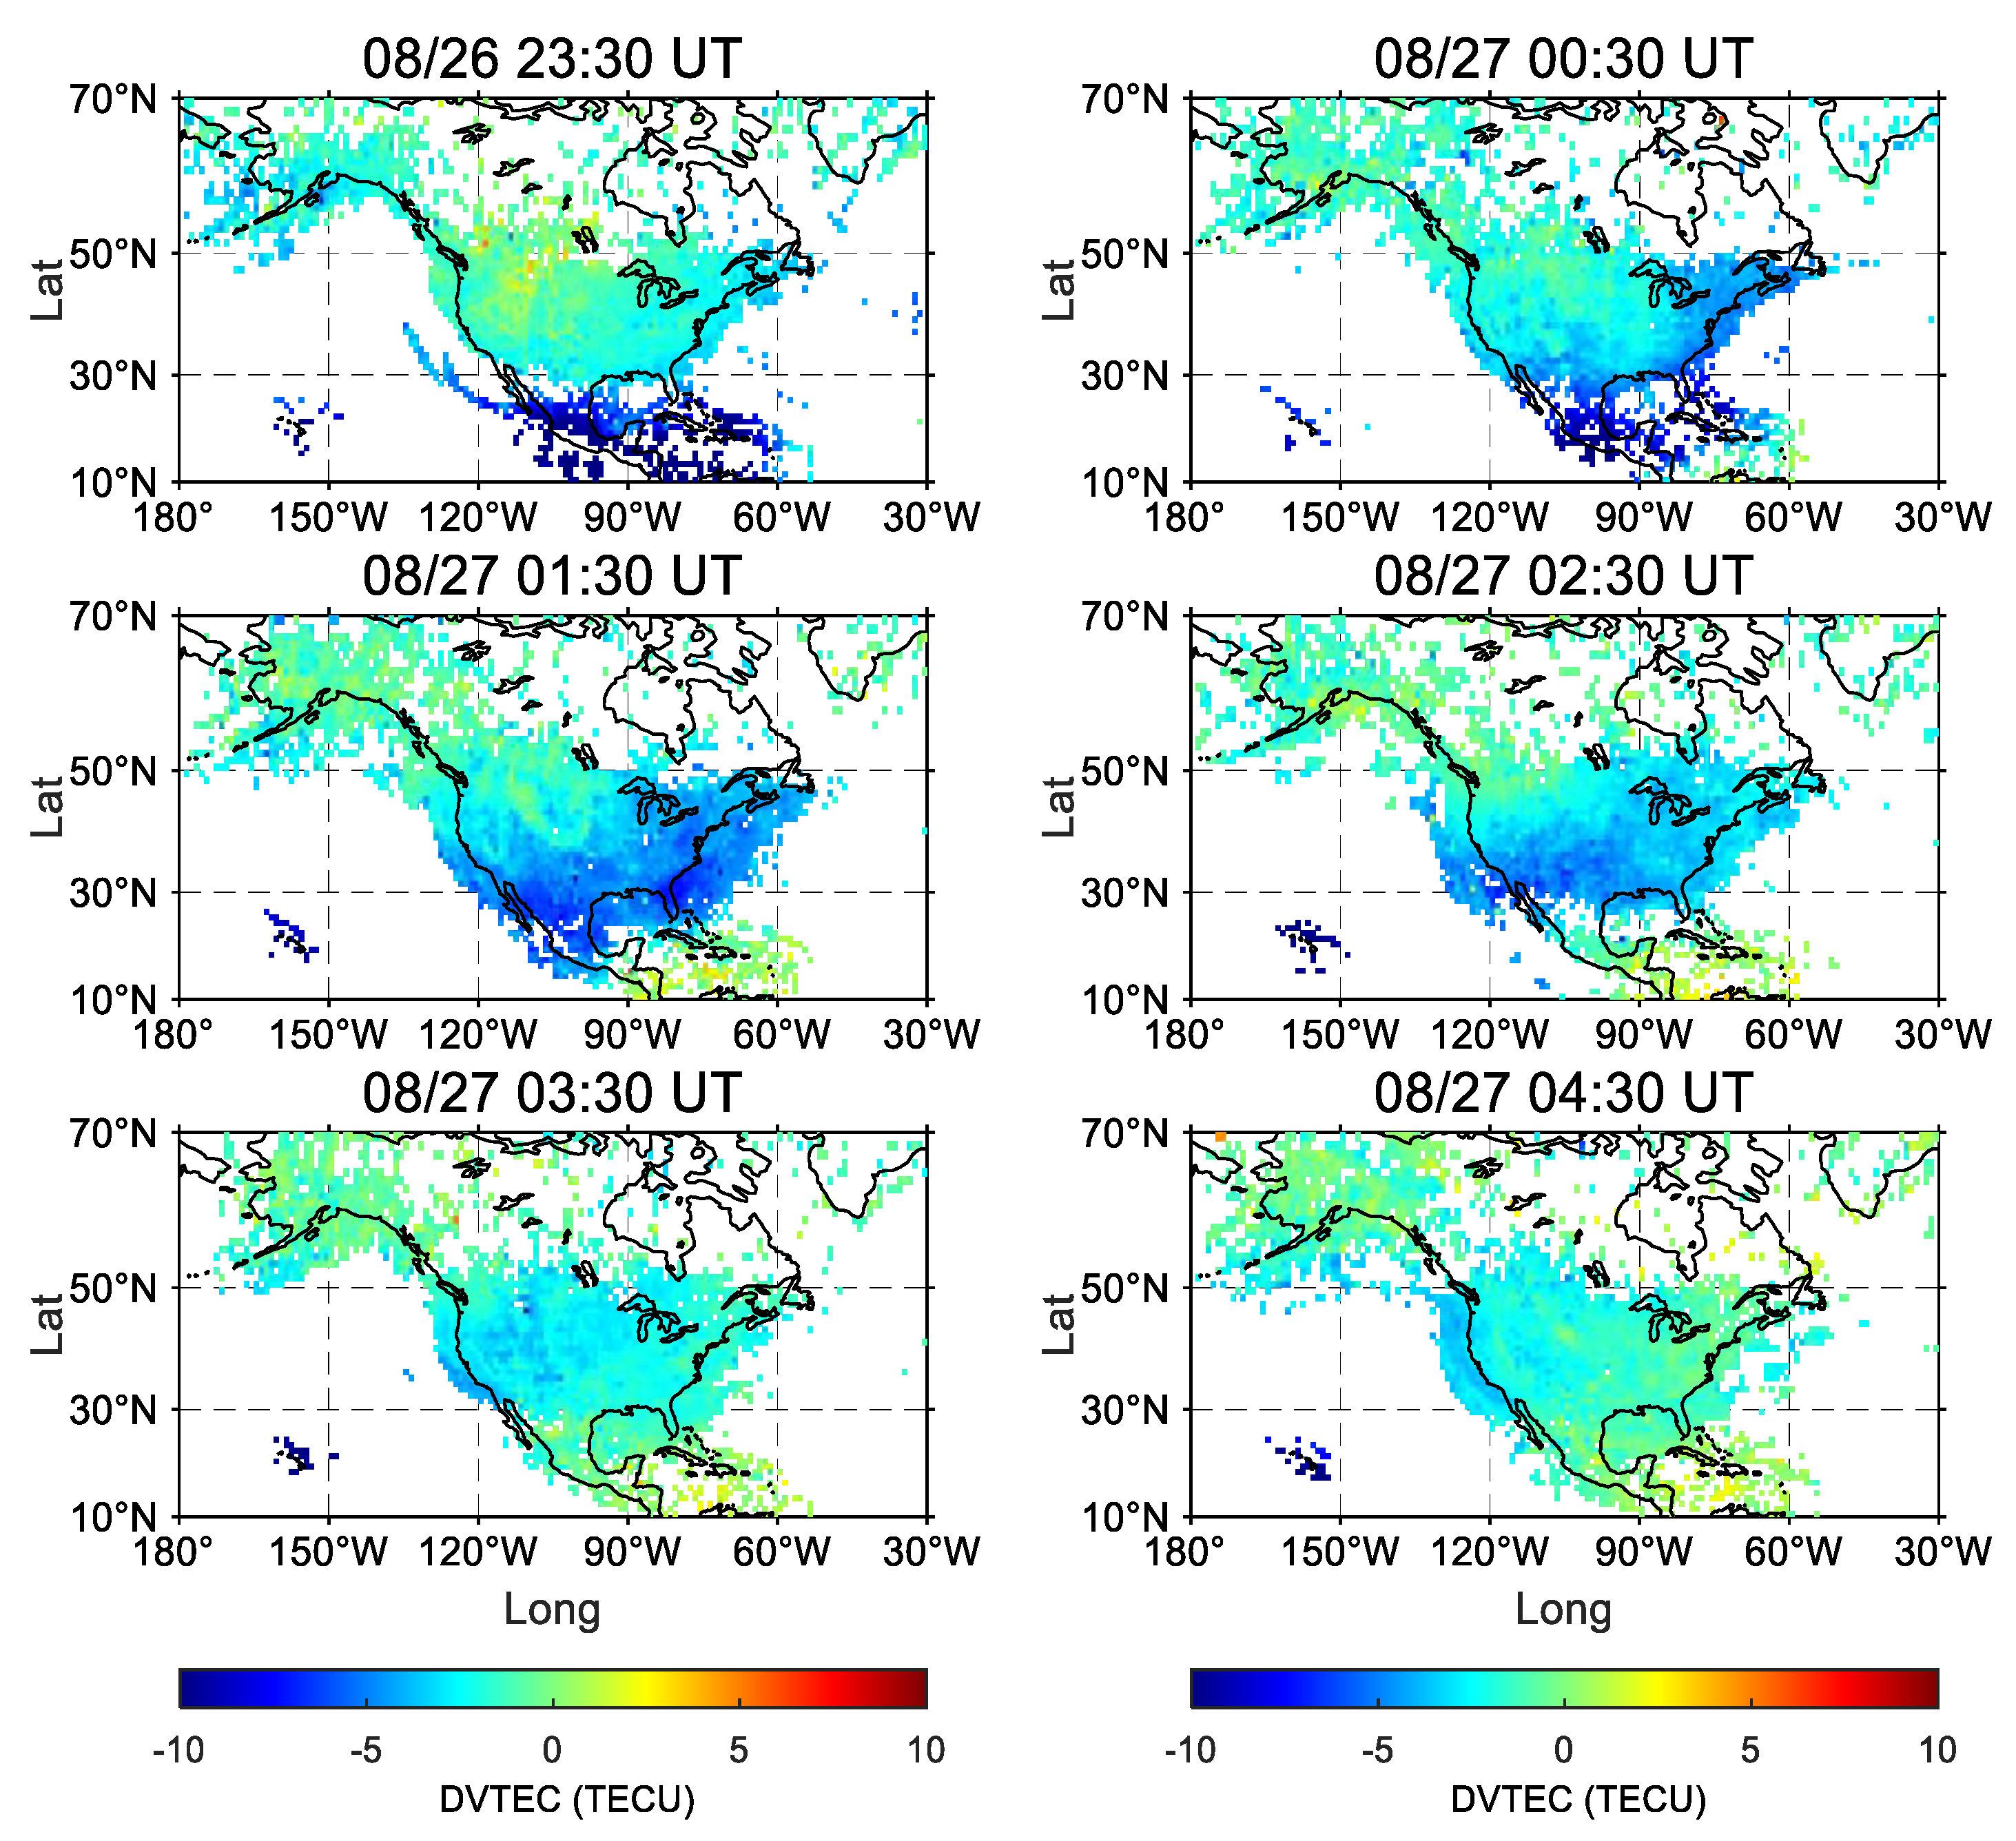
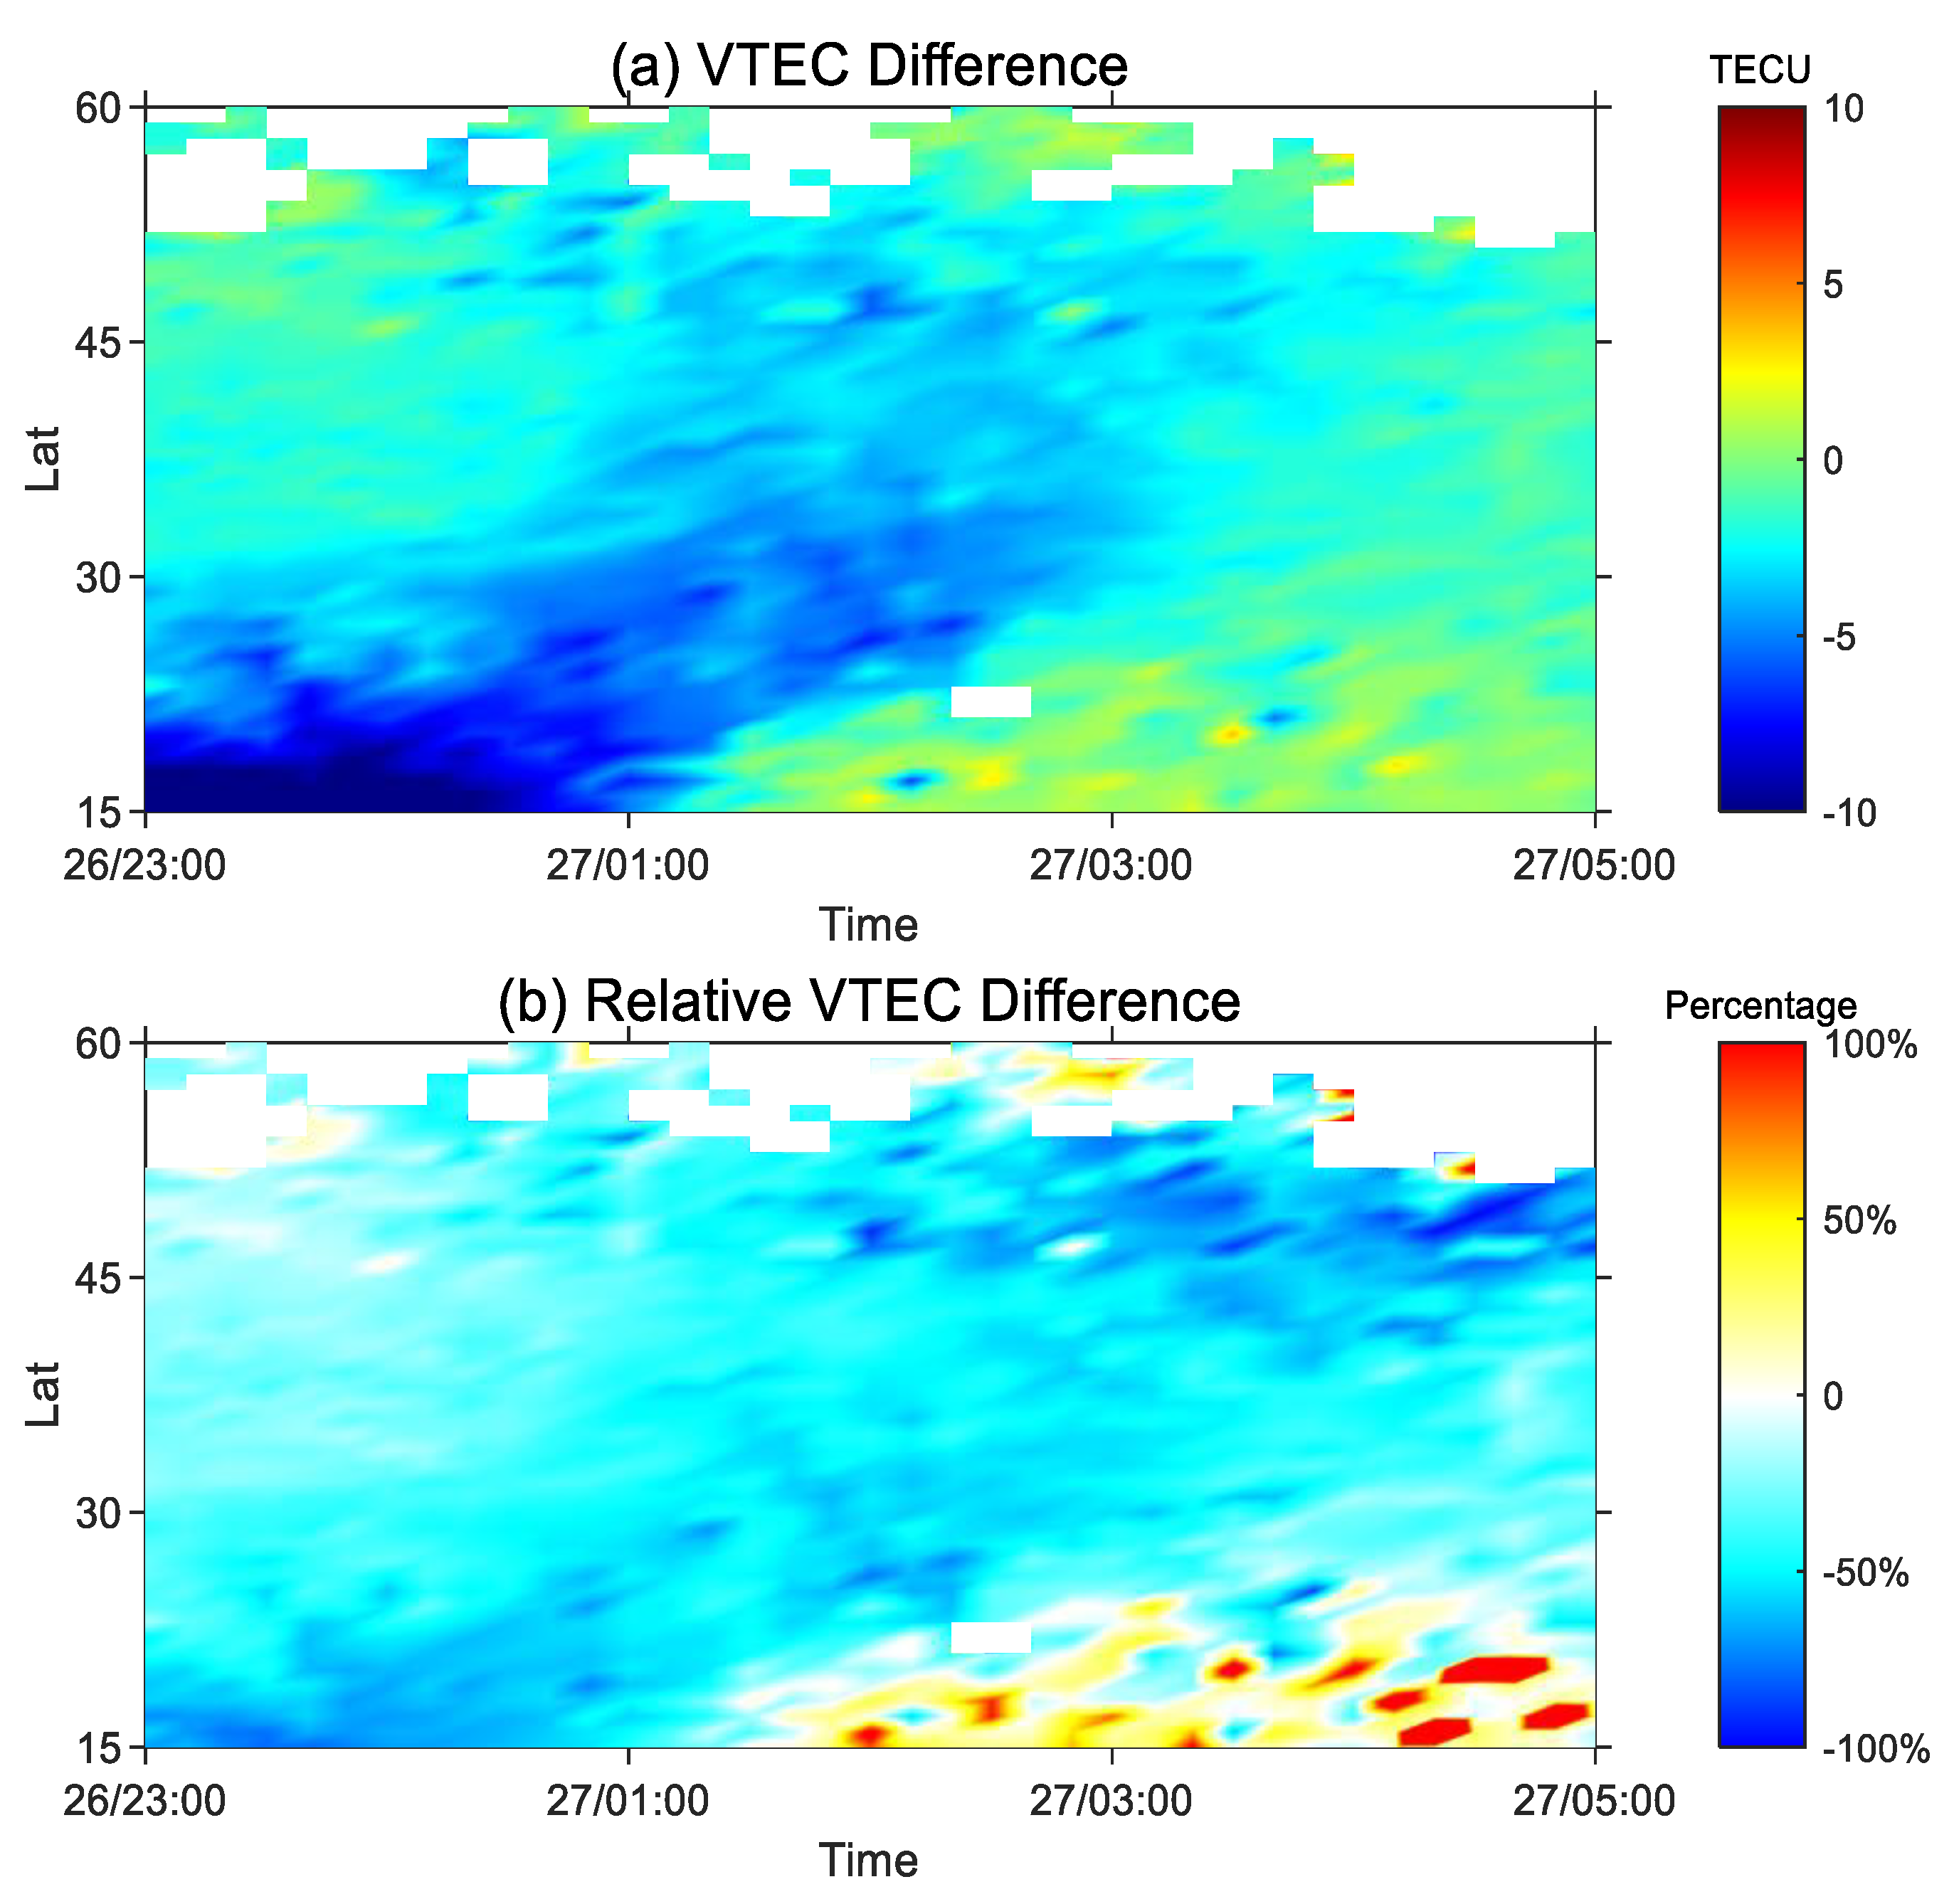
3.4. Storm-3
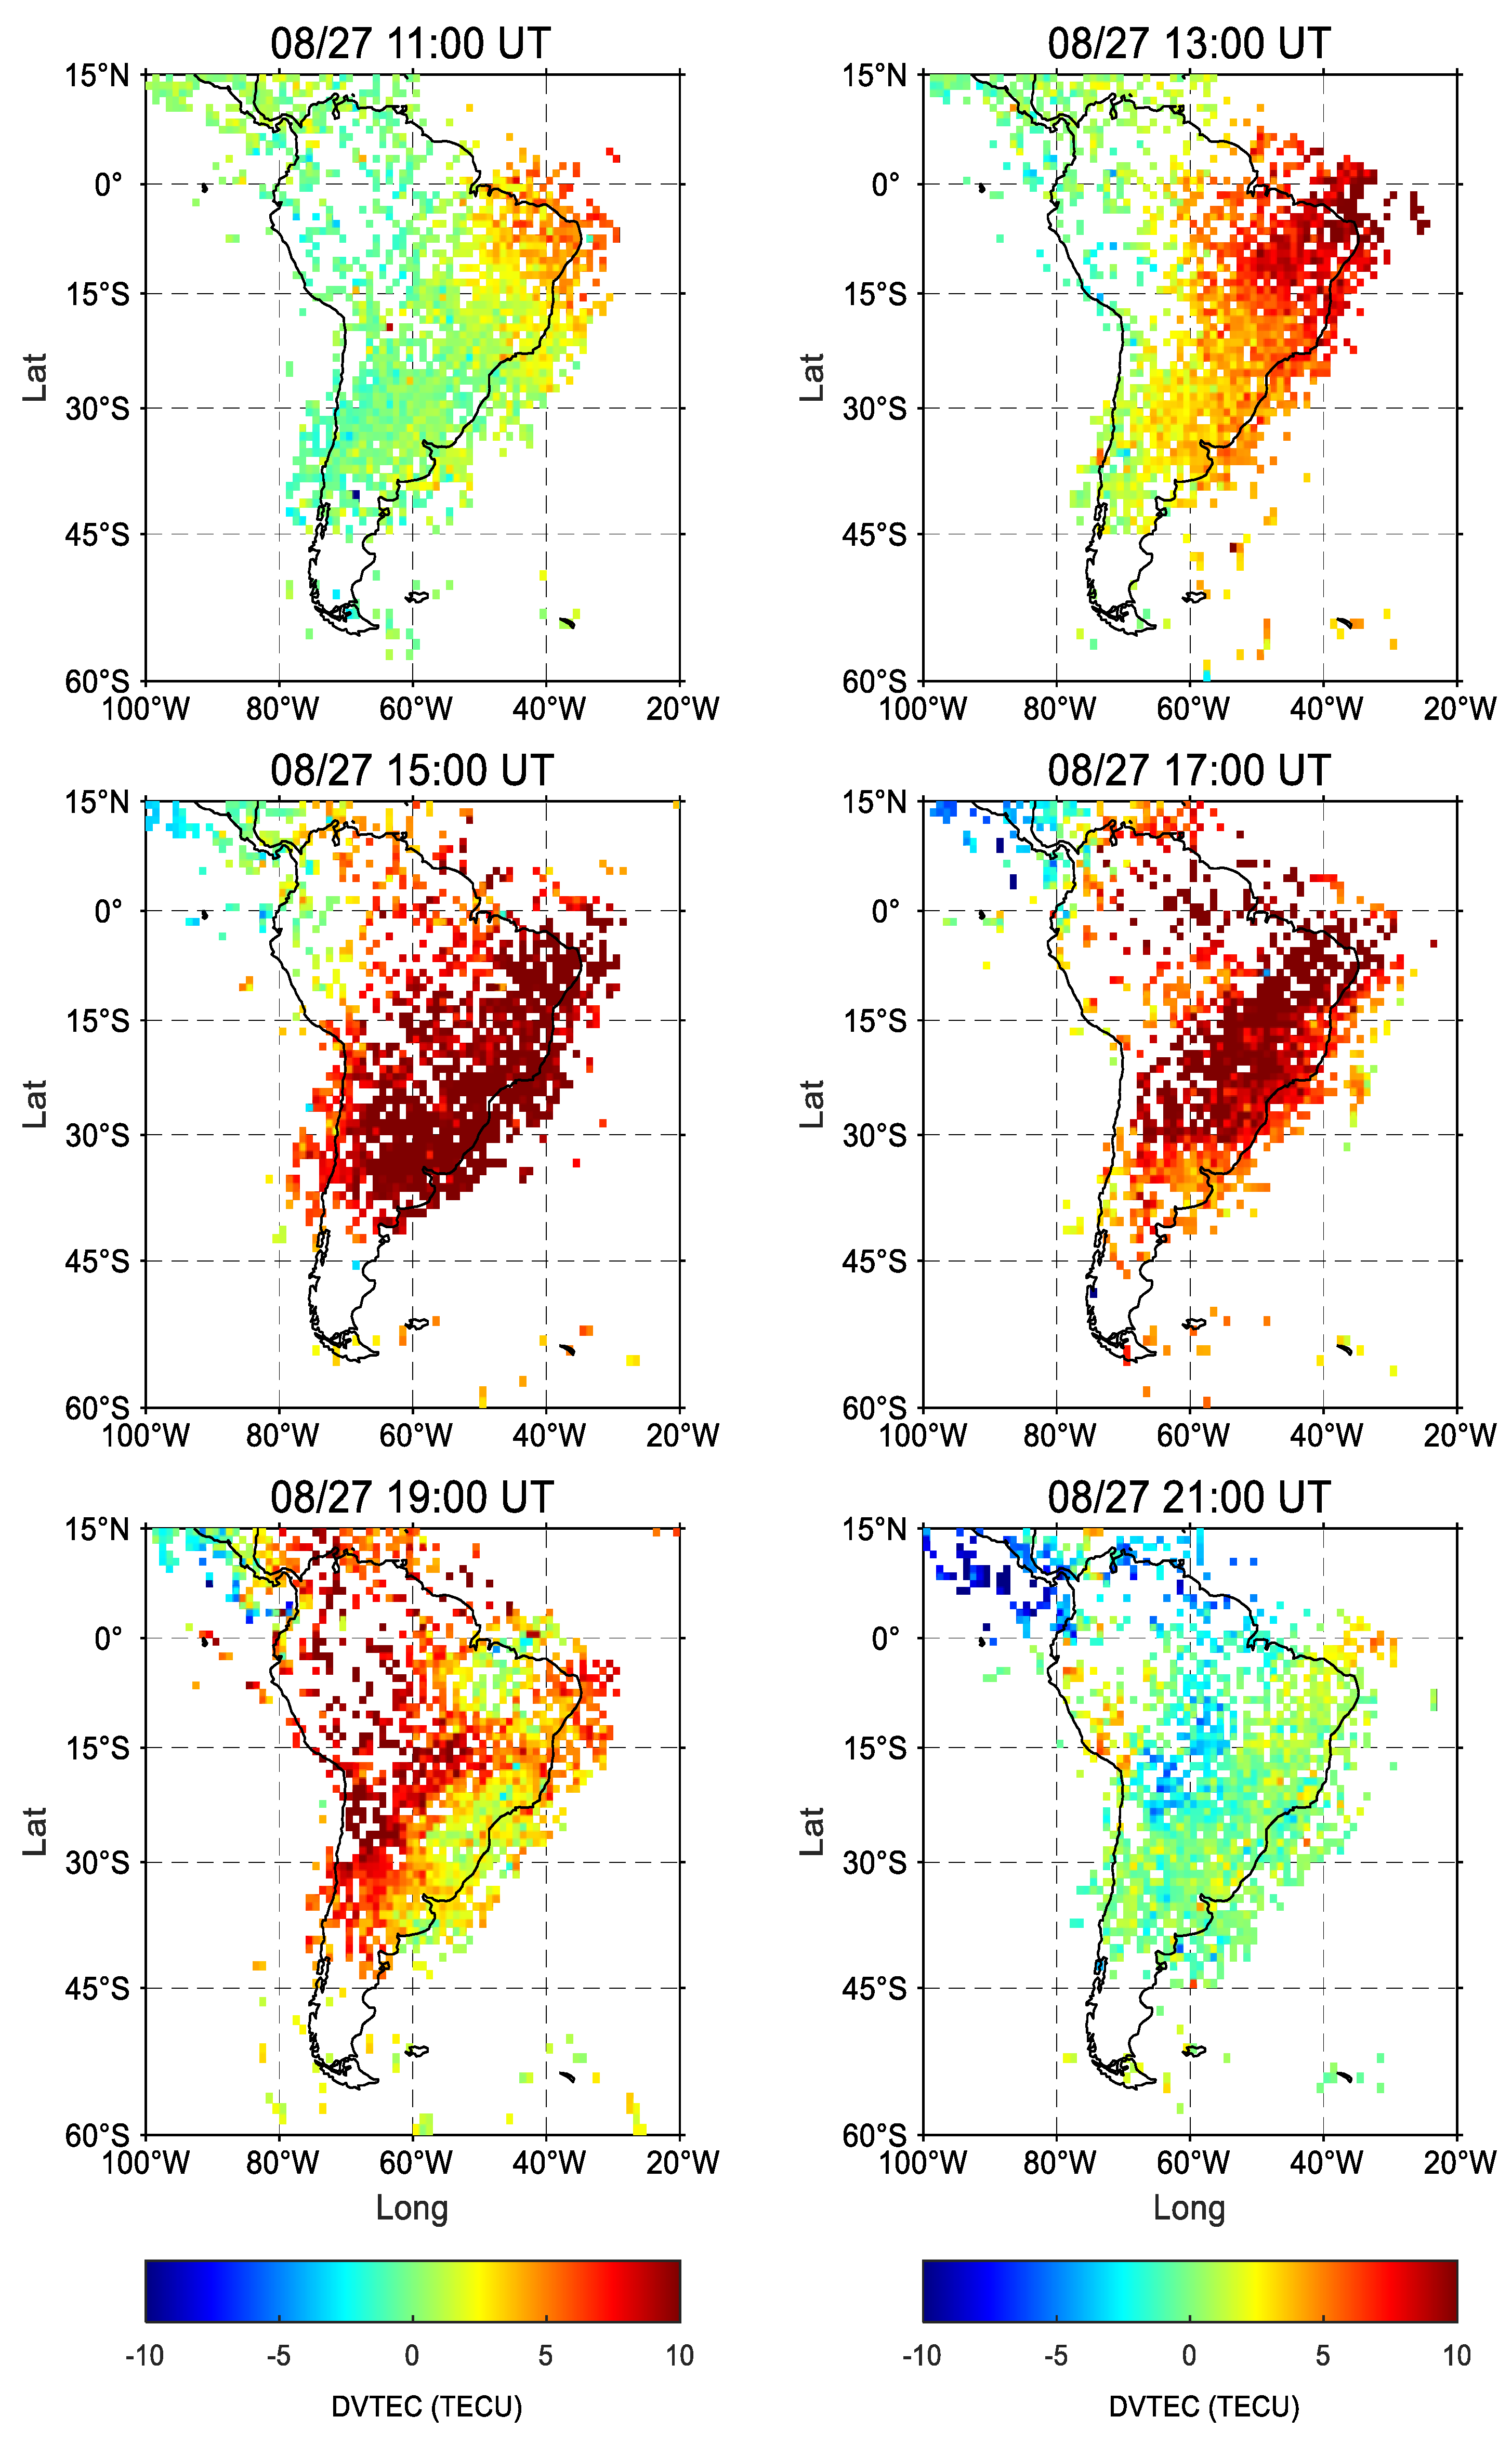
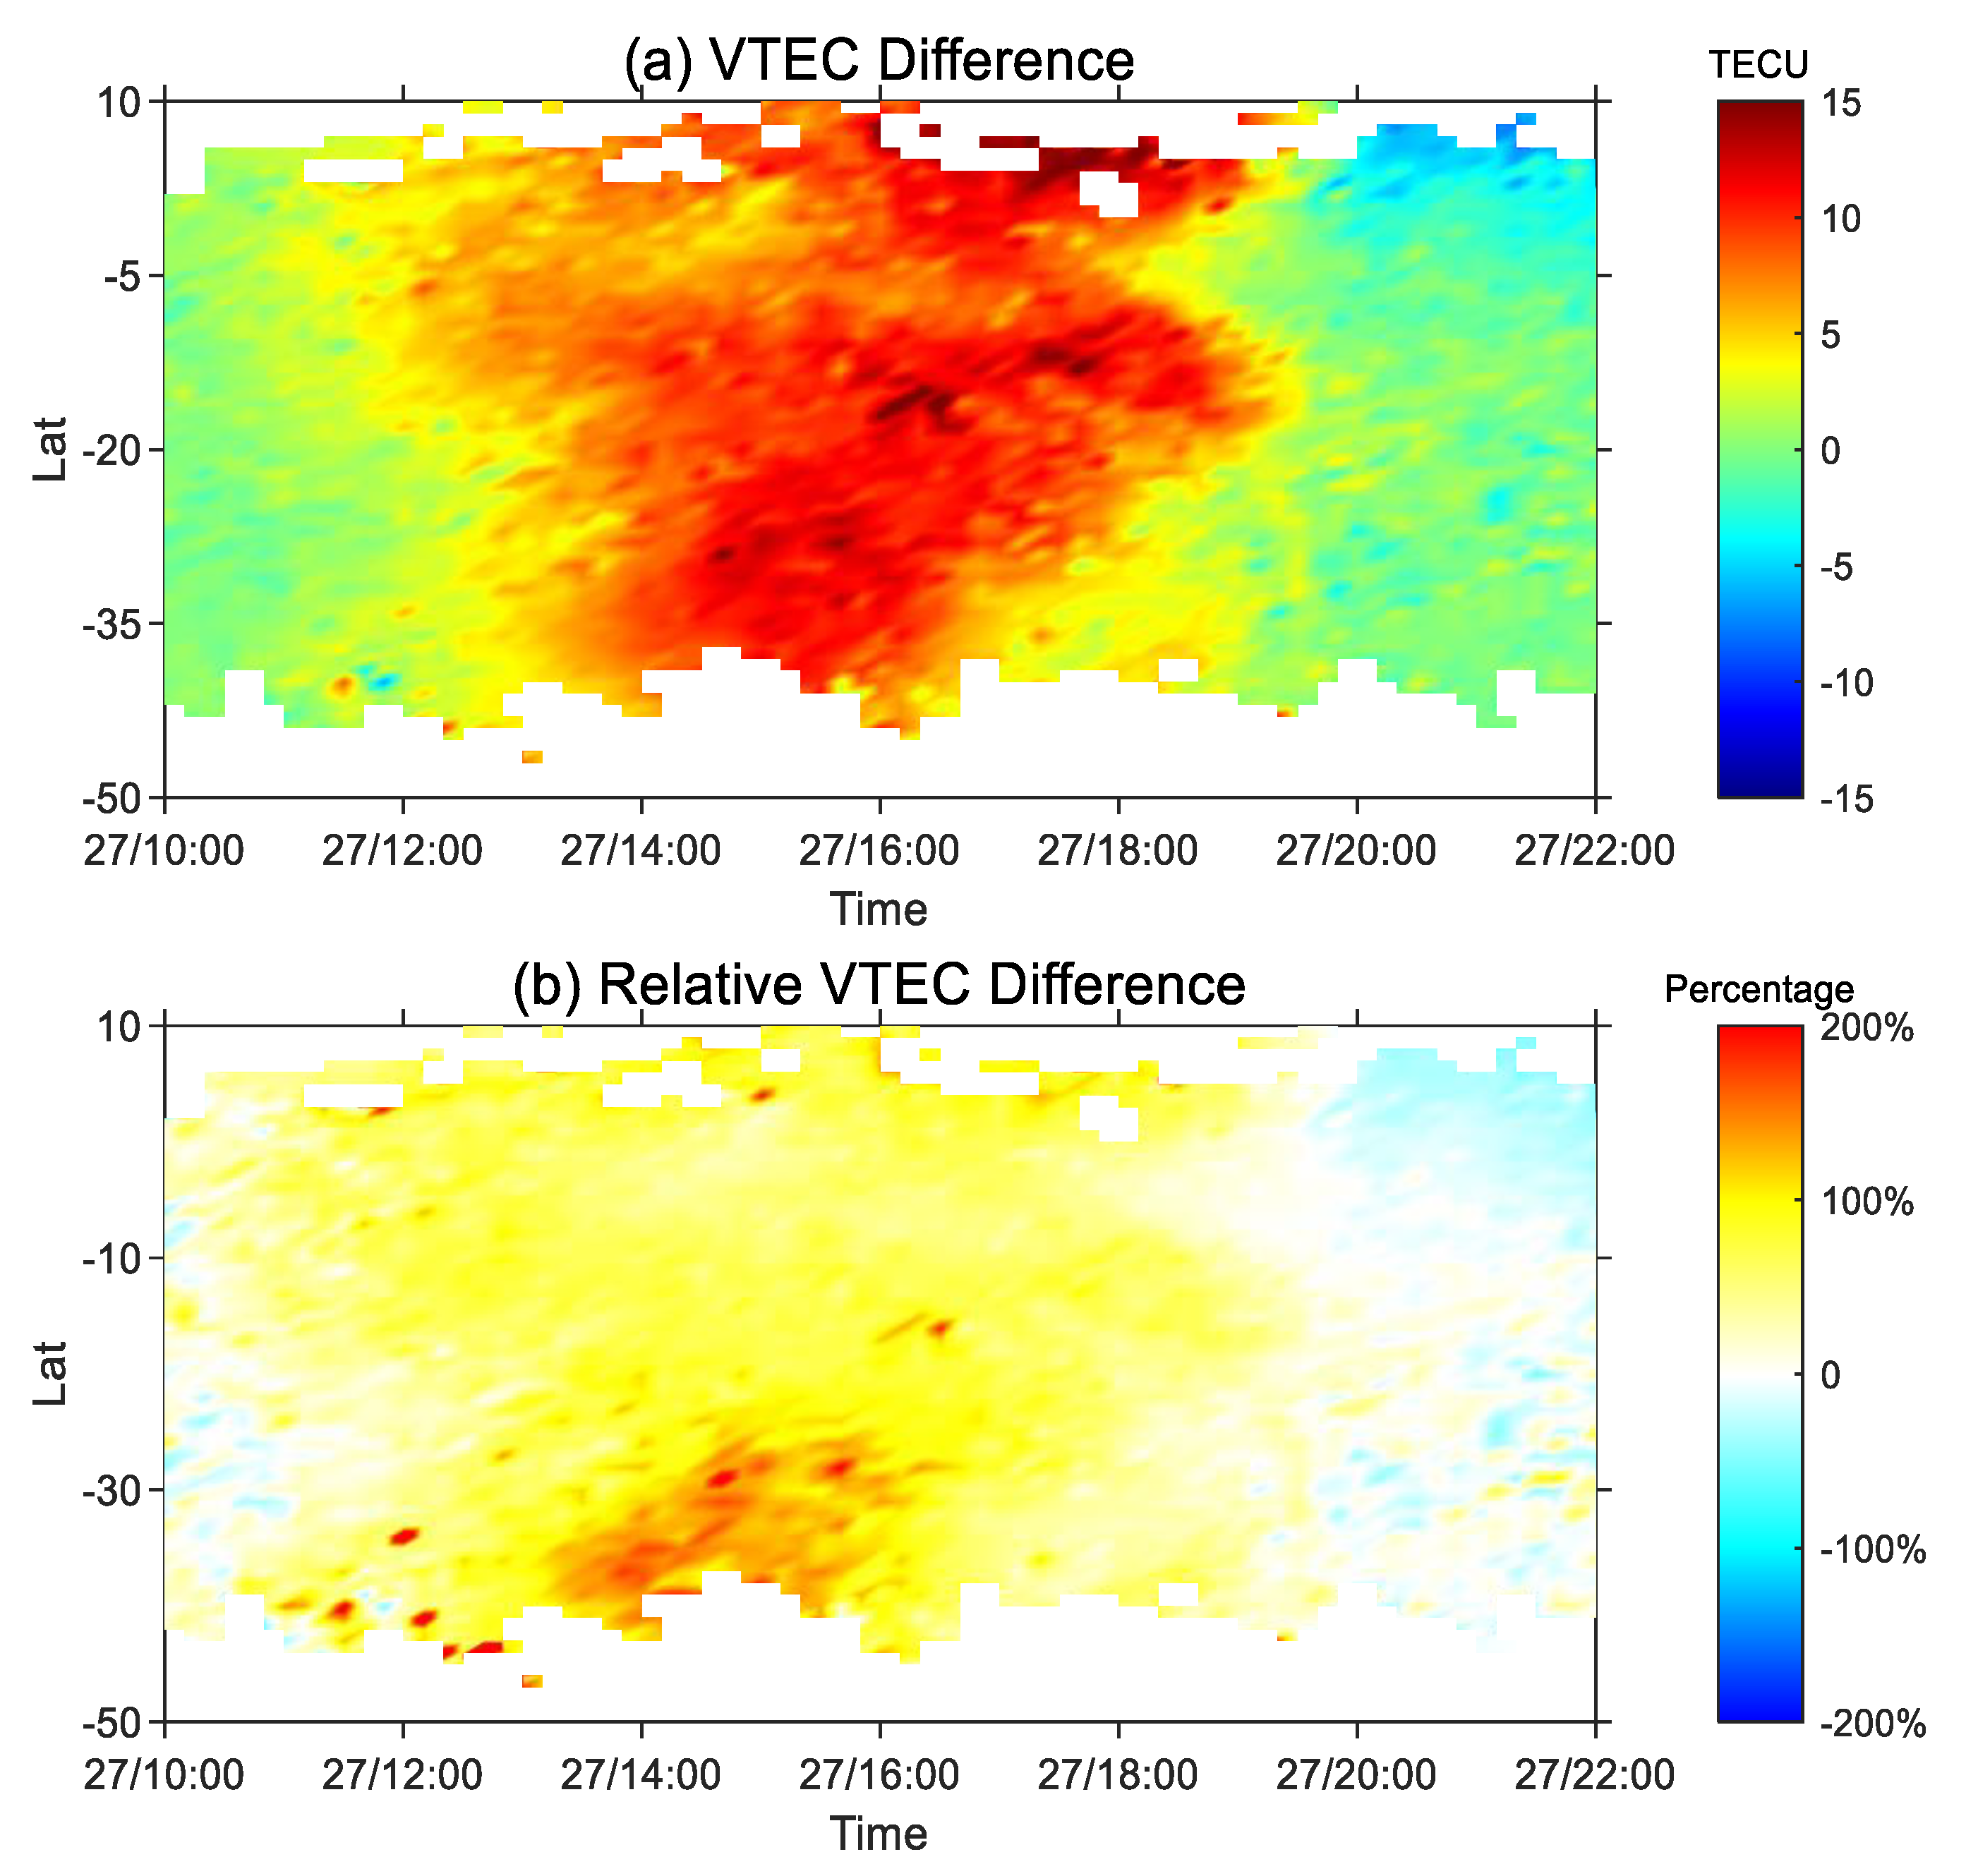
3.5. Storm-4
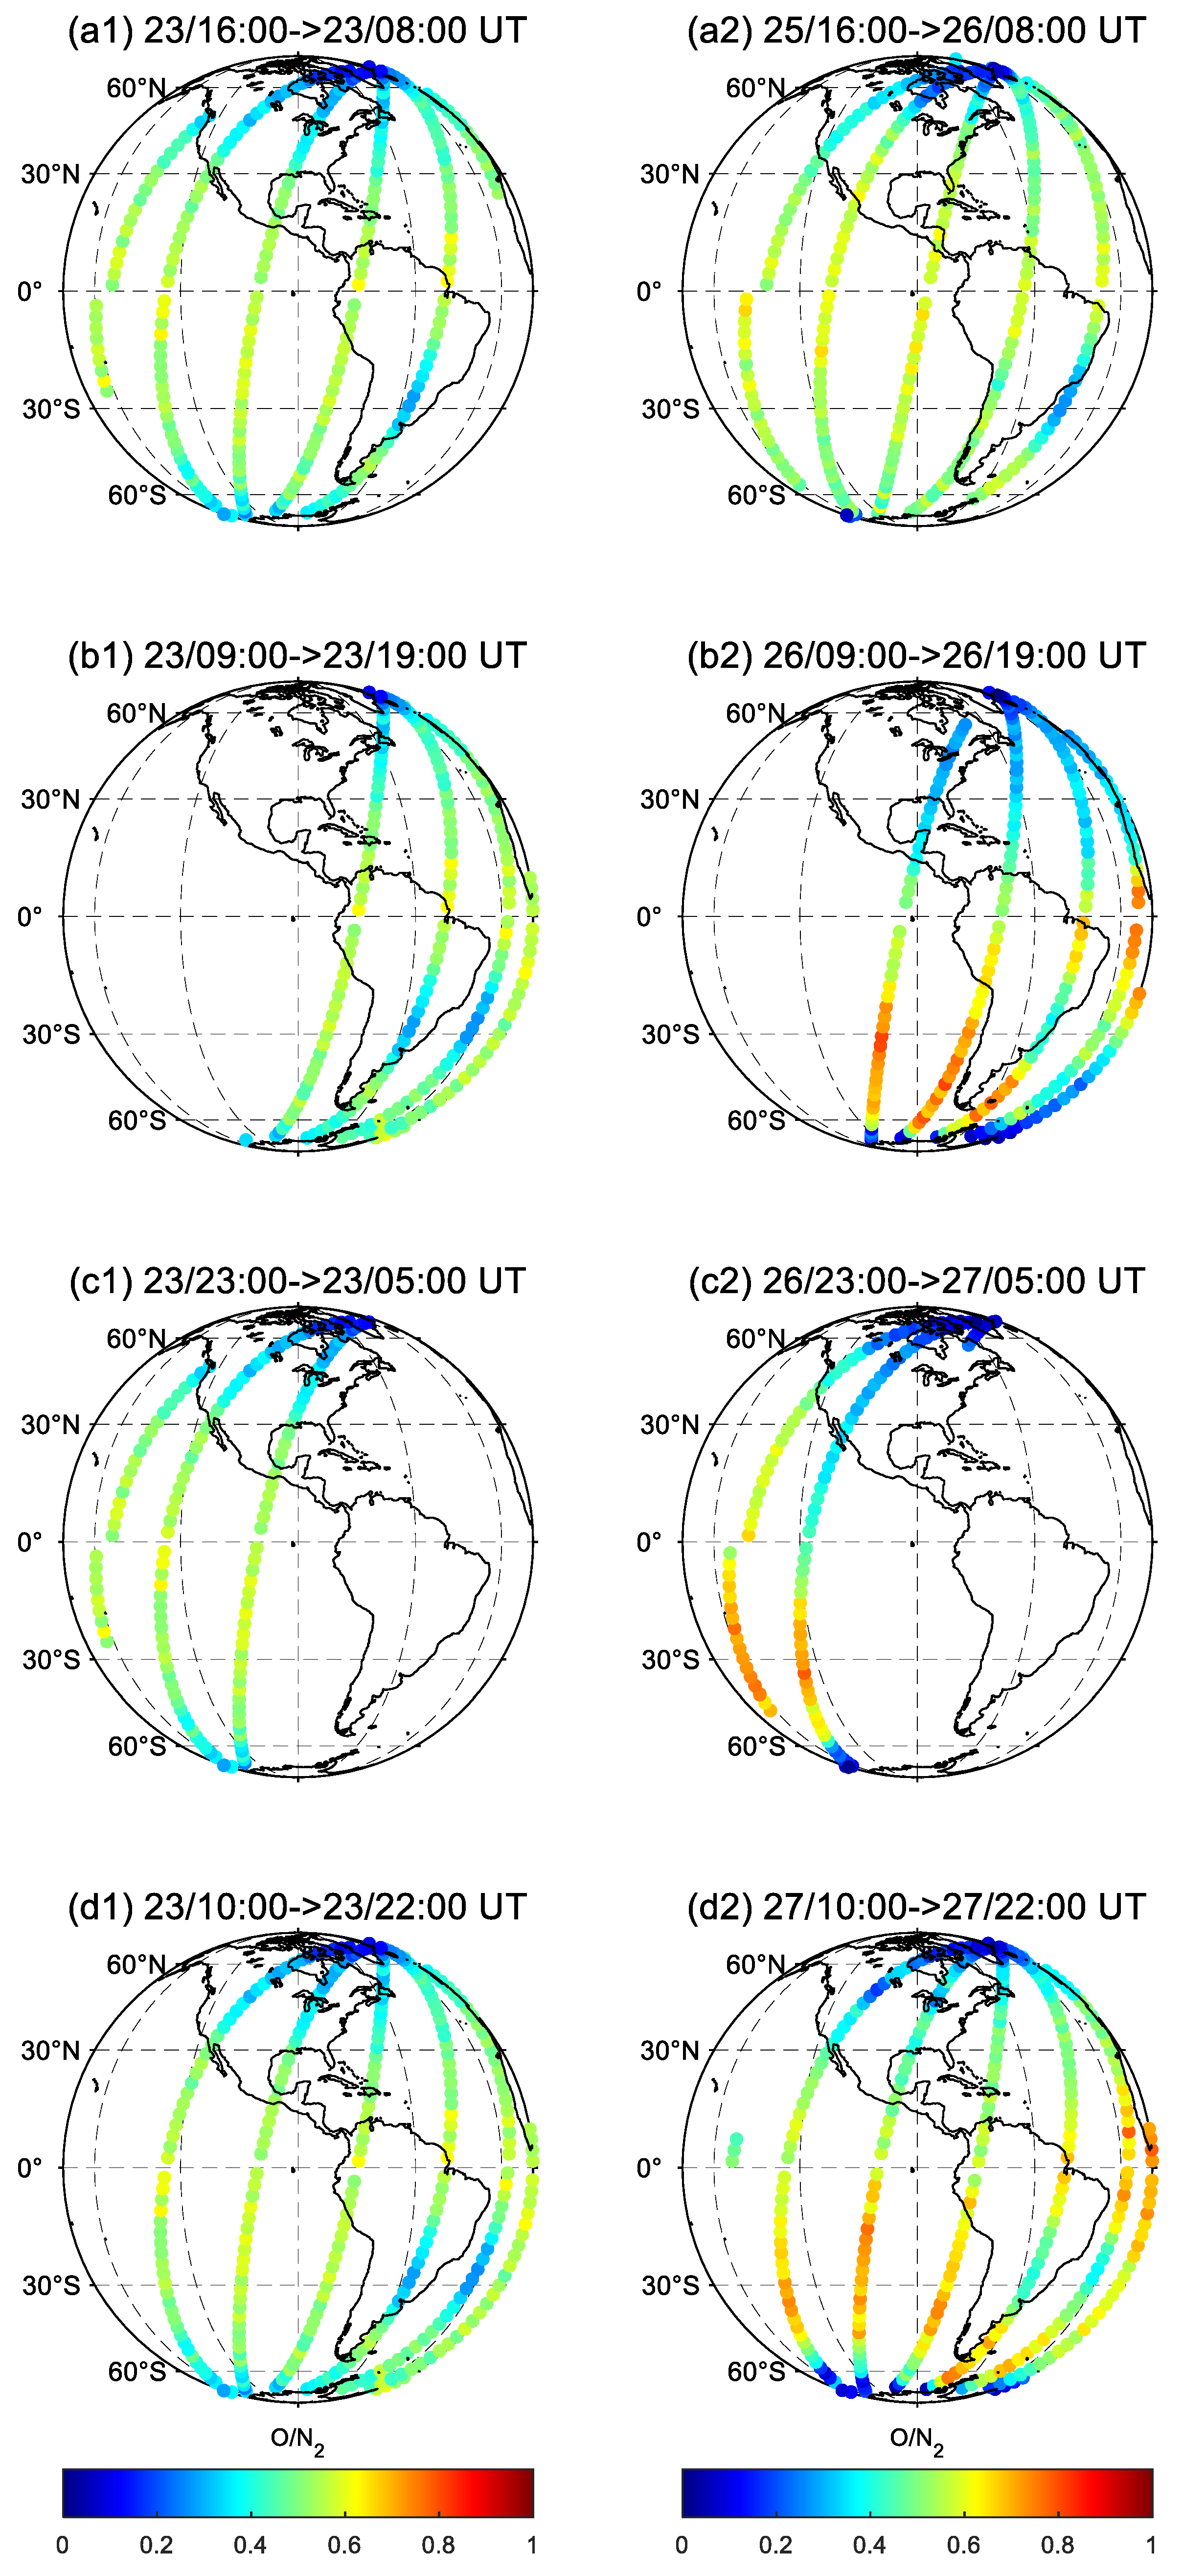
3.6. ∑O/N2 and Polar Cap Potential Results
4. Discussion
5. Conclusions
Author Contributions
Funding
Data Availability Statement
Conflicts of Interest
References
- Cai, X.; Burns, A.G.; Wang, W.; Qian, L.; Solomon, S.C.; Eastes, R.W.; McClintock, W.E.; Laskar, F.I. Investigation of a Neutral “Tongue” Observed by GOLD During the Geomagnetic Storm on 11 May 2019. J. Geophys. Res. Space Phys. 2021, 126, e2020JA028817. [Google Scholar] [CrossRef]
- Pedatella, N.M.; Liu, H.L. The Influence of Internal Atmospheric Variability on the Ionosphere Response to a Geomagnetic Storm. Geophys. Res. Lett. 2018, 45, 4578–4585. [Google Scholar] [CrossRef]
- Aa, E.; Zhang, S.R.; Erickson, P.J.; Coster, A.J.; Goncharenko, L.P.; Varney, R.H.; Eastes, R. Salient Midlatitude Ionosphere-Thermosphere Disturbances Associated with SAPS During a Minor but Geo-Effective Storm at Deep Solar Minimum. J. Geophys. Res. Space Phys. 2021, 126, e2021JA029509. [Google Scholar] [CrossRef]
- Yu, T.; Wang, W.; Ren, Z.; Cai, X.; Yue, X.; He, M. The Response of Middle Thermosphere (∼160 km) Composition to the 20 and 21 November 2003 Superstorm. J. Geophys. Res. Space Phys. 2021, 126, e2021JA029449. [Google Scholar] [CrossRef]
- Yu, T.; Wang, W.; Ren, Z.; Yue, J.; Yue, X.; He, M. Middle-Low Latitude Neutral Composition and Temperature Responses to the 20 and 21 November 2003 Superstorm from GUVI Dayside Limb Measurements. J. Geophys. Res. Space Phys. 2021, 126, e2020JA028427. [Google Scholar] [CrossRef]
- Zhai, C.; Lu, G.; Yao, Y.; Wang, W.; Zhang, S.; Liu, J.; Peng, W.; Kong, J.; Chen, J. 3-D Tomographic Reconstruction of SED Plume During 17 March 2013 Storm. J. Geophys. Res. Space Phys. 2020, 125, e2020JA028257. [Google Scholar] [CrossRef]
- Gonzalez, W.; Joselyn, J.-A.; Kamide, Y.; Kroehl, H.W.; Rostoker, G.; Tsurutani, B.; Vasyliunas, V. What is a geomagnetic storm? J. Geophys. Res. Space Phys. 1994, 99, 5771–5792. [Google Scholar] [CrossRef]
- Yu, T.; Cai, X.; Ren, Z.; Li, S.; Pedatella, N.; He, M. Investigation of the ΣO/N2 Depletion with Latitudinally Tilted Equatorward Boundary Observed by GOLD During the Geomagnetic Storm on 20 April 2020. J. Geophys. Res. Space Phys. 2022, e2022JA030889. [Google Scholar] [CrossRef]
- Yu, T.; Wang, W.; Ren, Z.; Cai, X.; Liu, L.; He, M.; Pedatella, N.; Zhai, C. Diagnostic analysis of the physical processes underlying the long-duration ΣO/N2 depletion during the recovery phase of the 8 June 2019 geomagnetic storm. J. Geophys. Res. Space Phys. 2022, e2022JA031075. [Google Scholar] [CrossRef]
- Zhai, C.; Tang, S.; Peng, W.; Cheng, X.; Zheng, D. Driver of the Positive Ionospheric Storm over the South American Sector during 4 November 2021 Geomagnetic Storm. Remote Sens. 2022, 15, 111. [Google Scholar] [CrossRef]
- Zhai, C.; Cai, X.; Wang, W.; Coster, A.; Qian, L.; Solomon, S.C.; Yu, T.; He, M. Mid-Latitude Ionospheric Response to a Weak Geomagnetic Activity Event During Solar Minimum. J. Geophys. Res. Space Phys. 2023, 128, e2022JA030908. [Google Scholar] [CrossRef]
- Astafyeva, E.; Zakharenkova, I.; Alken, P. Prompt penetration electric fields and the extreme topside ionospheric response to the 22–23 June 2015 geomagnetic storm as seen by the Swarm constellation. Earth Planets Space 2016, 68, 1–12. [Google Scholar] [CrossRef]
- Buonsanto, M.J. Ionospheric Storms—A Review. SSRv 1999, 88, 563–601. [Google Scholar] [CrossRef]
- Lu, G.; Goncharenko, L.; Richmond, A.; Roble, R.; Aponte, N. A dayside ionospheric positive storm phase driven by neutral winds. J. Geophys. Res. Space Phys. 2008, 113. [Google Scholar] [CrossRef]
- Mendillo, M. Ionospheric Total Electron Content Behaviour during Geomagnetic Storms. NPhS 1971, 234, 23–24. [Google Scholar] [CrossRef]
- Tsurutani, B.; Mannucci, A.; Iijima, B.; Abdu, M.A.; Sobral, J.H.A.; Gonzalez, W.; Guarnieri, F.; Tsuda, T.; Saito, A.; Yumoto, K. Global dayside ionospheric uplift and enhancement associated with interplanetary electric fields. J. Geophys. Res. Space Phys. 2004, 109. [Google Scholar] [CrossRef]
- Venkatesh, K.; Patra, A.; Balan, N.; Fagundes, P.; Tulasi Ram, S.; Batista, I.; Reinisch, B. Superfountain effect linked with 17 March 2015 geomagnetic storm manifesting distinct F3 layer. J. Geophys. Res. Space Phys. 2019, 124, 6127–6137. [Google Scholar] [CrossRef]
- Zhao, B.; Wan, W.; Lei, J.; Wei, Y.; Sahai, Y.; Reinisch, B. Positive ionospheric storm effects at Latin America longitude during the superstorm of 20–22 November 2003: Revisit. Ann. Geophys. 2012, 30, 831–840. [Google Scholar] [CrossRef]
- Balan, N.; Otsuka, Y.; Nishioka, M.; Liu, J.Y.; Bailey, G.J. Physical mechanisms of the ionospheric storms at equatorial and higher latitudes during the recovery phase of geomagnetic storms. J. Geophys. Res. Space Phys. 2013, 118, 2660–2669. [Google Scholar] [CrossRef]
- Liu, G.; Shen, H. A severe negative response of the ionosphere to the intense geomagnetic storm on 17 March 2015 observed at mid- and low-latitude stations in the China zone. AdSpR 2017, 59, 2301–2312. [Google Scholar] [CrossRef]
- Sun, W.; Li, G.; Le, H.; Chen, Y.; Hu, L.; Yang, S.; Zhao, X.; Xie, H.; Li, Y.; Zhao, B.; et al. Daytime Ionospheric Large-Scale Plasma Density Depletion Structures Detected at Low Latitudes Under Relatively Quiet Geomagnetic Conditions. J. Geophys. Res. Space Phys. 2022, 127, e2021JA030033. [Google Scholar] [CrossRef]
- Yue, X.; Wang, W.; Lei, J.; Burns, A.; Zhang, Y.; Wan, W.; Liu, L.; Hu, L.; Zhao, B.; Schreiner, W.S. Long-lasting negative ionospheric storm effects in low and middle latitudes during the recovery phase of the 17 March 2013 geomagnetic storm. J. Geophys. Res. Space Phys. 2016, 121, 9234–9249. [Google Scholar] [CrossRef]
- Goncharenko, L.; Foster, J.; Coster, A.; Huang, C.; Aponte, N.; Paxton, L. Observations of a positive storm phase on 10 September 2005. J. Atmos. Sol.-Terr. Phys. 2007, 69, 1253–1272. [Google Scholar] [CrossRef]
- Astafyeva, E.I. Dayside ionospheric uplift during strong geomagnetic storms as detected by the CHAMP, SAC-C, TOPEX and Jason-1 satellites. AdSpR 2009, 43, 1749–1756. [Google Scholar] [CrossRef]
- Paznukhov, V.; Altadill, D.; Reinisch, B. Experimental evidence for the role of the neutral wind in the development of ionospheric storms in midlatitudes. J. Geophys. Res. Space Phys. 2009, 114. [Google Scholar] [CrossRef]
- Fuller-Rowell, T.; Codrescu, M.; Moffett, R.; Quegan, S. Response of the thermosphere and ionosphere to geomagnetic storms. J. Geophys. Res. Space Phys. 1994, 99, 3893–3914. [Google Scholar] [CrossRef]
- Kuai, J.; Liu, L.; Liu, J.; Sripathi, S.; Zhao, B.; Chen, Y.; Le, H.; Hu, L. Effects of disturbed electric fields in the low-latitude and equatorial ionosphere during the 2015 St. Patrick’s Day storm. J. Geophys. Res. Space Phys. 2016, 121, 9111–9126. [Google Scholar] [CrossRef]
- Danilov, A.D. Ionospheric F-region response to geomagnetic disturbances. AdSpR 2013, 52, 343–366. [Google Scholar] [CrossRef]
- Akala, A.O.; Oyedokun, O.J.; Amaechi, P.O.; Simi, K.G.; Ogwala, A.; Arowolo, O.A. Solar Origins of 26 August 2018 Geomagnetic Storm: Responses of the Interplanetary Medium and Equatorial/Low-Latitude Ionosphere to the Storm. SpWea 2021, 19, e2021SW002734. [Google Scholar] [CrossRef]
- Astafyeva, E.; Bagiya, M.S.; Förster, M.; Nishitani, N. Unprecedented Hemispheric Asymmetries During a Surprise Ionospheric Storm: A Game of Drivers. J. Geophys. Res. Space Phys. 2020, 125, e2019JA027261. [Google Scholar] [CrossRef]
- Bolaji, O.S.; Fashae, J.B.; Adebiyi, S.J.; Owolabi, C.; Adebesin, B.O.; Kaka, R.O.; Ibanga, J.; Abass, M.; Akinola, O.O.; Adekoya, B.J.; et al. Storm Time Effects on Latitudinal Distribution of Ionospheric TEC in the American and Asian-Australian Sectors: 25–26 August 2018 Geomagnetic Storm. J. Geophys. Res. Space Phys. 2021, 126, e2020JA029068. [Google Scholar] [CrossRef]
- Blagoveshchensky, D.V.; Sergeeva, M.A. Ionospheric parameters in the European sector during the magnetic storm of 25–26 August 2018. AdSpR 2020, 65, 11–18. [Google Scholar] [CrossRef]
- Mansilla, G.A.; Zossi, M.M. Ionospheric response to the 26 August 2018 geomagnetic storm along 280° E and 316° E in the South American sector. AdSpR 2022, 69, 48–58. [Google Scholar] [CrossRef]
- Younas, W.; Amory-Mazaudier, C.; Khan, M.; Fleury, R. Ionospheric and Magnetic Signatures of a Space Weather Event on 25–29 August 2018: CME and HSSWs. J. Geophys. Res. Space Phys. 2020, 125, e2020JA027981. [Google Scholar] [CrossRef]
- Rideout, W.; Coster, A. Automated GPS processing for global total electron content data. GPS Solut. 2006, 10, 219–228. [Google Scholar] [CrossRef]
- Vierinen, J.; Coster, A.J.; Rideout, W.C.; Erickson, P.J.; Norberg, J. Statistical framework for estimating GNSS bias. Atmos. Meas. Tech. 2016, 9, 1303–1312. [Google Scholar] [CrossRef]
- Christensen, A.B. Initial observations with the Global Ultraviolet Imager (GUVI) in the NASA TIMED satellite mission. J. Geophys. Res. 2003, 108. [Google Scholar] [CrossRef]
- Ruohoniemi, J.; Baker, K. Large-scale imaging of high-latitude convection with Super Dual Auroral Radar Network HF radar observations. J. Geophys. Res. Space Phys. 1998, 103, 20797–20811. [Google Scholar] [CrossRef]
- Younas, W.; Khan, M.; Amory-Mazaudier, C.; Amaechi, P.O.; Fleury, R. Middle and low latitudes hemispheric asymmetries in ∑O/N2 and TEC during intense magnetic storms of solar cycle 24. AdSpR 2022, 69, 220–235. [Google Scholar] [CrossRef]


| Region | Time | Variation | Name |
|---|---|---|---|
| North America | 16:00 25 August–06:00 26 August | Positive | storm-1 |
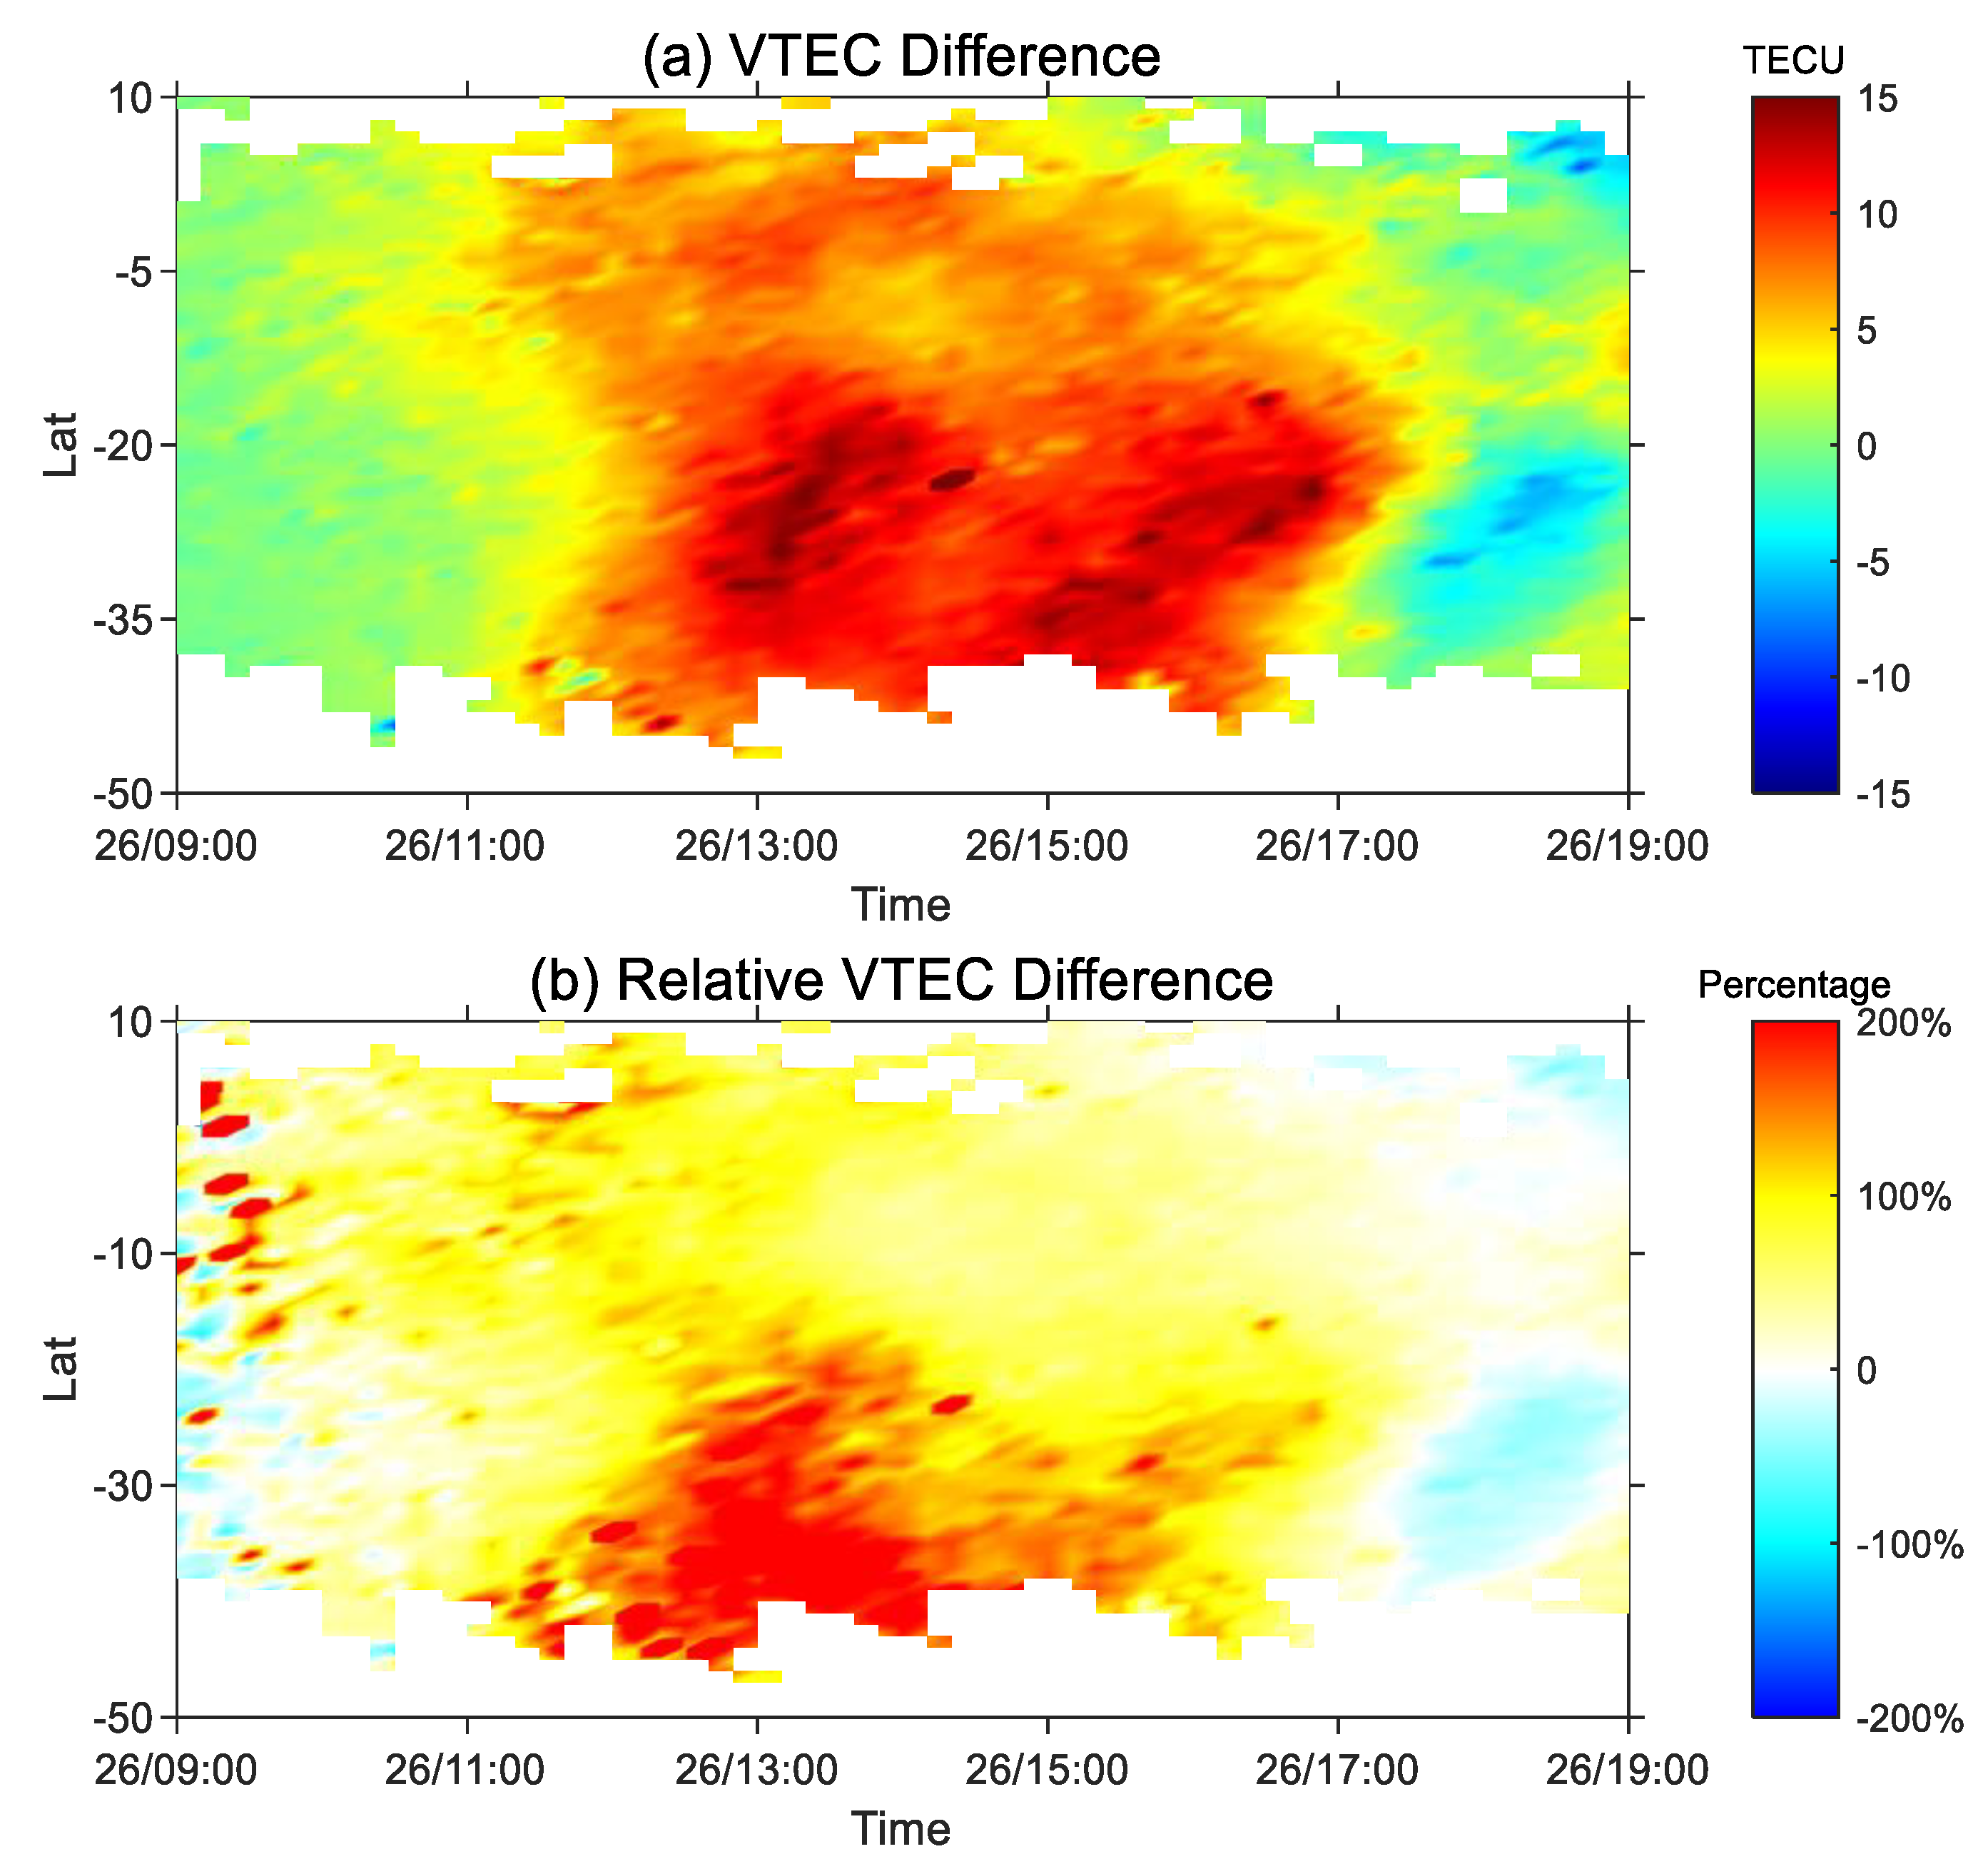
| South America | 09:00 26 August–18:00 26 August | Positive | storm-2 |
| North America | 23:30 26 August–04:30 27 August | Negative | storm-3 |
| South America | 11:00 27 August–21:00 27 August | Positive | storm-4 |
Disclaimer/Publisher’s Note: The statements, opinions and data contained in all publications are solely those of the individual author(s) and contributor(s) and not of MDPI and/or the editor(s). MDPI and/or the editor(s) disclaim responsibility for any injury to people or property resulting from any ideas, methods, instructions or products referred to in the content. |
© 2023 by the authors. Licensee MDPI, Basel, Switzerland. This article is an open access article distributed under the terms and conditions of the Creative Commons Attribution (CC BY) license (https://creativecommons.org/licenses/by/4.0/).
Share and Cite
Zhai, C.; Chen, Y.; Cheng, X.; Yin, X. Spatiotemporal Evolution and Drivers of the Four Ionospheric Storms over the American Sector during the August 2018 Geomagnetic Storm. Atmosphere 2023, 14, 335. https://doi.org/10.3390/atmos14020335
Zhai C, Chen Y, Cheng X, Yin X. Spatiotemporal Evolution and Drivers of the Four Ionospheric Storms over the American Sector during the August 2018 Geomagnetic Storm. Atmosphere. 2023; 14(2):335. https://doi.org/10.3390/atmos14020335
Chicago/Turabian StyleZhai, Changzhi, Yutian Chen, Xiaoyun Cheng, and Xunzhe Yin. 2023. "Spatiotemporal Evolution and Drivers of the Four Ionospheric Storms over the American Sector during the August 2018 Geomagnetic Storm" Atmosphere 14, no. 2: 335. https://doi.org/10.3390/atmos14020335
APA StyleZhai, C., Chen, Y., Cheng, X., & Yin, X. (2023). Spatiotemporal Evolution and Drivers of the Four Ionospheric Storms over the American Sector during the August 2018 Geomagnetic Storm. Atmosphere, 14(2), 335. https://doi.org/10.3390/atmos14020335