Article

Spatiotemporal Variability of the Lake Tana Water Quality Derived from the MODIS-Based Forel–Ule Index: The Roles of Hydrometeorological and Surface Processes

by
Nuredin Teshome Abegaz
1,2,*,
Gizaw Mengistu Tsidu
2 and
Bisrat Kifle Arsiso
2,3
1
Ethiopian Space Science and Technology Institute, Addis Ababa P.O. Box 33679, Ethiopia
2
Department of Earth and Environmental Sciences, Botswana International University of Science and Technology, Private Bag 16, Palapye Plot 10071, Botswana
3
Department of Environment and Climate Change, Ethiopian Civil Service University, Addis Ababa P.O. Box 5648, Ethiopia
*
Author to whom correspondence should be addressed.
Atmosphere 2023, 14(2), 289; https://doi.org/10.3390/atmos14020289
Submission received: 29 November 2022 / Revised: 24 January 2023 / Accepted: 27 January 2023 / Published: 31 January 2023
(This article belongs to the Section Meteorology)

Abstract

:
Lake Tana, the largest inland water body in Ethiopia, has witnessed significant changes due to ongoing urbanization and socioeconomic activities in recent times. In this study, the two-decade recordings of moderate resolution imaging spectroradiometer (MODIS) were used to derive Forel–Ule index (FUI). The FUI, which ranges from 1 (dark-blue pristine water) to 21 (yellowish-brown polluted water), is important to fully understand the quality and trophic state of the lake in the last two decades. The analysis of FUI over a period of 22 years (2000–2021) indicates that Lake Tana is in a eutrophic state as confirmed by FUI values ranging from 11 to 17. This is in agreement with the trophic state index (TSI) estimated from MERIS diversity-II chlorophyll a (Chl _ a ) measurements for the overlapping 2003-2011 period. The categorical skill scores show that FUI-based lake water trophic state classification relative to MERIS-based TSI has a high performance. FUI has a positive correlation with TSI, (Chl _ a ), turbidity, and total suspended matter (TSM) and negative relations with Chl _ a and TSM (at the lake shoreline) and colored dissolved organic matter. The annual, interannual and seasonal spatial distribution of FUI over the lake show a marked variation. The hydro-meteorological, land-use–land-cover (LULC) related processes are found to modulate the spatiotemporal variability of water quality within the range of lower and upper extremes of the eutrophic state as revealed from the FUI composite analysis. The FUI composites were obtained for the terciles and extreme percentiles of variables representing hydro-meteorological and LULC processes. High FUI composite (poor water quality) is associated with above-normal and extremely high (85 percentile) lake bottom layer temperature, wind speed, precipitation, surface runoff, and hydrometeorological drought as captured by high negative standardized precipitation-evapotranspiration index (SPEI). In contrast, a high FUI composite is observed during below-normal and extremely low (15 percentile) lake skin temperature and evaporation. Conversely good water quality (i.e., low FUI) was observed during times of below-normal and above-normal values of the above two sets of drivers respectively. Moreover, FUI varies in response to seasonal NDVI/EVI variabilities. The relationship between water quality and its drivers is consistent with the expected physical processes under different ranges of the drivers. High wind speed, for instance, displaces algae blooms to the shoreline whereas intense precipitation and increased runoff lead to high sediment loads. Increasing lake skin temperature increases evaporation, thereby decreasing water volume and increasing insoluble nutrients, while the increasing lake bottom layer temperature increases microbial activity, thereby enhancing the phosphorus load. Moreover, during drought events, the low inflow and high temperature allow algal bloom, Chl _ a , and suspended particles to increase, whereas high vegetation leads to an increase in the non-point sources of total phosphorus and nitrogen.

1. Introduction

Degradation of inland water quality may arise due to the persistent disintegration of ecosystems of the water body and neighboring areas [1]. Monitoring changes in water quality over such a vast ecosystem using in situ observation is not possible due to the high cost and difficulty of sustaining such infrastructure. However, remote sensing creates the opportunity to monitor a wide region of the environment and to observe the concentration of optically active components (OACs) of water bodies using visible and infrared bands of remote sensing platforms [2]. The most common and major components of OACs in water bodies in relatively pristine water bodies are colored dissolved organic matter (CDOM), total suspended matter (TSM), and chlorophyll a (Chl_a) [3,4]. Based on the characteristics of one or all of the OACs, water bodies can be classified into two groups. For instance, water bodies are considered as Case I water bodies when Chl_a is optically dominant and its estimate from remote sensing retrieval algorithms is fairly accurate [5]. On the other hand, water bodies that have more intricate optical properties arising from the compositions that leave their footprints in all three primary OACs are referred to as Case II water bodies [6]. As a result, the utilization of remote sensing methods for the assessment of water quality in Case II water bodies is less effective [7,8]. Moreover, there is also a spatiotemporal heterogeneity of optical properties in Case II water bodies because of the effect of human interaction [9,10]. The impact of climatic change in altering optical properties of water bodies and the need for the removal of aerosol fingerprints in the measured surface reflectance over Case II water bodies hinder precise water quality estimation [11,12]. Therefore, the utilization of long-period remote sensing datasets to monitor the water quality over Case II water bodies encompassing a wide region has a series of constraints. As an alternative to the retrieval of OAC, particularly in Case II water bodies, the use of the water color indicator has become common in customary examinations of water quality. The Forel–Ule index (FUI) color comparator is used to arrange the colors of sea, ocean, and lakes into 21 different colors, which is commonly employed to assess water quality [13]. It is important to note that FUI still shares uncertainty associated with the reflectance measurements while avoiding the propagated uncertainties arising from inaccurate knowledge of fixed and retrieval parameters during retrieval of OACs. The latter is the major component of the error budget in the retrieval OAC.
Water color is an immediate result of visible light interactions with OACs in regular inland water bodies [14]. The absorption at short wavelengths by unadulterated water is lower than absorption at long wavelengths [10]. In contrast, scattering at short wavelengths by unadulterated water is moderately higher than that at long wavelengths giving rise to a blue color [15,16]. Hence, the spectral color shape of backscattering by suspended matters such as TSM and Chl_a is approximated by a gradually diminishing exponential function [9]. In this manner, enhanced suspended matter in water bodies could change the color of the water to yellow. In terms of absorption characteristics, Chl_a creates an absorption valley in the green spectrum due to its generally high retention values in the blue and red spectral regions [10]. Water bodies with high CDOM and TSM have yellow-to-brown colors, as the absorption of sunlight by CDOM and TSM decays with wavelength [10]. Therefore, remotely sensed reflectance ( R r s ) of visible bands have been used to determine the FUI of inland water bodies [10,17,18] and used as an alternative water quality indicator representing composite effects of the three components of OAC. Apart from avoiding retrieval errors inherent in the retrieval of OACs, some studies point out that FUI derived from R r s exhibits somewhat minimum uncertainty because of its resistance to perturbations of aerosol, variation of observational circumstances, and great adaptability across various sensors [17,19,20].
An early methodology utilizing chromaticity examination on remote sensing images of water proposed by [21] ascertains two chromaticity values (x and y) for bands 4 and 5 of Landsat radiance Multi-Spectral Scanner (MSS). Moreover, the authors showed that the standardization in chromaticity limits the impacts of white aerosols, clouds, whitecaps, and sun glint noise. The receptivity of chromaticity coordinates (X, Y, Z), predominant wavelength ( λ d ), and related spectral purity values of OACs have additionally been explored in different studies [3,13,14,22]. Wernand [23] and Wernand et al. [18] developed Forel–Ule MERIS (FUME) retrieval empirical algorithm to describe water quality by converting Medium Resolution Imaging Spectrometer (MERIS) reflectance of the ocean and sea to discrete FUI. Wang et al. [10,24] used Moderate Resolution Imaging Spectroradiometer (MODIS) reflectance over a number of worldwide lakes to extract radiometric water colors and classify them based on the FUI scale. Wang et al. [17] extended the use of FUI-based trophic state assessment to worldwide inland water bodies utilizing MODIS surface reflectance datasets. The MODIS (Terra and Aqua) products were also used in various other applications. For example, MODIS products were used for the investigation of weather properties and cloud distribution in the stratospheric layer of the atmosphere [25] and in the development of high-resolution operational land or water mask data productions [26].
While the water quality assessment using the FUI technique is at mature stage globally, assessments of inland water quality in Africa based on both in situ and remote sensing measurements are quite a few despite growing challenges to inland water quality and availability attributed mainly to anthropogenic factors such as climate and LULC changes. Lake Tana has experienced growing threats attributed to urbanization and LULC changes in its vicinity. Studies show the expansion of hyacinth in recent decades [27,28,29,30,31] over the lake is unprecedented. Some recent studies also investigated the quality of Lake Tana, its trophic state, and physicochemical properties of the lake using graph-sampling methods in combination with satellite-derived datasets [32,33,34,35,36,37,38,39].
However, the quality of water from Lake Tana, which is the source of income in sustaining the livelihoods of the rural and urban populations in Bahir Dar in Ethiopia, and the role of hydrometeorological, and land-use–land-cover change processes on the spatiotemporal variability of lake water quality were not sufficiently understood and addressed due to the lack of in situ measurements of water quality, small areal coverage of the lake by past graph samplings, and the short temporal coverage. Therefore, in this study, FUI-based trophic state assessment derived from MODIS reflectance is employed to understand the water quality of the lake at much higher spatiotemporal scales. In addition, the study investigates the role of meteorological, hydrological, and land-use–land-cover change processes in controlling the spatiotemporal variability of lake water quality.

2. Study Area and Datasets

2.1. Description of Study Area

Lake Tana Figure 1 is the largest water body in Ethiopia, situated at a height of 1786 m above sea level [33]. Lake Tana is surrounded by mountain ranges with heights exceeding 3000 m on its northeastern side. The water level of the lake is controlled by the southward outflow volume of the Blue Nile River and Tana-Beles hydropower water system, and the inflow volume of tributary rivers from all directions [40]. The primary tributary rivers to the lake are Gilgel Abbay, Megech, Gumara, and Rib Rivers [33]. The Lake covers a large area of the Ethiopian plateau in the western part of the country and was created by volcanic blocking of the Blue Nile in the early Pleistocene period [41]. The Basin of the lake covers the high land escarpments of Gondar and Gojjam. The wetland characteristic of the lake catchment area is attributed to the shallowness of the lake [42]. The lagoons and swamps are found on all sides of the lake arising from hydrological and land-use changes in the basin [43]. The cultivated land surface area of Lake Tana catchment is about 55% whereas the grassland, water, natural forest, and wetland area cover 10.38%, 21.06%, 0.39%, and 1.6%, respectively, [43,44]. The lake and its environment provide livelihood for the communities living around the lake–shore and those living in the lake islands. The lake provides water for domestic use, irrigation, and hydropower production. Moreover, fish from the lake is one of the dominant sources of income for the local communities along with water transport service and tourism [43]. The sub-catchment of Lake Tana has been designated as the development corridor and a biosphere reserve by UNESCO [45]. The Lake basin experiences 3 months of a warm and wet summer (July to September), a dry and cold winter lasting about 5 months (December to April), as well as the spring and autumn seasons [46]. The mean maximum and minimum temperature of the lake is 29.2 C and 10.9 C, respectively [47]. In terms of precipitation, the catchment receives rainfall from a large-scale tropical highland monsoon weather system. As a result, the rainfall pattern of the basin is divided into two seasons: A rainy season (kremit) mainly covers the months from June to September and a dry season covers months from October to April [43]. About 70–90% of the total annual rainfall of the basin occurs from June to September and the mean annual rainfall is about 1500 mm [48].

2.2. Datasets

2.2.1. MODIS Water Surface Reflectance Dataset

The surface reflectance products of MODIS (MOD09A1) containing surface spectral reflectance dataset with a spatial resolution of 500 m from 7 bands of visible, short-wave, and near-infrared wavelengths [49] is acquired from the National Aeronautics and Space Administration (NASA) (https://lpdaac.usgs.gov/products/mod09a1v061/ (accessed on 30 December 2022)). MOD09A1 surface reflectance is an 8-day composite dataset spatially partitioned into a number of tiles which when put together cover the whole world. MOD09A1 is well geo-referenced, integrated, and cloud-stamped dataset, and as a result, it has been extensively utilized for monitoring the long-term variability of water quality globally [50,51,52,53]. In this study, more than 686 MOD09A1 reflectance datasets were filtered based on the MODIS reflectance quality flag; they were used to calculate FUI and understand the spatiotemporal variability of lake water quality under different conditions (states) of hydrometeorological factors and LULC changes. The MODIS quality flag allows choosing different levels of quality (https://modis-land.gsfc.nasa.gov/pdf/MOD09_UserGuide_v1.4.pdf (accessed on 30 December 2022)). In this study, we have selected pixels with minimal cloud, cloud shadow, aerosol, and cirrus contamination to calculate FUI.

2.2.2. Diversity II Dataset

Diversity II datasets were derived from Medium Resolution Imaging Spectrometer (MERIS) satellite by applying an enhanced water quality estimation algorithm of inland water bodies [54]. Total suspended matter, turbidity, colored dissolved organic matter, temperature and chlorophyll a provided by the Diversity II platform from the European Space Agency(ESA) (http://www.diversity2.info/products/ (accessed on 30 December 2022)) were used to validate the MODIS-based FUI dataset generated in this study. The quality and limitations of the dataset as well as the methodology utilized to derive total suspended matter, turbidity, colored dissolved organic matter, temperature, and chlorophyll a, and its errors are extensively described in [54]. The dataset was also used to assess the performance of FUI-based classification of lake water into oligotrophic, mesotrophic, and eutrophic trophic states. For this performance evaluation, the trophic state index (TSI) of Lake Tana was first derived from Chl_a (FUBchl-a) concentration retrieved by the Free University of Berlin using equation [55]:
T S I C H L = 9.81 ln ( C H L ) + 30.6
where is C H L concentration in μ g/L. The FUI is then compared with the derived TSI whether it was able to capture the same trophic state at each pixel of the lake or not using categorical statistics. The trophic states of inland water bodies based on TSI are oligotrophic mesotrophic and eutrophic provided that ( T S I < 30 ) , ( 30 T S I < 50 ) , ( T S I 50 ) respectively [56].

2.2.3. Reanalysis and Observational Datasets

ERA5 is the European Center for Medium-Range Weather Forecasts (ECMWF) atmospheric reanalysis of the worldwide climate for the period from 1950 to present [57] and archived at the Copernicus Climate Change Service (C3S) (https://cds.climate.copernicus.eu (accessed on 30 December 2022)). In this study, ERA5 monthly averaged meteorological parameters (Temperature, evaporation, and precipitation), hydrological parameters (runoff) and NCEP-NCAR Reanalysis monthly surface wind speed (https://noaa.gov/Datasets/ncep.reanalysis (accessed on 30 December 2022)) were used to examine the impacts of hydrometeorological factors on the variability of lake water quality from 2000 to 2021. The most difficult variable to simulate over east Africa is precipitation. However, a recent study shows that ERA5 precipitation is in good agreement with observations [58]. The standardized precipitation evapotranspiration index (SPEI) is calculated using the climatic research unit’s (CRU) rainfall and evapotranspiration (https://crudata.uea.ac.uk/cru/data/cru_ts_4.05 (accessed on 30 December 2022)).

2.2.4. Land-Use–Land-Cover Change Datasets

The changes in land-use–land-cover interact with natural drivers to influence water quality. The monthly MODIS-derived normalized difference vegetation index (NDVI) and enhanced vegetation index (EVI) variables were used to examine their impacts on the degradation of lake water quality in this study. These data were obtained from the National Aeronautics and Space Administration (NASA) (https://lpdaac.usgs.gov/products/MOD13A3.0061/) (accessed on 30 December 2022). The quality and limitations of the dataset as well as the methodology used to derive NDVI and EVI are extensively described in [59].

3. Methods

3.1. Correction for Spectral Reflectance of Day Light and Sky Light in MOD09A1 Reflectance

The land surface reflectance product (MOD09A1) obtained from MODIS L1B reflectance has undergone atmospheric correction [60,61]. Atmospheric correction includes correction of aerosol scattering, correction of air molecule scattering, and correction of cirrus. The impact of the atmosphere on water leaving reflectance for inland water is much stronger than that of the ocean surface. Therefore, the water surface spectral reflectance of daylight and skylight should be removed. A correction technique that uses the minimum values of short-wave infrared and near-infrared bands from the visible bands as suggested by [62]:
R r s c λ i = R λ i m i n R N I R : S W I R π
were used to remove the water surface spectral reflectance of daylight and skylight where R r s c λ i is the corrected water-leaving reflectance of MOD09A1 bands centered at λ i ; R λ i is the original reflectance of MOD09A1 bands centered at λ i ; min(R(NIR:SWIR)) is the minimum positive value of the NIR and SWIR bands; π is used to adjust the surface reflectance to water-leaving reflectance [17]. Cloud shadows, ice or snow, clouds, blended and noisy pixels were also excluded based on the MODIS quality flag (QA).

3.2. FUI Formulation

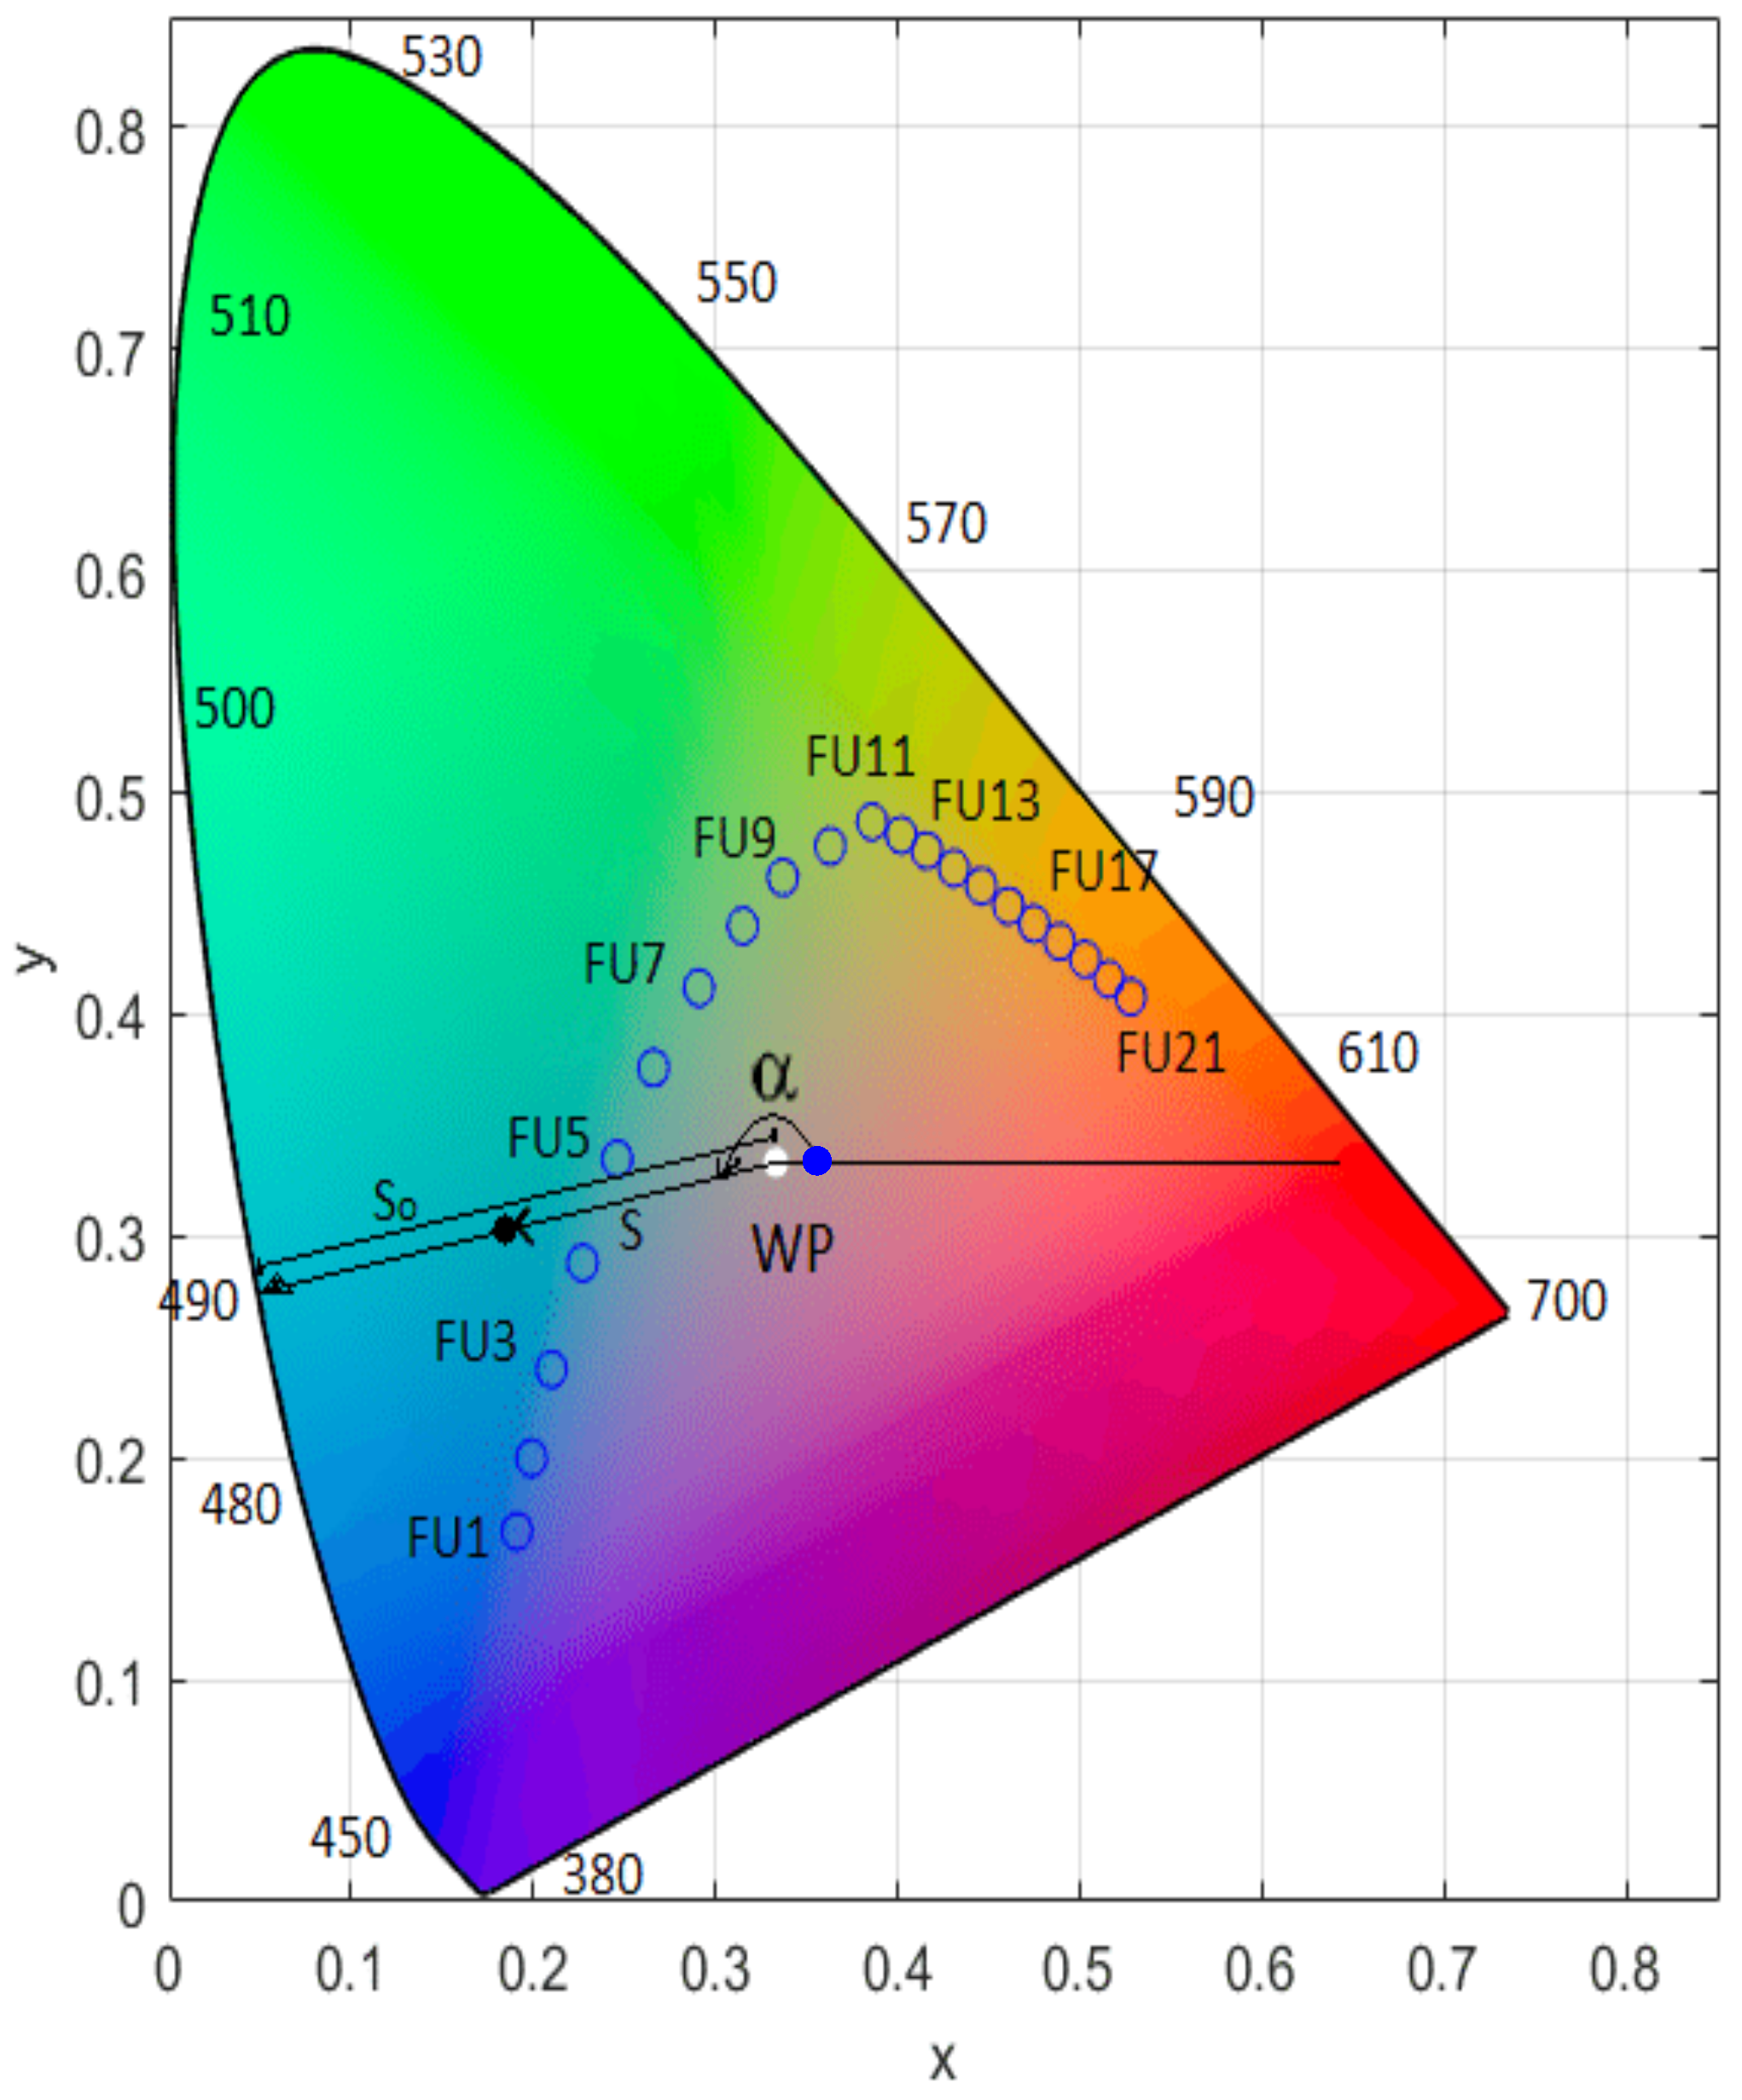
In the Commission on Illumination (C.I.E.) colorimetry framework Figure 2, hypothetical color domains can be extracted from hyperspectral R r s ( λ ) and color-match functions employing spectral assimilation in the range of visible bands [10,63]. The reflectance of red, green, and blue (RGB) bands were utilized to calculate CIE tristimulus values (X, Y, and Z) [10,52]. For MODIS, the CIE tristimulus values are obtained from:
X = 2.7689 R + 1.7517 G + 1.1302 B Y = 1.00 R + 4.5907 G + 0.0601 B Z = 0.00 R + 0.0565 G + 5.5943 B
following previous works [10,63]. The normalized tristimulus values X, Y, and Z of true color RGB images can then be used to calculate the value of chromaticity coordinates (x, y) representing the x-axis and y-axis of the CIE chromaticity diagram [63]:
x = X X + Y + Z y = X X + Y + Z z = X X + Y + Z
The Hue angle α is defined as the angle between the vector whose tip is at x and y and the negative x-axis at y = 1 3 in the CIE chromaticity diagram [17,19,20]. The Hue angle α is given in degrees and varies from 0 to 360 in an anti-clockwise direction with 0 at y = 1 3 on the positive x-axis in the CIE chromaticity diagram [17]. Mathematically, α is obtained from:
α = a r c t a n 2 x 0.3333 y 0.3333 180 π
inline with previous studies [17,52,64].
Figure 2. CIE chromaticity diagram with 21 FUI (blue circles), white point (WP), wavelength range from 380 to 700 nm, the blue point represents the hue angle α   =   0 ° , distances from WP (S and S o ), and the chromaticity axes (x and y) [65].
Atmosphere 14 00289 g002
The difference between the natural eye detected and sensor-determined color may arise due to satellite sensor band settings [19]. The resulting color difference, a deviation denoted as delta, ( Δ ) can be determined as
Δ = 1.8185 α 100 5 + 87.01 α 100 4 486.65 α 100 3 + 1004.93 α 100 2 844.55 α 100 + 220.28
and added to α
α c o r r e c t e d = α + Δ
as proposed by [24]. After the delta correction, α and FUI are comparable with satellite sensors at different spectral settings [19] and archived in the form lookup table. The 21-classes of Forel–Ule index corresponding to the different ranges of delta corrected angle α is shown in the lookup table (Table 1) [18].

3.3. FUI-Based Trophic State Assessment of Lake Tana Water

Eutrophication occurs mostly as a result of the fast growth of phytoplankton and different microorganisms having significant impacts on ecosystems, and the normal functioning of water bodies [66]. Eutrophication is triggered by continuous sediment loads from the environment to the water bodies when nearby surface exposed to wastes from settlements slowly drains or when there is a flash flood over such surface or farm fields [67,68]. The sediment loads from nearby settlements (towns, cities) or farm fields that use a lot of fertilizers are rich in nitrogen (N) and phosphorous (P), the two most essential elements to enhance the eutrophication of water bodies [69,70]. Eutrophic conditions can also occur in estuaries and lakes due to the top-down blending of water sections under normal conditions [67,71]. With a growing number of cases of eutrophication, scientists have made efforts to quantitatively estimate the trophic state of inland water bodies in the 1960s [72,73,74,75,76]. Specifically, [77] presented the Trophic State Index (TSI) of inland water bodies in light of algal blooms. TSI can be determined using total phosphorus (TP), Secchi disk depth (SDD), or chlorophyll a (Chl_a). For example, Chl_a is used by many investigations and is a marker for the trophic conditions of an inland water ecosystem [78,79]. Following this understanding, scientists classified the trophic states of lakes into oligotrophic, mesotrophic, and eutrophic based on chemical, physical, and biological variables including Secchi disk depth (SDD), total phosphorus (TP), chlorophyll a (Chl_a) and total nitrogen (TN) [52]. In this study, the trophic states of Lake Tana were computed using a decision tree-based approach, which assumes there is a close relationship between FUI, red band remote sensing reflectance ( R r s ( 645 ) ) , and trophic states of lakes (Table 2), according to [17].

3.4. Statistics

3.4.1. Correlation

Pearson correlation is used to describe the relationship between FUI and Diversity-II water quality parameters. It is important to note that the correlation used in this study is not as a measure of the performance of FUI but rather to discern its relationship with other water quality parameters. The correlation, r x , y , is given as
r x y = i = 1 n x i y i n x ^ y ^ S x S y
where r x y represents the Pearson correlation coefficient, n refers to the number of observations, x ^ and y ^ represent the mean of the FUI and Diversity-II water quality parameters, respectively. while S x and S y represent the standard deviation of FUI and Diversity-II water quality parameters respectively and are given by
S x = n = 1 n x 2 n x ^ 2 S y = n = 1 n y 2 n y ^ 2

3.4.2. Categorical Statistics

To quantitatively assess the performance of FUI-based lake water trophic state relative to MERIS-based TSI, eight categorical skill scores are computed from the contingency table (Table 3),
Where A to P are the number of cases belonging to each of the three trophic states as determined from either MERIS-based TSI or FUI-based trophic state classes.
The frequency bias index (FBI) or (Bias) is one of the eight categorical statistical metrics calculated from Table 3 as
B i a s = M + N + O D + H + L
where M, N, O, D, H, and L are the total number of pixels exhibiting oligotrophic, mesotrophic and eutrophic states according to FUI (M, N, O) and TSI (D, H, L). It shows the overestimated ( B i a s > 1 ) or underestimated ( B i a s < 1 ) number of cases in FUI detected trophic state occurrences relative to that of TSI. Unbiased FUI detection implies that B i a s = 1 . The ratio of the number of correctly identified trophic states and the number of reference trophic states is termed as the probability of detection (POD) and is given by
P O D = A + F + K D + H + L
where POD = 1 is perfect detection and POD = 0 is the worst performance of FUI relative to MERIS TSI. The false alarm ratio (FAR) refers to the fraction of the total number of falsely detected trophic states relative to TSI to the total number of FUI-detected trophic states (FAR = 0 implies perfect agreement and FAR = 1 implies worst FUI performance). FAR is given as
F A R = E + I + B + J + C + G M + N + O
based on the number of cases identified in the contingency (Table 3). Critical success Index (CSI) obtained from
C S I = ( A + F + K ) ( D + M A ) + ( H + N F ) + ( L + O K )
describes the fraction of the number of correctly detected trophic states by FUI relative to the MERIS TSI to the total number of false, miss, and correct observations of trophic states (CSI = 1 implies perfect agreement and CSI = 0 implies worst FUI performance). Similarly, the categorical miss (CM) quantifies the proportion of the missed observations by FUI to the total number of TSI estimates (CM = 0 implies perfect agreement and CM = 1 implies worst FUI performance). Mathematically, CM is given by
C M = 1 P O D
Finally, reliability (REL) is defined as the ratio of the number of trophic states correctly identified by FUI to the total number of false, missed, and correct observations of trophic states (REL = 1 implies perfect agreement and REL = 0 implies worst FUI performance) whereas the proportion of errors (BUST) and percent correct (PC) of the three classes of trophic state are calculated from the contingency Table 3 as follows:
R E L = A + F + K M + N + O B U S T = I + F + C M + N + O P C = A + F + K P 100
where A and P carry the same meanings defined earlier in the contingency table. The values of BUST and PC imply the following FUI performances: perfect agreement when BUST = 0 and PC = 1, worst FUI performance for BUST = 1 and PC = 0.

3.5. Composite Analysis for Establishing Qualitative Causal Linkage between FUI and Environmental Factors

Composite analysis (CA) is used to establish the causal linkage between two environmental variables qualitatively [80]. CA was introduced by [81,82] for the first time in space science and since then it is widely applied in different disciplines of science [83,84,85]. CA requires basis vectors (usually two dimensions) to define the direction of change of the response variables. In this study, terciles (below normal, normal, and above normal), and extremes (15 and 85 percentiles) determined from driver variables are used as basis vectors to represent the direction of change of hydrometeorological land-use–land-cover change. Moreover, normal ( S P E I 0 ) , moderate ( 1 < S P E I < 0 ) , severe ( 1.5 < S P E I 1 ) , and extreme ( S P E I 1.5 ) drought categories are employed as basis vectors to determine the direction of the response of the water quality index (FUI) when subjected to different classes of drought. For the sake of simplicity, the basis vectors (i.e., terciles, extreme percentiles, and drought categories) for the CA are computed from the sum of the first few leading principal components of the driving variables.

4. Results and Discussion

4.1. Performance of FUI as a Trophic State Indicator Based on Categorical Statistical Metrics and Pearson Correlation

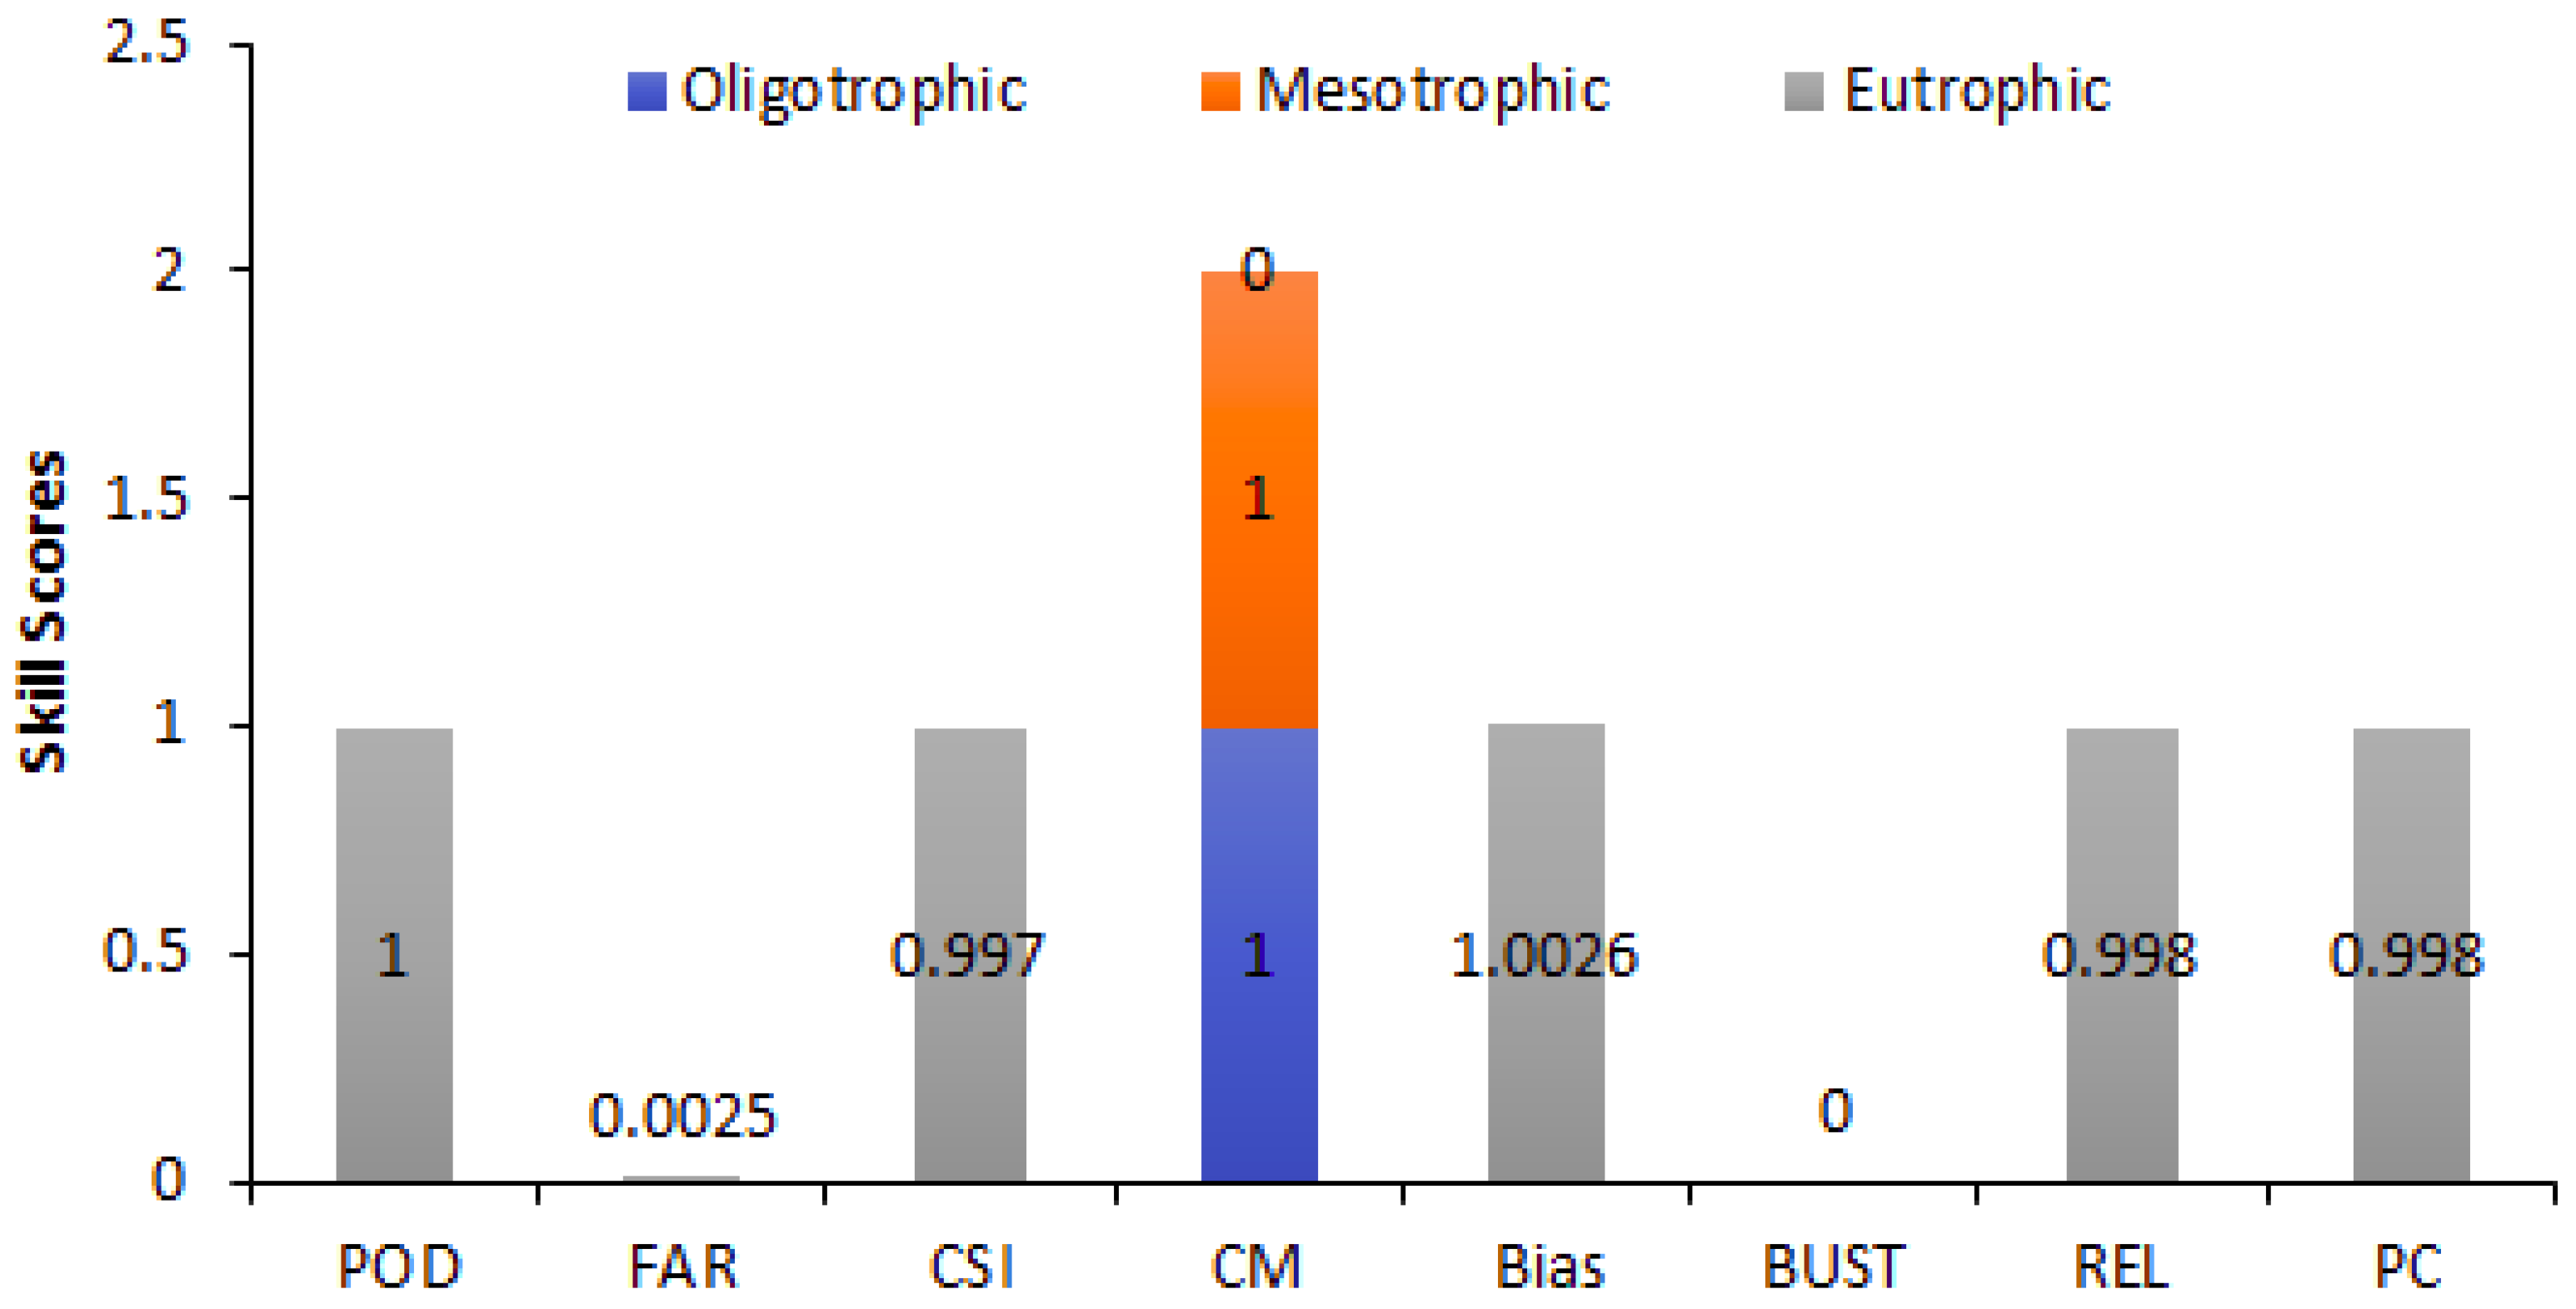
This paper uses eight categorical skill scores to evaluate the performance of FUI-based classifications of lake water trophic states relative to MERIS-based TSI derived from FUBchl-a retrieval algorithm. The use of TSI as a reference water quality index is based on the assumption that TSI is relatively accurate since MERIS used an advanced retrieval algorithm to determine water quality parameters, such as CDOM, Chl_a, turbidity, and TSM. Moreover, the full characterization (of the quality of the data) is published under the Diversity-II dataset [54] and it is publically available. Figure 3 shows the performance of FUI relative to TSI based on categorical statistics for each trophic state class. The lake-wide POD (Figure 3) of the eutrophic state is 100%. The FAR of the eutrophic state is 0.25%. The fact that all the categorical metrics (Figure 3) show perfect skill scores of FUI relative TSI indicates there is only a handful of mesotrophic water quality states according to TSI but not captured by FUI. Both indices indicate that there is no oligotrophic state in Lake Tana throughout the study period.
This lake-wide relationship between the two measures of trophic states is further investigated whether it exists between lake water FUI and TSM, TSI, turbidity, Chl_a, and CDOM at the pixel scale utilizing the Pearson correlation (Figure 4). Figure 4a shows that there is a statistically significant positive relationship between FUI and TSI over the central and northern parts of the lake. The correlation between TSI and FUI is statistically insignificant at the 95% significance level over nearly all shorelines of the lake, with exception of northern shorelines across 37.3 ° E. The correlation between FUI and TSM is positive over areas enclosed between 37.2 and 37.5 ° E northward of 11.9 ° N, where negative significant correlations are observed over the eastern shorelines and close to the western shorelines (Figure 4b). The negative correlation along the eastern shorelines includes the area covered by water hyacinths reported by previous studies [27,28,29,30,31]. A similar relationship between FUI and Chl_a (Figure 4f) was observed at the eastern shorelines. These parts of the lake are mostly mixed pixels of water and vegetation and probably the cause of negative correlations. Reflectance from the shallow surface at the shoreline could also alter the relationship between FUI and other OAC variables. As we have not applied any filter to remove either shallow parts of the lake or mixed pixels from the analysis, the FUI estimates near the shorelines may not be as robust as they are at the interior of the lake. In contrast, the relationships between the FUI and CDOM at the northern, western, and eastern-near shorelines of the lake are positive (Figure 4c). Again, it is likely the FUI estimates have suffered from the same sources errors as above. Our results also show that the correlation between FUI with both turbidity and FUBchl-a is strongly positive from the north down to the central part of the lake. Despite this, the relationship at the shoreline of the lake is statistically insignificant throughout the study period (Figure 4d,e). The strong correlation between FUI and turbidity covers broader parts of the lake revealing the direct relationship between the two. In view of the fact that the high performance of FUI is limited to only pure water pixels and deeper parts of the lake as revealed by the good agreement between FUI and turbidity, we restricted the further analysis to this portion of the lake.

4.2. The Spatiotemporal Variability of FUI of Lake Tana’s Water

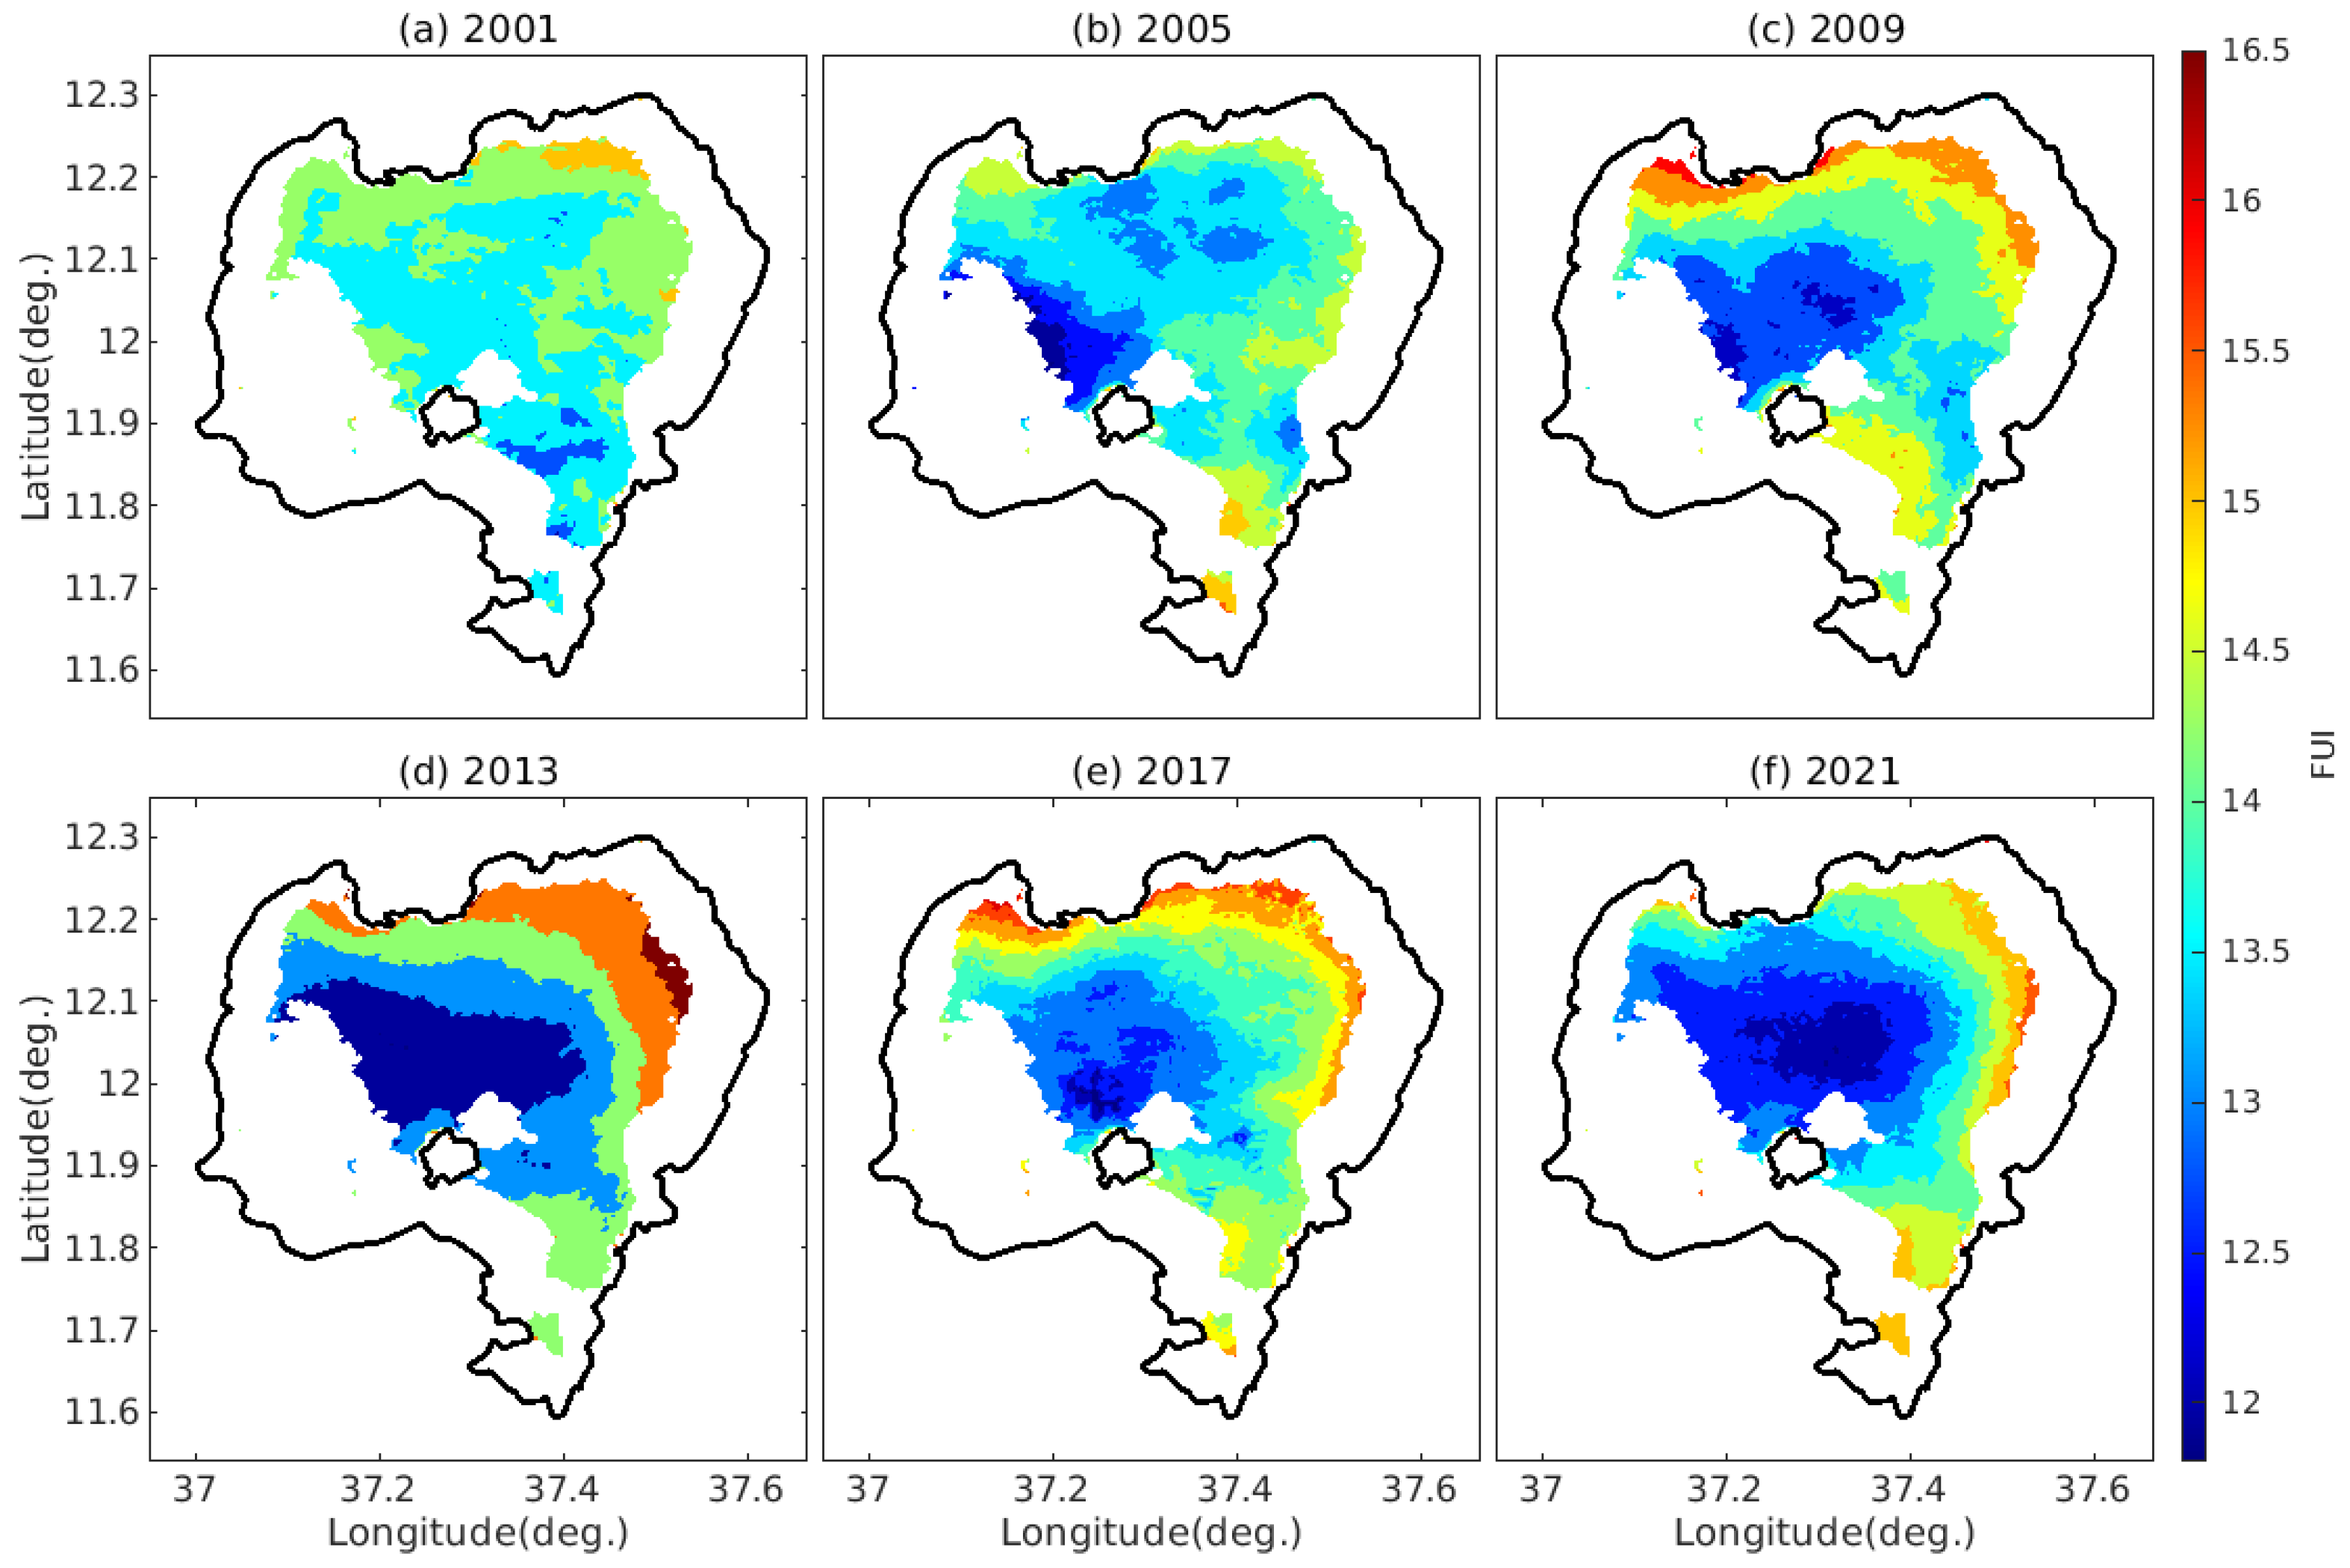
The spatial distribution of annual mean FUI color value shows marked variation between 2000 to 2021 in Lake Tana (Figure 5). Figure 5a shows that, in 2001, almost all of the lake water have FUI exceeding a value of 16 indicating the presence of highly turbid water. The quality of lake water shows a significant change in 2005 in most of the lake except at the shorelines of the lake compared to 2001 (Figure 5b). This improvement in water quality continued into 2021 reaching an FUI value of 12 over wider areas in the northern part of the lake (Figure 5c–f).
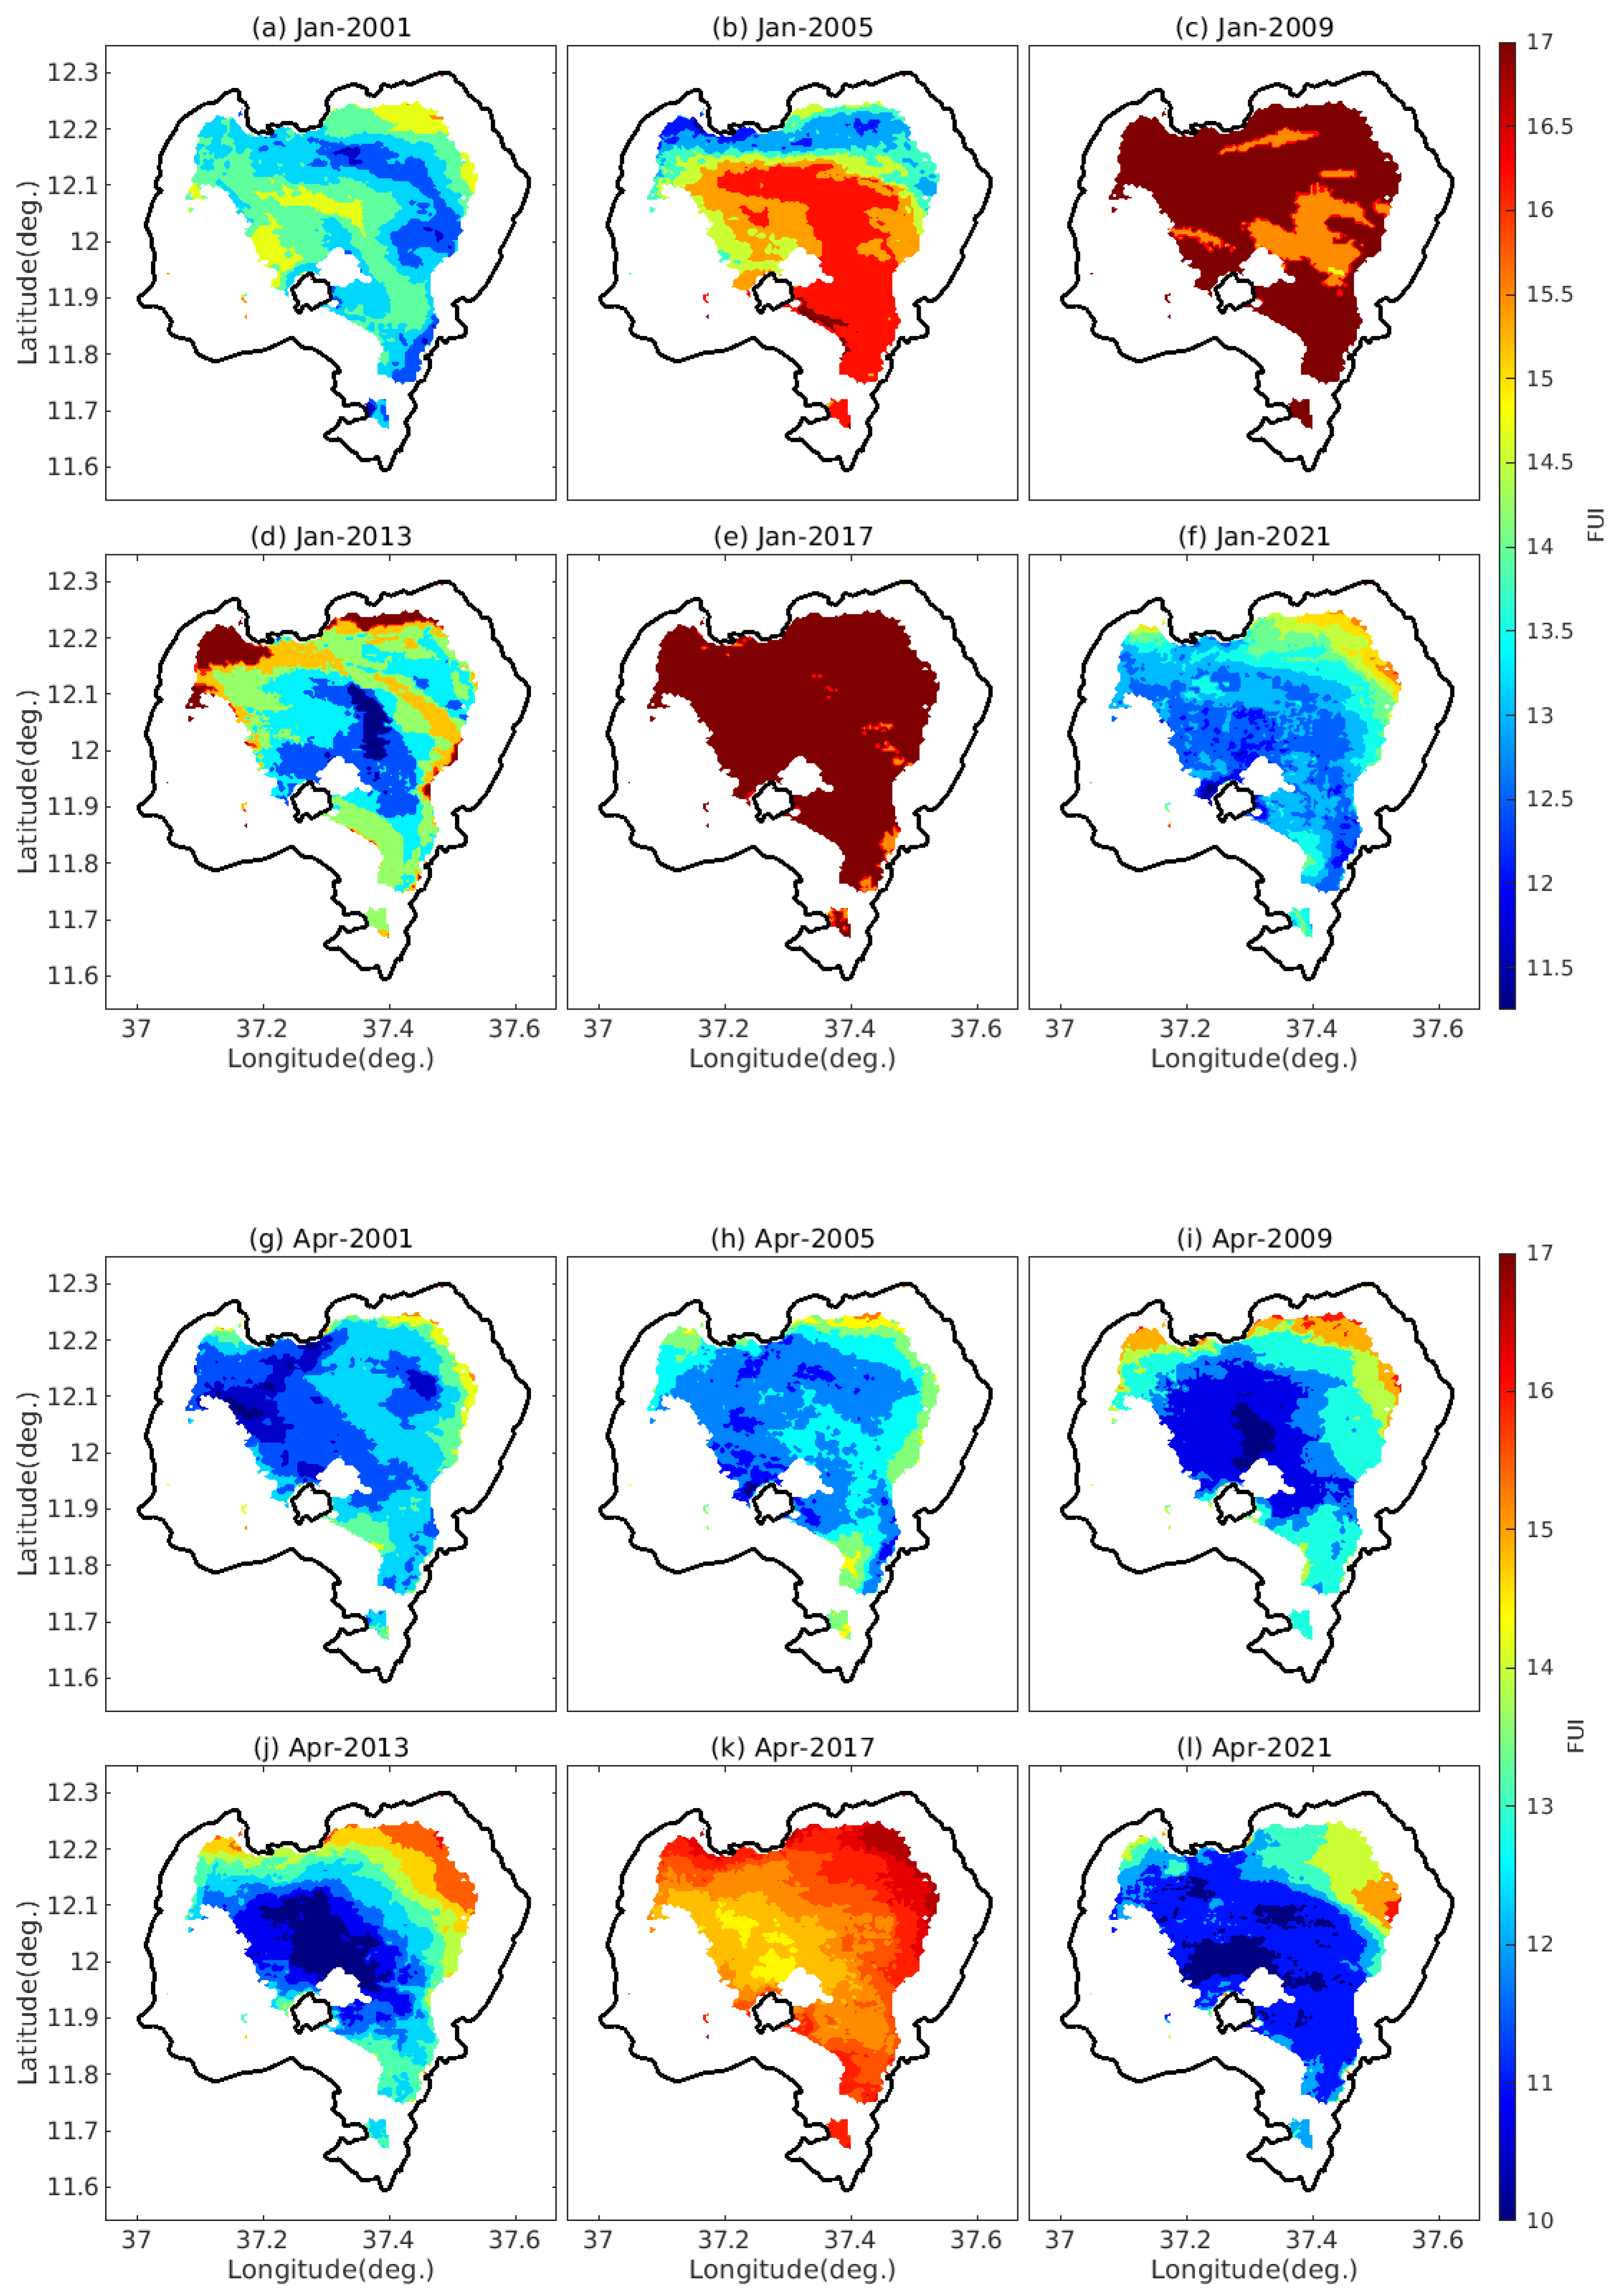
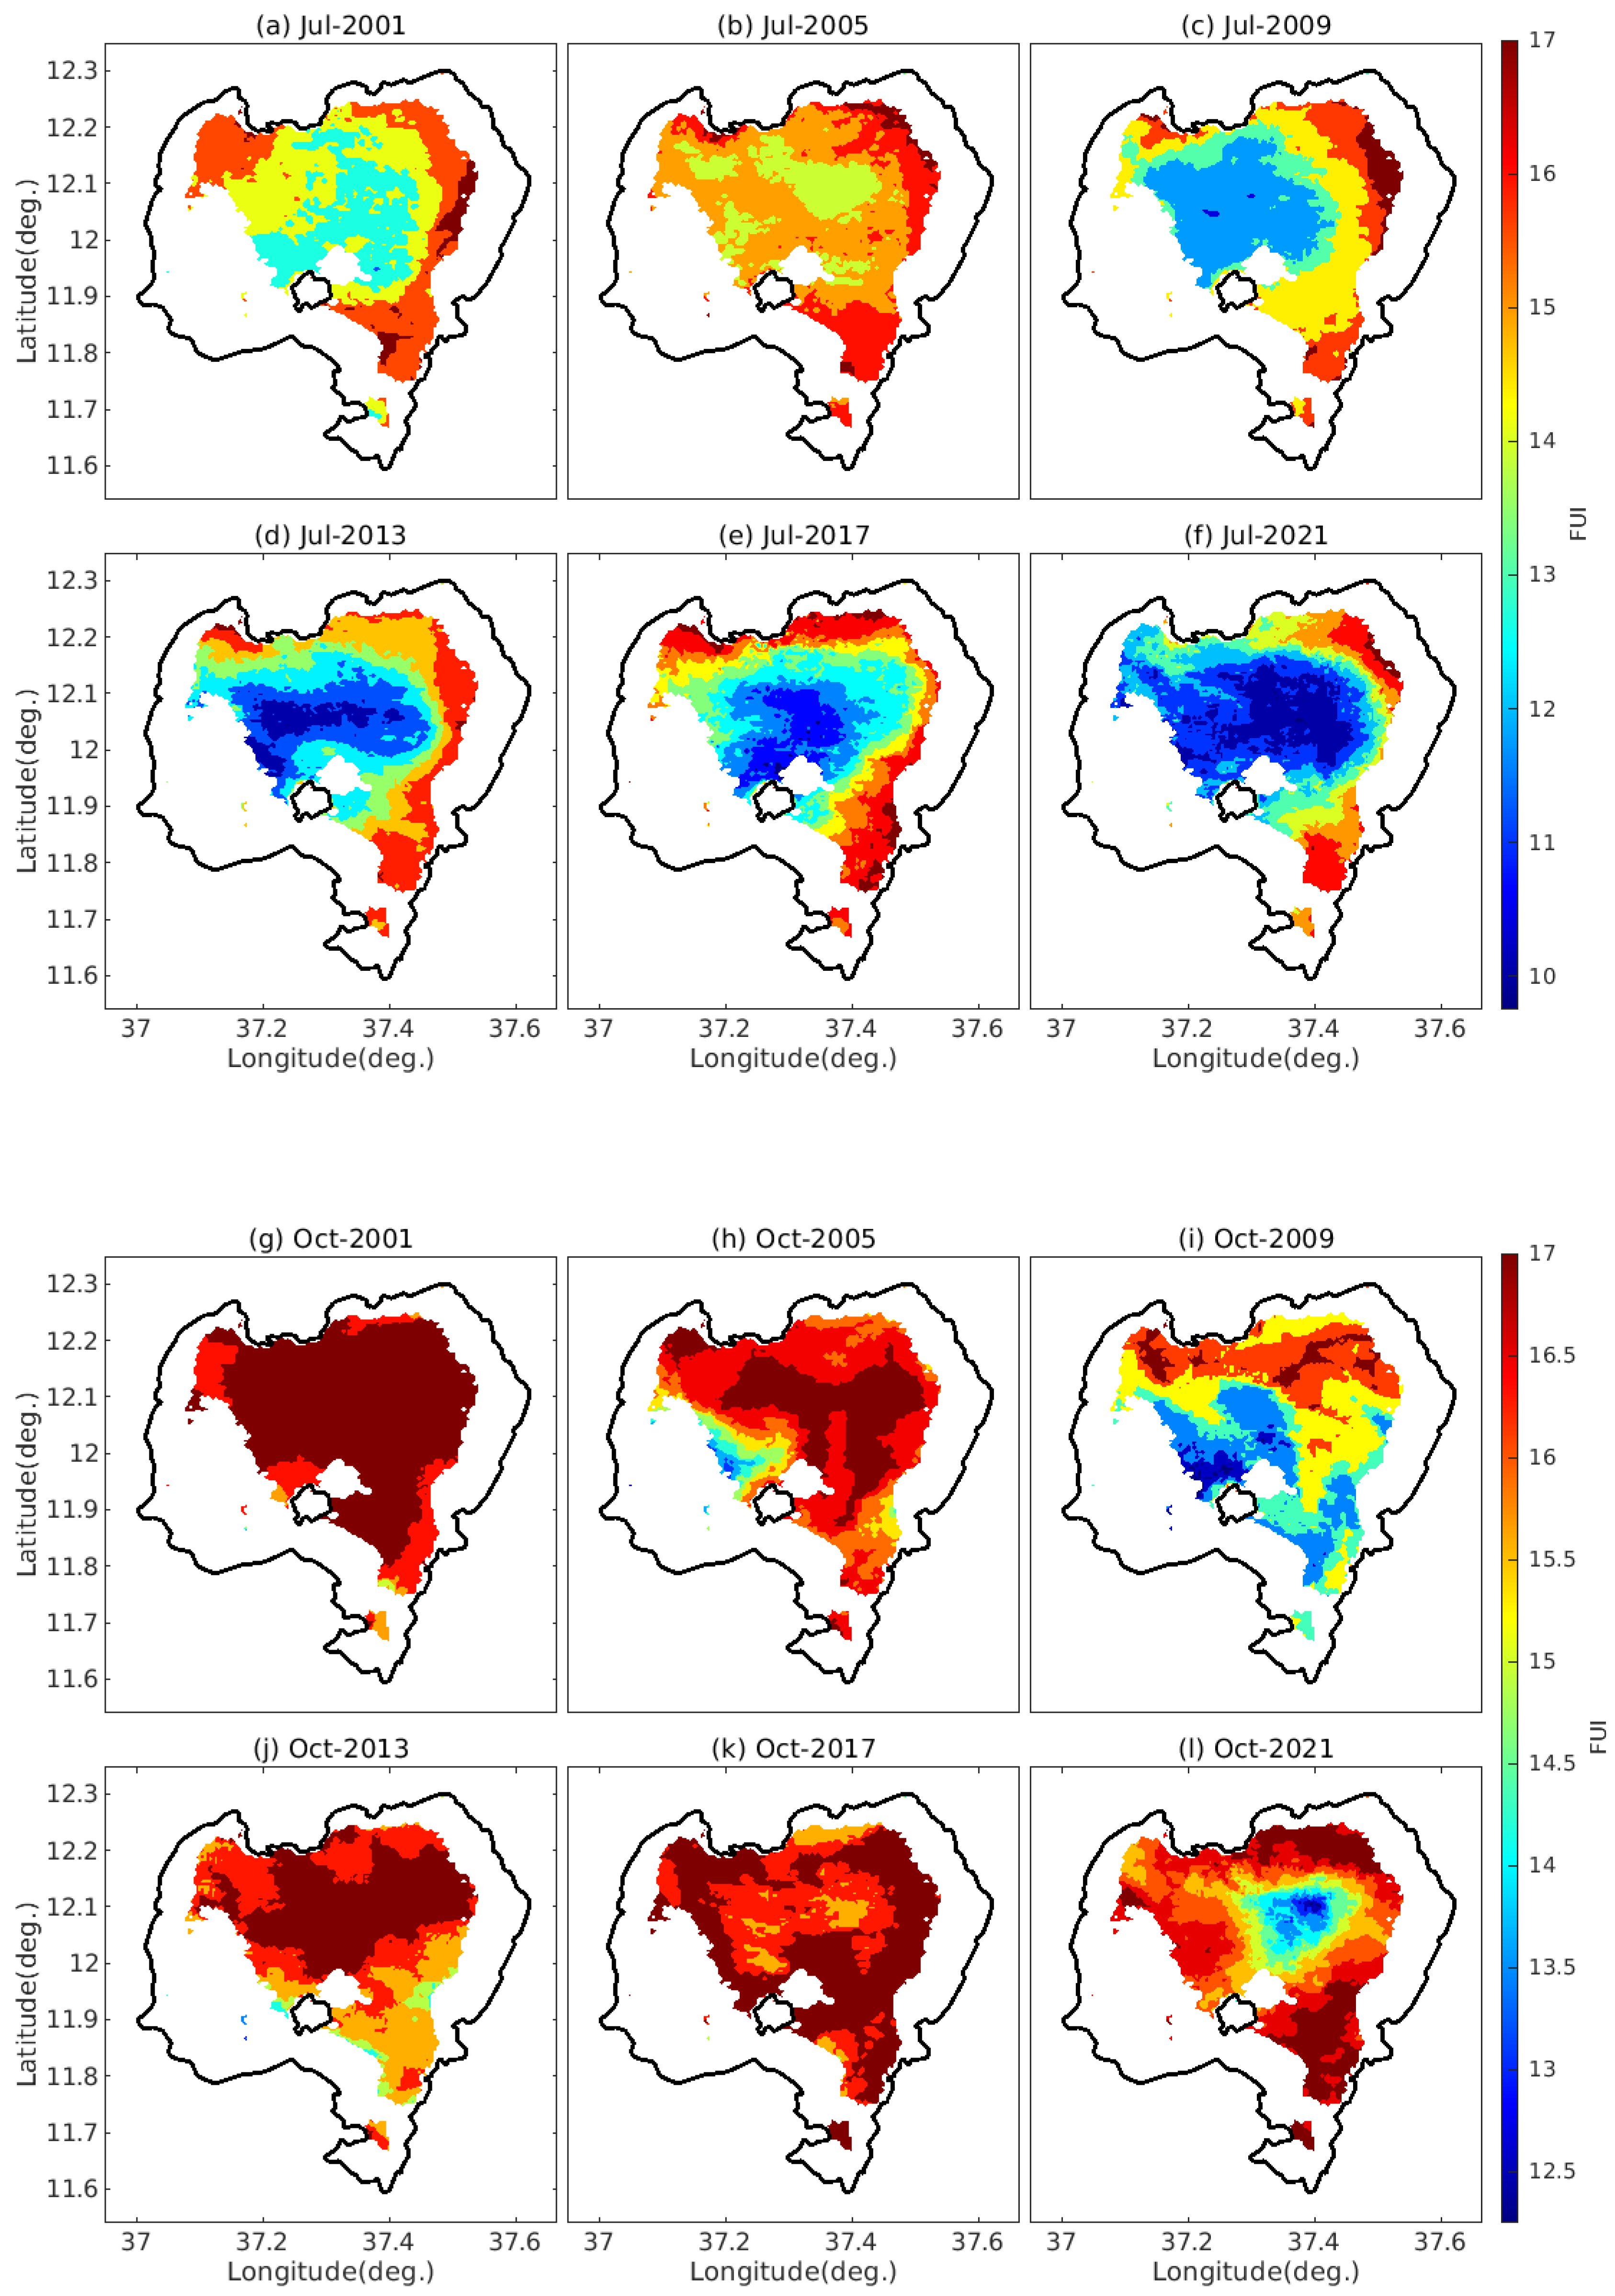
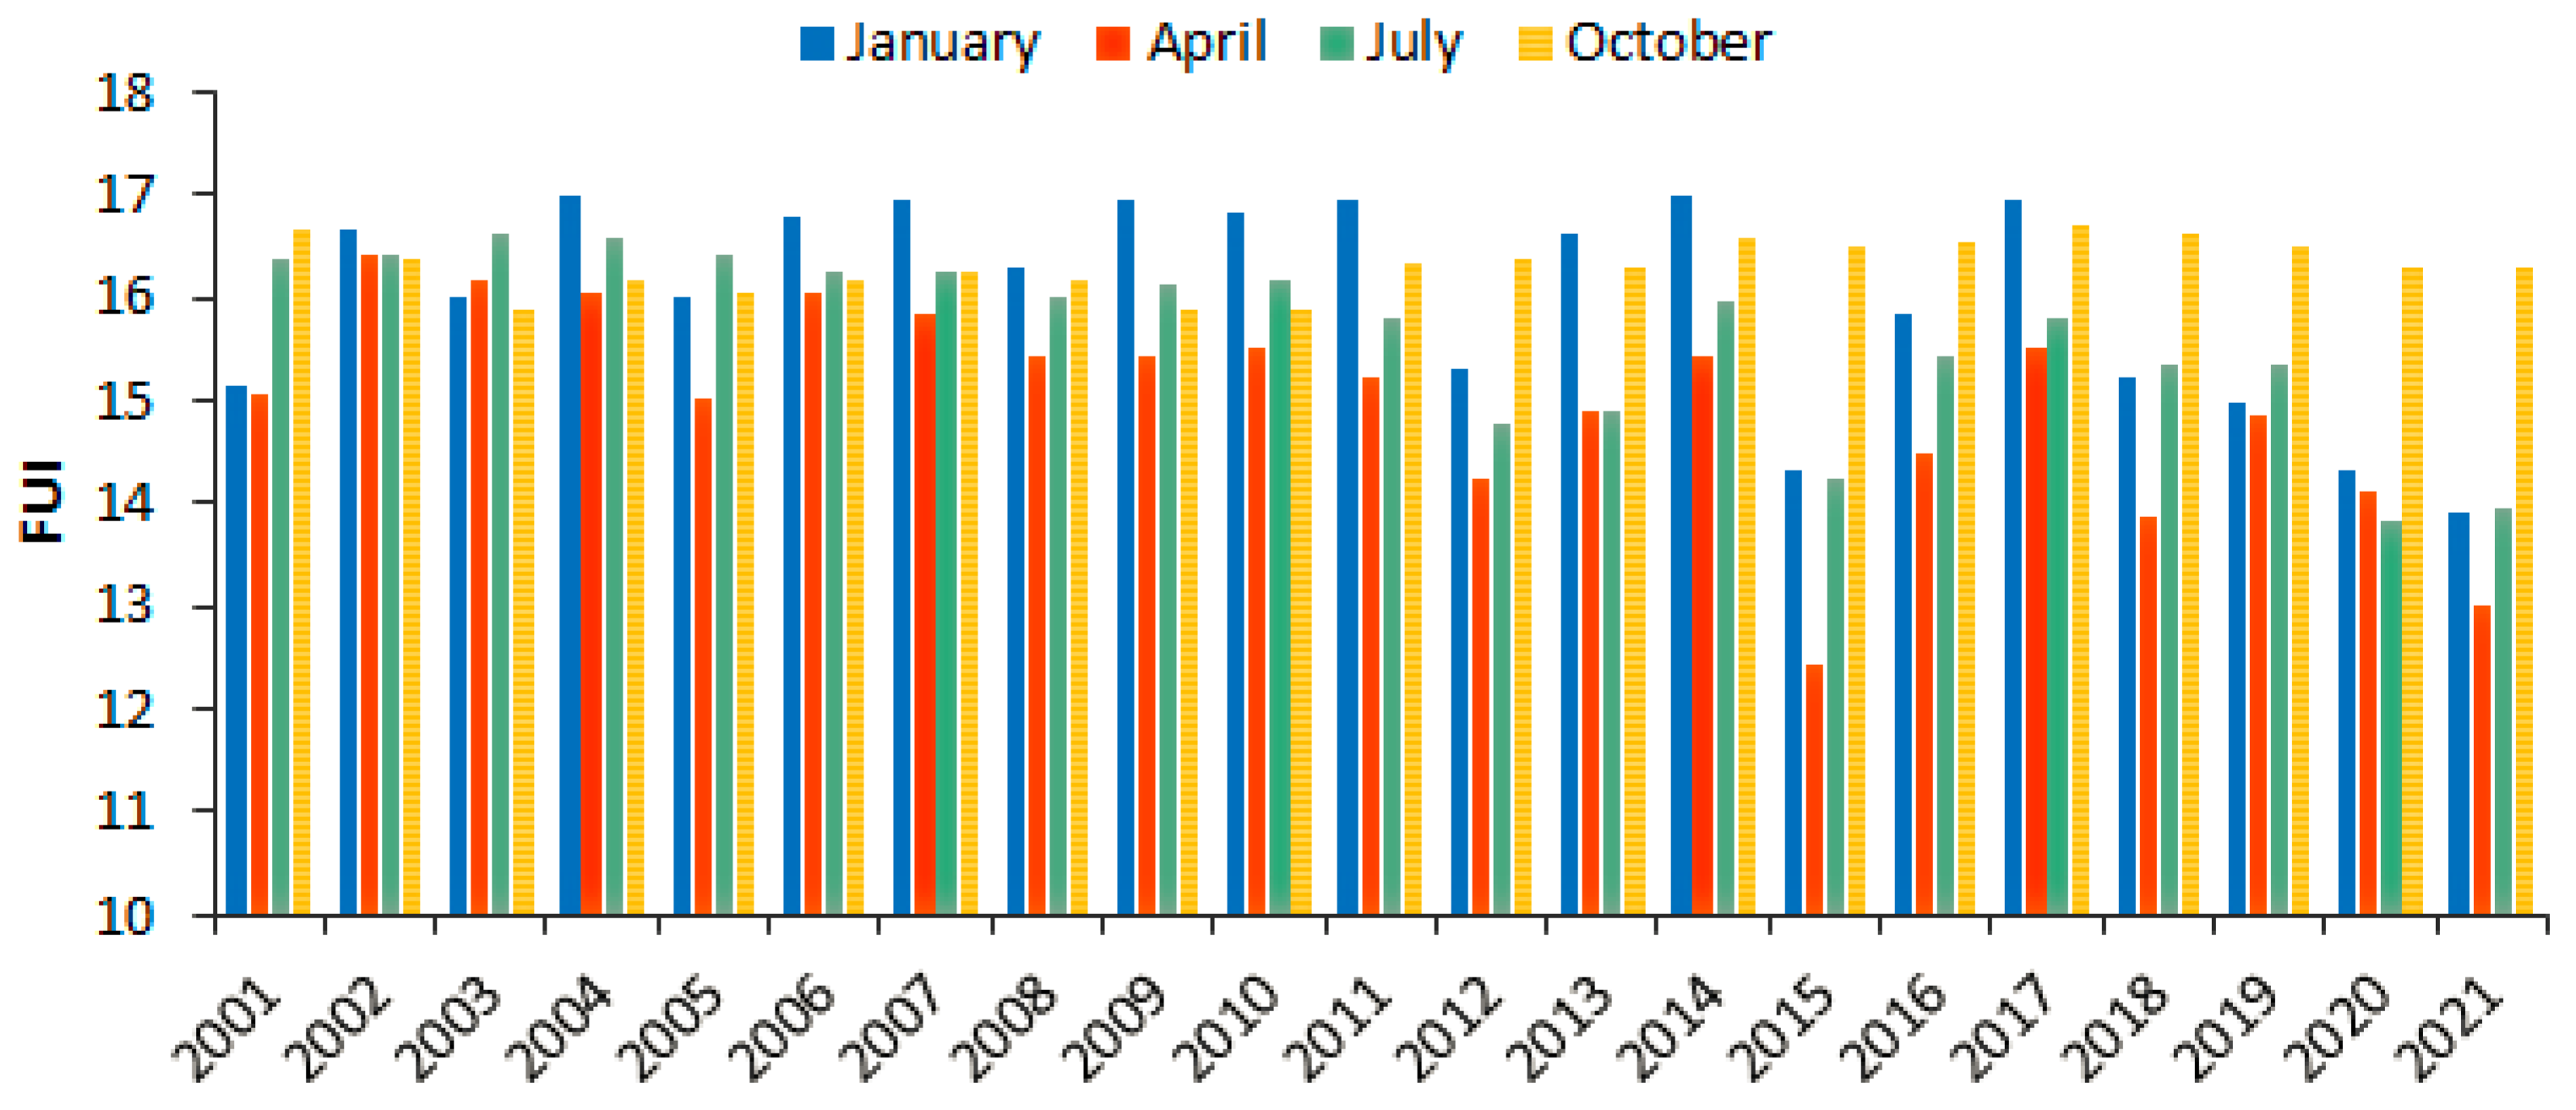
It is also important to investigate the interannual variability of FUI during a specific month to isolate interannual variability from seasonal variability. For example, during the winter month (January), the FUI time series shows that it increased from January 2001 (Figure 6a) to January 2005 (Figure 6b) and remained unchanged the following years (see 2009, 2013, and 2017 in Figure 6c–e) until it started diminishing in January 2021 (Figure 6f) reaching a value of 12 at the northern and central part of the lake. In the spring month (April), the FUI over the lake decreased except for spikes in 2017 (Figure 6g–l). The consistent decrease in FUI in both annual and spring FUI time series reveals that there are changes in the water quality drivers. Accordingly, further appraisal of the effect of changes in environmental drivers is necessary to understand the observed dynamics in the lake water quality during other seasons. The variability of FUI during the summer month of July showed a similar pattern of changes as in spring with a spike in 2017 and consistent improvement from year to year (Figure 6a–f). However, the changes in FUI during the autumn month of October do not show significant improvement except in 2021 over the northern and central part of the lake (Figure 6g–l). This pattern is somewhat similar to that of the winter month of January (Figure 6a–f). The lack of consistency between the seasons in terms of FUI variability might be linked to the difference in the scale of variability of meteorological and hydrological drivers during the different seasons. The lake-wide mean FUI during the peak months of summer, winter, spring, and autumn is in agreement with the observed FUI at the pixel level (Figure 6 and Figure 7) as noted from a consistent improvement in lake water quality from 2001 to 2021 for the months of April and July with a spike around 2017 and an insignificant trend during the months of January and October (Figure 8).

4.3. FUI Composites over Lake Tana under Different Directions of Changes of the Deriving Factors

The FU index values of Lake Tana are above the eutrophic threshold values with minimum and maximum values of 11 and 17 respectively. In other words, the trophic state of the lake is eutrophic during our study period. According to both the standards of the Organization for Economic Cooperation and Development (OECD), fixed boundary system and diagnostic model [86] and Carlson’s trophic state classification criteria [55,87], Lake Tana water is found in the eutrophic state. This is also reported by [70]. Therefore, in Section 4.3.1, we investigate the role of hydrometeorological and LULC factors in modulating the variability of FUI from the eutrophic Lake Tana water within the observed range of 11–17 FUI values.

4.3.1. FUI Composites under Different Ranges of Temperature and Evaporation

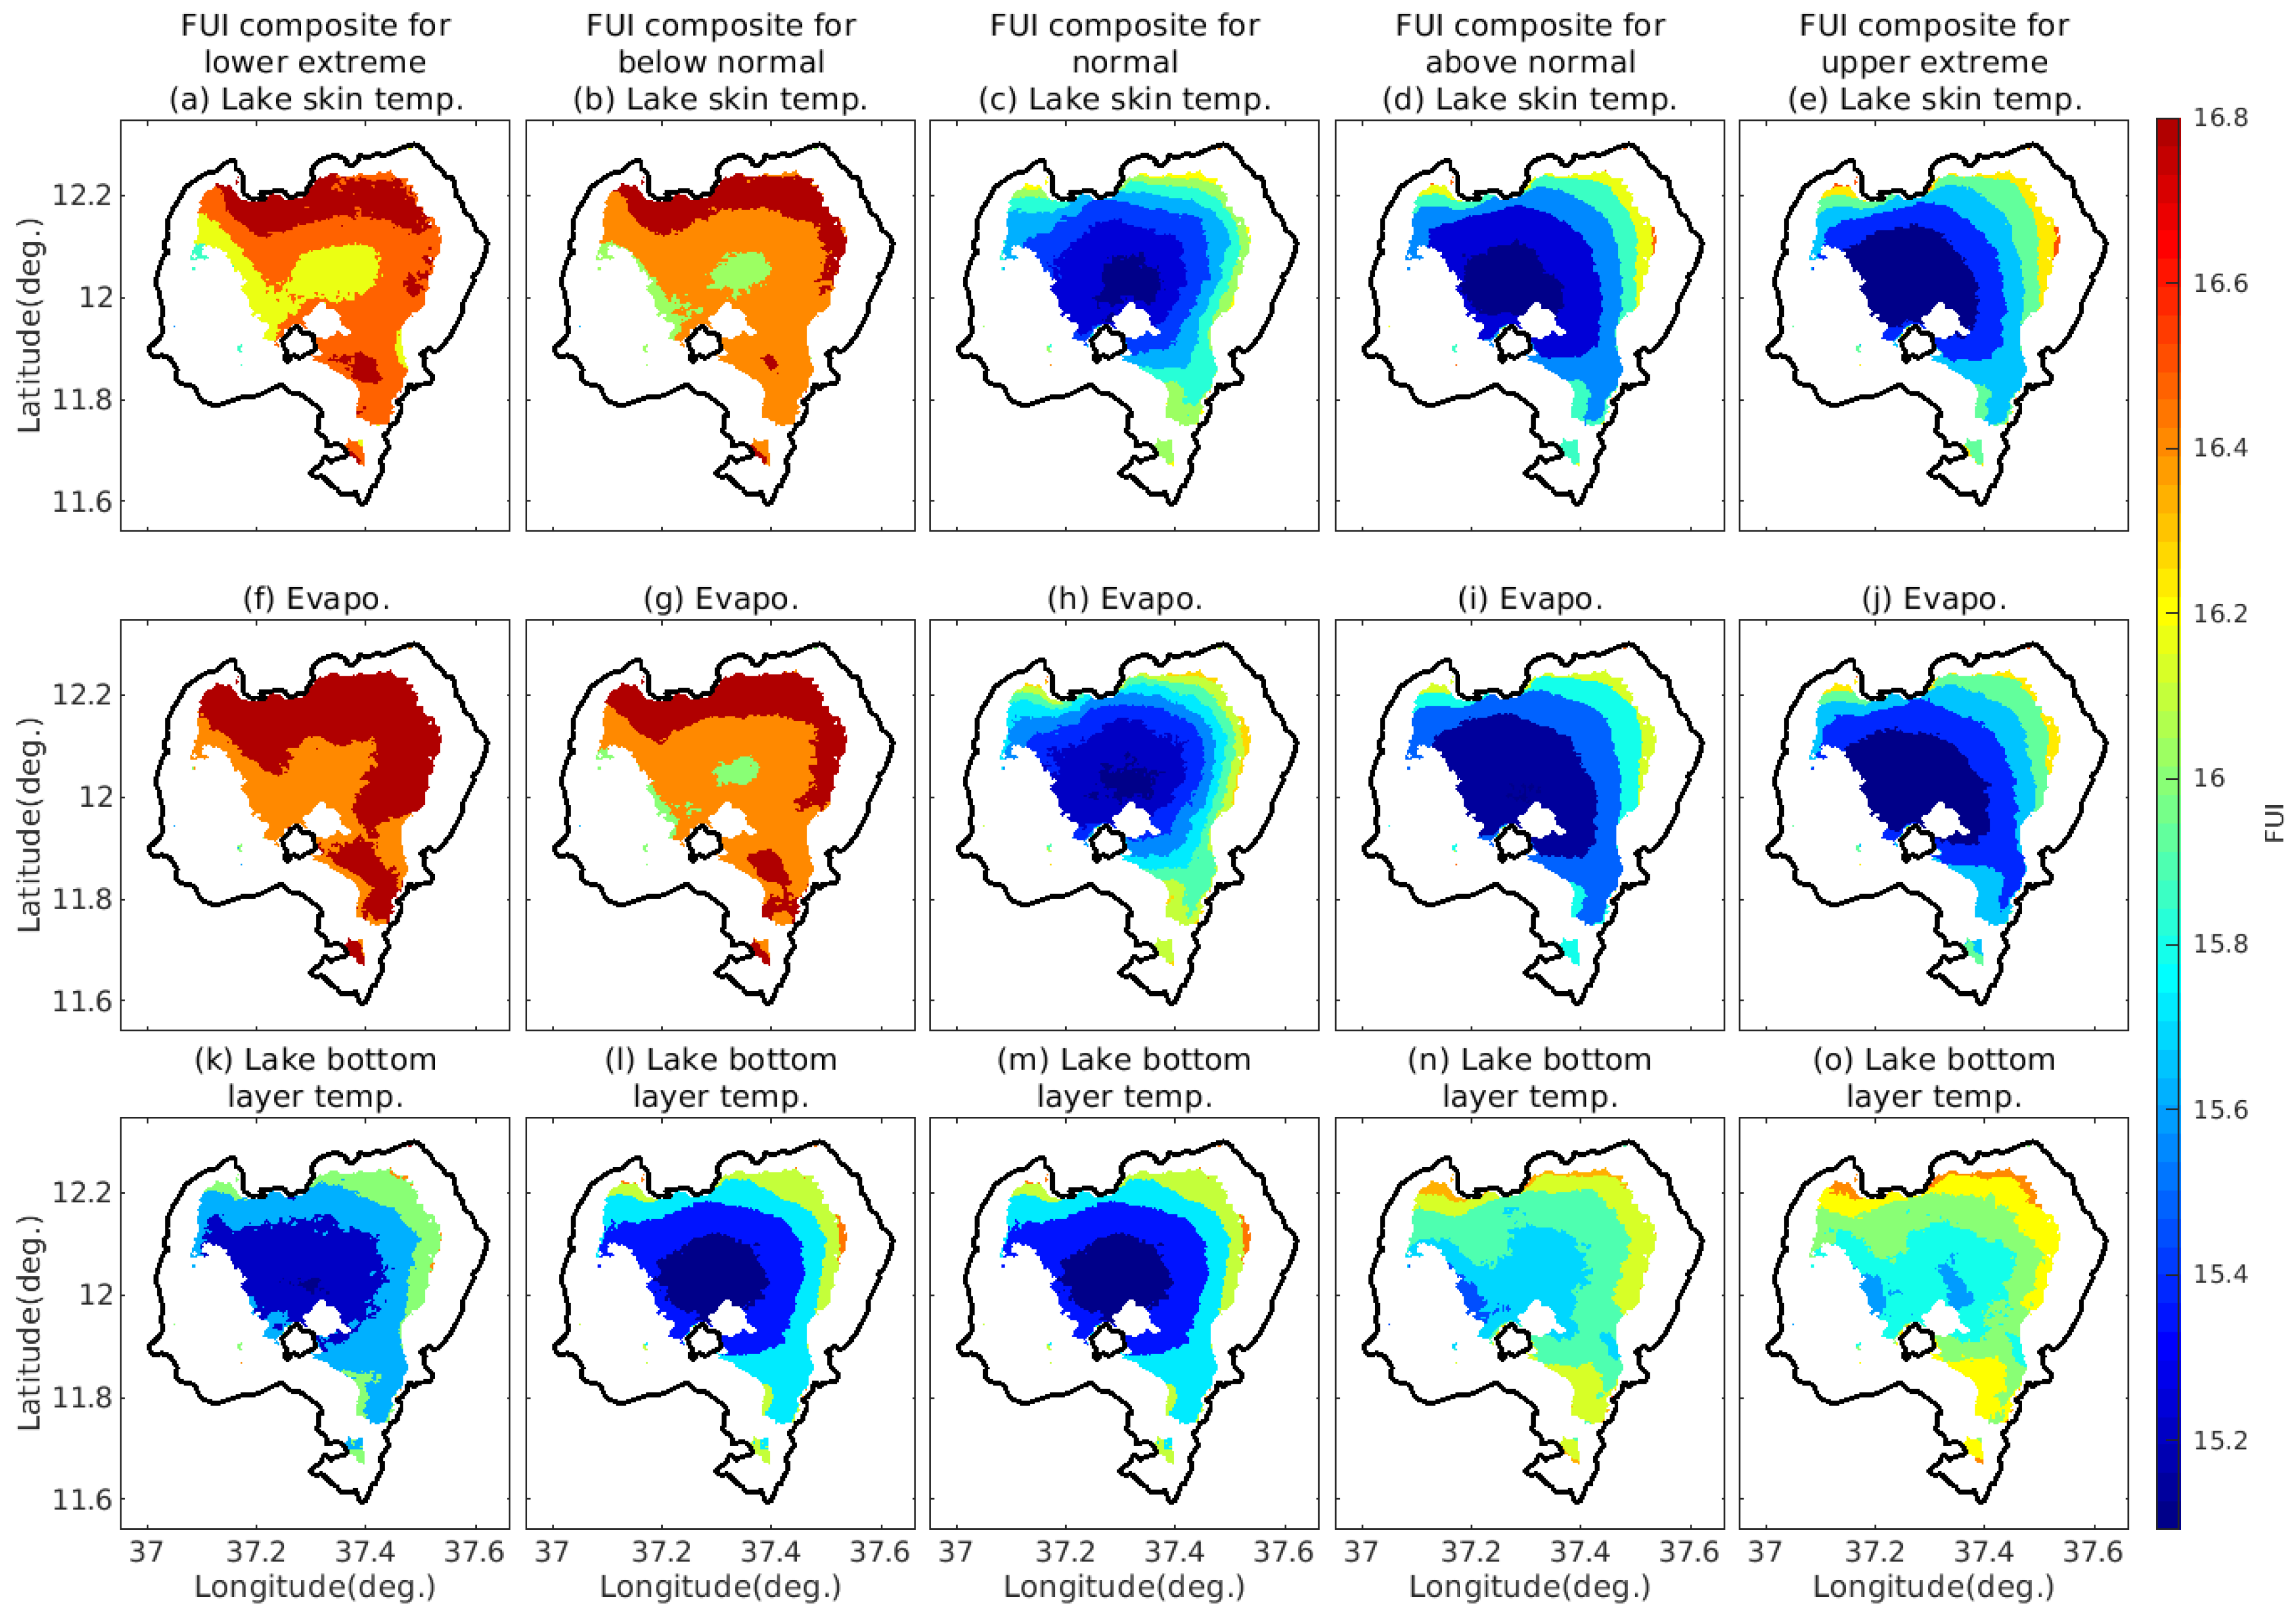
To evaluate the impacts of temperature and evaporation on the variability of FUI (water quality) of Lake Tana, we computed the FUI composite from data belonging to a period of lower extremes, below normal, normal, above normal, and upper extreme values of skin temperature, evaporation, and lake bottom-layer temperature (Figure 9). This allows us to compare the mean FUI during different conditions of the deriving variables and make inferences about whether FUI is enhanced or suppressed during those periods. For example, from Figure 9, one can see that the composites of FUI show a decreasing trend with an increase in the lake skin temperature (Figure 9a–e). This is due to the fact that temperature influences ecosystems such as metabolism, growth, survival, interactions among species, and production of living organisms. The FUI composite also decreases with increasing evaporation (Figure 9f–j). As a result, both of them show similar influences on the quality of inland water bodies. Moreover, the warmer temperature diminishes the surface water viscosity and increases nutrient dispersion and stratification, and speeds up the sinking rate of phytoplankton, giving more opportunity for cyanobacteria (algal bloom) to form in the water system [88]. Diminishing viscosity will speed up the sinking of bigger phytoplankton with weak buoyancy force and opens further opportunities for cyanobacteria in the water system since numerous cyanobacteria regulate buoyancy force to counterbalance their sedimentation [89]. For instance, increased heat may affect the stratification process and usually diminishes the accessibility of nutrients in inland surface water bodies, favoring cyanobacteria to regulate the buoyancy force and to obtain nutrients from the deeper part of inland water bodies [90].
In contrast, the composites of FUI show an increasing trend with an increase in lake bottom layer temperature (Figure 9k–o). This is attributed to the increasing lake bottom layer temperature which increases the microbial activity in soil and sediments at the bottom of inland water bodies resulting in a high phosphorus load on the surface of the lake according to [91]. Previous findings show that the growth rates of freshwater phytoplankton will decrease while the growth rate of numerous cyanobacteria will increase when the temperature is about 20 ° C [92,93]. When the temperature reaches over 25 ° C, it advances the growth of cyanobacteria contrasting with other phytoplankton groups, such as green algae, and leads to long time cyanobacteria expansions on the water bodies [92,94,95]. High water temperature decreases the self-filtration limit and deterioration coefficients of water thereby expanding the delineation and enhancing the load of internal nutrients. This situation could likely provide a suitable environment for the growth of cyanobacteria [90].

4.3.2. FUI Composites under Different Ranges of Precipitation and Surface Runoff

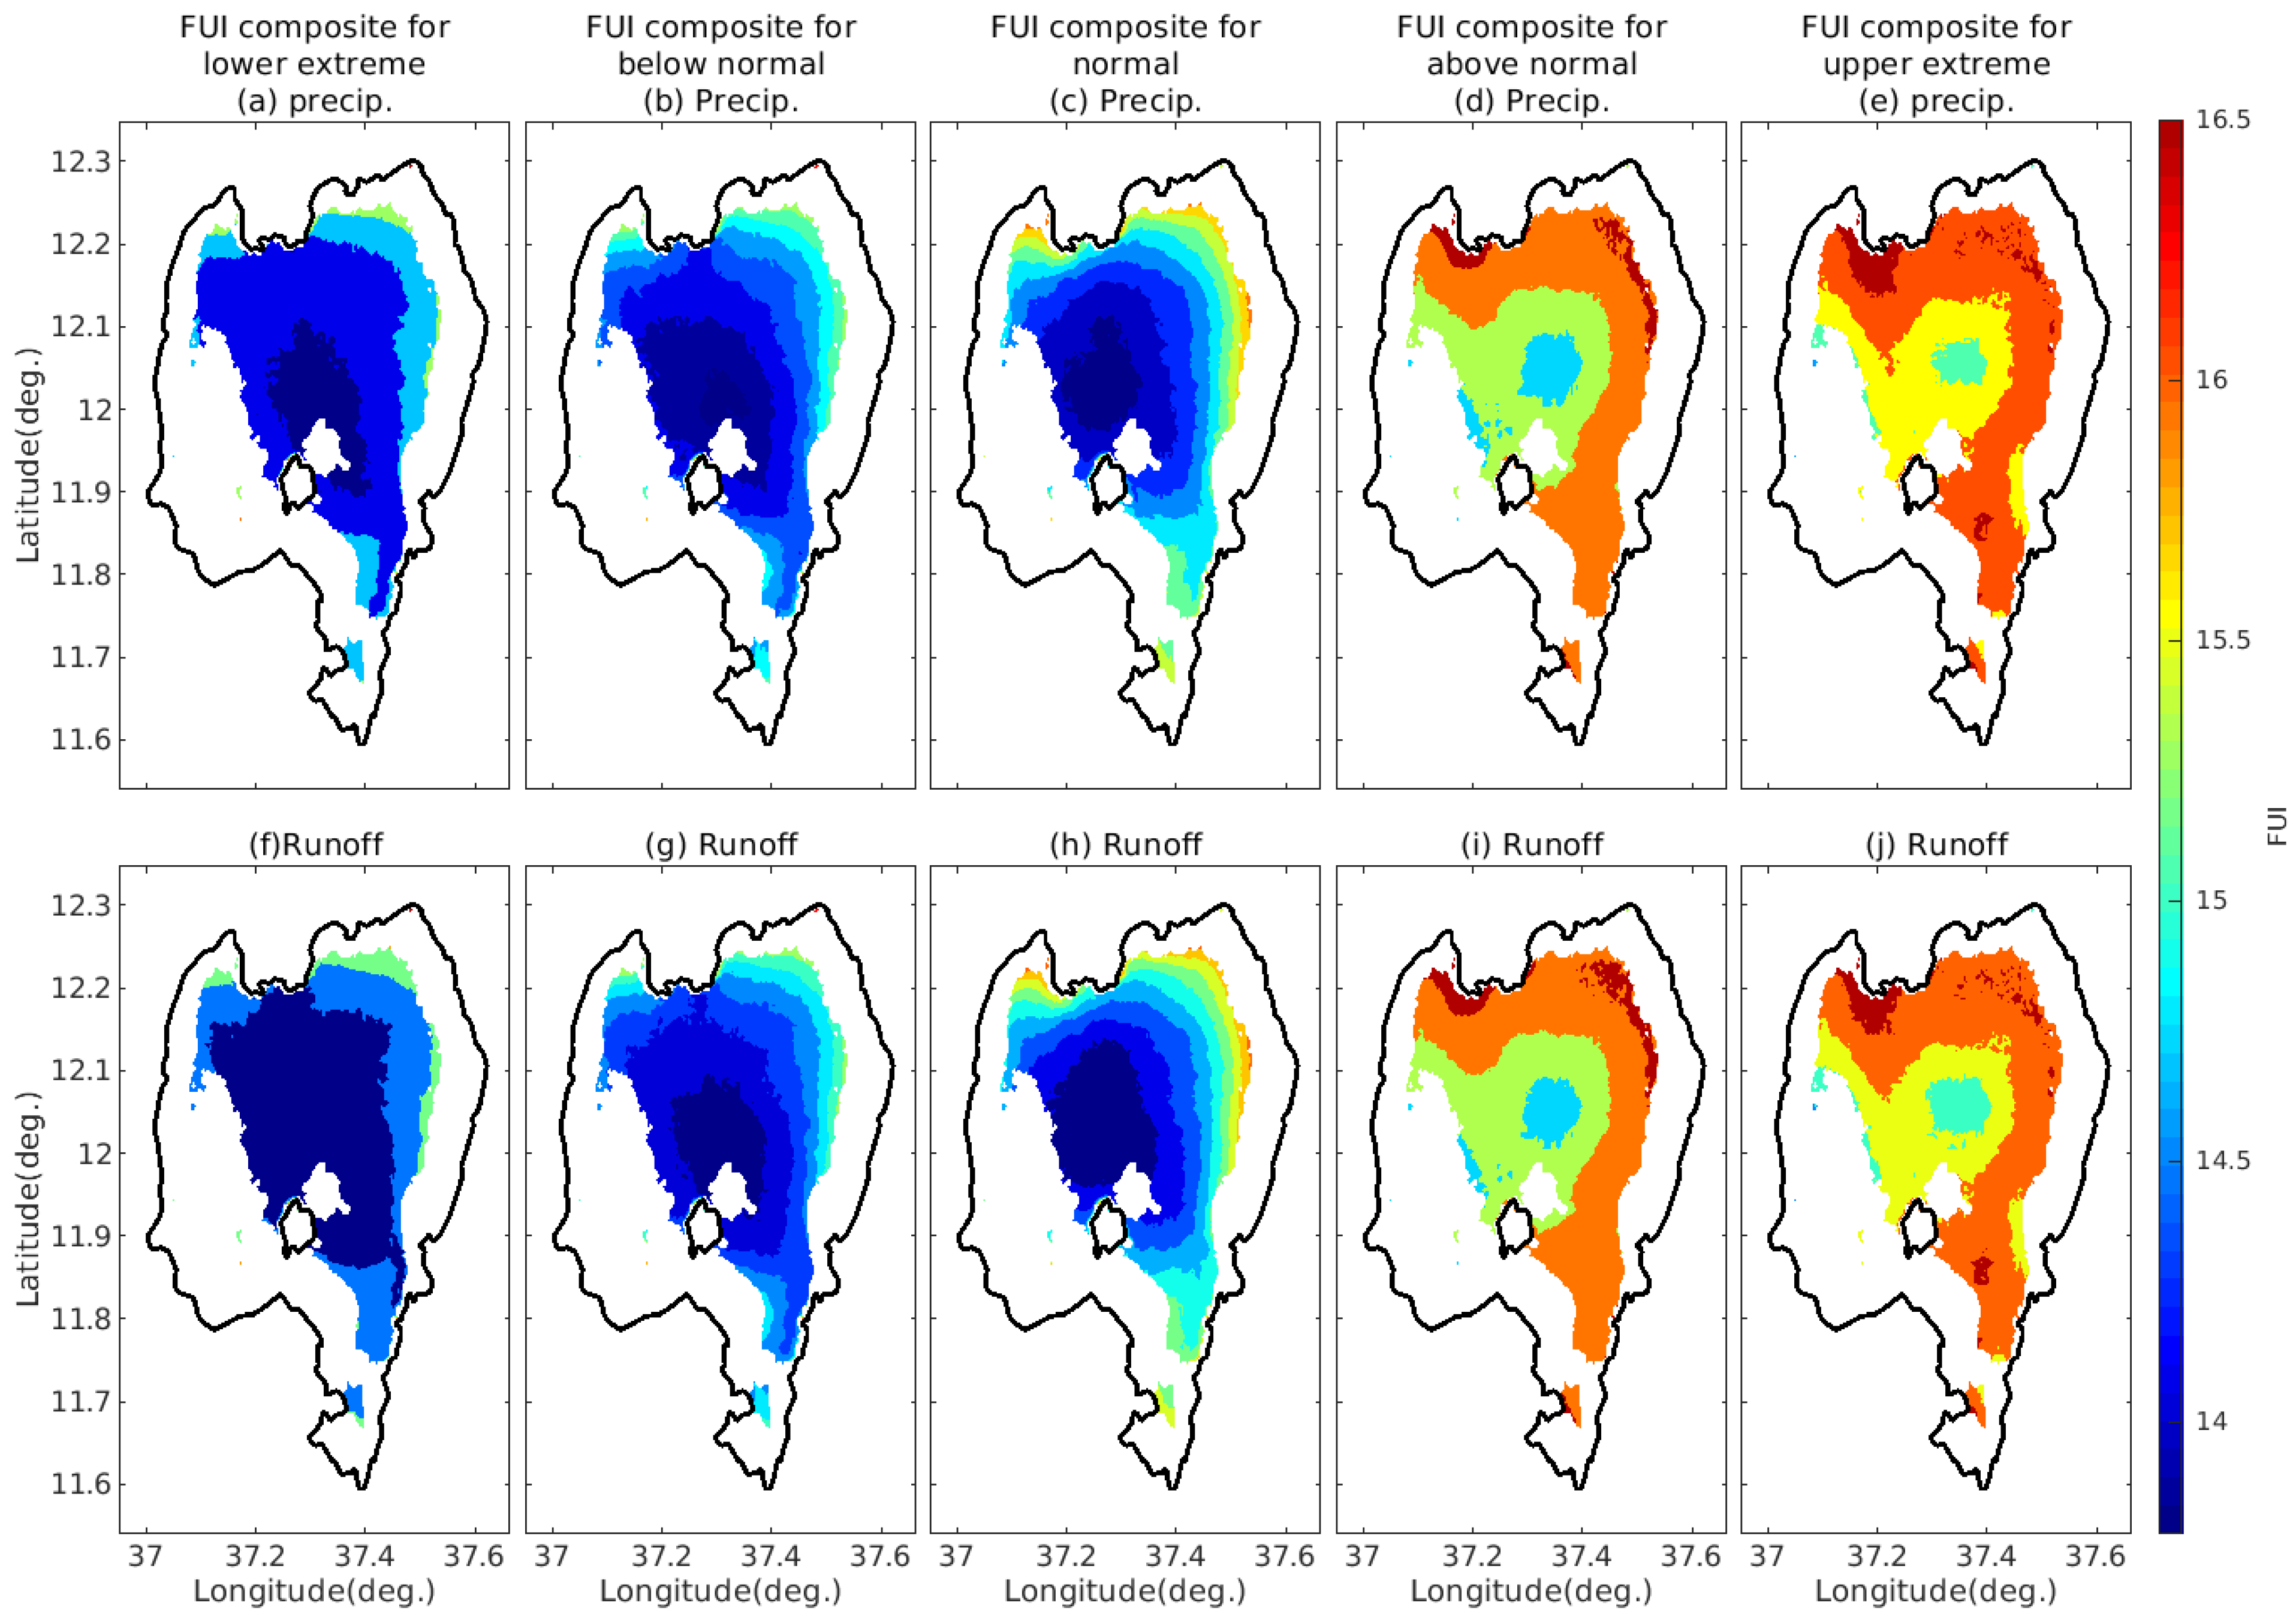
Precipitation and runoff have far-reaching consequences for water quality degradation. The spatial composite of Lake Tana’s FUI shows an increasing trend with an increase in both precipitation and runoff (Figure 10). In other words, the quality of lake water is diminished in response to the increase of precipitation and runoff from lower extremes to upper extremes (Figure 10a–j). This is expected as large and intense precipitation lead to heavy rainfall intensity which is responsible for high sediment transport, erosion and re-suspension within the water bodies. Heavy rainfall intensity also speeds up the mobilization of nutrients on land by collecting non-point pollutants thereby increasing nutrient concentrations on the surface of water bodies. This same relationship between inland water quality, streamflow and climate change was extensively investigated (e.g., [96]) and the effects of extreme flooding on water quality change have also been explored by different authors [97,98,99,100,101]. Moreover, precipitation and surface runoff increase toxin discharge and influence non-point contaminations by mobilizing them over land and expanding nutrient concentrations into the receiving water bodies thereby polluting inland water [89]. Extreme rainfall also increases chemical leaching, nutrient discharge and urban waste from watersheds into water bodies [102]. Heavy rainfall and runoff can mobilize microbes and different microorganisms to streams leading to an increase in bacterial concentrations and diminished water quality. Other than the changes in patterns, intensity and time of occurrence in extreme precipitation events have a significant impact on the physical and chemical properties of inland water bodies [103]. With high flow and speed of surface runoff at the time of a heavy rainfall event, a large amount of nutrients can reach rivers and streams both in dissolved and suspended forms [104,105,106]. In contrast, low precipitation increases the exposure to eutrophication by decreasing the minimum inflows. In this situation, low water volume is accessible and cannot dilute the pollutants. Subsequently, the increment of contaminant concentration leads to deoxygenation by lowering the concentration of dissolved oxygen (DO) and increases the demand for biochemical oxygen in inland water bodies and potentially increases the exposure to eutrophication [101].

4.3.3. FUI Composites under Different Wind Speed Ranges

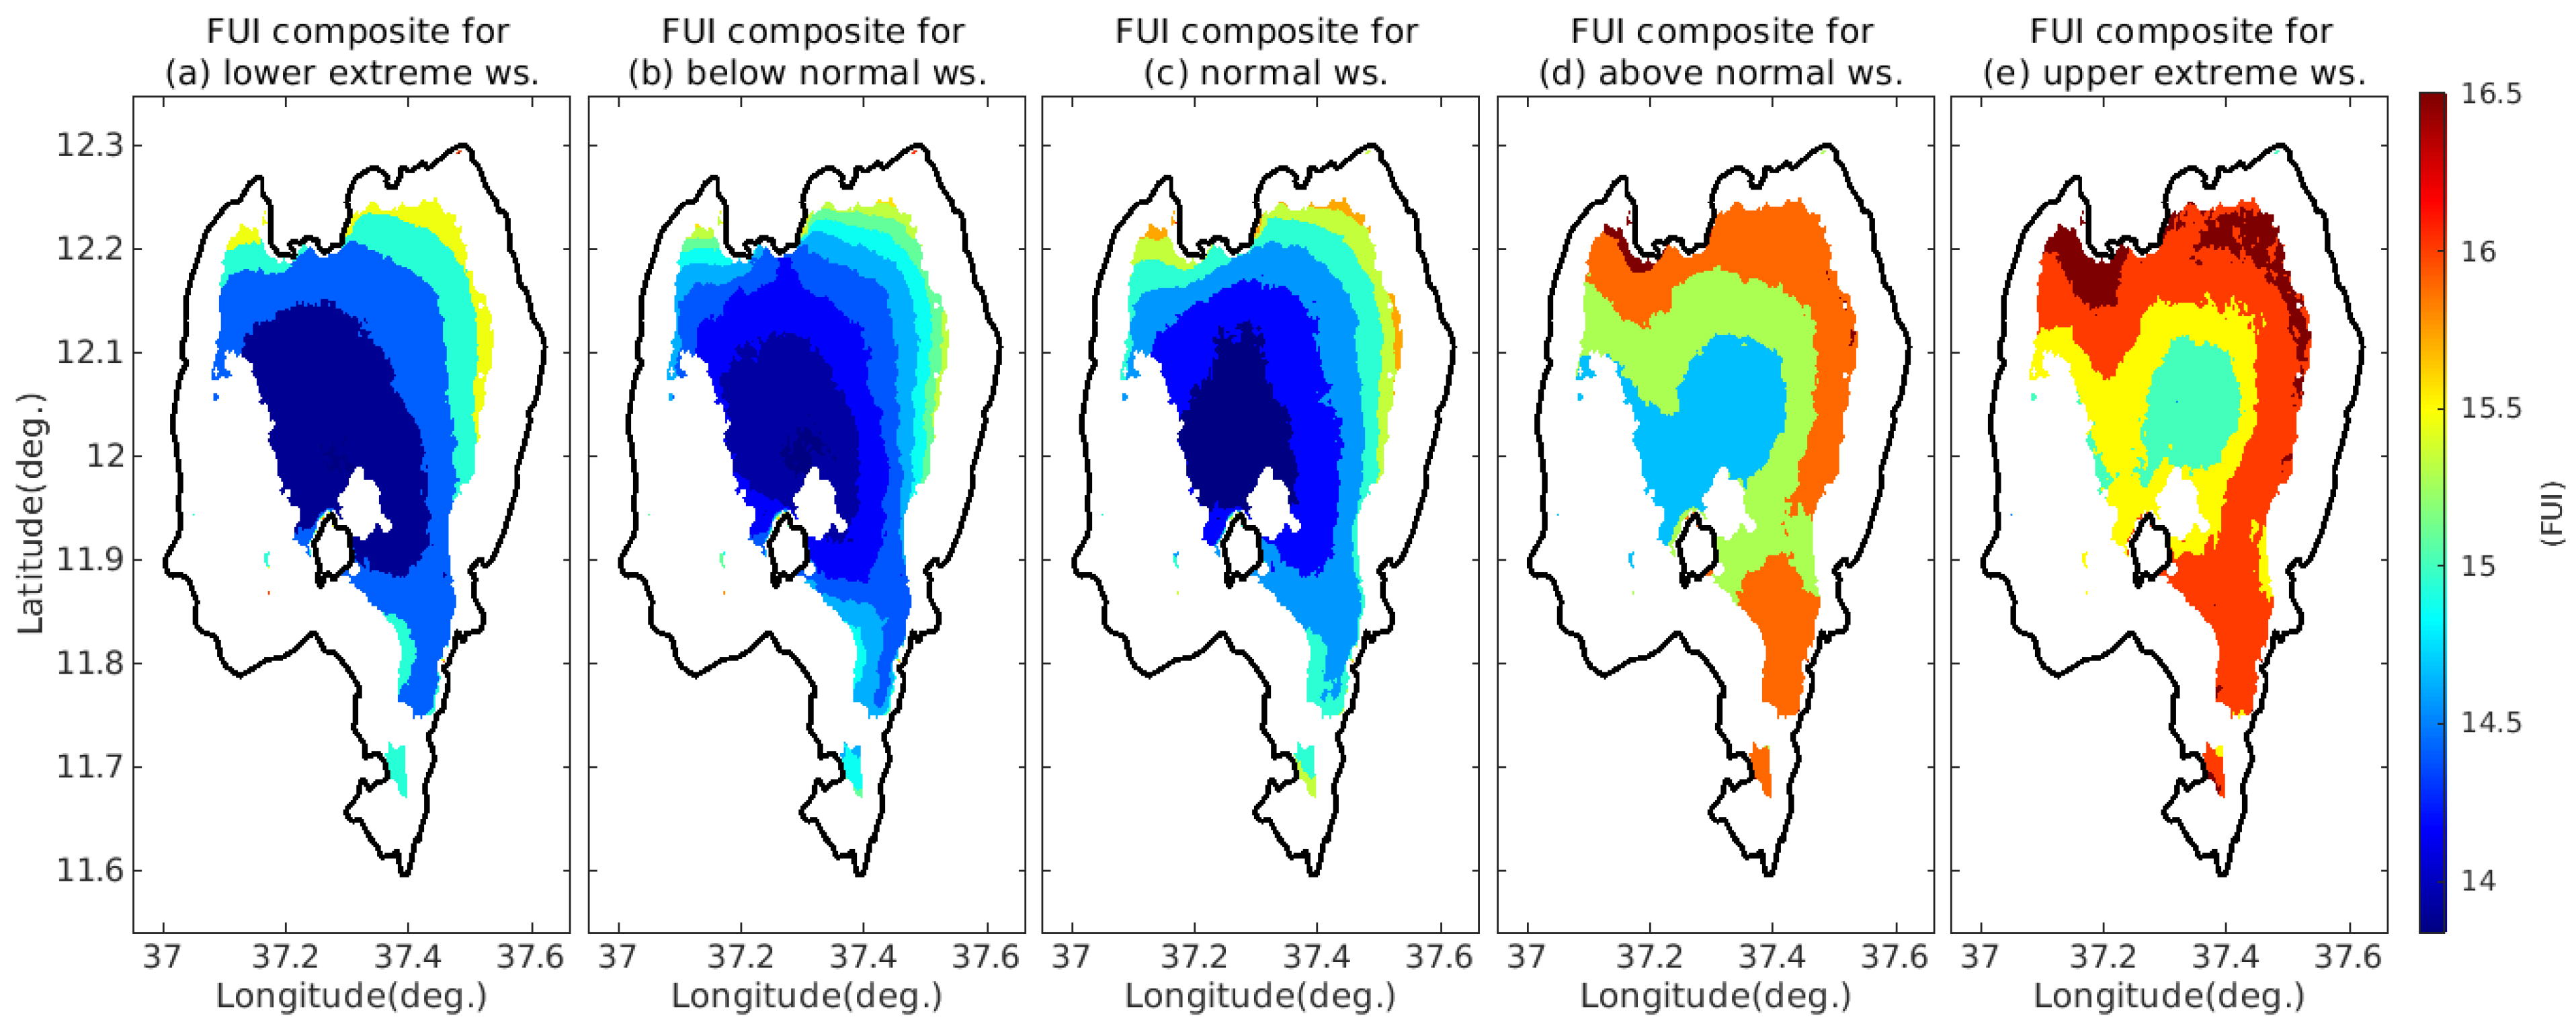
The impacts of wind speed on the pixel level variability of FUI of Lake Tana are also investigated in this study. The FUI composite over the lake shows an increasing trend as one moves from lower extreme to upper extreme wind speed (Figure 11). This implies an increase in wind speed is associated with a decrease in water clarity (i.e., high FUI). Physically, an increasing wind speed enhances the blowing of algae and accelerates the release of nutrients from sediments into inland water bodies. As indicated by recent investigation, maximum wind speed changes the circulation and flow rate of water bodies, maximizing the mixture of pollutants and disturbing the stability of water bodies [107].
In addition, an increasing wind speed changes surface water temperature by mixing the upper and lower layers of the water and speeding up the volatilization and movement of contaminates on the lake. Whenever the air temperature increases, the upper layers of the water bodies become warm and blend with the cold lower layers leading to buoyant bottom water which rises to the surface [108]. According to [93] nutrients in both particulate and dissolved forms are currently the most crucial factors of water body nutrient cycling. Lower trophic states might be the result of lower sediment resuspension events arising from minimum wind speed.

4.3.4. FUI Composites under Different Ranges of NDVI and EVI

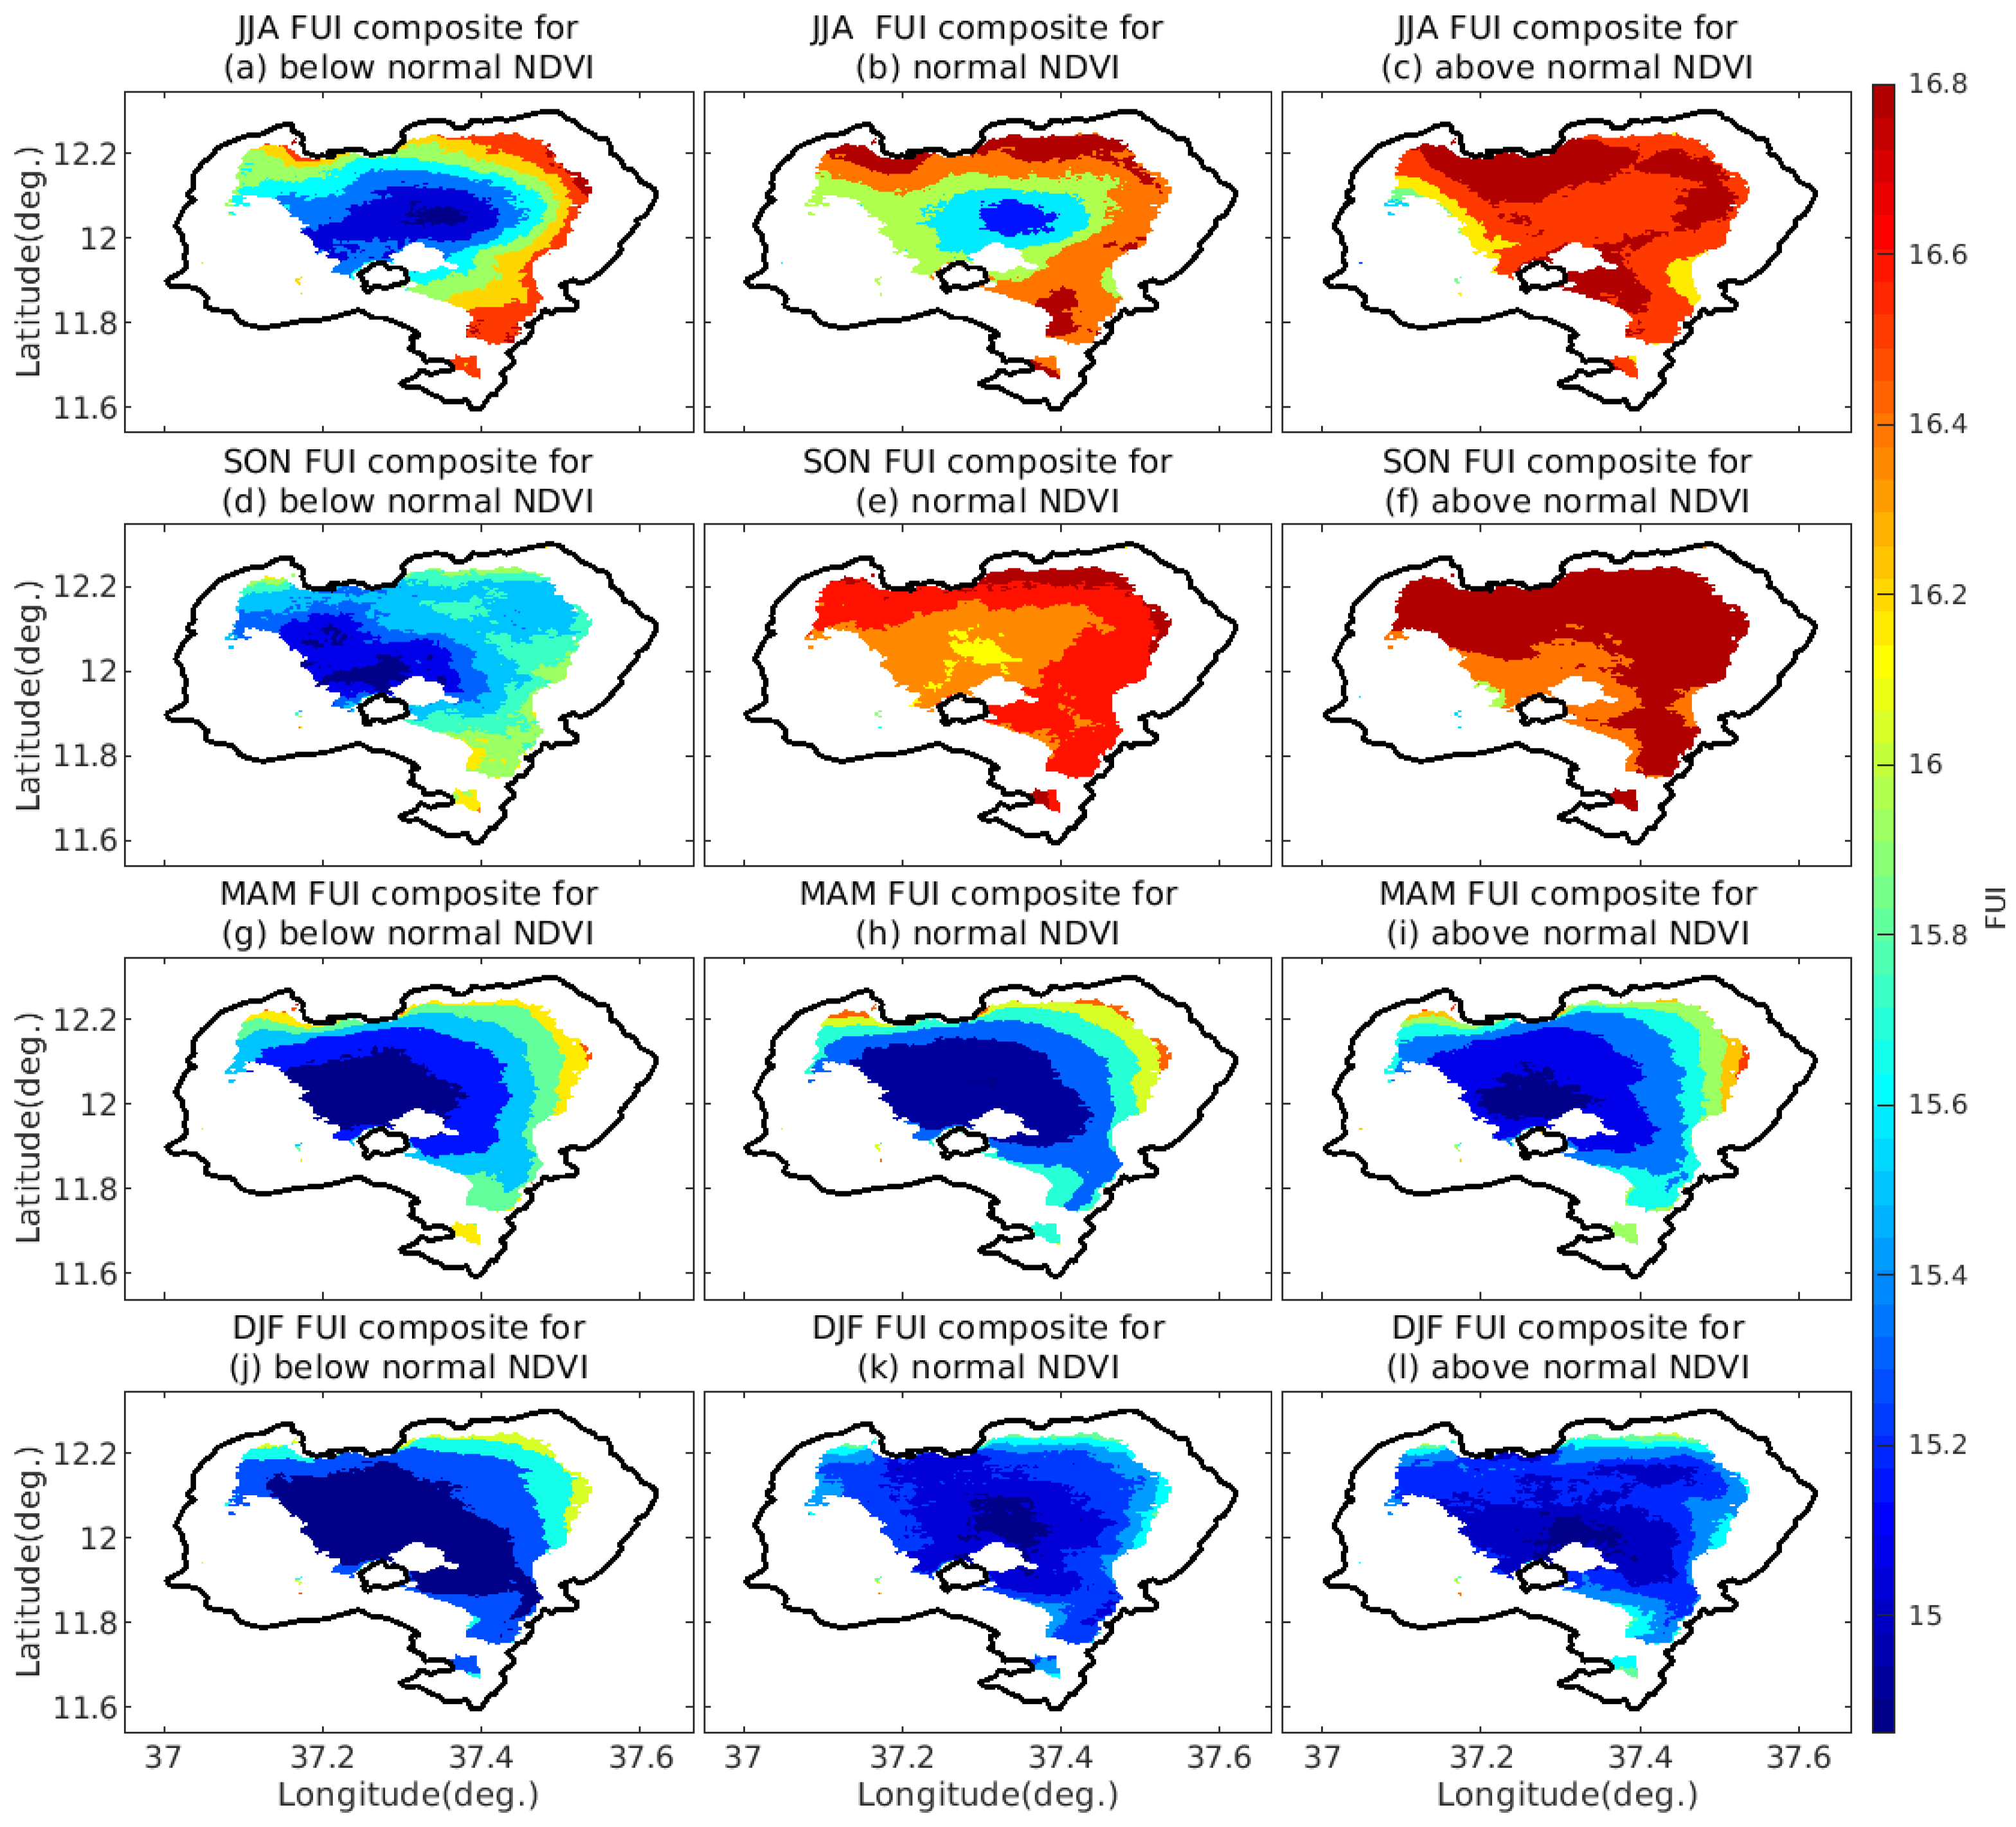
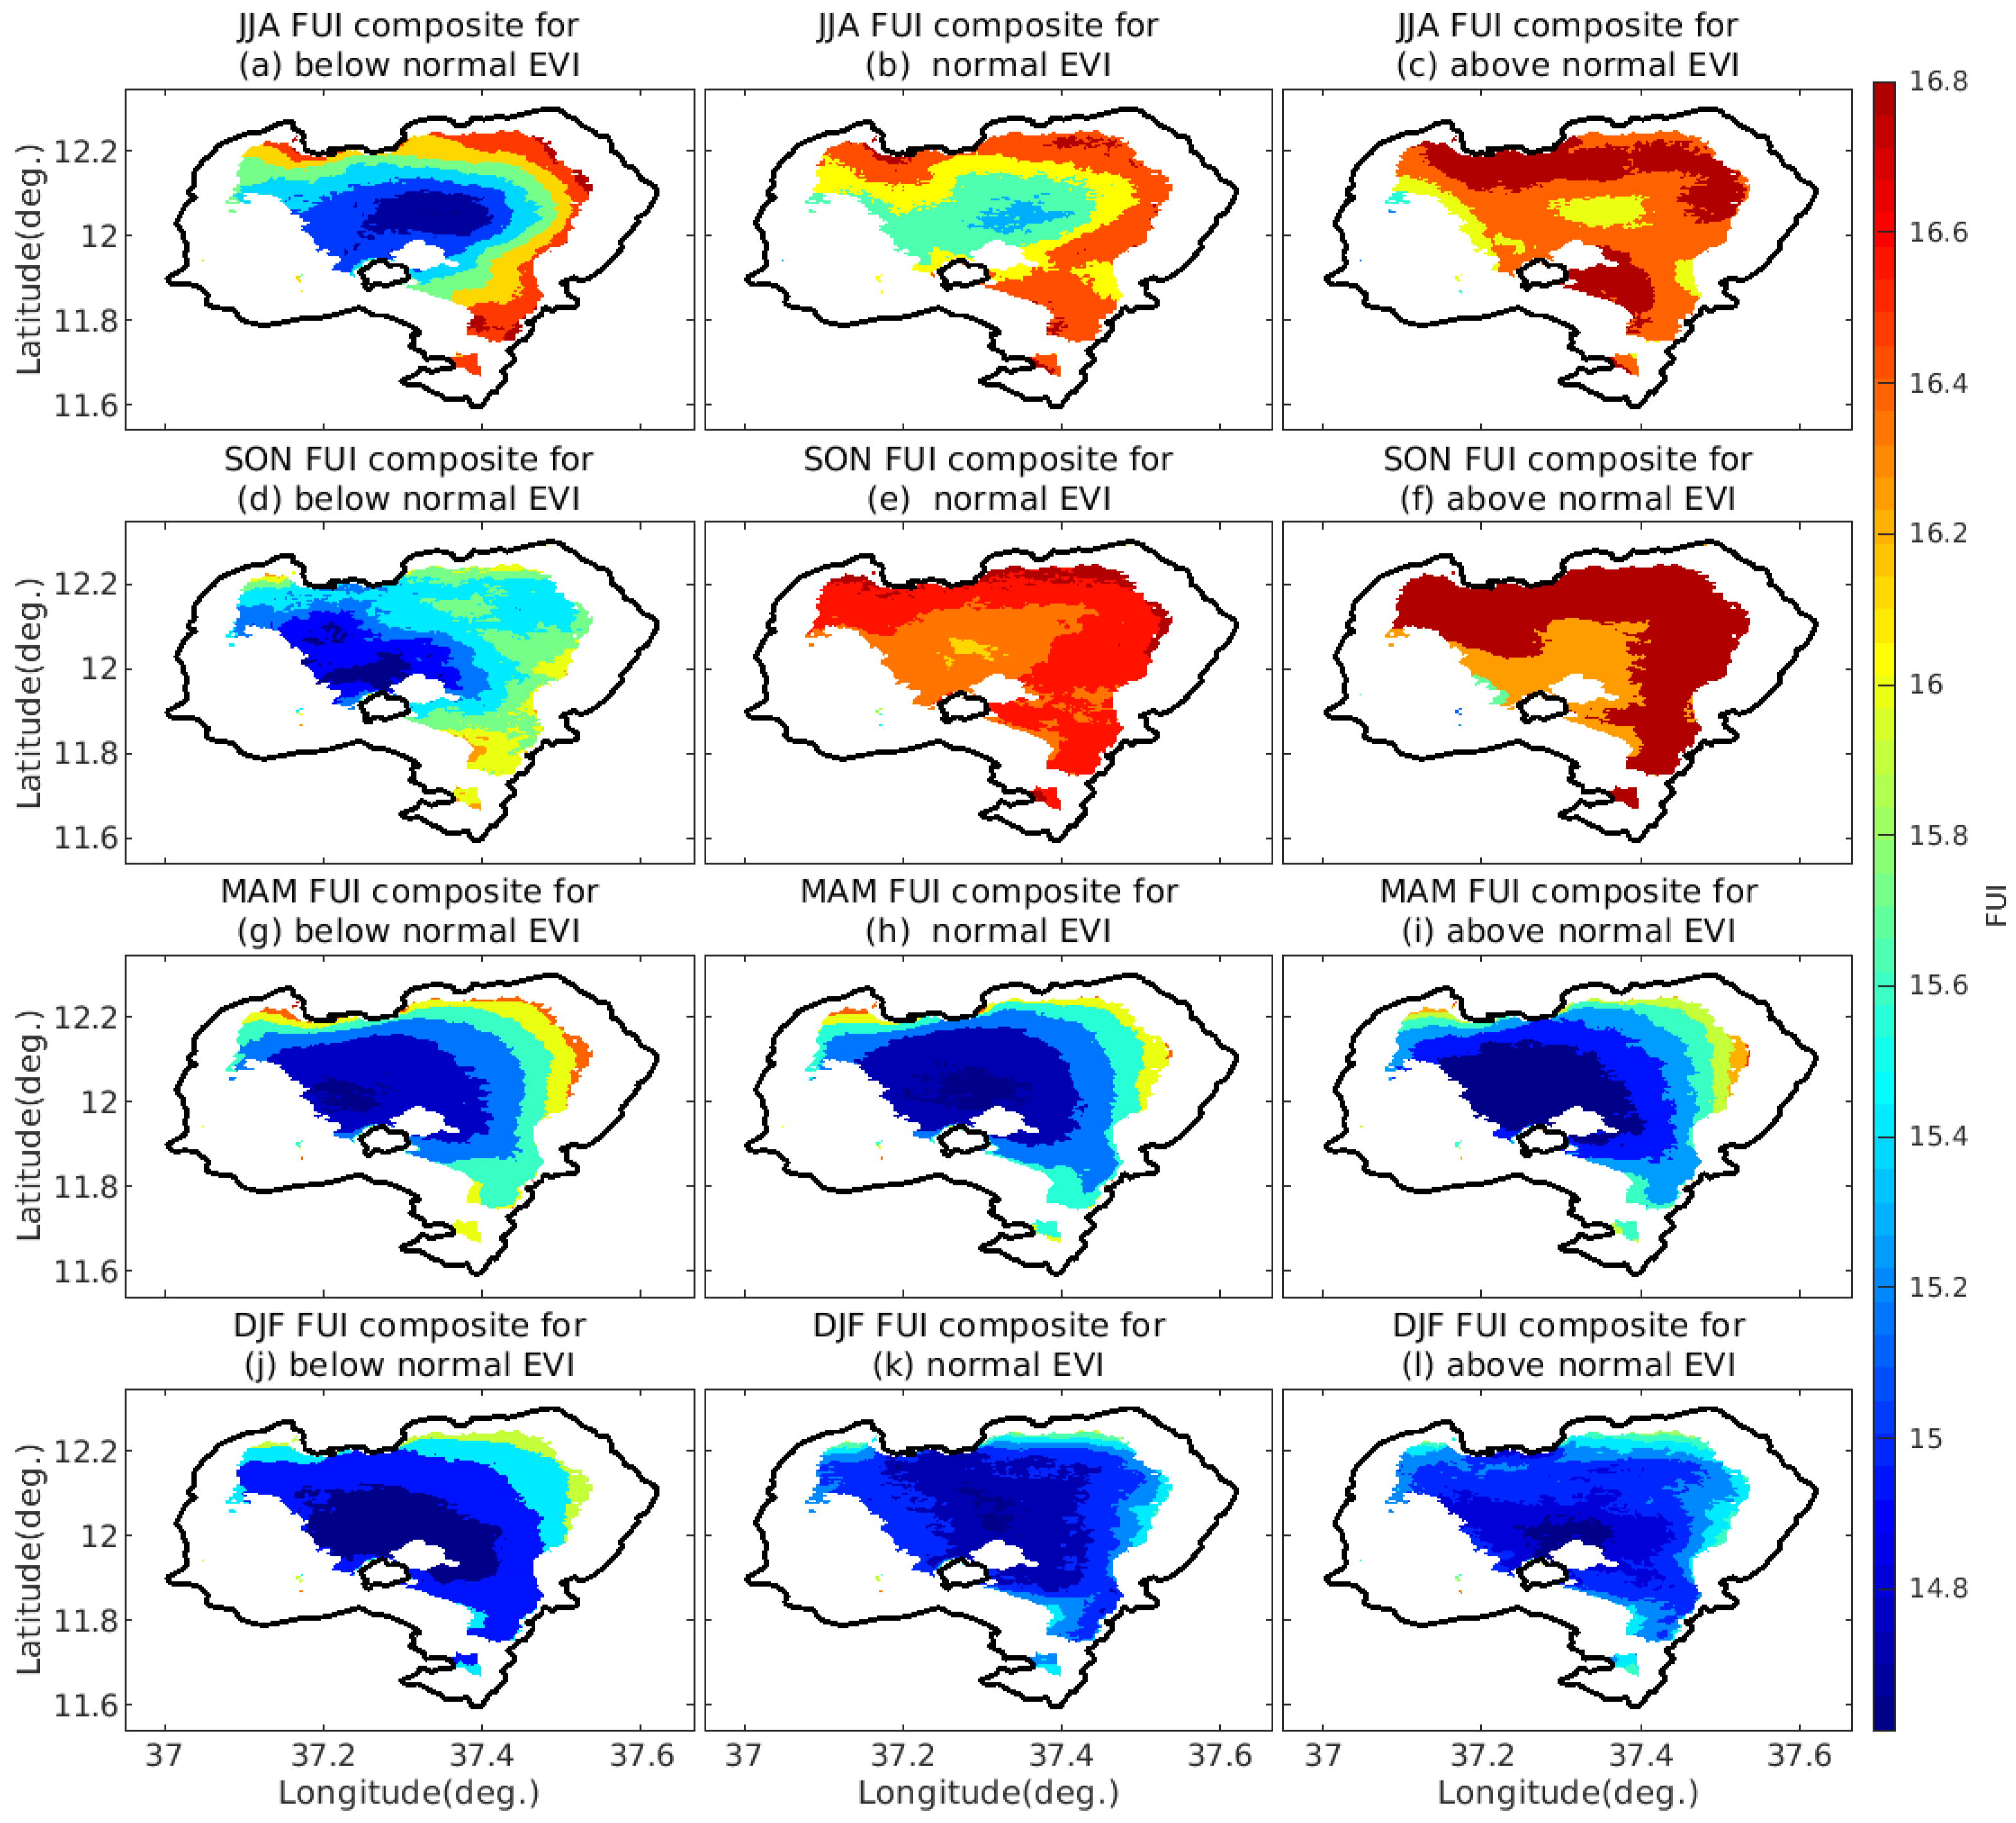
The seasonal FUI composites under different vegetation conditions (below normal, normal, and above normal NDVI and EVI values) during JJA, SON, MAM and DJF are given in (Figure 12 and Figure 13). During the summer season (JJA), the composite map shows FUI increases with increasing NDVI (Figure 12a–c) and EVI (Figure 13a–c) values. This is due to the increment of the load of non-point source(s) (NPS), such as total nitrogen (TN) and total phosphorus (TP) from high vegetation coverage linked to agricultural activities. Figure 12a and Figure 13a show that FUI is low at the center of the lake and it increases outward from the center of the lake during below-normal vegetation conditions (low NDVI and EVI values). This can be explained by the association between low vegetation coverage and the low production of TP and TN by non-point sources. During the period of low vegetation, the supply of nutrients from NPS to the center of the lake will be depleted with distance from NPS. In contrast, during normal and above-normal vegetation conditions, the FUI of the lake increased because of the increasing production of TP and TN from farmlands in the summer season (Figure 12b,c and Figure 13b,c). On the other hand, in the autumn season (SON), the FUI composite shows that the lake was very turbid during all vegetation conditions (low, normal, and above normal NDVI and EVI values) (Figure 12d–f) and (Figure 13d–f). This might indicate that the concentration of TN and TP is highest during autumn on the surface of the lake. This result is in agreement with the studies of [109,110], which have revealed the concentrations of Nitrate nitrogen (NN) and TP in the autumn season were significantly higher than its concentration in summer. In autumn, the vegetation coverage of the study area is usually very high, so the production of TP and TN from farmlands is likely to be very high. In the same way, in the spring season (MAM), the composite analysis shows that FUI is low at the center of the lake and increases outwards to the shorelines of the lake under all three vegetation conditions of EVI (Figure 13g–i). However, during normal NDVI conditions, the composite analysis shows that the FUI composite is higher than FUI composites computed from data taken during periods when NDVI is below lower and above upper terciles of NDVI (Figure 12g–i). Likewise, dry season (DJF) composites show that the FUI increases with an increasing vegetation index (NDVI) (Figure 12j–l). In contrast, the FUI composites show that the quality of water at the center of the lake improved during periods when EVI is either higher or lower than high or low terciles of EVI respectively (Figure 13j,l) whereas the FUI composite shows more turbid lake water during normal vegetation conditions (Figure 13k).
NPS nutrients such as TN and TP are significantly correlated to land cover conditions and are the primary sources of eutrophication of water bodies [111,112,113]. Different studies pointed out that high nutrient load from urban and agricultural areas has perilously reduced the quality of water bodies such as rivers and Lakes [114]. Some studies highlighted the relationship between anthropogenic variables such as agriculture, urbanization, and grazing and the concentration of NPS nutrients such as nitrogen and phosphorus, total suspended sediments (TSS), and dissolved oxygen in a watershed [115,116,117]. Therefore, this study is consistent with most of the literature by revealing the connection between FUI and land surface conditions except in two cases during MAM and DJF where water quality is worse during normal vegetation cover than during both lower and upper terciles of NDVI and EVI respectively.

4.3.5. FUI Composites under Different Classes of Drought Conditions

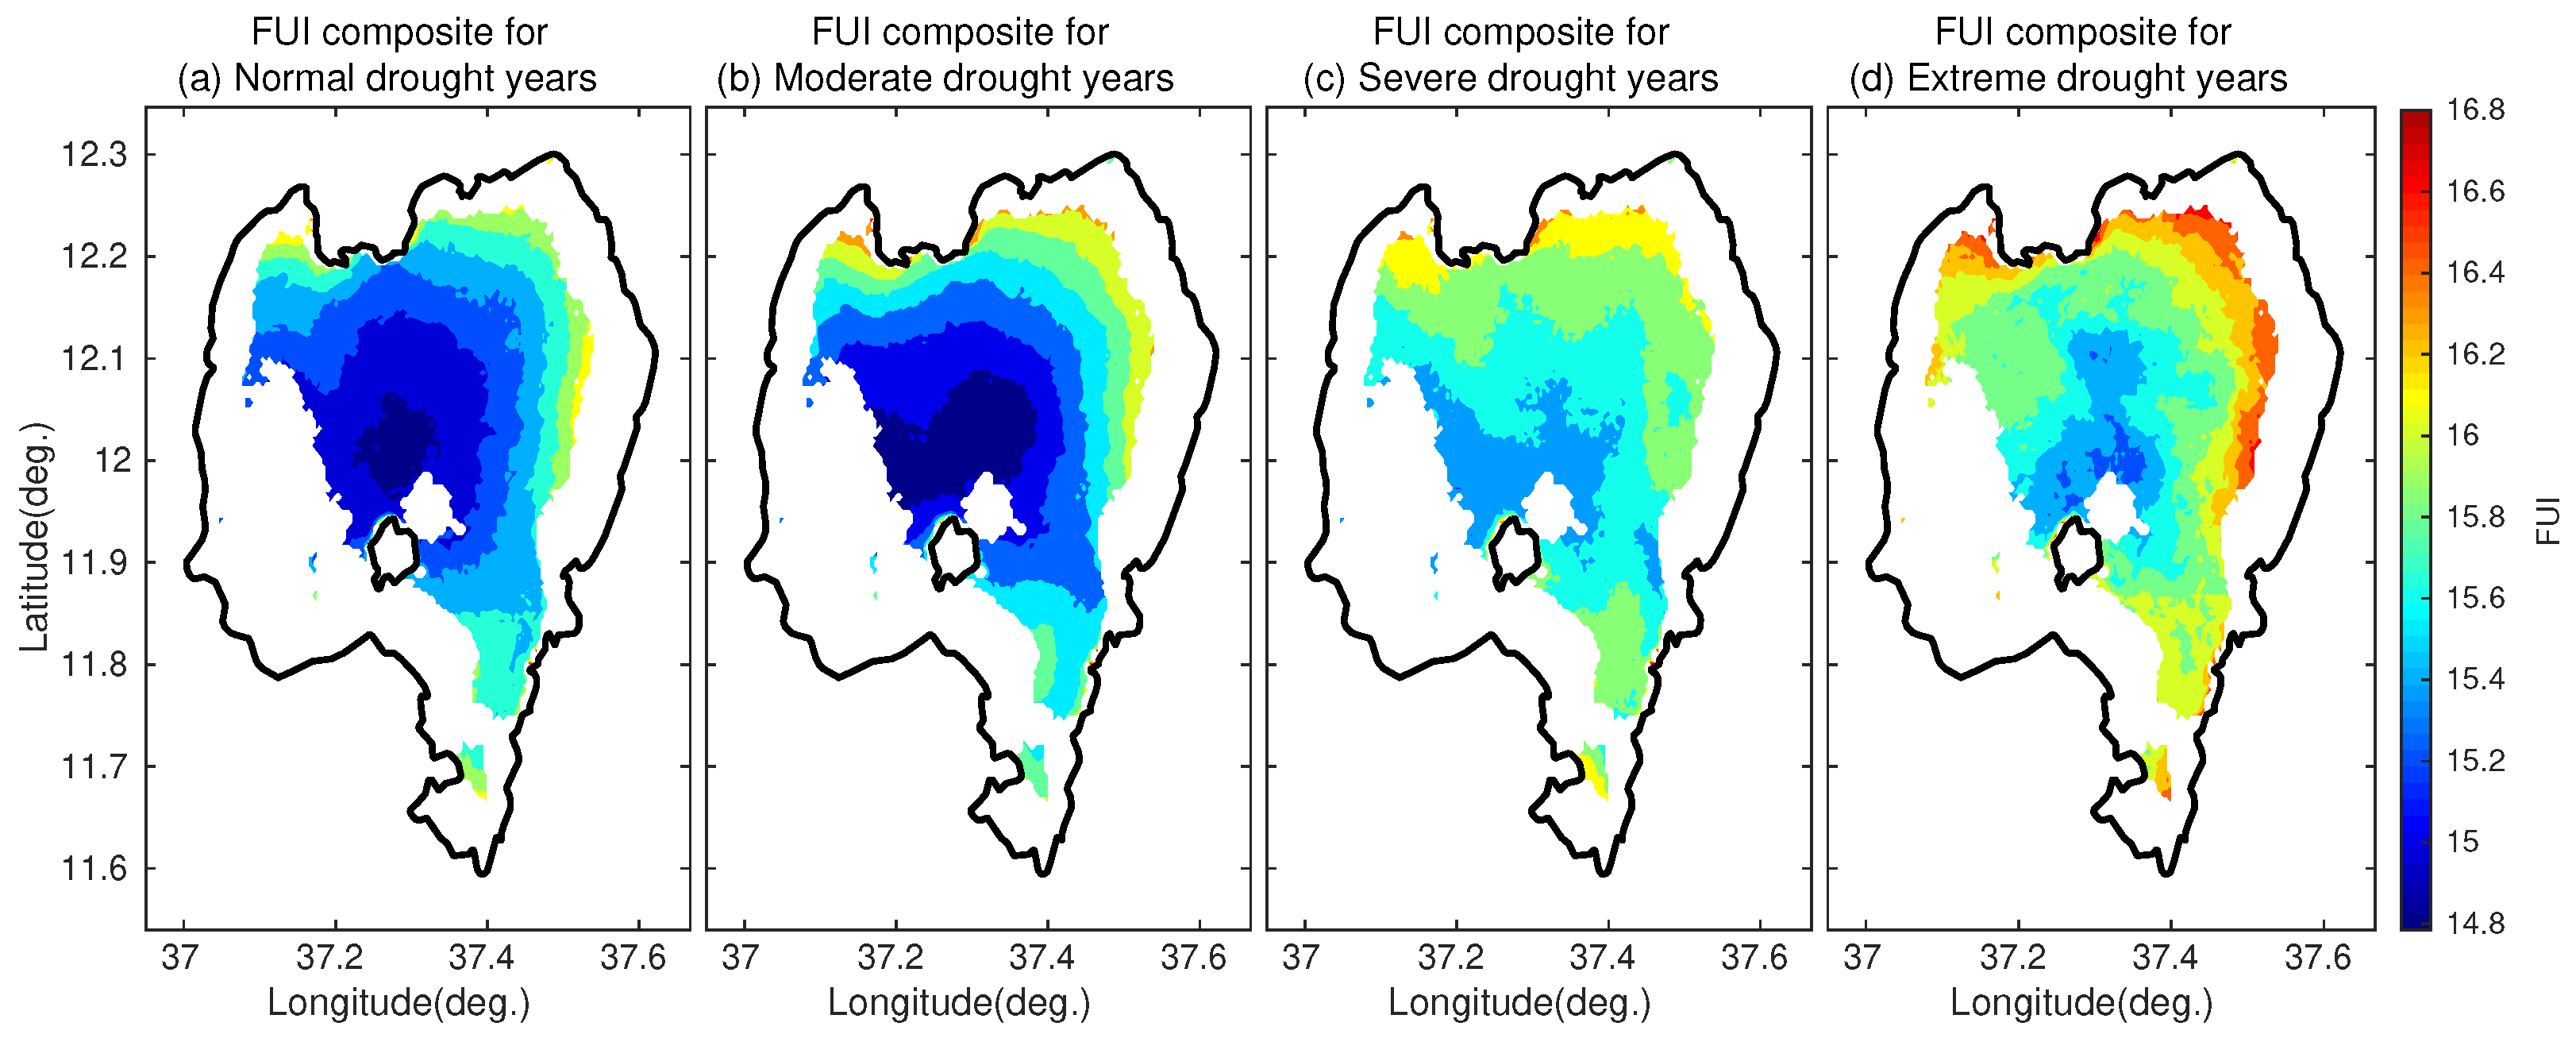
In this section, the effects of hydrological drought on the variability of the FUI of the lake using SPEI at the time scale of twelve months are investigated. The FUI composites during different drought events (normal, moderate drought, severe drought and extreme drought) are presented in (Figure 14a–d). The FUI composites of the lake increased with the increasing severity of drought events. Figure 14 shows the impact of drought at the center of the lake is lower than that of the remaining parts of the lake as noted by increasing FUI in the outward direction. During drought years, low inflow and maximum temperatures maximize the Chl_a concentration and algal bloom on the surface of the lake water. The low flow also increases the concentration of suspended particles and turbidity of the water surface by decreasing the amount of dilation. Furthermore, the salinity of the water body increases due to the increase in surface water evaporation and more saline water inputs from the ground. Because of the contrast between land and water bodies in terms of heat capacity, the shorelines of the lake are warmer than the central part of the lake, creating spatial differences in the enhancement of salinity due to increased evaporation during the drought period. As a result, the water clarity index (i.e., FUI) exhibits the same spatial variability.
Several studies on the impacts of hydrological drought on the quality of inland water bodies support our findings. For example, some of the studies have shown that drought might lead to a significant decline in water quantity and quality [118,119], impact nutrient load distribution [120], aquatic ecosystems [121], and quantity (quality) of irrigation water [122]. Others have shown the effect of drought on the ground and surface water resources such as low inflow and water volume, which lead to poor inland water quality [120,122]. Drought-induced low inflow rate is shown to increase water defeating period and lead to the increment of algal blooms because of maximum nutrient loads (less dilution) [122,123]. Moreover, the dry season water logging cycles are found to influence the water quality by improving organic matter and sediment decomposition and flushing them into the receiving inland water bodies [118,119]. The maximum temperature at the time of extreme drought influences the reaction and respiration rates in water bodies [122].

5. Conclusions

FUI is an attainable method for evaluating the quality of inland water bodies in large regions for a long time period. This study uses MODIS-based FUI to understand the spatiotemporal trophic state assessment of the Lake Tana water quality and discover the role and mechanisms by which hydrometeorological variables and land-use–land-cover change indicators affect the spatiotemporal variability of FUI. In this effort, we have employed MODIS-based FUI, Diversity-II datasets as well as reanalysis, and satellite observations to conduct a series of analyses and gain new insights on the skill of FUI in capturing retrieved water quality from MERIS over Lake Tana and dynamics of water clarity as a function of the driving variables. Lake Tana is in a eutrophic state during the study period from 2000–2021 and its trophic state inferred from FUI is in agreement with the MERIS-derived trophic state of the lake. The FUI of the lake is negatively correlated with CDOM in some parts of the lake, TSM, and MPHchl-a at the northeast and northwest part of the lake. Significant positive correlations with Trophic state index (TSI), Turbidity, and FUBchl-a are obtained over most parts of the lake. The impacts of hydrometeorological parameters and land-use–land-cover conditions on the variability of FUI were investigated using a composite analysis. Composites of FUI computed from periods with above normal and upper percentiles of lake bottom layer temperature, precipitation, surface runoff, wind speed, and SPEI are within the upper end of FUI distribution implying enhancement of FUI with an increase in these variables. In contrast, the composites of FUI determined during below normal and lower percentiles of lake skin temperature and evaporation are within the upper range of FUI revealing an inverse association between FUI and the two hydrometeorological variables. In other words, the response of FUI to the two extreme ends of the hydro-meteorological variables reveals that extremely high lake bottom layer temperature, wind speed, precipitation, surface runoff and extreme drought lead to the poor water quality of the lake while below normal and extremely low lake skin temperature and evaporation lead to similar poor quality lake water. Seasonally, the FUI composites of the lake were influenced by NDVI and EVI conditions. For example, during the autumn season (SON) the FUI composites are high for all vegetation conditions (low, normal and above normal NDVI and EVI conditions) whereas during the summer season (JJA) the composites show an increasing trend with an increase in NDVI and EVI values. The analysis of the satellite observations of FUI and hydrometeorological as well as LULC indicators yield results that are consistent with processes occurring under different ranges of these environmental drivers. Future work should explore the potential of using the physical drivers as predictors of the water clarity index within regression or machine learning models since the qualitatively established strong associations between FUI and the variables from the composite analysis have physical bases and indicate the potential predictability of water quality parameters.

Author Contributions

Conceptualization, N.T.A. and G.M.T.; methodology, N.T.A. and G.M.T.; software, N.T.A. and G.M.T.; validation, N.T.A., G.M.T. and B.K.A.; formal analysis, N.T.A. and G.M.T.; investigation, N.T.A., G.M.T. and B.K.A.; resources, N.T.A., G.M.T. and B.K.A.; visualization, N.T.A., G.M.T. and B.K.A.; supervision, G.M.T. and B.K.A.; funding acquisition, N.T.A. and G.M.T. All authors have read and agreed to the published version of the manuscript.

Funding

This research has been supported by the grant of Pan African Planetary and Space Science Network (PAPSSN). PAPSSN is founded by the Intra-Africa Academic Mobility Scheme of the European Union under grant agreement no. 624224; and O.R. Tambo Africa Research Chairs Initiative, supported by the Botswana International University of Science and Technology, the Ministry of Tertiary Education, Science and Technology, the National Research Foundation of South Africa (NRF); the Department of Science and Innovation of South Africa (DSI); the International Development Research Centre of Canada (IDRC); and the Oliver & Adelaide Tambo Foundation (OATF).

Institutional Review Board Statement

Not Applicable.

Informed Consent Statement

Not Applicable.

Data Availability Statement

Not Applicable.

Acknowledgments

The first author received funding from the PanAfrican Planetary and Space Science Network (PAPSSN). PAPSSN is founded by the Intra-Africa Academic Mobility Scheme of the European Union under grant agreement no. 624224. The second and third authors acknowledge that this work was carried out with the aid of a grant from the O.R. Tambo Africa Research Chairs Initiative, supported by the Botswana International University of Science and Technology, the Ministry of Tertiary Education, Science and Technology, the National Research Foundation of South Africa (NRF); the Department of Science and Innovation of South Africa (DSI); the International Development Research Centre of Canada (IDRC); and the Oliver & Adelaide Tambo Foundation (OATF).

Conflicts of Interest

The authors declare no conflict of interest.

Abbreviations

The following abbreviations are used in this manuscript:
BUSTproportion of errors
Chl _ a chlorophyll a
CDOMcolored dissolved organic matter
C 3 SCopernicus Climate Change Service
CRUClimatic Research Unit
C.I.ECommission on Illumination
CSIcritical success index
CMcategorical miss
CAcomposite analysis
DJFDecember, January, February
DOdissolved oxygen
ESAEuropean Space Agency
ECMWFEuropean Center for Medium-Range Weather Forecasts
EVIenhanced vegetation index
FUIForel–Ule index
FBIFrequency bias index
FUMEForel–Ule MERIS
FUBFree University of Berlin
FARfalse alarm ratio
JJAJune, July, August
LULCland-use–land-cover
MERISmedium resolution imaging spectrometer
MODISmoderate resolution imaging spectroradiometer
MSSmulti-spectral scanner
MAMMarch, April, May,
NDVInormalized difference vegetation index
NASANational Aeronautics and Space Administration
NCEPNational Centers for Environmental Prediction
NCARNational Center for Atmospheric Research
NPSnon-point source
OACoptically active component
OECDOrganization for Economic Cooperation and Development
PODprobability of detection
PCpercent correct
R r s remote-sensing reflectance
RGBred, green, blue
RELreliability
SDDSecchi disk depth
SPEIstandardized precipitation evapotranspiration index
SONSeptember, October, November
TSItrophic state index
TPtotal phosphorus
TNtotal nitrogen
TSMtotal suspended matter

References

  1. Kondratyev, K.Y.; Pozdnyakov, D.; Pettersson, L. Water quality remote sensing in the visible spectrum. Int. J. Remote Sens. 1998, 19, 957–979. [Google Scholar] [CrossRef]
  2. Zhao, Y.; Wang, S.; Zhang, F.; Shen, Q.; Li, J.; Yang, F. Remote Sensing-Based Analysis of Spatial and Temporal Water Colour Variations in Baiyangdian Lake after the Establishment of the Xiong’an New Area. Remote Sens. 2021, 13, 1729. [Google Scholar] [CrossRef]
  3. Gallie, E.A.; Murtha, P. A modification of chromaticity analysis to separate the effects of water quality variables. Remote Sens. Environ. 1993, 44, 47–65. [Google Scholar] [CrossRef]
  4. Sathyendranath, S. Remote Sensing of Ocean Colour in Coastal, and other Optically-Complex, Waters; International Ocean Colour Coordinating Group: Dartmouth, NS, Canada, 2000. [Google Scholar] [CrossRef]
  5. Pan, D.; Ma, R. Several key problems of lake water quality remote sensing. J. Lake Sci. 2008, 20, 139–144. [Google Scholar] [CrossRef] [Green Version]
  6. Prieur, L.; Sathyendranath, S. An optical classification of coastal and oceanic waters based on the specific spectral absorption curves of phytoplankton pigments, dissolved organic matter, and other particulate materials 1. Limnol. Oceanogr. 1981, 26, 671–689. [Google Scholar] [CrossRef]
  7. Lesht, B.M.; Barbiero, R.P.; Warren, G.J. Satellite ocean color algorithms: A review of applications to the Great Lakes. J. Great Lakes Res. 2012, 38, 49–60. [Google Scholar] [CrossRef]
  8. Yang, W.; Matsushita, B.; Chen, J.; Fukushima, T. Estimating constituent concentrations in case II waters from MERIS satellite data by semi-analytical model optimizing and look-up tables. Remote Sens. Environ. 2011, 115, 1247–1259. [Google Scholar] [CrossRef] [Green Version]
  9. Ma, R.; Pan, D.; Duan, H.; Song, Q. Absorption and scattering properties of water body in Taihu Lake, China: Backscattering. Int. J. Remote Sens. 2009, 30, 2321–2335. [Google Scholar] [CrossRef]
  10. Wang, S.; Li, J.; Shen, Q.; Zhang, B.; Zhang, F.; Lu, Z. MODIS-based radiometric color extraction and classification of inland water with the Forel–Ule scale: A case study of Lake Taihu. IEEE J. Sel. Top. Appl. Earth Obs. Remote Sens. 2014, 8, 907–918. [Google Scholar] [CrossRef]
  11. Chen, J.; Quan, W.; Zhang, M.; Cui, T. A simple atmospheric correction algorithm for MODIS in shallow turbid waters: A case study in Taihu Lake. IEEE J. Sel. Top. Appl. Earth Obs. Remote Sens. 2012, 6, 1825–1833. [Google Scholar] [CrossRef]
  12. Wang, M.; Shi, W. The NIR-SWIR combined atmospheric correction approach for MODIS ocean color data processing. Opt. Express 2007, 15, 15722–15733. [Google Scholar] [CrossRef] [PubMed] [Green Version]
  13. Barysheva, L. On the issue of intercorrespondence of color scales used in limnology. Remote Monit. Large Lakes 1987, 60–65. [Google Scholar]
  14. Bukata, R.P.; Jerome, J.H.; Kondratyev, K.Y.; Pozdnyakov, D.V.; Kotykhov, A.A. Modelling the radiometric color of inland waters: Implications to a) remote sensing and b) limnological color scales. J. Great Lakes Res. 1997, 23, 254–269. [Google Scholar] [CrossRef]
  15. Morel, A.; Prieur, L. Analysis of variations in ocean color 1. Limnol. Oceanogr. 1977, 22, 709–722. [Google Scholar] [CrossRef]
  16. Smith, R.C.; Baker, K.S. Optical properties of the clearest natural waters (200–800 nm). Appl. Opt. 1981, 20, 177–184. [Google Scholar] [CrossRef]
  17. Wang, S.; Li, J.; Zhang, B.; Spyrakos, E.; Tyler, A.N.; Shen, Q.; Zhang, F.; Kuster, T.; Lehmann, M.K.; Wu, Y.; et al. Trophic state assessment of global inland waters using a MODIS-derived Forel–Ule index. Remote Sens. Environ. 2018, 217, 444–460. [Google Scholar] [CrossRef] [Green Version]
  18. Wernand, M.; Hommersom, A.; van der Woerd, H.J. MERIS-based ocean colour classification with the discrete Forel–Ule scale. Ocean Sci. 2013, 9, 477–487. [Google Scholar] [CrossRef] [Green Version]
  19. Woerd, H.J.; Wernand, M.R. True colour classification of natural waters with medium-spectral resolution satellites: SeaWiFS, MODIS, MERIS and OLCI. Sensors 2015, 15, 25663–25680. [Google Scholar] [CrossRef] [Green Version]
  20. Van der Woerd, H.J.; Wernand, M.R. Hue-angle product for low to medium spatial resolution optical satellite sensors. Remote Sens. 2018, 10, 180. [Google Scholar] [CrossRef] [Green Version]
  21. Alföldi, T.; Munday, J., Jr. Water quality analysis by digital chromaticity mapping of Landsat data. Can. J. Remote Sens. 1978, 4, 108–126. [Google Scholar] [CrossRef]
  22. Jerome, J.H. Colours of natural waters: 1. Factors controlling the dominant wavelength. Northwest Sci. 1994, 68, 43–52. [Google Scholar]
  23. Wernand, M.R. Poseidon’s Paintbox: Historical Archives of Ocean Colour in Global-Change Perspective. Ph.D. Thesis, University Utrecht, Utrecht, The Netherlands, 2011. [Google Scholar]
  24. Wang, S.; Li, J.; Zhang, W.; Cao, C.; Zhang, F.; Shen, Q.; Zhang, X.; Zhang, B. A dataset of remote-sensed Forel–Ule Index for global inland waters during 2000–2018. Sci. Data 2021, 8, 1–10. [Google Scholar] [CrossRef] [PubMed]
  25. Valjarević, A.; Popovici, C.; Djekić, T.; Morar, C.; Filipović, D.; Lukić, T. Long-term monitoring of high optical imagery of the stratospheric clouds and their properties new approaches and conclusions. Egypt. J. Remote Sens. Space Sci. 2022, 25, 1037–1043. [Google Scholar] [CrossRef]
  26. Carroll, M.L.; DiMiceli, C.M.; Townshend, J.; Sohlberg, R.A.; Elders, A.; Devadiga, S.; Sayer, A.M.; Levy, R. Development of an operational land water mask for MODIS Collection 6, and influence on downstream data products. Int. J. Digit. Earth 2017, 10, 207–218. [Google Scholar] [CrossRef]
  27. Gezie, A.; Assefa, W.W.; Getnet, B.; Anteneh, W.; Dejen, E.; Mereta, S.T. Potential impacts of water hyacinth invasion and management on water quality and human health in Lake Tana watershed, Northwest Ethiopia. Biol. Invas. 2018, 20, 2517–2534. [Google Scholar] [CrossRef]
  28. Dersseh, M.G.; Kibret, A.A.; Tilahun, S.A.; Worqlul, A.W.; Moges, M.A.; Dagnew, D.C.; Abebe, W.B.; Melesse, A.M. Potential of water hyacinth infestation on Lake Tana, Ethiopia: A prediction using a GIS-based multi-criteria technique. Water 2019, 11, 1921. [Google Scholar] [CrossRef] [Green Version]
  29. Dersseh, M.G.; Melesse, A.M.; Tilahun, S.A.; Abate, M.; Dagnew, D.C. Water hyacinth: Review of its impacts on hydrology and ecosystem services—Lessons for management of Lake Tana. Extrem. Hydrol. Clim. Var. 2019, 237–251. [Google Scholar] [CrossRef]
  30. Enyew, B.G.; Assefa, W.W.; Gezie, A. Socioeconomic effects of water hyacinth (Echhornia Crassipes) in Lake Tana, North Western Ethiopia. PLoS ONE 2020, 15, e0237668. [Google Scholar] [CrossRef]
  31. Worqlul, A.W.; Ayana, E.K.; Dile, Y.T.; Moges, M.A.; Dersseh, M.G.; Tegegne, G.; Kibret, S. Spatiotemporal dynamics and environmental controlling factors of the Lake Tana water hyacinth in Ethiopia. Remote Sens. 2020, 12, 2706. [Google Scholar] [CrossRef]
  32. Goshu, G.; Koelmans, A.A. and de Klein, J.J.M. Water Quality of Lake Tana Basin, Upper Blue Nile, Ethiopia. A Review of Available Data. In Social and Ecological System Dynamics: Characteristics, Trends, and Integration in the Lake Tana Basin, Ethiopia; Stave, K., Goshu, G., Aynalem, S., Eds.; Springer: Berlin, Germany, 2017; pp. 127–141. [Google Scholar]
  33. Kassa, Y.; Mengistu, S.; Wondie, A.; Tibebe, D. Distribution of macrophytes in relation to physico-chemical characters in the south western littoral zone of Lake Tana, Ethiopia. Aquat. Bot. 2021, 170, 103351. [Google Scholar] [CrossRef]
  34. Ayele, H.S.; Atlabachew, M. Review of characterization, factors, impacts, and solutions of Lake eutrophication: Lesson for Lake Tana, Ethiopia. Environ. Sci. Pollut. Res. 2021, 28, 14233–14252. [Google Scholar] [CrossRef] [PubMed]
  35. Eshete, G.D.; Asitatikie, A.N.; Almnewu, H.N.; Belew, A.Z. Analysis of the spatial and temporal variability of direct rainfall in Lake Tana, Ethiopia. Appl. Water Sci. 2022, 12. [Google Scholar] [CrossRef]
  36. Dersseh, M.G.; Steenhuis, T.S.; Kibret, A.A.; Eneyew, B.M.; Kebedew, M.G.; Zimale, F.A.; Worqlul, A.W.; Moges, M.A.; Abebe, W.B.; Mhiret, D.A.; et al. Water Quality Characteristics of a Water Hyacinth Infested Tropical Highland Lake: Lake Tana, Ethiopia. Front. Water 2022, 4, 774710. [Google Scholar] [CrossRef]
  37. Mucheye, T.; Haro, S.; Papaspyrou, S.; Caballero, I. Water Quality and Water Hyacinth Monitoring with the Sentinel-2A/B Satellites in Lake Tana (Ethiopia). Remote Sens. 2022, 14, 4921. [Google Scholar] [CrossRef]
  38. Kebedew, M.G.; Kibret, A.A.; Tilahun, S.A.; Belete, M.A.; Zimale, F.A.; Steenhuis, T.S. The Relationship of Lake Morphometry and Phosphorus Dynamics of a Tropical Highland Lake: Lake Tana, Ethiopia. Water 2020, 12, 2243. [Google Scholar] [CrossRef]
  39. Kebedew, M.G.; Tilahun, S.A.; Zimale, F.A.; Steenhuis, T.S. Bottom Sediment Characteristics of a Tropical Lake: Lake Tana, Ethiopia. Hydrology 2020, 7, 18. [Google Scholar] [CrossRef] [Green Version]
  40. Vijverberg, J.; Sibbing, F.A.; Dejen, E. Lake Tana: Source of the blue nile. In The Nile; Springer: Berlin, Germany, 2009; pp. 163–192. [Google Scholar] [CrossRef]
  41. Mesfin, W.M. An Introductory Geography of Ethiopia; Berhanena Selam HSI Printing Press: Addis Ababa, Ethiopia, 1972. [Google Scholar]
  42. Kebede, S.; Travi, Y.; Alemayehu, T.; Marc, V. Impact of rainfall variation and water resources development on Lake Tana level and its blue Nile flow. J. Hydrol. 2006, 316, 233–247. [Google Scholar] [CrossRef]
  43. Minale, A.S. Water level fluctuations of Lake Tana and its implication on local communities livelihood, northwestern Ethiopia. Int. J. River Basin Manag. 2020, 18, 503–510. [Google Scholar] [CrossRef]
  44. Arsiso, B.K.; Tsidu, G.M. Impacts of land-use–land-cover change on land surface temperature over Lake Tana basin.
  45. Bires, Z.; Raj, S. Determinants of environmental conservation in Lake Tana Biosphere Reserve, Ethiopia. Heliyon 2019, 5, e01997. [Google Scholar] [CrossRef] [Green Version]
  46. Wondie, A.; Mengistou, S. Seasonal variability of secondary production of cladocerans and rotifers, and their trophic role in Lake Tana, Ethiopia, a large, turbid, tropical highland lake. Afr. J. Aquat. Sci. 2014, 39, 403–416. [Google Scholar] [CrossRef]
  47. Minale, A.S. Retrospective analysis of land cover and use dynamics in Gilgel Abbay Watershed by using GIS and remote sensing techniques, Northwestern Ethiopia. Int. J. Geosci. 2013, 4, 1003–1008. [Google Scholar] [CrossRef] [Green Version]
  48. Minale, A.S.; Rao, K.K. Hydrological dynamics and human impact on ecosystems of Lake Tana, northwestern Ethiopia. Ethiop. J. Environ. Stud. Manag. 2011, 4, 1. [Google Scholar] [CrossRef] [Green Version]
  49. Vermote, E.; Vermeulen, A. Atmospheric correction algorithm: Spectral reflectances (MOD09). ATBD Version 1999, 4, 1–107. [Google Scholar]
  50. Hou, X.; Feng, L.; Duan, H.; Chen, X.; Sun, D.; Shi, K. Fifteen-year monitoring of the turbidity dynamics in large lakes and reservoirs in the middle and lower basin of the Yangtze River, China. Remote Sens. Environ. 2017, 190, 107–121. [Google Scholar] [CrossRef]
  51. Klein, I.; Gessner, U.; Dietz, A.J.; Kuenzer, C. Global WaterPack–A 250 m resolution dataset revealing the daily dynamics of global inland water bodies. Remote Sens. Environ. 2017, 198, 345–362. [Google Scholar] [CrossRef]
  52. Li, J.; Wang, S.; Wu, Y.; Zhang, B.; Chen, X.; Zhang, F.; Shen, Q.; Peng, D.; Tian, L. MODIS observations of water color of the largest 10 lakes in China between 2000 and 2012. Int. J. Digit. Earth 2016, 9, 788–805. [Google Scholar] [CrossRef]
  53. Wu, G.; Cui, L.; He, J.; Duan, H.; Fei, T.; Liu, Y. Comparison of MODIS-based models for retrieving suspended particulate matter concentrations in Poyang Lake, China. Int. J. Appl. Earth Obs. Geoinf. 2013, 24, 63–72. [Google Scholar] [CrossRef]
  54. Odermatt, D.; Danne, O.; Philipson, P.; Brockmann, C. Diversity II water quality parameters from ENVISAT (2002–2012): A new global information source for lakes. Earth Syst. Sci. Data 2018, 10, 1527–1549. [Google Scholar] [CrossRef] [Green Version]
  55. Carlson, R.E. A trophic state index for lakes 1. Limnol. Oceanogr. 1977, 22, 361–369. [Google Scholar] [CrossRef] [Green Version]
  56. Jia, T.; Zhang, Y.; Dong, R. A Universal Fuzzy Logic Optical Water Type Scheme for the Global Oceans. Remote Sens. 2021, 13, 4018. [Google Scholar] [CrossRef]
  57. Mu noz-Sabater, J.; Dutra, E.; Agustí-Panareda, A.; Albergel, C.; Arduini, G.; Balsamo, G.; Boussetta, S.; Choulga, M.; Harrigan, S.; Hersbach, H.; et al. ERA5-Land: A state-of-the-art global reanalysis dataset for land applications. Earth Syst. Sci. Data 2021, 13, 4349–4383. [Google Scholar] [CrossRef]
  58. Assamnew, A.D.; Tsidu, G.M. Assesing improvement in the fifth-generation ECMWF atmospheric reanalysis (ERA5) precipitation over East Africa. Int. J. Climatol. 2022, 43, 17–37. [Google Scholar] [CrossRef]
  59. Jarchow, C.J.; Didan, K.; Barreto-Mu noz, A.; Nagler, P.L.; Glenn, E.P. Application and comparison of the MODIS-derived enhanced vegetation index to VIIRS, landsat 5 TM and landsat 8 OLI platforms: A case study in the arid colorado river delta, Mexico. Sensors 2018, 18, 1546. [Google Scholar] [CrossRef] [PubMed] [Green Version]
  60. Kaufman, Y.J.; Tanré, D. Algorithm for remote sensing of tropospheric aerosol from MODIS. NASA MODIS Algorithm Theor. Basis Doc. Goddard Space Flight Cent. 1998, 85, 3–68. [Google Scholar]
  61. Vermote, E.; Kotchenova, S.; Ray, J. MODIS Surface Reflectance User’s Guide, Version 1.3. In MODIS Land Surface Reflectance Science Computing Facility; NASA: Washington, DC, USA, 2011. [Google Scholar]
  62. Shenglei, W.; Junsheng, L.; Bing, Z.; Qian, S.; Fangfang, Z.; Zhaoyi, L. A simple correction method for the MODIS surface reflectance product over typical inland waters in China. Int. J. Remote Sens. 2016, 37, 6076–6096. [Google Scholar] [CrossRef]
  63. Cie, C. Commission Internationale de l’Eclairage Proceedings, 1931; Cambridge University: Cambridge, CA, USA, 1932. [Google Scholar]
  64. Wang, S.; Li, J.; Zhang, B.; Lee, Z.; Spyrakos, E.; Feng, L.; Liu, C.; Zhao, H.; Wu, Y.; Zhu, L.; et al. Changes of water clarity in large lakes and reservoirs across China observed from long-term MODIS. Remote Sens. Environ. 2020, 247, 111949. [Google Scholar] [CrossRef]
  65. Wagh, P.; Sojan, J.M.; Babu, S.J.; Valsala, R.; Bhatia, S.; Srivastav, R. Indicative lake water quality assessment using remote sensing images-effect of COVID-19 lockdown. Water 2020, 13, 73. [Google Scholar] [CrossRef]
  66. White, E. Lake eutrophication in New Zealand—A comparison with other countries of the Organisation for Economic Co-operation and Development. N. Z. J. Mar. Freshw. Res. 1983, 17, 437–444. [Google Scholar] [CrossRef]
  67. Li, H.E.; Lee, J.H.W.; Cai, M. Nutrient load estimation methods for rivers. Int. J. Sediment Res. 2003, 18, 346. [Google Scholar]
  68. Kolo, B.; Ogugbuaja, V.; Dauda, M. Study on the level of sulphates, phosphates, and nitrates in water and aqueous sediments of Lake Chad Basin Area of Borno State, Nigeria. Cont. J. Water Air Soil Pollut. 2010, 1, 13–18. [Google Scholar]
  69. Mainstone, C.P.; Parr, W. Phosphorus in rivers—Ecology and management. Sci. Total Environ. 2002, 282, 25–47. [Google Scholar] [CrossRef] [PubMed]
  70. Tibebe, D.; Kassa, Y.; Melaku, A.; Lakew, S. Investigation of spatio-temporal variations of selected water quality parameters and trophic status of Lake Tana for sustainable management, Ethiopia. Microchem. J. 2019, 148, 374–384. [Google Scholar] [CrossRef]
  71. Yang, X.e.; Wu, X.; Hao, H.l.; He, Z.l. Mechanisms and assessment of water eutrophication. J. Zhejiang Univ. Sci. B 2008, 9, 197–209. [Google Scholar] [CrossRef] [PubMed] [Green Version]
  72. Beeton, A.M.; Edmondson, W.T. The eutrophication problem. J. Fish. Board Can. 1972, 29, 673–682. [Google Scholar] [CrossRef]
  73. Bigham Stephens, D.L.; Carlson, R.E.; Horsburgh, C.A.; Hoyer, M.V.; Bachmann, R.W.; Canfield, D.E., Jr. Regional distribution of Secchi disk transparency in waters of the United States. Lake Reserv. Manag. 2015, 31, 55–63. [Google Scholar] [CrossRef]
  74. Rodhe, W. Crystallization of eutrophication concepts in northern Europe. In Proceedings of the Symposium on Eutrophication: Causes, Consequences, Correctives; National Academy of Sciences: Washington, DC, USA, 1969. [Google Scholar] [CrossRef] [Green Version]
  75. Bryers, G.; Bowman, E. Protocol for Monitoring Trophic Levels of New Zealand Lakes and Reservoirs; Number 99/2, Lakes Consulting, Report; Ministry for the Environment: Wellington, New Zealand, 2000.
  76. Forsberg, C. Eutrophication parameters and trophic state indices in 30 Swedish waste-receiving lakes. Arch. Fur Hydrobiol. 1980, 89, 189–207. [Google Scholar] [CrossRef] [Green Version]
  77. Carlson, R.E. Expanding the trophic state concept to identify non-nutrient limited lakes and reservoirs. Enhancing States’S Lake Manag. Programs 1991, 59–71. [Google Scholar]
  78. Joniak, T.; Nagengast, B.; Kuczyńska-Kippen, N. Can popular systems of trophic classification be used for small water bodies? Oceanol. Hydrobiol. Stud. 2009, 38, 145–151. [Google Scholar] [CrossRef]
  79. Sheela, A.; Letha, J.; Joseph, S.; Ramachandran, K. Trophic state index of a lake system using IRS (P6-LISS III) satellite imagery. Environ. Monit. Assess. 2011, 177, 575–592. [Google Scholar] [CrossRef]
  80. Xie, Z.; Duan, A.; Tian, Q. Weighted composite analysis and its application: An example using ENSO and geopotential height. Atmos. Sci. Lett. 2017, 18, 435–440. [Google Scholar] [CrossRef] [Green Version]
  81. Chree, C. III. Some phenomena of sunspots and of terrestrial magnetism at Kew Observatory. Philos. Trans. R. Soc. Lond. Ser. Contain. Pap. Math. Phys. Character 1913, 212, 75–116. [Google Scholar] [CrossRef]
  82. Chree, C. VI. Some phenomena of sunspots and of terrestrial magnetism.—Part II. Philos. Trans. R. Soc. Lond. Ser. Contain. Pap. Math. Phys. Character 1914, 213, 245–277. [Google Scholar] [CrossRef] [Green Version]
  83. Kosaka, Y.; Nakamura, H. Mechanisms of meridional teleconnection observed between a summer monsoon system and a subtropical anticyclone. Part I: The Pacific–Japan pattern. J. Clim. 2010, 23, 5085–5108. [Google Scholar] [CrossRef]
  84. Fogt, R.L.; Bromwich, D.H.; Hines, K.M. Understanding the SAM influence on the South Pacific ENSO teleconnection. Clim. Dyn. 2011, 36, 1555–1576. [Google Scholar] [CrossRef]
  85. Laken, B.A.; Pallé, E.; Čalogović, J.; Dunne, E.M. A cosmic ray-climate link and cloud observations. J. Space Weather. Space Clim. 2012, 2, A18. [Google Scholar] [CrossRef] [Green Version]
  86. Vollenweider, R.; Kerekes, J. Eutrophication of Waters. Monitoring, Assessment and Control; Organization for Economic Co-Operation and Development (OECD): Paris, France, 1982; Volume 156. [Google Scholar]
  87. Barki, D.N.; Singa, P. Assessment of trophic state of lakes in terms of Carlson’s trophic state index. Int. J. Innov. Res. Sci. Eng. Technol. 2014, 3, 14297–14302. [Google Scholar]
  88. Peperzak, L. Climate change and harmful algal blooms in the North Sea. Acta Oecol. 2003, 24, S139–S144. [Google Scholar] [CrossRef]
  89. Chung, E.G.; Bombardelli, F.A.; Schladow, S.G. Modeling linkages between sediment resuspension and water quality in a shallow, eutrophic, wind-exposed lake. Ecol. Model. 2009, 220, 1251–1265. [Google Scholar] [CrossRef]
  90. O’Neil, J.M.; Davis, T.W.; Burford, M.A.; Gobler, C.J. The rise of harmful cyanobacteria blooms: The potential roles of eutrophication and climate change. Harmful Algae 2012, 14, 313–334. [Google Scholar] [CrossRef]
  91. Valdemarsen, T.; Quintana, C.O.; Flindt, M.R.; Kristensen, E. Organic N and P in eutrophic fjord sediments–rates of mineralization and consequences for internal nutrient loading. Biogeosciences 2015, 12, 1765–1779. [Google Scholar] [CrossRef] [Green Version]
  92. Trolle, D.; Hamilton, D.P.; Pilditch, C.A.; Duggan, I.C.; Jeppesen, E. Predicting the effects of climate change on trophic status of three morphologically varying lakes: Implications for lake restoration and management. Environ. Model. Softw. 2011, 26, 354–370. [Google Scholar] [CrossRef]
  93. Feng, W.; Zhan, J.; Deng, X. Influencing factors of lake eutrophication in China–A case study in 22 lakes in China. Ecol. Environ. Sci. 2012, 21, 94–100. [Google Scholar]
  94. Joehnk, K.D.; Huisman, J.; Sharples, J.; Sommeijer, B.; Visser, P.M.; Stroom, J.M. Summer heatwaves promote blooms of harmful cyanobacteria. Glob. Chang. Biol. 2008, 14, 495–512. [Google Scholar] [CrossRef] [Green Version]
  95. Su, Z.; Lin, C.; Ma, R.; Luo, J.; Liang, Q. Effect of land use change on lake water quality in different buffer zones. Appl. Ecol. Environ. Res. 2015, 13, 489–503. [Google Scholar]
  96. Oh, J.; Sankarasubramanian, A. Interannual hydroclimatic variability and its influence on winter nutrient loadings over the Southeast United States. Hydrol. Earth Syst. Sci. 2012, 16, 2285–2298. [Google Scholar] [CrossRef] [Green Version]
  97. Zoppini, A.; Ademollo, N.; Bensi, M.; Berto, D.; Bongiorni, L.; Campanelli, A.; Casentini, B.; Patrolecco, L.; Amalfitano, S. Impact of a river flood on marine water quality and planktonic microbial communities. Estuar. Coast. Shelf Sci. 2019, 224, 62–72. [Google Scholar] [CrossRef]
  98. Ascott, M.; Lapworth, D.; Gooddy, D.; Sage, R.; Karapanos, I. Impacts of extreme flooding on riverbank filtration water quality. Sci. Total Environ. 2016, 554, 89–101. [Google Scholar] [CrossRef]
  99. Paerl, H.W.; Hall, N.S.; Hounshell, A.G.; Luettich, R.A.; Rossignol, K.L.; Osburn, C.L.; Bales, J. Recent increase in catastrophic tropical cyclone flooding in coastal North Carolina, USA: Long-term observations suggest a regime shift. Sci. Rep. 2019, 9, 1–9. [Google Scholar] [CrossRef] [Green Version]
  100. Hutchins, M.; Harding, G.; Jarvie, H.; Marsh, T.; Bowes, M.; Loewenthal, M. Intense summer floods may induce prolonged increases in benthic respiration rates of more than one year leading to low river dissolved oxygen. J. Hydrol. 2020, 8, 100056. [Google Scholar] [CrossRef]
  101. Whitehead, P.G.; Wilby, R.L.; Battarbee, R.W.; Kernan, M.; Wade, A.J. A review of the potential impacts of climate change on surface water quality. Hydrol. Sci. J. 2009, 54, 101–123. [Google Scholar] [CrossRef] [Green Version]
  102. Mishra, A.K.; Singh, V.P. A review of drought concepts. J. Hydrol. 2010, 391, 202216. [Google Scholar] [CrossRef]
  103. Kundzewicz, Z.W. Climate change impacts on the hydrological cycle. Ecohydrol. Hydrobiol. 2008, 8, 195–203. [Google Scholar] [CrossRef] [Green Version]
  104. Braga, F.; Zaggia, L.; Bellafiore, D.; Bresciani, M.; Giardino, C.; Lorenzetti, G.; Maicu, F.; Manzo, C.; Riminucci, F.; Ravaioli, M.; et al. Mapping turbidity patterns in the Po river prodelta using multi-temporal Landsat 8 imagery. Estuar. Coast. Shelf Sci. 2017, 198, 555–567. [Google Scholar] [CrossRef]
  105. Joshi, I.D.; D’Sa, E.J.; Osburn, C.L.; Bianchi, T.S. Turbidity in Apalachicola Bay, Florida from Landsat 5 TM and field data: Seasonal patterns and response to extreme events. Remote Sens. 2017, 9, 367. [Google Scholar] [CrossRef] [Green Version]
  106. Du, X.; Hendy, I.; Schimmelmann, A. A 9000-year flood history for Southern California: A revised stratigraphy of varved sediments in Santa Barbara Basin. Mar. Geol. 2018, 397, 29–42. [Google Scholar] [CrossRef]
  107. George, G.; Hurley, M.; Hewitt, D. The impact of climate change on the physical characteristics of the larger lakes in the English Lake District. Freshw. Biol. 2007, 52, 1647–1666. [Google Scholar] [CrossRef]
  108. Rui, X.; Zhi, C.; Yun, Z. Impact assessment of climate change on algal blooms by a parametric modeling study in Han River. J. Resour. Ecol. 2012, 3, 209–219. [Google Scholar] [CrossRef]
  109. Moore, M.T.; Pierce, J.R.; Farris, J.L. Water-quality analysis of an intensively used on-farm storage reservoir in the northeast Arkansas Delta. Arch. Environ. Contam. Toxicol. 2015, 69, 89–94. [Google Scholar] [CrossRef]
  110. Pérez-Gutiérrez, J.D.; Paz, J.O.; Tagert, M.L.M. Seasonal water quality changes in on-farm water storage systems in a south-central US agricultural watershed. Agric. Water Manag. 2017, 187, 131–139. [Google Scholar] [CrossRef] [Green Version]
  111. Ahearn, D.S.; Sheibley, R.W.; Dahlgren, R.A.; Anderson, M.; Johnson, J.; Tate, K.W. land-use–land-cover influence on water quality in the last free-flowing river draining the western Sierra Nevada, California. J. Hydrol. 2005, 313, 234–247. [Google Scholar] [CrossRef]
  112. Salvetti, R.; Acutis, M.; Azzellino, A.; Carpani, M.; Giupponi, C.; Parati, P.; Vale, M.; Vismara, R. Modelling the point and non-point nitrogen loads to the Venice Lagoon (Italy): The application of water quality models to the Dese-Zero basin. Desalination 2008, 226, 81–88. [Google Scholar] [CrossRef]
  113. Ouyang, W.; Wang, X.; Hao, F.; Srinivasan, R. Temporal-spatial dynamics of vegetation variation on non-point source nutrient pollution. Ecol. Model. 2009, 220, 2702–2713. [Google Scholar] [CrossRef]
  114. Foote, K.J.; Joy, M.K.; Death, R.G. New Zealand dairy farming: Milking our environment for all its worth. Environ. Manag. 2015, 56, 709–720. [Google Scholar] [CrossRef] [PubMed]
  115. Suarez, J.; Puertas, J. Determination of COD, BOD, and suspended solids loads during combined sewer overflow (CSO) events in some combined catchments in Spain. Ecol. Eng. 2005, 24, 199–217. [Google Scholar] [CrossRef]
  116. Giri, S.; Qiu, Z. Understanding the relationship of land uses and water quality in twenty first century: A review. J. Environ. Manag. 2016, 173, 41–48. [Google Scholar] [CrossRef] [Green Version]
  117. Lintern, A.; Webb, J.; Ryu, D.; Liu, S.; Bende-Michl, U.; Waters, D.; Leahy, P.; Wilson, P.; Western, A. Key factors influencing differences in stream water quality across space. Wiley Interdiscip. Rev. Water 2018, 5, e1260. [Google Scholar] [CrossRef] [Green Version]
  118. Gámez, T.E.; Benton, L.; Manning, S.R. Observations of two reservoirs during a drought in central Texas, USA: Strategies for detecting harmful algal blooms. Ecol. Indic. 2019, 104, 588–593. [Google Scholar] [CrossRef]
  119. Jones, E.; van Vliet, M.T. Drought impacts on river salinity in the southern US: Implications for water scarcity. Sci. Total Environ. 2018, 644, 844–853. [Google Scholar] [CrossRef]
  120. Momblanch, A.; Paredes-Arquiola, J.; Munné, A.; Manzano, A.; Arnau, J.; Andreu, J. Managing water quality under drought conditions in the Llobregat River Basin. Sci. Total Environ. 2015, 503, 300–318. [Google Scholar] [CrossRef] [Green Version]
  121. Gibson, P.B.; Waliser, D.E.; Guan, B.; DeFlorio, M.J.; Ralph, F.M.; Swain, D.L. Ridging associated with drought across the western and southwestern United States: Characteristics, trends, and predictability sources. J. Clim. 2020, 33, 2485–2508. [Google Scholar] [CrossRef]
  122. Mosley, L.M. Drought impacts on the water quality of freshwater systems; review and integration. Earth-Sci. Rev. 2015, 140, 203–214. [Google Scholar] [CrossRef]
  123. Palmer, T.A.; Montagna, P.A. Impacts of droughts and low flows on estuarine water quality and benthic fauna. Hydrobiologia 2015, 753, 111–129. [Google Scholar] [CrossRef]
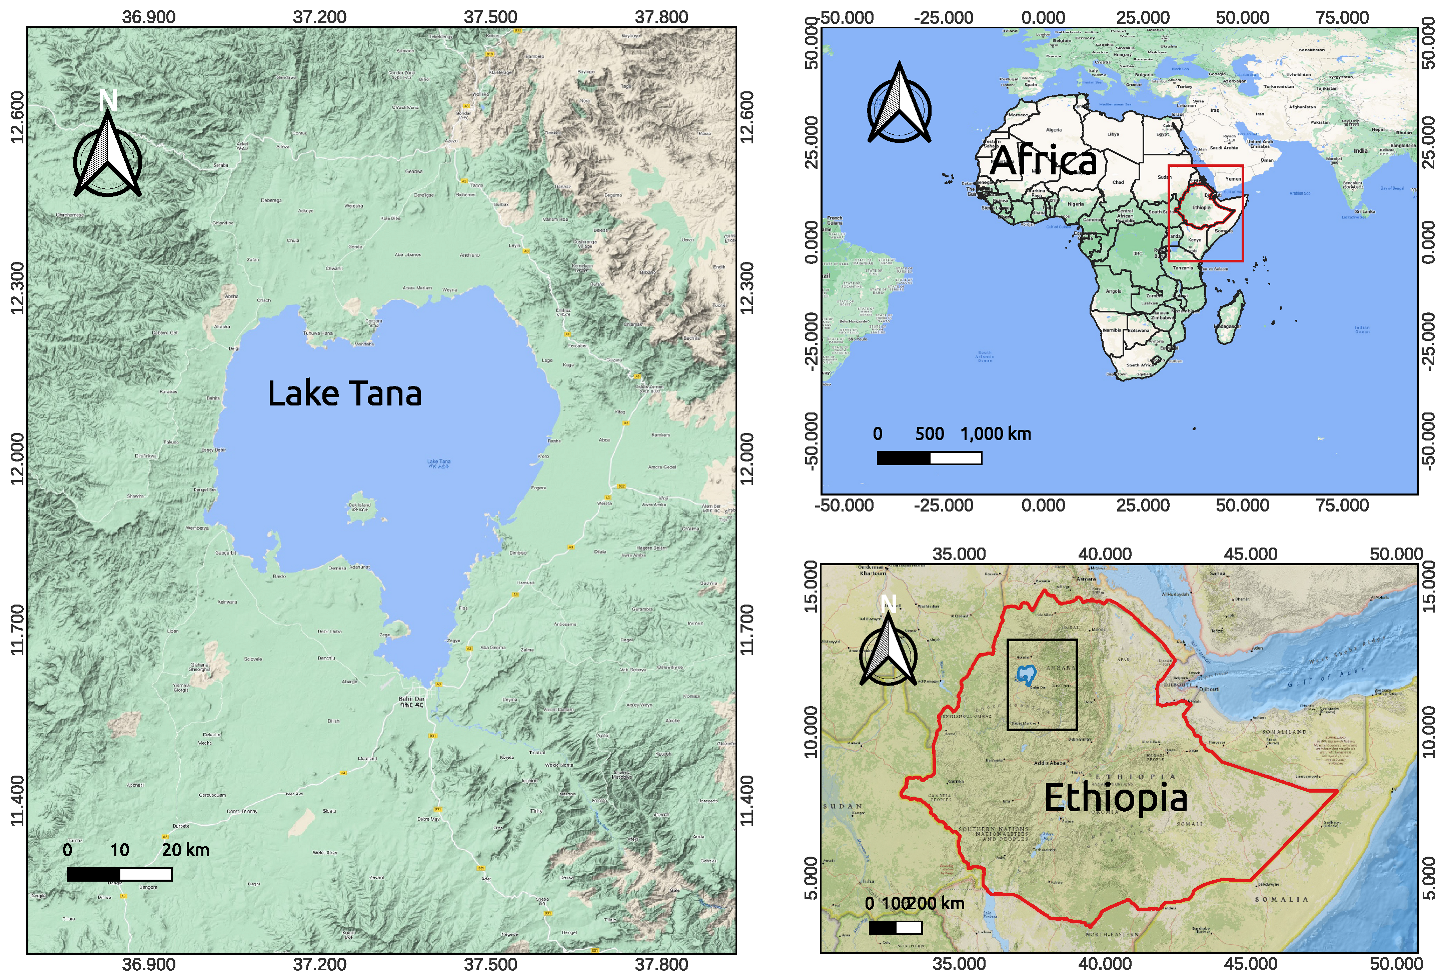
Figure 1. Location map of the study area.
Atmosphere 14 00289 g001
Figure 3. The categorical statistics and corresponding skill scores of FUI-based trophic state classification of Lake Tana (oligotrophic, mesotrophic, and eutrophic).
Atmosphere 14 00289 g003
Figure 4. Correlation between MODIS FUI and Diversity-II dataset (i.e., TSI, TSM, CDOM, MPHchl-a, FUBchl-a, and turbidity derived from MERIS). Based on MATLAB statistical tools, the statistically significant level of the correlation is 95% (i.e., the p-value is less than 0.05).
Atmosphere 14 00289 g004
Figure 5. Interannual spatiotemporal annual mean FUI variation over Lake Tana.
Atmosphere 14 00289 g005
Figure 6. Interannual FUI variability over Lake Tana during winter month (January) and spring month (April) from 2001 to 2021.
Atmosphere 14 00289 g006
Figure 7. Interannual FUI variability over Lake Tana during the summer (July) and autumn (October) months.
Atmosphere 14 00289 g007
Figure 8. Lake-wide interannual monthly averaged FUI time series.
Atmosphere 14 00289 g008
Figure 9. FUI composites over Lake Tana computed from FUI data belong to the periods of below normal, normal, above normal, lower extreme, and upper extreme values of skin temperature, lake bottom layer temperature, and evaporation.
Atmosphere 14 00289 g009
Figure 10. FUI composites over Lake Tana computed from FUI data belong to the periods of below normal, normal, above normal, lower extreme, upper extreme of precipitation, and surface runoff.
Atmosphere 14 00289 g010
Figure 11. FUI composites over Lake Tana computed from FUI data belonging to the periods of below normal, normal, above normal, lower extreme, and upper extreme values of wind speed.
Atmosphere 14 00289 g011
Figure 12. Seasonal FUI composites of Lake Tana during below-normal, normal, and above normal normalized difference vegetation index (NDVI) months.
Atmosphere 14 00289 g012
Figure 13. Seasonal FUI composites of Lake Tana during below-normal, normal, and above normal enhanced vegetation index (EVI) months.
Atmosphere 14 00289 g013
Figure 14. FUI composites of Lake Tana during normal, moderate drought, severe drought, and extreme drought periods.
Atmosphere 14 00289 g014
Table 1. The lookup table of Hue angle ( α ) and FUI classes from 1 to 21 [18].
FUI α RangeFUI α RangeFUI α Range
1 ( 145.00 , 137.73 ) 8 ( 19.92 , 5.14 ) 15 ( 26.68 , 29.67 )
2 ( 137.73 , 129.24 ) 9 ( 5.14 , 6.54 ) 16 ( 29.67 , 33.32 )
3 ( 129.24 , 115.13 ) 10 ( 6.54 , 15.34 ) 17 ( 33.32 , 37.89 )
4 ( 115.13 , 99.33 ) 11 ( 15.34 , 20.33 ) 18 ( 37.89 , 43.39 )
5 ( 99.33 , 75.99 ) 12 ( 20.33 , 22.03 ) 19 ( 43.39 , 48.28 )
6 ( 75.99 , 44.23 ) 13 ( 22.03 , 24.04 ) 20 ( 48.28 , 52.96 )
7 ( 44.23 , 19.92 ) 14 ( 24.04 , 26.68 ) 21 ( 52.96 , 59.00 )
Table 2. The lake water trophic states from FUI and red band remote sensing reflectance ( R r s (645 nm)).
FUI RangeWater ClarityTrophic State
1 FUI < 7 very clearoligotrophic
7 FUI < 10 moderately clearmesotrophic
F U I 10 and R r s (645 nm) 0.00625 moderately clearmesotrophic
F U I 10 and R r s (645 nm) > 0.00625 turbideutrophic
Table 3. 3 × 3 generic contingency table for MERIS-based TSI and MODIS-based FUI trophic state classes.
FUI
OligotrophicMesotrophicEutrophicTotal
OligotrophicABCD
MERISMesotrophicEFGH
TSIEutrophicIJKL
TotalMNOP
Disclaimer/Publisher’s Note: The statements, opinions and data contained in all publications are solely those of the individual author(s) and contributor(s) and not of MDPI and/or the editor(s). MDPI and/or the editor(s) disclaim responsibility for any injury to people or property resulting from any ideas, methods, instructions or products referred to in the content.