Article

Research on Cement Demand Forecast and Low Carbon Development Strategy in Shandong Province

Ecology Institute of Shandong Academy of Sciences, Qilu University of Technology (Shandong Academy of Sciences), Jinan 250101, China
*
Author to whom correspondence should be addressed.
Atmosphere 2023, 14(2), 267; https://doi.org/10.3390/atmos14020267
Submission received: 28 December 2022 / Revised: 19 January 2023 / Accepted: 27 January 2023 / Published: 28 January 2023
(This article belongs to the Section Air Pollution Control)

Abstract

:
The dual carbon targets and environmental quality constraints have released a clear transition signal for the green and low-carbon development of the cement industry. This study builds a CDI model based on the terminal sector forecasting method, predicts the cement demand in Shandong Province from 2020 to 2035, constructs a CO2 emission scenario in combination with green and low-carbon technical measures, uses the life-cycle assessment method to systematically simulate the CO2 emission trend of the cement industry in Shandong Province from 2020 to 2035, and discusses the low-carbon development path of the cement industry. The research shows that the overall demand for cement in Shandong Province shows a downward trend. Under the HD scenario, the cement demand has reached a historical peak of 166 Mt in 2021, and the per capita cement consumption is 1.63 t. In terms of CO2 emission structure, industrial production process CO2 accounts for 50.89–54.32%, fuel combustion CO2 accounts for 25.12–27.76%, transportation CO2 accounts for 10.65–11.36%, and electricity CO2 accounts for 9.20–10.71%. Through deepening supply-side structural reforms and implementing green and low-carbon technologies, the CO2 emissions and carbon intensity of the cement industry in Shandong Province will be significantly reduced. Under the EL scenario, CO2 emissions will be reduced from 92.96 Mt in 2020 to 56.31 Mt in 2035, the carbon intensity will be reduced from 581.32 kg/tc in 2020 to 552.32 kg/tc in 2035. In the short term, the decarbonization path of the cement industry in Shandong Province is mainly based on improving energy efficiency and comprehensive utilization of resources and energy technologies. In the long term, alternative raw materials and fuels are of great significance to improving the green and low-carbon development level of the cement industry.

1. Introduction

From the energy crisis in the 1970s to the Kyoto Protocol at the end of the last century, to the 1.5 °C and 2.0 °C climate goals set by the Paris Agreement, countries around the world have shifted their attention from energy efficiency to greenhouse gas reduction [1]. Human activities have broken the balance of carbon sources and carbon sinks in the original carbon cycle system, and greenhouse gases represented by CO2 have caused global warming, posing a great threat to human society and ecosystems [2]. Climate change can have knock-on effects on all ecosystems on Earth and is potentially irreversible. The implementation of the Paris Agreement and the sustainable development goals proposed by the United Nations and the Intergovernmental Panel on Climate Change (IPCC) have received extensive attention from all over the world [3]. The IPCC states that limiting global warming to 1.5 °C above preindustrial levels rather than 2.0 °C would reduce global net anthropogenic CO2 emissions by 45% from 2010 levels by 2030 and reach net zero emissions by mid-century [4]. Essentially, the 1.5 °C and 2 °C warming limitation targets depend on the remaining carbon budget. Based on the consensus, controlling the peak time and amount of CO2 is an important measure to adjust the remaining carbon budget [5].
The cement industry is an indispensable basic raw material industry for the joint development of new industrialization and new urbanization, and it is also one of the industrial sectors with the largest CO2 emissions. As one of the main leaders in global cement production, China’s cement production has ranked first in the world since the 1990s [6]. In 2020, the global cement production was 4100 Mt, and the cement production of China, India, Vietnam, and the United States accounted for about 71% of the global cement production. Among them, China’s cement production was 2394.71 Mt, accounting for about 58.41% of the global cement production [7,8]. The CO2 emissions of the cement industry account for about 5–7% of the global man-made CO2 emissions. In China, the CO2 emissions of the cement industry are second only to the steel industry, and its energy consumption accounts for about 7% of China’s energy consumption. It accounts for more than 10% of the country’s CO2 emissions [9,10]. In 2021, the State Administration of Market Supervision and National Development and Reform Commission and other departments jointly issued the Opinions on Improving the Quality of Cement Products and Regulating the Order of the Cement Market, pointing out that it is necessary to ensure that the CO2 emissions of China’s cement industry will reach the peak before 2030 [11].
The cement industry is a traditionally advantageous industry in Shandong Province. In 2020, Shandong’s cement output accounted for about 6.58% of the country’s total output, ranking second in the country. Energy consumption accounted for about 3.71% of the total energy consumption of the industrial sector in Shandong Province, and its CO2 emissions accounted for about 10.06% of the total CO2 emissions in Shandong Province. The effectiveness of CO2 reduction in Shandong’s cement industry plays a key role in reducing the amount of carbon peaking in Shandong Province and achieving the goal of carbon neutrality. In view of the scale of development of the cement industry in Shandong Province and the related CO2 emissions, it is important to adopt effective and necessary policy measures based on an in-depth understanding of the CO2 emissions of the cement industry, which will be important for China to fulfill the goal of independent contribution to CO2 emission reduction and will also provide lessons for the cement industry in other provinces with similar development paths.
Cement demand forecasting is the premise and basis for high-level planning of the cement system, and it is also a key step in formulating CO2 emission reduction strategies and achieving sustainable development. The existing cement demand forecasting methods can be divided into three categories. The first category is the econometric model forecasting method. By revealing the causal relationship between the cement system and the influencing factors, an econometric model including the cross-correlation characteristics of the system factors is constructed [9,12,13,14,15]. When the socio-economic system and cement demand system are affected by force majeure factors and external shocks, the indicators will inevitably show a wide range of abnormal fluctuations, which limits the applicability of such methods in specific situations. The second type is the analogical analysis method, which analyzes and summarizes the dynamic characteristics of cement demand in developed countries and uses the form of analogical reasoning to induce and deduce the represented objects [10,16,17,18]. It is unreasonable for such studies to set the peak time of cement demand and the saturation state as specific values, and the prediction of China’s cement demand with the help of analogy analysis is a probabilistic reasoning. The third category is the terminal sector forecasting method. By identifying the dynamic dependencies between the cement industry and different sectors, and on the basis of systematically summarizing the flow direction of terminal cement materials, they forecast and evaluate the cement demand of the terminal sector and even the entire system [19,20,21,22]. Construction of the dynamic feedback relationship between the cement demand system and internal driving factors from the perspective of terminal downstream demand can predict the overall behavior trend of the cement demand system more reasonably.
Due to its intensive demand for resources and energy in the production process, the CO2 produced by the cement industry has attracted great attention. Many scholars have used top-down or bottom-up methods to study the decarbonization path of the cement industry. The research results fully show that the cement industry has a large demand space for energy conservation and carbon reduction, which verifies the necessity and feasibility of implementing low-carbon strategies in this industry. At present, relevant research on CO2 emissions from the cement industry is mostly concentrated at the national level [15,23,24,25,26,27,28,29,30], and the existing studies ignore the regional heterogeneity of each provincial level in China, and the CO2 in the cement industry corresponding to different regional differentiated systems shows diverse trajectories, and the research on the low-carbon development path of the cement industry in Shandong Province has not been effectively explored. For the scope of CO2 accounting in the cement industry, most of the previous studies estimated the direct emissions from the process and the indirect emissions from fuel and electricity [12,31,32,33,34,35,36]. From the life cycle perspective, since transportation is an important component of the cement production process in terms of energy consumption, ignoring CO2 emissions from transportation may affect the accuracy and integrity of the CO2 accounting results of the cement industry. In addition, for the control measures of energy conservation and emission reduction in the cement industry, many existing studies focus on top-down macroplanning or single technology research, lacking a comprehensive quantitative assessment of the impact of specific technology promotion [10,37,38,39,40,41]. These uncertainties make it challenging for government departments to adequately comprehend the energy conservation and emission reduction capabilities of the cement industry and to develop appropriate policy measures.
As the CO2 is an undesired output of economic production activities in the cement industry, clarifying the role and responsibility of the cement industry in the carbon peaking and carbon neutrality targets in Shandong Province requires an accurate knowledge of the CO2 emission trends in the cement industry in the future [12]. To compensate for the limitations of the accounting scope and other influencing factors of the above study, this study constructed a CDI model based on the terminal sector forecasting method to forecast the cement demand of the Shandong Province cement industry from 2020 to 2035, which is based on the life cycle perspective and combined with the scenario analysis method to assess the CO2 emissions of the Shandong Province cement industry from the bottom up and explore the low carbon and green development strategies in the cement industry.

2. Methodology

2.1. Cement Demand Intensity Model

As a subsystem in the socio-economic system, this means that the cement industry cannot exist as an independent system. The demand for cement is affected by several factors such as economy, society, and technology. Based on the downstream demand of the terminal, this study divides the cement demand system into the industrial sector, the construction sector, and the transportation sector. The residential building module is constructed by introducing exogenous variable indicators such as population, urbanization level, and rural and urban per capita building space demand. Integrating the macrocharacteristics of the cement industry and end-use demand drivers with the strength of cement materials to construct a cement demand intensity model (CDI model).
P C t = R S t × R C I + C S t × C C I + H M t × H C I + R M t × R C I + I F A t × I C I
R S = R F S + U F S = P × ( 1 U R ) × P R S + P × U R × P U S
where t represents the year; P C t   represents the demand for cement; R S t   represents the newly added residential building area in rural and urban areas; R C I represents the cement material strength of rural and urban residential buildings; C S t   represents the newly added commercial building area; C C I   stands for the commercial building cement material strength; H M t   stands for highway mileage; H C I   stands for unit road cement material strength; R M t   represents the railway mileage; R C I   represents the unit railway cement material strength; I F A t   represents the total investment in industrial fixed assets; I C I   represents the cement material strength of industrial buildings; R F S   represents the rural residential building area; U F S   represents the urban residential building area; P   stands for population; U R   stands for urbanization rate; P R S   stands for rural per capita residential building area at the end of the year; and P U S   stands for urban per capita residential building area at the end of the year.

2.2. Cement CO2 Model

From the perspective of the whole life cycle, the sources of CO2 emissions in the cement industry can be classified into industrial production process emissions and energy activity emissions, and energy activities can be subdivided into fuel combustion emissions and indirect CO2 emissions caused by net purchased electricity and cement transportation [42,43]. Among them, cement industry production process emissions are from the high temperature calcination of carbonate raw materials containing calcium carbonate and magnesium carbonate into cement clinker while releasing CO2 as its by-product. Referring to 2006 IPCC Guidelines for National Greenhouse Gas Inventories and Guidelines for Calculating [44] and Reporting Greenhouse Gas Emissions of Cement Manufacturing Enterprises in China (Trial) [45], the formula for calculating CO2 emissions in the cement industry is as follows.
E p = M c l × E F c l × C F c k d = M c l × ( C C a O × 44 56 + C M g O × 44 40 ) × C F c k d
E f = M c l × C E c l × E F f
E e = M c × E C c × E F e
E t = M c , i × T D i × T F i × E F t
where E p represents the CO2 emission of the process; E f represents the CO2 emission of fossil fuel; E e represents the CO2 emission of electricity; E t represents the CO2 emission of the transportation process; M c represents the quality of cement; M c , i represents the quality of raw materials consumed per ton of cement production; M c l represents the quality of cement clinker; E F c l represents the CO2 emission factor of the cement process; C F c k d represents the correction factor of cement kiln dust emission; C C a O represents the CaO content in cement clinker; C M g O represents the MgO content in cement clinker; 44 / 56 and 44 / 40 represent the CO2 content in CaO and MgO, respectively; C E c l represents the comprehensive coal consumption of clinker per unit; E F f represents the CO2 emission factor of energy activities; E C c represents the comprehensive power consumption of cement per unit; E F e represents the CO2 emission factor of the power sector; T D i represents the transportation mileage of raw materials in the cement production process; T F i represents the consumption of transportation fuel (diesel); and E F t represents the CO2 emission factor of cement transportation.

3. Scenario Settings and Data Sources

3.1. Scenario Settings

In the face of the complex and variable future socio-economic system and CO2 emissions, scenario planning has the advantage of reducing, to a certain extent, the objective bias caused by specific assumptions about uncertain parameters by integrating relevant alternatives, external uncertainties, and multicriteria decision making [46]. Scientifically predicting cement demand in Shandong Province is the basis for carrying out research on low-carbon pathways in the cement industry. According to the 2035 long-term planning target outline of Shandong Province and the development plan of relevant departments, this study set three scenarios to analyze the medium- and long-term cement and clinker demand in Shandong Province, namely, the low demand scenario (LD), the medium demand scenario (MD) and the high demand scenario (HD).
To measure the impact of various cement demands as well as low carbon technology measures on the low carbon pathway of the Shandong Province cement industry, this study constructed four cement low-carbon development scenarios based on the cement medium demand scenario and the high demand scenario, namely, the baseline scenario (BS), the low constraint scenario (LC), the comprehensive policy scenario (CP), and the enhanced low-carbon scenario (EL).
Under the baseline scenario, we assume that future macroeconomic parameters such as population and urbanization levels are referenced to the established Shandong Province related plans, that the industrial, construction, and transportation sectors remain highly competitive, that Shandong Province cement demand is referenced to the cement median demand scenario, and that low carbon technology measures in the cement industry develop steadily.
Under the low constraint scenario, with the rapid increase of population, Shandong Province will usher in the peak of industrialization and urbanization planning cycle construction. The industry, construction, and transport sectors show a high demand scenario for cement, and the energy intensity and carbon intensity of the cement industry are the same as the baseline scenario.
Under the comprehensive policy scenario, the social and economic development status of Shandong Province is consistent with the low constraint scenario, and the cement demand in Shandong Province adopts the cement high demand scenario. The cement industry focuses on changing the development mode and controls the energy intensity and carbon intensity of the cement industry by increasing the penetration rate of low-carbon technical measures.
Under the enhanced low-carbon scenario, Shandong Province’s cement demand is the same as the baseline scenario, and the theoretical upper limit energy-saving and emission-reduction potential of Shandong Province’s cement industry is assessed by developing a two-way constraint policy on the total energy consumption and carbon intensity. The enhanced low-carbon scenario reflects a more active policy planning orientation and a greater energy-saving and carbon-reducing efficiency.

3.2. Cement Demand Parameter Setting

In 2020, the cement consumption of the construction industry in Shandong Province will be 82.84 Mt [47], and the new residential building area in rural and urban areas will be 34 million square meters. The strength of cement material for commercial buildings is assumed to be 0.22 t/m2 [20], so it can be estimated that the strength of cement material for rural and urban residential buildings is 2.04 t/m2. The strength of the highway mileage cement material is set at 3054.99 t/km [48]. Referring to railway design and construction standards, the strength of cement materials in the railway system is set at 1536 t/km [19]. The industrial sector mainly includes the construction of rural infrastructure, urban infrastructure, and other industrial facilities. According to the surplus of total cement in Shandong Province and the original price of industrial fixed asset investment, the strength of cement materials for industrial construction is estimated to be 0.11 t/104 yuan.
The production process of cement clinker is the major part of CO2 emissions. By adding alternative raw materials such as steel slag, slag, fly ash, and silica-calcium slag to reduce the proportion of cement clinker, thereby reducing cement industry CO2 emissions. From 2016 to 2020, the cement clinker coefficient in Shandong Province was in the range of 52–62%. In the past five years, the average cement clinker coefficient in Shandong Province was 57%. Compared with my country and the major developed countries in the world, Shandong Province’s cement clinker coefficient is in the lead level; this study assumes that the cement clinker coefficient in Shandong Province is 57% during the study period.
Population is an important driving force for steady economic growth and sustainable social development. With socioeconomic development and the decline of total fertility rate, the natural population growth rate will follow an inverted U-shaped curve. The Shandong Province Population Development Medium and Long-Term Plan pointed out that to strengthen the strategic position and basic role of population development, the average annual natural population growth rate of Shandong Province during the “14th Five-Year Plan” and “15th Five-Year Plan” periods were 0.3% and 0.2%, respectively. Considering the childbearing policy of Shandong Province and the promotion of regional construction demand, the average annual natural population growth rate of Shandong Province under different scenarios is shown in Table 1.
American urban geographer Ray M. Northam pointed out that the dynamic process of urbanization level and economic development stage presents an inverted S-shaped curve [49]. At the theoretical level, the measurement value of 70–80% is generally considered to be an important turning point in the urbanization process, and the growth rate of the urban population share at the mature stage starts to slow down or even stagnate when it reaches the theoretical saturation value. The guiding concept of urbanization has changed from focusing on exogenous characteristics such as urbanization speed, total population, and urban scale to endogenous characteristics such as healthy urbanization, ecosystems, and urban–rural balance. Combined with the New Urbanization Plan of Shandong Province, the urbanization rate of permanent residents in Shandong Province under different scenarios is shown in Table 2.
The life span of rural residential buildings is usually shorter than that of urban residential buildings and commercial buildings, and along with the accelerated urbanization process, the new floor space mainly comes from urban areas. In addition, the growth rate of urban floor space per capita will further slow down in the future due to the real estate investment boom that has caused urban floor space to grow faster than the demand for migration [50,51]. Combined with the New Urbanization Plan of Shandong Province, this study assumes that the construction stock in Shandong Province will be in a state of rapid saturation before 2030, and that the period from 2030 to 2035 will be a transition period from a state of rapid saturation to a state of slow saturation. Table 3 shows the growth rate of rural and urban per capita residential building area and new commercial building area under different scenarios.
Since the “13th Five-Year Plan” period, Shandong Province has firmly grasped the position of “pioneering officer” in transportation, accelerated the construction of transportation infrastructure, and initially formed a comprehensive transportation network system. Shandong Province’s 14th Five-Year Plan for Comprehensive Transportation Development clearly states that the road mileage in Shandong Province is expected to increase by 3.5% in 2025. The Medium and Long-Term Development Plan of Shandong Province’s Comprehensive Transportation Network points out that the construction of a strong transportation province will be further promoted, and the operating mileage of railways will reach 11,000 km in 2035. Combined with the evolution trend of transportation in Shandong Province, the growth rate of road mileage and railway mileage in Shandong Province under different scenarios is shown in Table 4.
During the “13th Five-Year Plan” period, affected by the domestic and international economic environment factors, the economic market downturn triggered a decline in the growth rate of industrial fixed asset investment. Shandong Province has carried out multidimensional investment guarantee construction projects in the fields of industry, high-tech industries, and social and people’s livelihood: strengthening the benign linkage between the supply side and the demand side, focusing on the release of policy dividends to help the market’s vitality and potential to recover steadily, using the growth of investment in the real economy to hedge against weak consumption, and using the replacement of old growth drivers to hedge against weak economic traction. The growth rate of industrial fixed asset investment in Shandong Province under different scenarios is shown in Table 5.

3.3. Cement CO2 Parameter Setting

According to statistics, in 2020, the comprehensive coal consumption per unit product of clinker in Shandong Province was 111 kgce/tcl, and the comprehensive power consumption per unit product of cement was 88 kWh/tc. Based on the content of calcium carbonate and magnesium carbonate in silicate raw materials, the CO2 emission factor of the cement process was 0.516 t/tcl [31]. During the high-temperature calcination process of cement raw materials, part of the clinker will escape in the form of kiln head dust and kiln bypass vent dust. This process can be regarded as a source of CO2 emissions in the cement industry production process. The default value of correction factor for cement kiln dust recommended by IPCC is 1.02 [44]. The fuel CO2 emission factor is 1.94 kg/kg coal [52]. Referring to the 2011 and 2012 Average Carbon Dioxide Emission Factors of China’s Regional Power Grids issued by the National Development and Reform Commission, the CO2 emission factor of North China regional electricity was taken as 0.8843 kg/kWh.
The transportation of the cement industry includes the transportation of raw materials, mineral admixtures, fossil fuels, cement and clinker products, and the related products that are transported from the upstream area to the downstream area through roads, railways, and ships. The average transportation distance of raw materials is 10 km, the transportation distance of mineral admixtures is about 30 km to 50 km, the transportation distance of gypsum is about 60 km, and the transportation distance of coal is about 350 km [26,53]. Cement products are traditional bulk freight materials, and the increase in transportation mileage will affect the comprehensive competitiveness of cement products. At this stage, the radiation radius of the cement product transportation market is about 200 km to 300 km [25]. The energy consumption related to transportation in China’s cement industry is 0.074 kgce/t km, and the CO2 emission factor of oil products in the cement industry is 2.258 t/tce [26]. The list of transportation substances in the cement industry is shown in Table 6.

3.4. Low-Carbon Technical Measures for the Cement Industry

Due to the enormous CO2 emissions by the cement industry, to meet the needs of low-carbon economic development and energy saving in the cement industry, the low-carbon technology measures for cement CO2 emission reduction mainly include [2,9,55]: (1) To achieve system energy efficiency optimization by improving thermal efficiency and power efficiency; (2) alternative raw materials and fuels; (3) comprehensive utilization technology of resources and energy; and (4) to implement carbon capture, utilization, and storage (CCUS). CCUS technology is generally considered an important technical component in achieving carbon neutrality, and the application of this technology in the cement industry can significantly reduce carbon emissions. From an economic point of view, the level of cost-effectiveness is the best driving force for technology promotion under market competition conditions [24]. Instability and uncertainty still exist in the reaction process [2], therefore, the application of CCUS technology in the cement industry was not considered in this study for the time being. During the “13th Five-Year Plan” period, in order to implement the concept of green and low-carbon development, improve the quality of the ecological environment, and narrow the gap between China’s cement industry and the international advanced cement industry in terms of energy intensity and carbon intensity, the Chinese government successively issued a number of policies to promote advanced energy-saving technologies promotion and implementation. From the perspective of resource and energy consumption, pollutant discharge, and economic benefits, this study refers to the National Industrial Energy Conservation Technology and Equipment Recommended Catalog, the National Industrial Energy Conservation Technology Application Guidelines and Cases, and the National Key Energy Conservation and Low Carbon Technology Promotion Catalog published by the National Development and Reform Commission and the Ministry of Industry and Information Technology [56,57,58]. At the same time, combined with the relevant literature research [59,60,61], 15 low-carbon technical measures for the cement industry were selected, as shown in Table 7.

4. Results and Discussion

4.1. Cement and Clinker Demand Forecast

Based on the CDI model, we predicted the cement demand in different scenarios in Shandong Province from 2020 to 2035 (see Figure 1). Factors such as population, urbanization, and industrialization play a vital role in the cement industry in Shandong Province. Under the LD and MD scenarios, the demand for cement and clinker in Shandong Province has reached the historical peak in 2014. In the early stage of the “13th Five-Year Plan”, the overcapacity reduction action led to a relative decrease in the demand for cement and clinker. In the later period of the “13th Five-Year Plan”, the demand for cement and clinker rose to a high level, and ushered in the second peak point in 2020. In the later period of the “14th Five-Year Plan”, it will remain in a downward trend. Under the LD scenario, the demand for cement will drop from 157.68 Mt in 2020 to 91.35 Mt in 2035, with a cumulative decline of 42.07%. Cement clinker demand will drop from 91.01 Mt in 2020 to 52.07 Mt in 2035. Under the MD scenario, the demand for cement in Shandong Province in 2025, 2030, and 2035 is 134.03, 115.66, and 101.95 Mt, respectively, and the demand for cement clinker will drop from 91.01 Mt in 2020 to 58.11 Mt in 2035, with an average decline of 2.41%. Under the HD scenario, during the “14th Five-Year Plan” period, Shandong Province will usher in the peak of industrialization and urbanization planning cycle construction, and the cement demand will rise from 157.68 Mt in 2020 to 166 Mt in 2021, reaching the historical peak point of cement demand. During the “15th Five-Year Plan” period and the “16th Five-Year Plan” period, the investment demand in the construction sector and the transportation sector tend to be flat, and the market demand for cement and clinker declines. During the study period, the demand for cement clinker in Shandong Province will drop from 94.62 Mt in 2021 to 66.67 Mt in 2035, with a cumulative decline of 29.54%. Under three different scenarios, rural and urban residential buildings, commercial buildings, and road construction are the main factors affecting cement demand.
Cement consumption per capita is one of the most important indicators of cement saturation status. The cement consumption per capita in the cement industry under different scenarios is shown in Figure 2. With the change of population growth rate and driving factors of cement demand, the state of cement saturation in Shandong Province shows staged characteristics under different scenarios. On the whole, the per capita cement consumption in Shandong Province is similar to the changing characteristics of cement demand. Under the LD and MD scenarios, the per capita cement consumption reached its first peak of 1.67 t in 2014 and its second peak of 1.55 t in 2020. Under the HD scenario, the first peak time and peak volume of per capita cement consumption are the same as the above scenario, and the second peak time is 2021, with a peak volume of 1.63 t.

4.2. Energy Consumption and Energy Intensity

There is a huge demand for energy consumption in the cement industry, and the promotion of high-efficiency and energy-saving technologies is the key to improving energy efficiency in the future. Different scenarios of energy consumption in Shandong Province in 2020–2035 for the cement industry are shown in Figure 3. Under the BS scenario, the final energy consumption decreases from 15.26 Mtce in 2020 to 9.17 Mtce in 2035, with an average annual decline of 2.66%. The energy consumption structure can not only reflect the resource endowment but also reflect the quality and potential efficiency of energy consumption. The energy consumption of the cement industry in Shandong Province is dominated by coal and diesel, accounting for about 90.96–91.34% of the total energy consumption. Due to the surge in demand for cement in Shandong Province, the final energy consumption under the LC scenario will reach a high point of 16.02 Mtce in 2021, and then slowly drop to 10.49 Mtce in 2035, of which coal accounts for 60.46–62.25% of the final energy consumption. Compared with the LC scenario, the cement industry in Shandong Province implements more active low-carbon technical measures, and the energy consumption under the CP scenario rises briefly from 15.26 Mtce in 2020 to 15.98 Mtce in 2021, and then declines steadily to 10.02 Mtce in 2035. Due to the combustion of fossil fuels and the energy consumption of transportation vehicles, coal and diesel account for a relatively high proportion in the final energy consumption structure, accounting for about 90.96–91.78%. The energy consumption of transportation vehicles is directly related to the demand for cement, and diesel consumption accounts for about 28.72–32.34% of energy consumption. Under the EL scenario, through the implementation of total cement demand constraints and aggressive energy-saving and low-carbon measures, energy consumption will be reduced from 15.26 Mtce in 2020 to 8.76 Mtce in 2035, a decrease of 7.79–12.58% compared with the CP scenario. Among them, coal consumption accounted for 59.43–62.25%, and electricity consumption accounted for 8.22–9.04%.
The promotion and application of low-carbon technology measures in the cement industry plays a vital role in reducing energy intensity; the energy intensity of the cement industry in Shandong Province under different scenarios is shown in Figure 4. Under the BS scenario, the energy intensity will drop from 96.83 kgce/tc in 2020 to 89.99 kgce/tc in 2035, and according to the cement unit product energy consumption limit level, the energy intensity of the cement industry in Shandong Province in 2035 all reached the third level. Under the CP scenario, the energy efficiency of the cement industry will be further improved, and the energy intensity of the cement industry in 2025, 2030, and 2035 will be 93.86, 90.45, and 85.93 kgce/tc, respectively. Compared with the BS scenario, the average decline rate is 2.18%, and the energy intensity of the cement industry will reach the second level of the energy consumption limit per unit product in 2035. Under the EL scenario, the industrial development goals of the cement industry shrink, and the requirements for energy conservation are stronger than those in the LC scenario. Energy intensity drops rapidly from 96.83 kgce/tc in 2020 to 85.93 kgce/tc in 2035. If transportation energy consumption is not considered, the energy intensity of the cement industry in Shandong Province under the EL scenario in 2035 is 58.14 kgce/tc, which is 27.33% lower than the first-level level of cement energy consumption limit per unit product.

4.3. CO2 Emission and Carbon Intensity

Cement demand and energy structure are the main factors affecting CO2 emissions from the cement industry. Figure 5 shows the CO2 emissions from the cement industry in Shandong Province under different scenarios from 2020 to 2035. From the perspective of time change characteristics, under the four scenarios, the CO2 emissions of the cement industry generally show a downward trend, but the change rates are different. With the continuous increase in the penetration rate of cement low-carbon technology, the carbon intensity of the cement industry in Shandong Province has gradually decreased (see Figure 6). Under the BS scenario, the CO2 emissions of the cement industry in Shandong Province are 78.24, 66.64, and 57.56 Mt in 2025, 2030, and 2035, respectively; during the “14th Five-Year Plan” period, the decline in CO2 is the most significant, with a reduction rate of about 15.84%. Under the LC scenario, the CO2 emissions of the cement industry are the most remarkable among the four scenarios, rising sharply from 92.96 Mt in 2020 to 97.68 Mt in 2021, and 86.26 Mt in 2025, before falling back steadily to 66.07 Mt in 2035, with the CO2 emissions of the cement industry increasing by 8.44–14.39% compared with the BS scenario. The carbon emission structure and carbon intensity of the LC scenario and the BS scenario are the same, among them, the CO2 emissions of processing and fuel account for 50.89–52.95% and 26.08–27.76%, respectively, and the CO2 emissions of transportation account for more than the CO2 emissions of electricity, and the carbon intensity of the cement industry in Shandong Province will be reduced from 589.57 kg/tc in 2020 to 566.57 kg/tc in 2035. Under the CP scenario, due to the efficient promotion of low-carbon energy-saving technologies in the cement industry, the CO2 emissions of the cement industry in Shandong Province will reach a high point of 97.53 Mt in 2021, and the CO2 emissions in 2035 will be 64.41 Mt, and the proportion of CO2 emissions from fuel combustion is 25.12–27.76%. The relatively high binding force of terminal energy consumption contributes to the decline in carbon intensity, and the carbon intensity of the cement industry in Shandong Province drops rapidly from 581.32 kg/tc in 2020 to 2035. Under the EL scenario, the CO2 emissions of the cement industry will decrease from 92.96 Mt in 2020 to 56.31 Mt in 2035, a decrease of 7.79–12.58% compared with the CP scenario, of which CO2 emissions from the process account for 50.89–54.32%. In the four scenarios, electricity CO2 emissions account for 9.20–10.71% and transportation CO2 emissions account for 10.65–11.36% of total CO2 emissions.

4.4. Cement Lowcarbon Technology Roadmap

In the process of industrialization, the cement industry is the main driver of carbon emission growth in Shandong Province. In the short term, the cement industry is constrained by energy and resource constraints, ecological and environmental constraints, and low-carbon technologies, making it difficult for the cement industry to release its development capacity quickly, thus leading to an important adjustment period and transition period for the cement sector. Supply-side structural reform and the promotion and application of efficient low-carbon technologies are important means to achieve energy saving and carbon reduction in the cement industry. At present, Shandong Province is in an important period of promoting new urbanization and new industrialization, and cement is an indispensable and just-needed product on the demand side. In the case of reasonable economics, the application of cement low-carbon technology can not only meet the economic benefits of enterprises, but also promote the green and low-carbon transformation of the cement industry and avoid the lock-in effect of cement carbon emission reduction path. Therefore, the low-carbon development path of cement discussed in this study is mainly aimed at green, efficient, and low-carbon cement technologies. Based on the EL scenario, the low-carbon technology route of the cement industry is drawn (see Figure 7). By calculating the carbon emission reduction potential of 15 energy-saving technologies in the cement industry from 2020 to 2035, the cement industry in Shandong Province still has a large space for carbon emission reduction. The CO2 emission reduction potential of the cement industry in Shandong Province increases from 3.60 Mt in 2020 to 6.13 Mt in 2035, accounting for 3.88% and 10.88% of the total CO2 emissions in 2020 and 2035, respectively, and the cumulative CO2 emission reduction potential is 77.59 Mt, equivalent to 83.46% of the total CO2 emissions in 2020. The carbon emission reduction potential of low-carbon technologies mainly depends on the baseline efficiency level and the influence of the technology promotion rate. In terms of improving thermal efficiency and electrical efficiency, a ball mill + high pressure roller press for cement grinding (N2), precalcination with high solid to gas ratio (N4), and cement clinker firing system optimization technology (N8) have the greatest potential for CO2 emission reduction. Among them, the precalcination with high solid to gas ratio (N4) has an energy-saving potential of about 16 kgce per ton of clinker, and the CO2 emission reduction potential increases from 0.12 Mt in 2020 to 0.88 Mt in 2035. It has outstanding advantages in heat exchange efficiency and system stability, and the government should increase the promotion of this technology in the future. In terms of alternative raw materials and fuels, the utilization of steel slag as an alternative raw material for cement production (N11) and the production of cement clinker using fly ash instead of clay (N13) have the greatest CO2 emission reduction potential. Alternative raw materials are an important starting point for CO2 emission reduction in the cement industry. The above two energy-saving technologies have high potential for emission reduction, but the current popularity is low. In the future, we should focus on the improvement and application of alternative raw material technologies. In terms of comprehensive resource and energy utilization technology, low temperature waste heat recovery for power generation (N10) has the greatest potential for CO2 emission reduction, with a current power generation capacity of around 35 kWh per ton of clinker and a CO2 emission reduction potential of 1.80 Mt in 2035 for this technology, making it a green power technology in line with the national clean production policy.

5. Conclusions

(a)
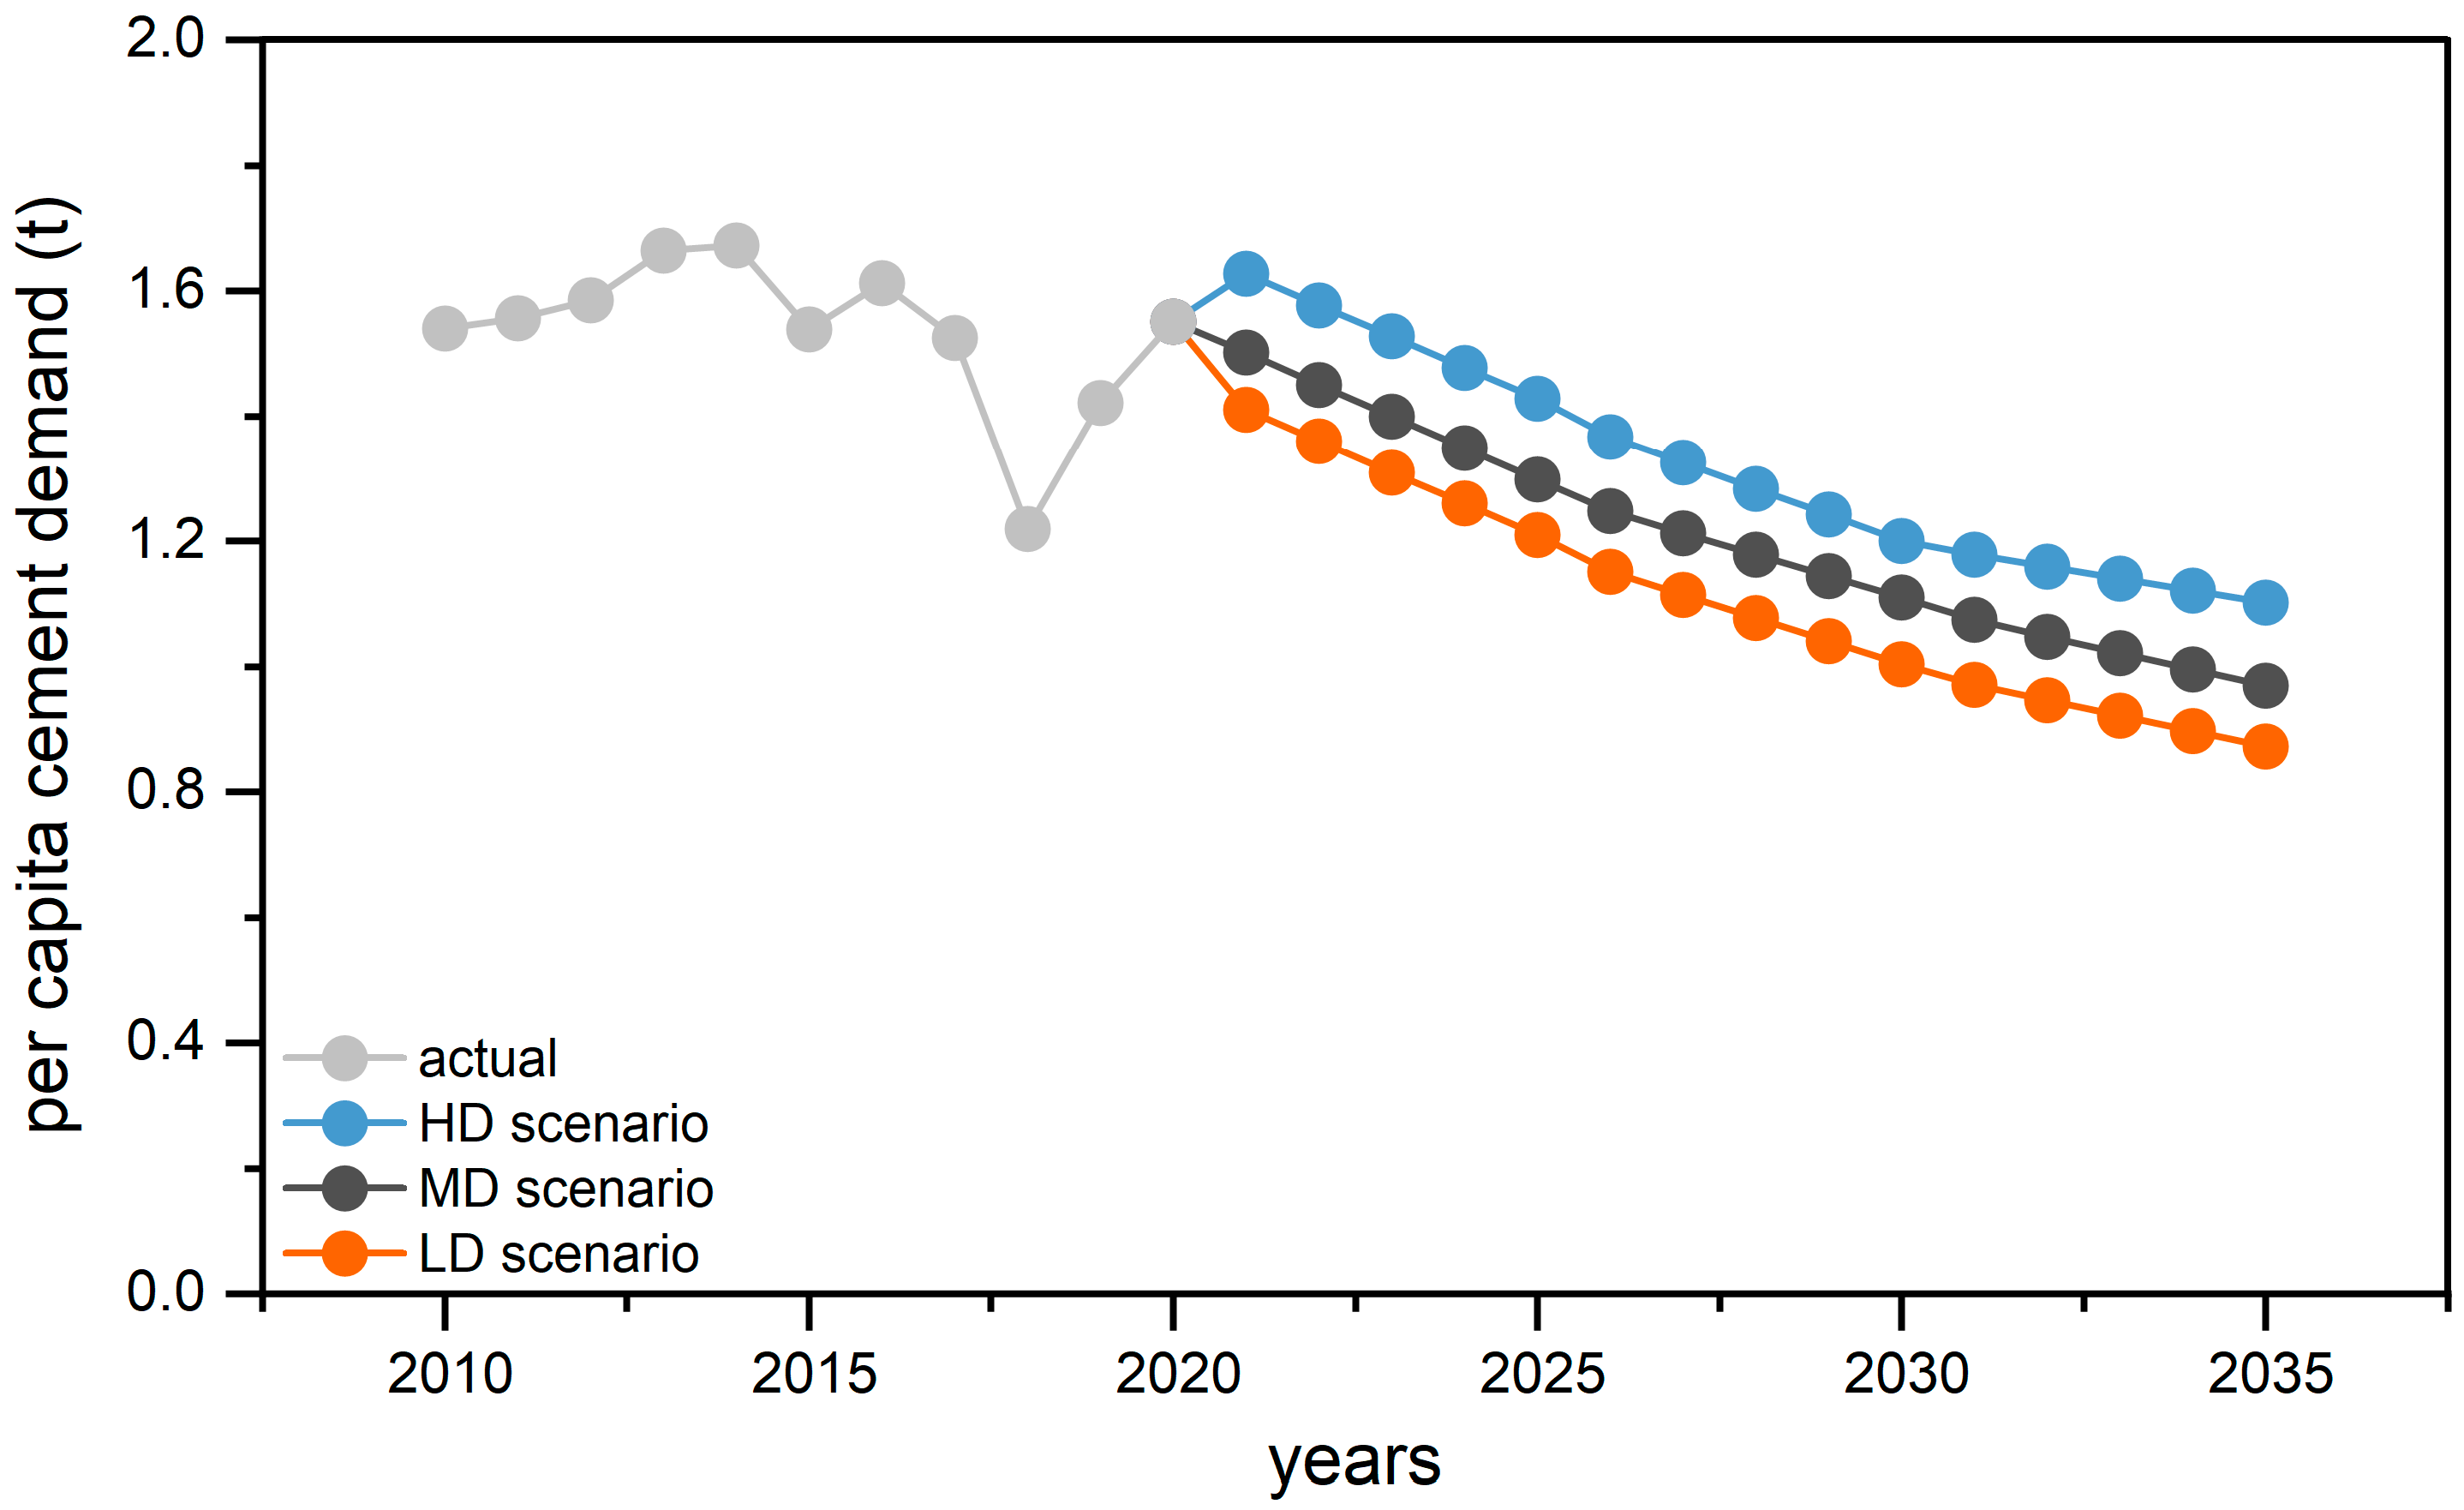
Under the LD scenario and the MD scenario, the cement demand in Shandong Province reached a historical peak of 164.06 Mt in 2014, and the per capita cement consumption was 1.67 t. Under the HD scenario, the cement demand in Shandong Province reached a historical peak of 166 Mt in 2021, and the per capita cement consumption was 1.63 t. Although the demand for cement and clinker is still likely to increase due to the large-scale construction of real estate and infrastructure in the near future, once the investment and construction demand of the construction sector and industrial sector reaches saturation, the cement industry in Shandong Province is bound to have overcapacity. In the future, Shandong Province should focus on adjusting the structural imbalance between the supply and demand sides of the cement industry, revitalizing the stock, and optimizing the increase.
(b)
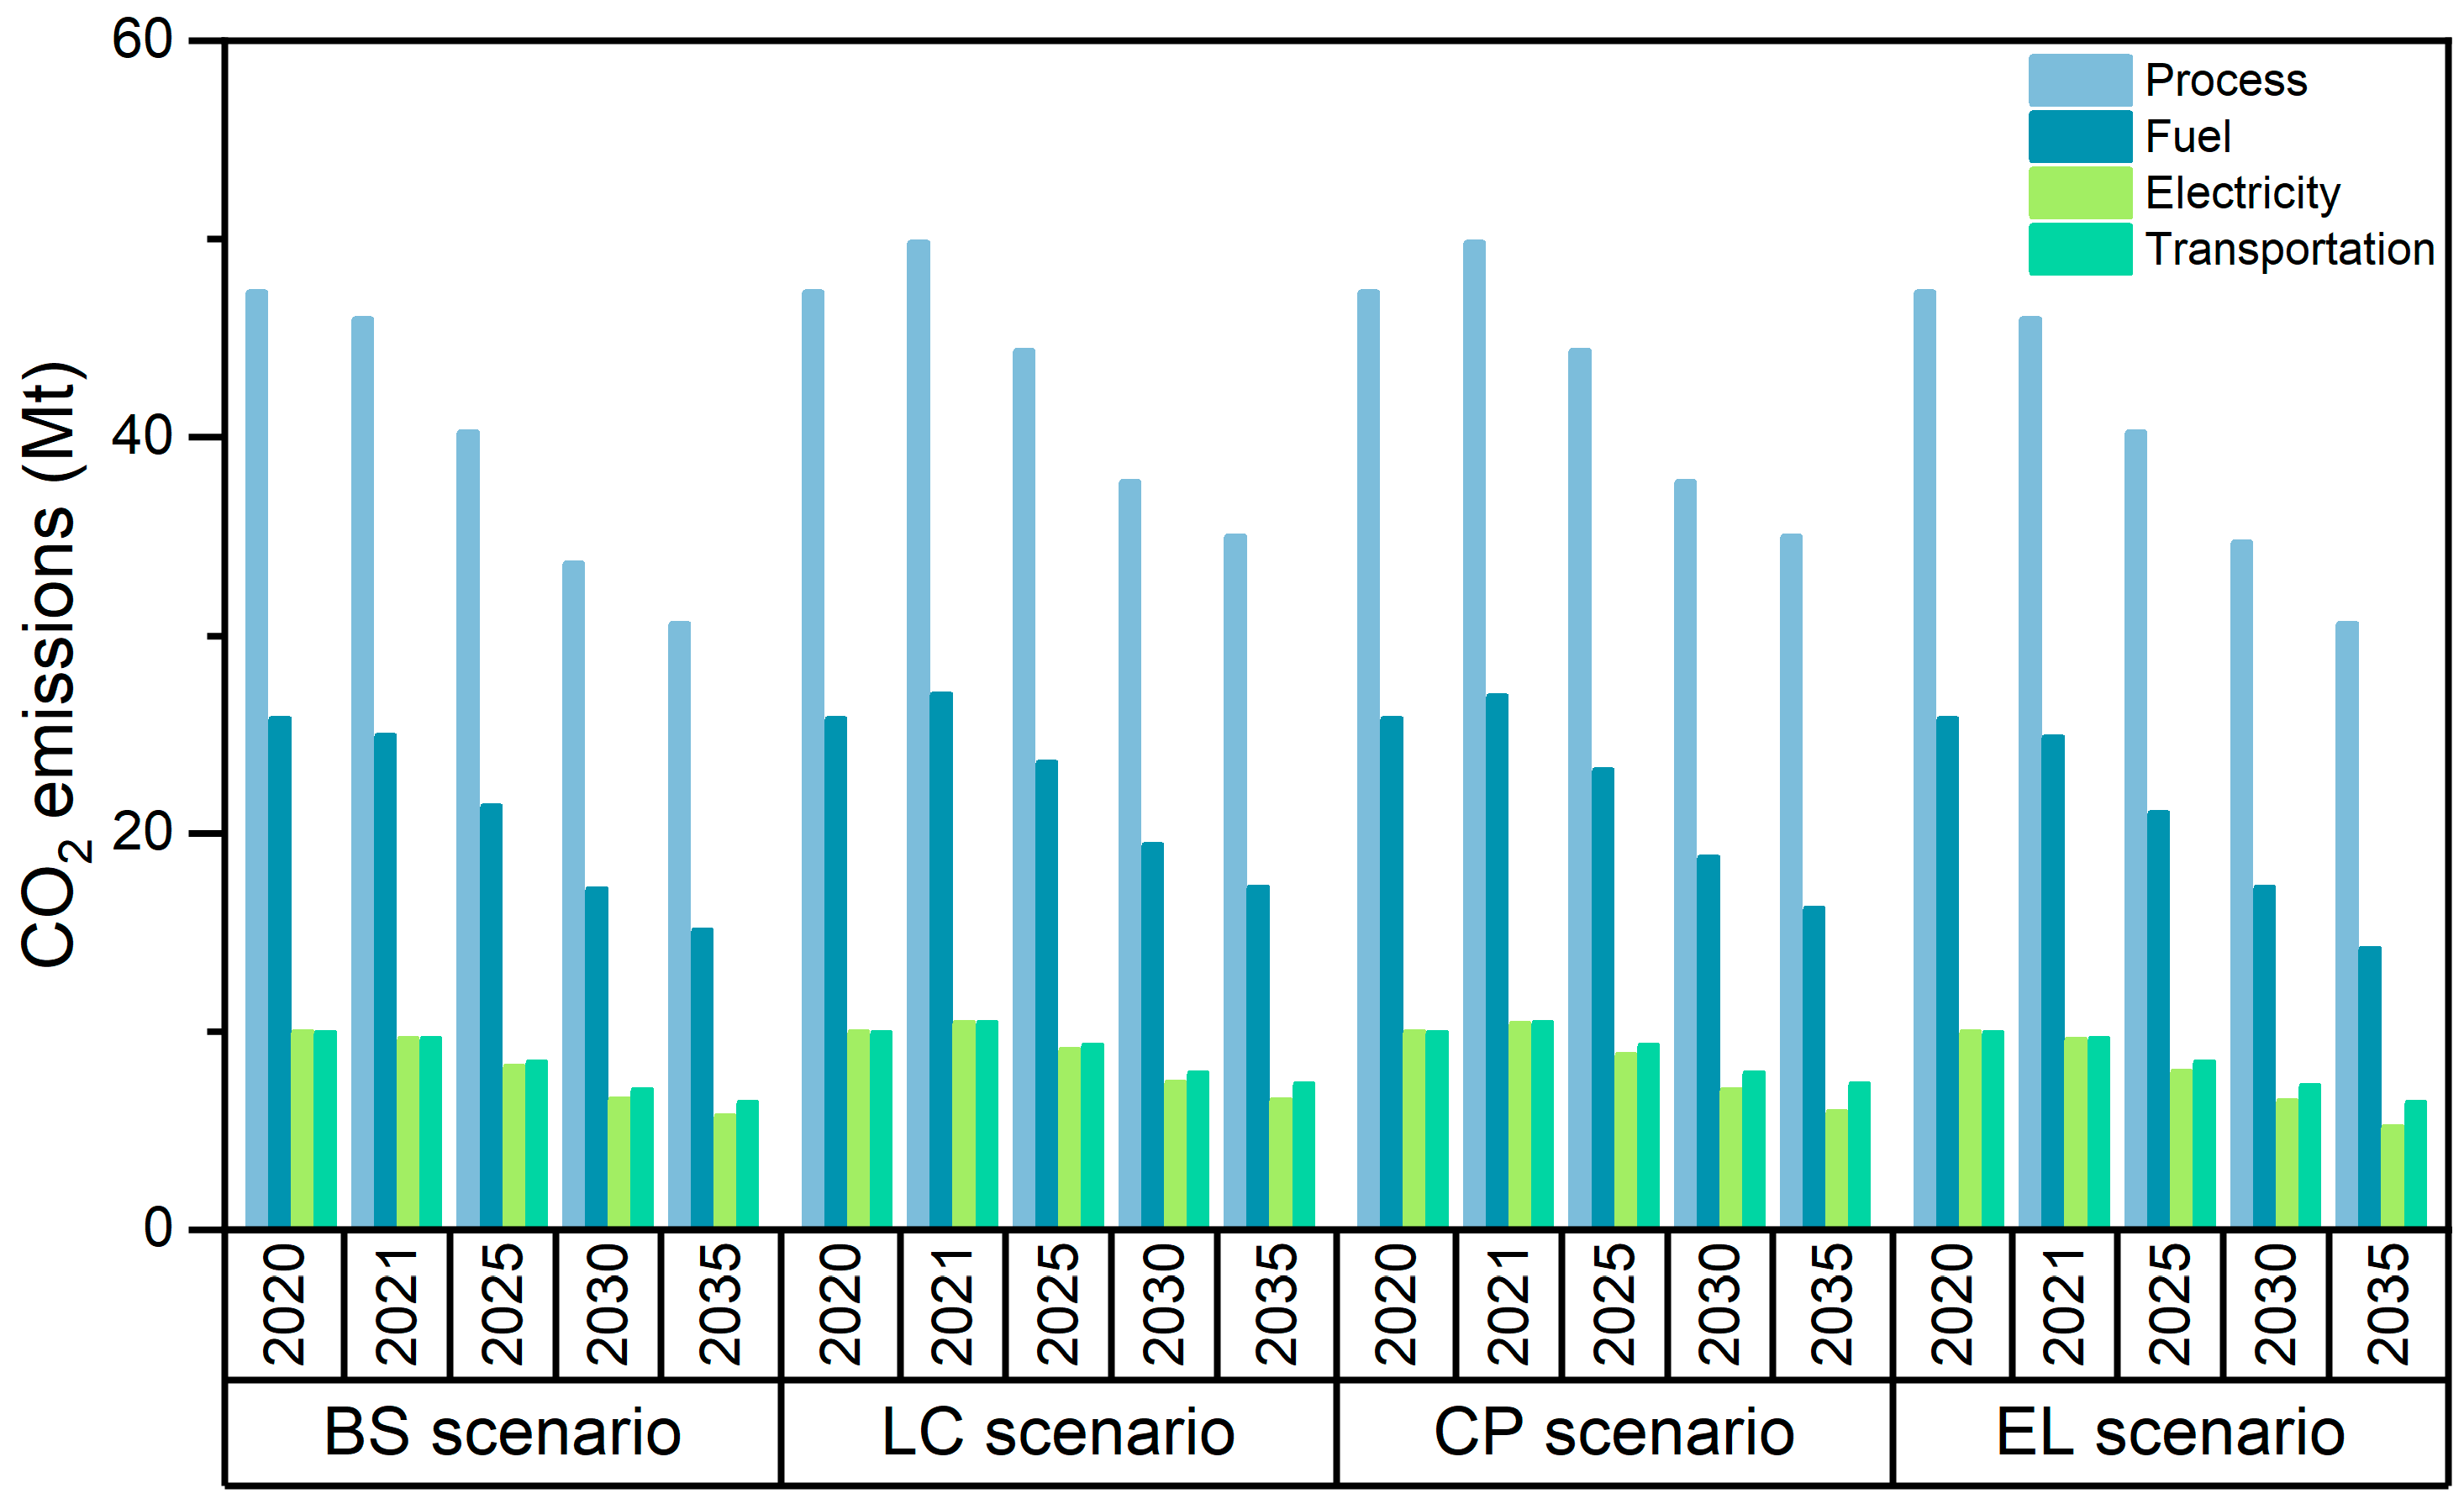
In terms of CO2 emission structure, the industrial production process CO2 accounts for 50.89–54.32%, fuel combustion CO2 accounts for 25.12–27.76%, transportation CO2 accounts for 10.65–11.36%, and electricity CO2 accounts for 9.20–10.71%. In terms of energy structure, coal consumption accounts for about 59.43–62.25%, electricity consumption accounts for 8.22–9.04% of final energy consumption, and transportation energy consumption accounts for 28.72–32.34%.
(c)
When the penetration rate of low-carbon technologies remains unchanged, supply-side structural reform is the most direct way to reduce energy consumption and CO2 emissions. Compared with the CP scenario, the energy consumption and CO2 emissions in the EL scenario are reduced by 7.79–12.58%, respectively. When the demand for cement and the penetration rate of low-carbon technology changes at the same time, the relatively high intensity of capacity reduction and low-carbon technology penetration rate are conducive to curbing final energy consumption and CO2 emissions, while significantly reducing energy intensity and carbon intensity. Compared with the LC scenario, the EL scenario reduces CO2 emissions by 7.93–14.78%, energy consumption by 8.02–16.51%, and the average reduction rates of energy intensity and carbon intensity are 2.18% and 1.25%.
(d)
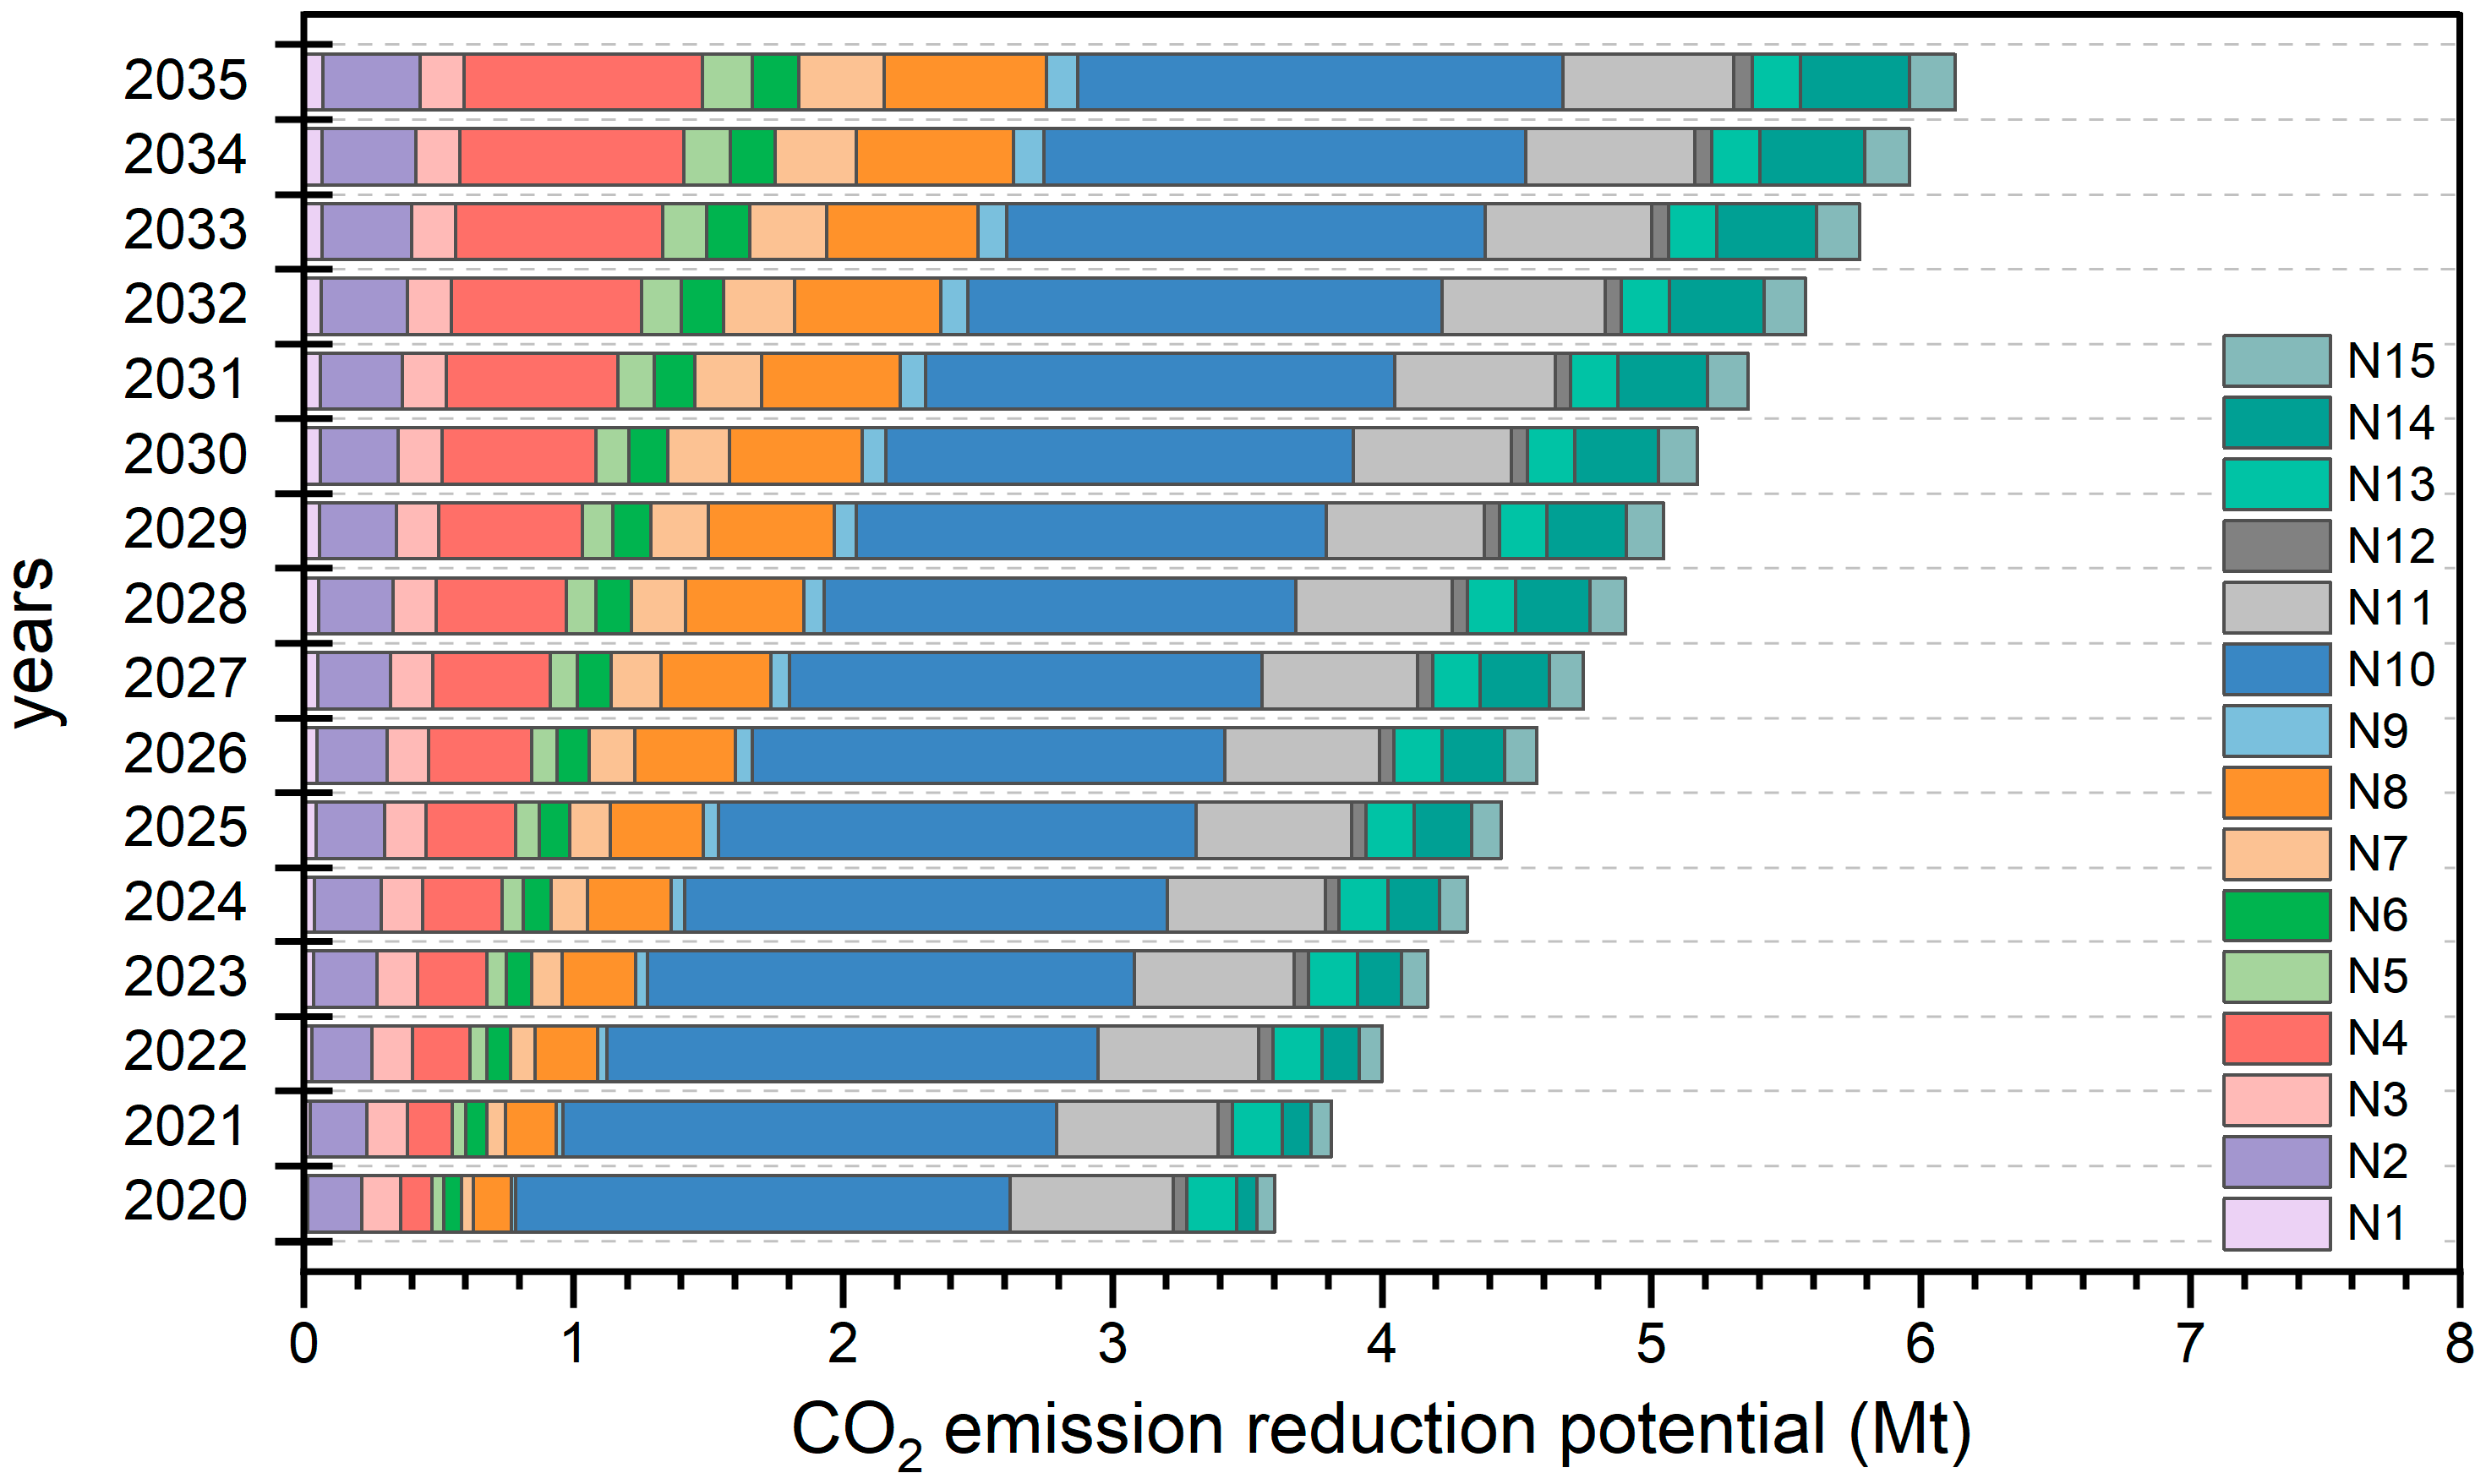
From the perspective of the low-carbon technology roadmap, the CO2 emission reduction potential of the cement industry in Shandong Province has increased from 3.6 Mt in 2020 to 7.01 Mt in 2035, and the cumulative CO2 emission reduction potential is 85.38 Mt, which is equivalent to 91.84% of the total CO2 emissions in 2020. From a short-term perspective, the carbon emission reduction technology path of the cement industry in Shandong Province is mainly based on improving energy efficiency and comprehensive utilization of resources and energy. In the future, the Shandong provincial government should promote the green and low-carbon transformation of the cement industry through demonstration projects.

Author Contributions

Conceptualization, C.X. and Y.G.; methodology, Y.G.; software, Y.G.; validation, C.X., Y.G. and G.Y.; resources, C.X.; writing—original draft preparation, Y.G.; writing—review and editing, C.X. and G.Y.; supervision, C.X., Y.G. and G.Y. All authors have read and agreed to the published version of the manuscript.

Funding

This research was funded by the major innovation projects of science, education, and industry integration of Qilu University of Technology (Shandong Academy of Science) (Grant No.: 2022JBZ02-05).

Institutional Review Board Statement

Not applicable.

Informed Consent Statement

Not applicable.

Data Availability Statement

Not applicable.

Conflicts of Interest

The authors declare no conflict of interest.

References

  1. Wu, T.; Ng, S.T.; Chen, J. Deciphering the CO2 emissions and emission intensity of cement sector in China through decomposition analysis. J. Clean. Prod. 2022, 352, 131627. [Google Scholar] [CrossRef]
  2. Benhelal, E.; Shamsaei, E.; Rashid, M.I. Challenges against CO2 abatement strategies in cement industry: A review. J. Environ. Sci. 2021, 104, 84–101. [Google Scholar] [CrossRef]
  3. Toro, N.; Gálvez, E.; Saldaña, M.; Jeldres, R.I. Submarine mineral resources: A potential solution to political conflicts and global warming. Miner. Eng. 2022, 179, 107441. [Google Scholar] [CrossRef]
  4. Intergovernmental Panel on Climate Change. Global Warming of 1.5 °C. Available online: https://www.ipcc.ch/site/assets/uploads/sites/2/2022/06/SR15_Full_Report_LR.pdf (accessed on 4 November 2022).
  5. Fang, K.; Tang, Y.; Zhang, Q.; Song, J.; Wen, Q.; Sun, H.; Ji, C.; Xu, A. Will China peak its energy-related carbon emissions by 2030? Lessons from 30 Chinese provinces. Appl. Energy 2019, 255, 113852. [Google Scholar] [CrossRef]
  6. Shandong Provincial Bureau of Statistics. Shandong Statistical Yearbook; China Statistics Press: Beijing, China, 2022.
  7. National Bureau of Statistics. China Statistical Yearbook; China Statistics Press: Beijing, China, 2021.
  8. United States Geological Survey. Cement. Available online: https://pubs.usgs.gov/periodicals/mcs2021/mcs2021-cement.pdf (accessed on 27 December 2022).
  9. Wei, J.; Cen, K.; Geng, Y. China’s cement demand and CO2 emissions toward 2030: From the perspective of socioeconomic, technology and population. Environ. Sci. Pollut. Res. 2019, 26, 6409–6423. [Google Scholar] [CrossRef]
  10. Tan, C.; Yu, X.; Guan, Y. A technology-driven pathway to net-zero carbon emissions for China’s cement industry. Appl. Energy 2022, 325, 119804. [Google Scholar] [CrossRef]
  11. State Administration for Market Regulation; Ministry of Industry and Information Technology of the People’s Republic of China; National Development and Reform Commission; Ministry of Ecology and Environment of the People’s Republic of China; Ministry of Commerce of the People’s Republic of China; General Administration of Customs of the People’s Republic of China; China National Intellectual Property Administration. Opinions on Improving the Quality of Cement Products and Regulating the Order of the Cement Market. Available online: http://www.gov.cn/zhengce/zhengceku/2021-05/26/content_5612468.htm (accessed on 20 October 2022).
  12. Xu, G.; Xue, D.; Rehman, H. Dynamic scenario analysis of CO2 emission in China’s cement industry by 2100 under the context of cutting overcapacity. Mitig. Adapt. Strateg. Glob. Change 2022, 27, 53. [Google Scholar] [CrossRef]
  13. Wei, J.; Cen, K. Empirical assessing cement CO2 emissions based on China’s economic and social development during 2001-2030. Sci. Total Environ. 2019, 653, 200–211. [Google Scholar] [CrossRef]
  14. Du, Z.; Wei, J.; Cen, K. China’s carbon dioxide emissions from cement production toward 2030 and multivariate statistical analysis of cement consumption and peaking time at provincial levels. Environ. Sci. Pollut. Res. 2019, 26, 28372–28383. [Google Scholar] [CrossRef]
  15. Ige, O.E.; Duffy, K.J.; Olanrewaju, O.A.; Collins, O.C. An Integrated System Dynamics Model and Life Cycle Assessment for Cement Production in South Africa. Atmosphere 2022, 13, 1788. [Google Scholar] [CrossRef]
  16. Ke, J.; Zheng, N.; Fridley, D.; Price, L.; Zhou, N. Potential energy savings and CO2 emissions reduction of China’s cement industry. Energy Policy 2012, 45, 739–751. [Google Scholar] [CrossRef] [Green Version]
  17. Feng, X.; Lugovoy, O.; Qin, H. Co-controlling CO2 and NOx emission in China’s cement industry: An optimal development pathway study. Adv. Clim. Change Res. 2018, 9, 34–42. [Google Scholar] [CrossRef]
  18. Ren, M.; Ma, T.; Fang, C.; Liu, X.; Guo, C.; Zhang, S.; Zhou, Z.; Zhu, Y.; Dai, H.; Huang, C. Negative emission technology is key to decarbonizing China’s cement industry. Appl. Energy 2023, 329, 120254. [Google Scholar] [CrossRef]
  19. Shi, F.; Huang, T.; Tanikawa, H.; Han, J.; Hashimoto, S.; Moriguchi, Y. Toward a Low Carbon-Dematerialization Society Measuring the Materials Demand and CO2 Emissions of Building and Transport Infrastructure Construction in China. J. Ind. Ecol. 2012, 16, 493–505. [Google Scholar] [CrossRef]
  20. Hasanbeigi, A.; Khanna, N.; Price, L. Air Pollutant Emissions Projections for the Cement and Steel Industry in China and the Impact of Emissions Control Technologies; Lawrence Berkeley National Laboratory: Berkeley, CA, USA, 2017.
  21. Li, N.; Ma, D.; Chen, W. Quantifying the impacts of decarbonisation in China’s cement sector: A perspective from an integrated assessment approach. Appl. Energy 2017, 185, 1840–1848. [Google Scholar] [CrossRef]
  22. Zhang, S.; Ren, H.; Zhou, W.; Yu, Y.; Chen, C. Assessing air pollution abatement co-benefits of energy efficiency improvement in cement industry: A city level analysis. J. Clean. Prod. 2018, 185, 761–771. [Google Scholar] [CrossRef] [Green Version]
  23. Zheng, C.; Zhang, H.; Cai, X.; Chen, L.; Liu, M.; Lin, H.; Wang, X. Characteristics of CO2 and atmospheric pollutant emissions from China’s cement industry: A life-cycle perspective. J. Clean. Prod. 2021, 282, 124533. [Google Scholar] [CrossRef]
  24. Wen, Z.; Chen, M.; Meng, F. Evaluation of energy saving potential in China’s cement industry using the Asian-Pacific Integrated Model and the technology promotion policy analysis. Energy Policy 2015, 77, 227–237. [Google Scholar] [CrossRef]
  25. Wei, J.; Cen, K. A preliminary calculation of cement carbon dioxide in China from 1949 to 2050. Mitig. Adapt. Strateg. Glob. Change 2019, 24, 1343–1362. [Google Scholar] [CrossRef]
  26. Shen, W.; Cao, L.; Li, Q.; Zhang, W.; Wang, G.; Li, C. Quantifying CO2 emissions from China’s cement industry. Renew. Sustain. Energy Rev. 2015, 50, 1004–1012. [Google Scholar] [CrossRef]
  27. Ma, X.; Li, C.; Li, B. Carbon Emissions of China’s Cement Packaging: Life Cycle Assessment. Sustainability 2019, 11, 5554. [Google Scholar] [CrossRef] [Green Version]
  28. Li, M.; Zhang, M.; Du, C.; Chen, Y. Study on the spatial spillover effects of cement production on air pollution in China. Sci. Total Environ. 2020, 748, 141421. [Google Scholar] [CrossRef] [PubMed]
  29. Rahman, M.M.; Rahman, M.S.; Chowdhury, S.R.; Elhaj, A.; Razzak, S.A.; Abu Shoaib, S.; Islam, M.K.; Islam, M.M.; Rushd, S.; Rahman, S.M. Greenhouse Gas Emissions in the Industrial Processes and Product Use Sector of Saudi Arabia-An Emerging Challenge. Sustainability 2022, 14, 7388. [Google Scholar] [CrossRef]
  30. Talaei, A.; Pier, D.; Iyer, A.V.; Ahiduzzaman, M.; Kumar, A. Assessment of long-term energy efficiency improvement and greenhouse gas emissions mitigation options for the cement industry. Energy 2019, 170, 1051–1066. [Google Scholar] [CrossRef]
  31. Cai, B.; Wang, J.; He, J.; Geng, Y. Evaluating CO2 emission performance in China’s cement industry: An enterprise perspective. Appl. Energy 2016, 166, 191–200. [Google Scholar] [CrossRef]
  32. Liao, S.; Wang, D.; Xia, C.; Tang, J. China’s provincial process CO2 emissions from cement production during 1993–2019. Sci. Data 2022, 9, 165. [Google Scholar] [CrossRef]
  33. Wang, Y.; Höller, S.; Viebahn, P.; Hao, Z. Integrated assessment of CO2 reduction technologies in China’s cement industry. Int. J. Greenhouse Gas Control 2014, 20, 27–36. [Google Scholar] [CrossRef] [Green Version]
  34. Ofosu-Adarkwa, J.; Xie, N.; Javed, S.A. Forecasting CO2 emissions of China’s cement industry using a hybrid Verhulst-GM(1,N) model and emissions’ technical conversion. Renew. Sustain. Energy Rev. 2020, 130, 109945. [Google Scholar] [CrossRef]
  35. Andrew, R.M. Global CO2 emissions from cement production, 1928–2018. Earth Syst. Sci. Data 2019, 11, 1675–1710. [Google Scholar] [CrossRef] [Green Version]
  36. Ishak, S.A.; Hashim, H. Effect of mitigation technologies on the total cost and carbon dioxide emissions of a cement plant under multi-objective mixed linear programming optimisation. Chem. Eng. Res. Des. 2022, 186, 326–349. [Google Scholar] [CrossRef]
  37. Wei, J.; Cen, K.; Geng, Y. Evaluation and mitigation of cement CO2 emissions: Projection of emission scenarios toward 2030 in China and proposal of the roadmap to a low-carbon world by 2050. Mitig. Adapt. Strateg. Glob. Change 2019, 24, 301–328. [Google Scholar] [CrossRef]
  38. Oral, H.V.; Saygin, H. Simulating the future energy consumption and greenhouse gas emissions of Turkish cement industry up to 2030 in a global context. Mitigation and Adaptation Strategies for Global Change 2019, 24, 1461–1482. [Google Scholar] [CrossRef]
  39. Verma, Y.; Mazumdar, B.; Ghosh, P. Dataset on the electrical energy consumption and its conservation in the cement manufacturing industry. Data Brief 2020, 28, 104967. [Google Scholar] [CrossRef]
  40. Jaiboon, N.; Wongsapai, W.; Daroon, S.; Bunchuaidee, R.; Ritkrerkkrai, C.; Damrongsak, D. Greenhouse gas mitigation potential from waste heat recovery for power generation in cement industry: The case of Thailand. Energy Reports 2021, 7, 638–643. [Google Scholar] [CrossRef]
  41. An, J.; Middleton, R.S.; Li, Y.N. Environmental Performance Analysis of Cement Production with CO2 Capture and Storage Technology in a Life-Cycle Perspective. Sustainability 2019, 11, 2626. [Google Scholar] [CrossRef] [Green Version]
  42. Ali, M.B.; Saidur, R.; Hossain, M.S. A review on emission analysis in cement industries. Renewable Sustainable Energy Rev. 2011, 15, 2252–2261. [Google Scholar] [CrossRef]
  43. Lin, B.; Zhang, Z. Carbon emissions in China׳s cement industry: A sector and policy analysis. Renewable Sustainable Energy Rev. 2016, 58, 1387–1394. [Google Scholar] [CrossRef]
  44. Intergovernmental Panel on Climate Change. 2006 IPCC Guidelines for National Greenhouse Gas Inventories; Institute for Global Environmental Strategies: Hayama, Japan, 2006.
  45. National Development and Reform Commission. Greenhouse Gas Emission Accounting Method and Reporting Guidelines for Chinese Cement Production Enterprises (Trial). Available online: https://www.ndrc.gov.cn/xxgk/zcfb/tz/201311/W020190905508186941483.pdf (accessed on 27 October 2022).
  46. Witt, T.; Dumeier, M.; Geldermann, J. Combining scenario planning, energy system analysis, and multi-criteria analysis to develop and evaluate energy scenarios. J. Cleaner Prod. 2020, 242, 118414. [Google Scholar] [CrossRef]
  47. National Bureau of Statistics. China Statistical Yearbook on Construction; China Statistics Press: Beijing, China, 2021.
  48. Liu, S.; Gao, Q.; Fu, J. Analysis of China’s main cement application fields and forecast of future demand trends. Dev. Guide Build. Mater. 2012, 10, 17–19. (In Chinese) [Google Scholar]
  49. Chen, M.; Ye, C.; Zhou, Y. Comments on Mulligan’s “Revisiting the urbanization curve”. Cities 2014, 41, S54–S56. [Google Scholar] [CrossRef]
  50. Liu, Q.; Liu, L.; Liu, X.; Li, S.; Liu, G. Building stock dynamics and the impact of construction bubble and bust on employment in China. J. Ind. Ecol. 2021, 25, 1631–1643. [Google Scholar] [CrossRef]
  51. Hong, L.; Zhou, N.; Feng, W.; Khanna, N.; Fridley, D.; Zhao, Y.; Sandholt, K. Building stock dynamics and its impacts on materials and energy demand in China. Energy Policy 2016, 94, 47–55. [Google Scholar] [CrossRef]
  52. Cui, S.; Liu, W. Analysis of CO2 emission mitigation potential in cement producing processes. China Cem. 2008, 4, 57–59. (In Chinese) [Google Scholar]
  53. Li, C.; Nie, Z.; Cui, S.; Gong, X.; Wang, Z.; Meng, X. The life cycle inventory study of cement manufacture in China. J. Cleaner Prod. 2014, 72, 204–211. [Google Scholar] [CrossRef]
  54. Chen, W.; Hong, J.; Xu, C. Pollutants generated by cement production in China, their impacts, and the potential for environmental improvement. J. Cleaner Prod. 2015, 103, 61–69. [Google Scholar] [CrossRef]
  55. Nie, S.; Zhou, J.; Yang, F.; Lan, M.; Li, J.; Zhang, Z.; Chen, Z.; Xu, M.; Li, H.; Sanjayan, J.G. Analysis of theoretical carbon dioxide emissions from cement production: Methodology and application. J. Cleaner Prod. 2022, 334, 130270. [Google Scholar] [CrossRef]
  56. National Development and Reform Commission. National Key Energy-Saving and Low-Carbon Technology Promotion Catalog (2017, Energy Saving Part). Available online: https://www.ndrc.gov.cn/?code=&state=123 (accessed on 12 March 2022).
  57. Ministry of Industry and Information Technology of the People’s Republic of China. National Industrial Energy Efficiency Technology Application Guidelines and Cases (2020). Available online: https://www.ndrc.gov.cn/?code=&state=123 (accessed on 15 March 2022).
  58. Ministry of Industry and Information Technology of the People’s Republic of China. National Industrial Energy-Saving Technology and Equipment Recommended Directory (2020). Available online: https://www.ndrc.gov.cn/?code=&state=123 (accessed on 12 March 2022).
  59. Hasanbeigi, A.; Morrow, W.; Masanet, E.; Sathaye, J.; Xu, T. Energy efficiency improvement and CO2 emission reduction opportunities in the cement industry in China. Energy Policy 2013, 57, 287–297. [Google Scholar] [CrossRef]
  60. Zhang, S.; Worrell, E.; Crijns-Graus, W. Evaluating co-benefits of energy efficiency and air pollution abatement in China’s cement industry. Appl. Energy 2015, 147, 192–213. [Google Scholar] [CrossRef]
  61. Doh Dinga, C.; Wen, Z. Many-objective optimization of energy conservation and emission reduction in China’s cement industry. Appl. Energy 2021, 304, 117714. [Google Scholar] [CrossRef]
Figure 1. Cement demand in Shandong Province under different scenarios from 2020 to 2035.
Atmosphere 14 00267 g001
Figure 2. Per capita cement demand in Shandong Province under different scenarios.
Atmosphere 14 00267 g002
Figure 3. Energy consumption of cement industry in Shandong Province from 2020 to 2035.
Atmosphere 14 00267 g003
Figure 4. Energy intensity of cement industry in Shandong Province from 2020 to 2035.
Atmosphere 14 00267 g004
Figure 5. CO2 emissions of cement industry in Shandong Province from 2020 to 2035.
Atmosphere 14 00267 g005
Figure 6. Carbon intensity of cement industry in Shandong Province from 2020 to 2035.
Atmosphere 14 00267 g006
Figure 7. The 2020–2035 Shandong cement industry low-carbon technology roadmap.
Atmosphere 14 00267 g007
Table 1. Average annual natural population growth rate of Shandong Province from 2020 to 2035.
Scenario2021–20252026–20302031–2035
LD0.27%0.17%0.15%
MD0.3%0.2%0.18%
HD0.35%0.25%0.22%
Table 2. The urbanization rate of Shandong Province under different scenarios from 2020 to 2035.
Scenario202520302035
LD67%70%73%
MD68%72%75%
HD69%75%78%
Table 3. Growth rate of construction area in Shandong Province from 2020 to 2035.
Building TypeScenario202520302035
RuralLD7%4.5%3.7%
MD7.5%5%4%
HD8%5.5%4.3%
UrbanLD7.5%5%4%
MD8%5.5%4.3%
HD8.5%6%4.6%
CommercialLD−1.8%−2.1%−2.3%
MD−1.5%−1.8%−2%
HD−1.2%−1.5%−1.7%
Table 4. Growth rate of highway and railway mileage in Shandong Province from 2020 to 2035.
TypeScenario202520302035
HighwayLD3%2.5%2%
MD3.5%3%2.5%
HD5%4%3.5%
RailwayLD20%14%7%
MD25%17%10%
HD30%20%13%
Table 5. Growth rate of industrial fixed asset investment in Shandong Province from 2020 to 2035.
Scenario202520302035
LD6%5%4%
MD8%6.5%5.5%
HD10%8%7%
Table 6. Cement industry transportation substance list.
TypeSubstanceMaterial Mass (t/tc)Transportation
Mileage (km)
Resourcelimestone1.1510
sandstone0.05530
iron slag0.01530
plaster0.0560
waste mineral admixture0.250
Energycoal0.14350
Productcement1300
Note: The data comes from Shen et al. [26], Li et al. [53], and Chen et al. [54].
Table 7. Relevant parameters of low-carbon technical measures in the cement industry.
MeasureNumberEnergy Saving
kgce/tcl
Electricity Saving
kWh/tcl
Penetration Rate (%)
2020202520302035
External circulation raw meal vertical mill technologyN1/7.003.010.015.020.0
Ball mill + high pressure roller press for cement grindingN2/10.0025.037.550.070.0
High efficiency motorsN3/4.5840.050.060.070.0
Precalcination with high solid to gas ratioN416.00/3.010.020.035.0
Upgrading the preheater from 5 to 6 stagesN53.75−1.175.012.520.035.0
Low thermal conductivity multi-layer composite mullite brickN61.134.8110.020.030.040.0
New cement clinker cooling technology and equipmentN72.812.575.020.035.055.0
Cement clinker firing system optimization technologyN87.23/8.023.038.053.0
Coprocessing of municipal solid waste in cement kilnsN94.65−4.002.08.015.022.0
Low temperature waste heat recovery for power generationN10/35.0066.075.085.0100
Utilization of steel slag as an alternative raw material for cement productionN1161.80/4.04.55.36.5
Production of cement clinker by using iron ore tailings instead of iron powderN1221.30/1.01.21.52.0
Production of cement clinker using fly ash instead of clayN1315.10/5.05.76.57.5
Energy-saving monitoring and optimization system technologyN148.226.323.010.017.025.0
Visual energy management systemN15/16.475.010.015.020.0
Disclaimer/Publisher’s Note: The statements, opinions and data contained in all publications are solely those of the individual author(s) and contributor(s) and not of MDPI and/or the editor(s). MDPI and/or the editor(s) disclaim responsibility for any injury to people or property resulting from any ideas, methods, instructions or products referred to in the content.

