1. Introduction
Recent years have seen the rapid development of China’s metro system. A total of 289 urban rail lines were put into operation in 52 cities on the mainland in 2022, according to statistics provided by Journal of China Metro, adding 1004.51 kilometers of new rail transit and 616 stations. Among the main system equipment of rail transit, which includes vehicles, the traction power supply system, etc., the energy consumption of trains accounts for approximately 50–60% of the total energy consumption, and the energy consumption of the train auxiliary system accounts for approximately 30–40% of the total energy consumption, of which the energy consumption of the air-conditioning system accounts for a large amount of the auxiliary system’s energy consumption. For this reason, saving energy from the air-conditioning system is one of the most important aspects of saving energy from the operation of a vehicle. Furthermore, the heat and humidity inside the car are also of concern. According to the change in passenger capacity, the temperature of the subway air-conditioning system is controlled [
1]. The frequency conversion air-conditioning system is also used in subway systems [
2], which has the effect of reducing energy consumption. These control methods, however, suffer from a number of shortcomings, since they do not take into account the volume of the air supply. The paper discusses the changes in air-supply volume and temperature with passenger load in order to achieve energy savings for the fan as well as improving the thermal comfort of the human body.
Over the past few years, subway passengers have frequently complained about the internal heat and cold of the system. Currently, the subway air-conditioning system has a critical problem, which represents the rapid change in passenger capacity. As a result, the interior of the subway becomes overheated, over-cooled, unevenly distributed in temperature, and has the sensation of being blown cold [
3]. In addition to causing great discomfort to passengers, this also increases the air conditioning’s energy consumption.
Evidently, there is a reason for this, as the air supply and temperature-control methods currently used in subway trains in China are largely based on the relevant standards of European or railroad coaches. The control temperature inside the train is determined by the outdoor temperature [
4,
5,
6,
7], while the air-supply volume is mostly determined by the rated air-supply volume or the wind-speed limit based on the model [
7,
8,
9], without taking into account the influence of passenger capacity on air-supply volume and control temperature.
Accordingly, this paper considers the passenger capacity and combined it with the PMV to conduct a theoretical study of air-supply volume and temperature control in the subway compartment. The purpose of Chapter 2 is to introduce the PMV theory and the research idea of this paper. A theoretical calculation is presented in the third chapter for calculating the minimum critical air-supply curve for different passenger capacities, taking into account that cold and wet load requirements as well as fresh-air volume requirements must be met in the vehicle’s air-supply system. Through numerical simulation, the PMV distribution in the passenger compartment is simulated under different passenger capacities and air-supply conditions. It has been determined that volume control of the air supply alone cannot provide thermal comfort for the human body. Based on the PMV theoretical formula, the multiple linear regression method is used in the fourth chapter to fit the temperature-control curves under different passenger capacities. According to standard EN 14750, the uniformity of the flow and temperature fields of the passenger compartment is validated for a given air-supply volume in the fifth chapter.
2. PMV Theory and Research Ideas of the Paper
For the thermal-comfort-evaluation indicators
PMV and
PPD, Fanger proposed the following equations.
where
M represents the metabolic rate, W/M;
W represents the mechanical work, W/m;
Pa represents the water vapor partial pressure, Pa;
fcl represents the clothing thermal resistance, clo;
ta represents the air temperature, °C;
tr represents the average radiation temperature, °C;
hc represents the convective-heat-transfer coefficient, W/(m
2 K); and
tcl represents the clothing surface temperature, °C.
When calculating the air-supply volume for subway trains, it is necessary to consider the air-supply volume in the car. This volume must meet the requirements for cold and wet loads as well as fresh-air volume when the air-supply temperature is 19°C. A theoretical calculation as well as the air-supply volume curve that meets thermal-comfort requirements have been used to calculate the minimum air-supply volume curve for a variety of passenger capacities (PMV between ±0.5). To ensure that the air-supply volume of air conditioning meets both hot and wet loads as well as thermal comfort, it is necessary to combine the two air-supply volume curves. A temperature-control system is based on Fanger’s PMV theory, which has been discussed above. In the PMV formula, the clothing thermal resistance will be affected by the outside temperature of the vehicle and the radiation temperature will vary depending on different passenger capacities. Therefore, for different passenger capacities, the air-supply speed must be adjusted to fit the binary primary temperature-control curve relating to passenger capacity and the outside temperature by controlling PMV = 0. Finally, in order to assess the uniformity of the flow field under the air-supply curve, simulations are performed for each passenger-capacity condition under the air-supply curve and a comparison of temperature and velocity fields is conducted.
3. Air-Supply-Volume Calculation for the Passenger Compartment
3.1. Minimum Air-Supply Curve Based on the Requirement for the Cooling and Fresh-Air Volume
Taking into account the provisions of CJ/T354-2010 regarding air-conditioning units, it is recommended that the passenger-compartment temperature should be less than or equal to 27 °C when the ambient temperature is 33 °C. In addition, the relative humidity is less than or equal to 65% of the required value for solving the critical air-supply volume [
4]. A wet-air enthalpy and humidity diagram is used to calculate the air-supply volume. A line is drawn parallel to the heat and humidity ratio line, using the indoor state point as a base point. This line intersects with the line of air-supply temperature of 19 °C [
10], which is the point of ventilation. As a result, the air in the subway is processed to this state, which ensures the requirement of 27 °C and 65%.
Table 1,
Table 2 and
Table 3 provide a summary of the relevant calculation parameters.
According to
Table 4, the minimum critical air-supply volume has been calculated based on the requirements for cold and wet loads as well as fresh-air volume under the given four passenger capacities.
The BC section can be fitted in
Figure 1 according to the data in
Table 4. In other words, when the number of people ranges from 60 to 176, the minimum critical air-supply volume curve is taken as the final air-supply volume curve in order to achieve energy efficiency. If the number of people ranges from 176 to 351, then the air-supply volume has reached the rated upper limit of 8000 m
3/h when the B-vehicle’s rated air-supply volume is 8000 m
3/h. The air-supply volume is taken as a fixed value of 3795 m
3/h when the number of people is 0 to 60. According to
Figure 1, ABCD, the air-supply volume curve, is composed of three segments based on the cold and wet loads and the fresh-air volume. In this case,
N represents the capacity for passengers.
Q represents the volume of air that is supplied, in m
3/h.
3.2. PMV Calculation for the Passenger Compartment
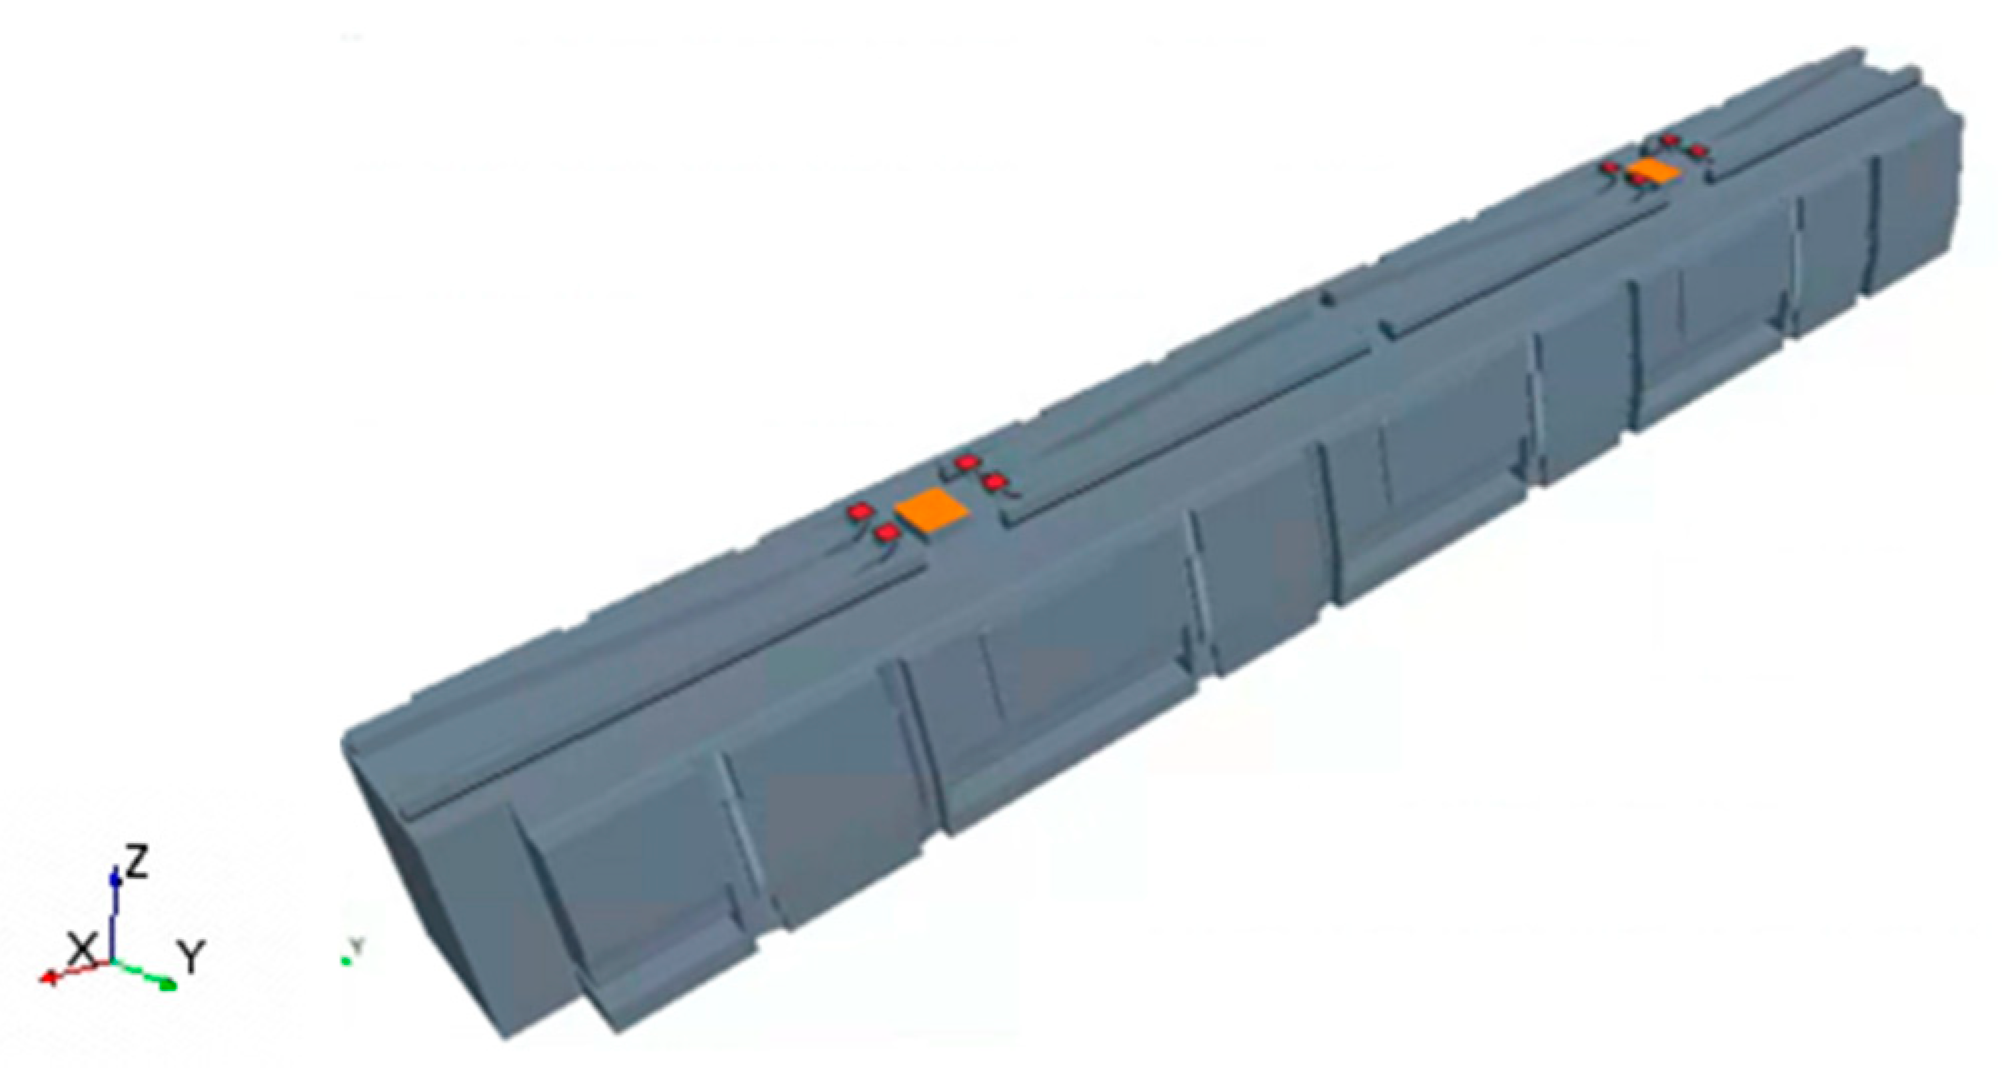
For the B-vehicle, CFD calculation software was used to simulate the PMV of the passenger compartment with different passenger capacities and air-supply volumes. An air duct and passenger compartment model, measuring 19 meters long, 2.6 meters wide, and 2.1 meters high, with 40 seats, was used to establish the geometric model. The air-conditioning units were equipped with four air-supply outlets and one air-return outlet. The static pressure chamber of each air duct is fed by each air-supply outlet. One carriage has a rated air-supply volume of 8000 m
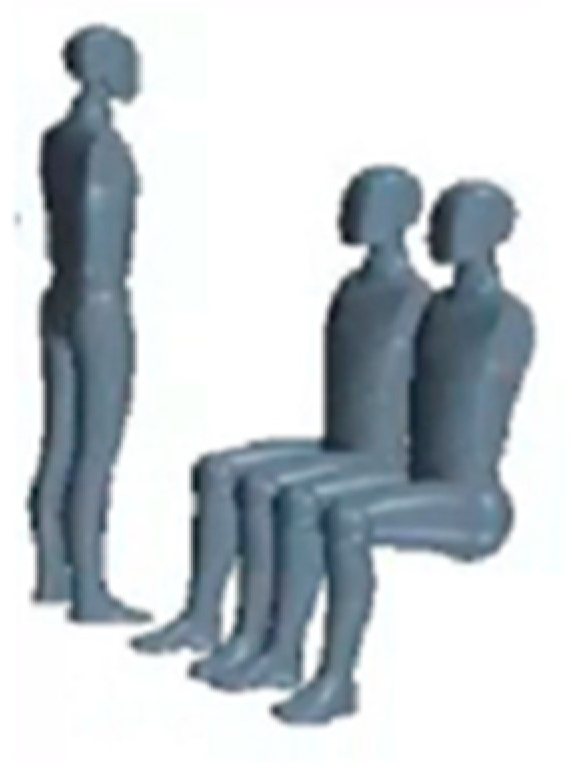
3/h, which is distributed equally among eight air-supply outlets. Since the internal structure of the compartment body is complex, the simulation model must ignore some of the structural details of the car body. Instead, it must focus on restoring the structural features that affect airflow and other structural factors. The geometric model of the unloaded carriage is shown in
Figure 2, while the human-body model is shown in
Figure 3.
3.2.1. Grid Division and Boundary Setting
On the human body and carriage wall, the grid was divided into five prismatic layers, which can better represent the fluid characteristics in the near-wall layer. Other areas were divided into cut-body grids. For the air supply and return ducts, grilles, human body intervals, etc., a polyhedral mesh was used with a global grid size of 50 mm and a minimum grid size of 2.5 mm. The number of grids reached 30 million. According to the paper, the turbulence model applied is the standard k-epsilon model. In engineering applications, this model has been verified with a number of experiments, and the accuracy of this model has been established as reliable.
Inlet boundary: the boundary of the calculation domain simulation was set as a velocity inlet, and the velocity value was determined based on the volume of the air supply.
Exit boundary: in the passenger compartment, the return-air outlet and exhaust-air outlet were set as the pressure export boundary, and the static pressure of the export boundary was set to 0 Pa.
Heat boundary: the passenger surface temperature was set to 36.5 °C, and the air-supply temperature was set to 19 °C.
3.2.2. Simulation of Several Working Conditions and PMV Data
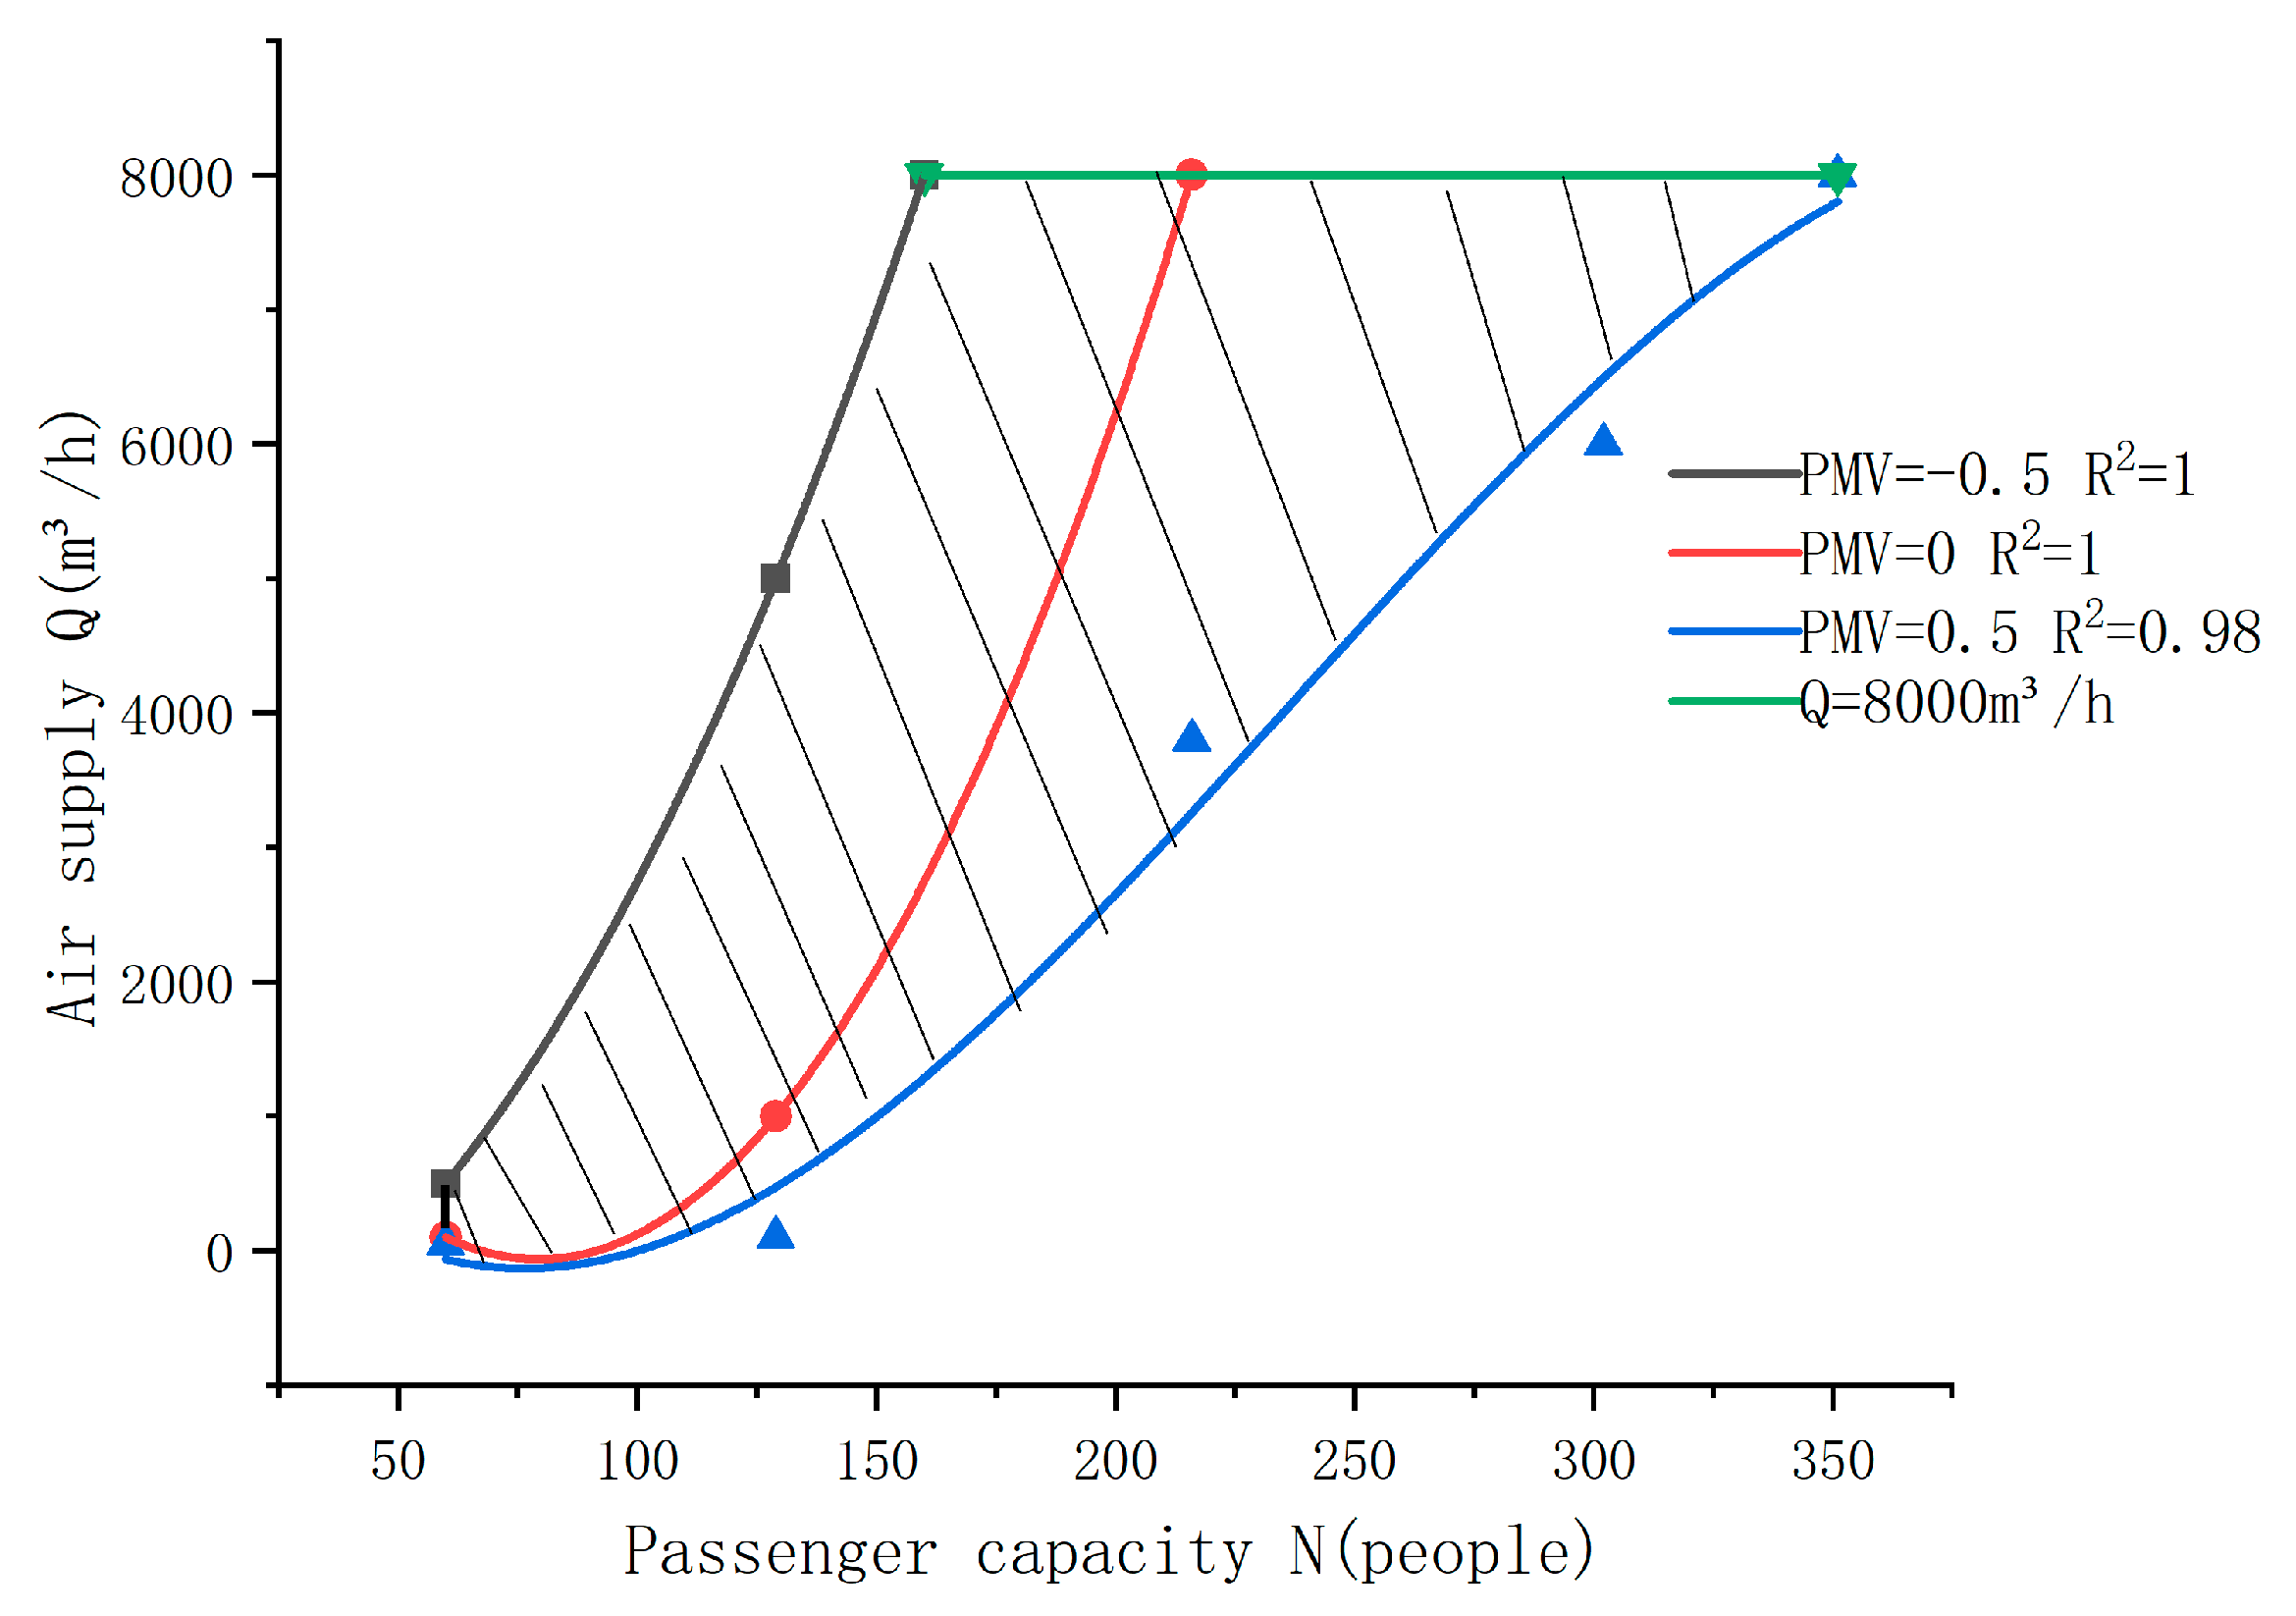
Based on the calculation of several models established for different passenger-capacity conditions under different air-supply volumes, the air-supply volume curve shown in
Table 5 may be calculated to reach the ISO standard [
12] for human-thermal-comfort index PMV (−0.5, 0.5) around people (1.1 m cross-sectional height). Specifically, the shaded area in
Figure 4 represents the range of air-supply volumes that can meet the PMV between ±0.5 under different passenger capacities.
3.3. Air-Supply Curves Based on Thermal Comfort with Cooling and the Fresh-Air Volume
Figure 1 shows the air-supply-volume curve based on cooling and fresh-air volume, while
Figure 4 shows the air-supply-volume variation curve based on thermal comfort. Using
Figure 1 and
Figure 4, we obtain
Figure 5, in which only the shaded areas indicate the air-supply volume, which meets both the PMV between (−0.5, 0.5) and the cooling and fresh-air volume requirements. As a result, regulating the air-supply volume alone cannot provide a state of thermal-comfort PMV = 0 for the human body.
4. The Temperature-Control Curve
From the previous discussion, it can be seen that merely regulating the air-supply volume cannot achieve a thermal-comfort PMV = 0 for the human body at the given air-supply temperature of 19 °C. As a result, Fanger’s PMV theory was used in order to provide the regulation measures for controlling the temperature. Consequently, it is possible to meet the human body’s thermal-comfort requirements when the subway train has a variety of passenger capacities and air-supply speeds.
4.1. Analysis Methods of the Subway Train Temperature-Control Model
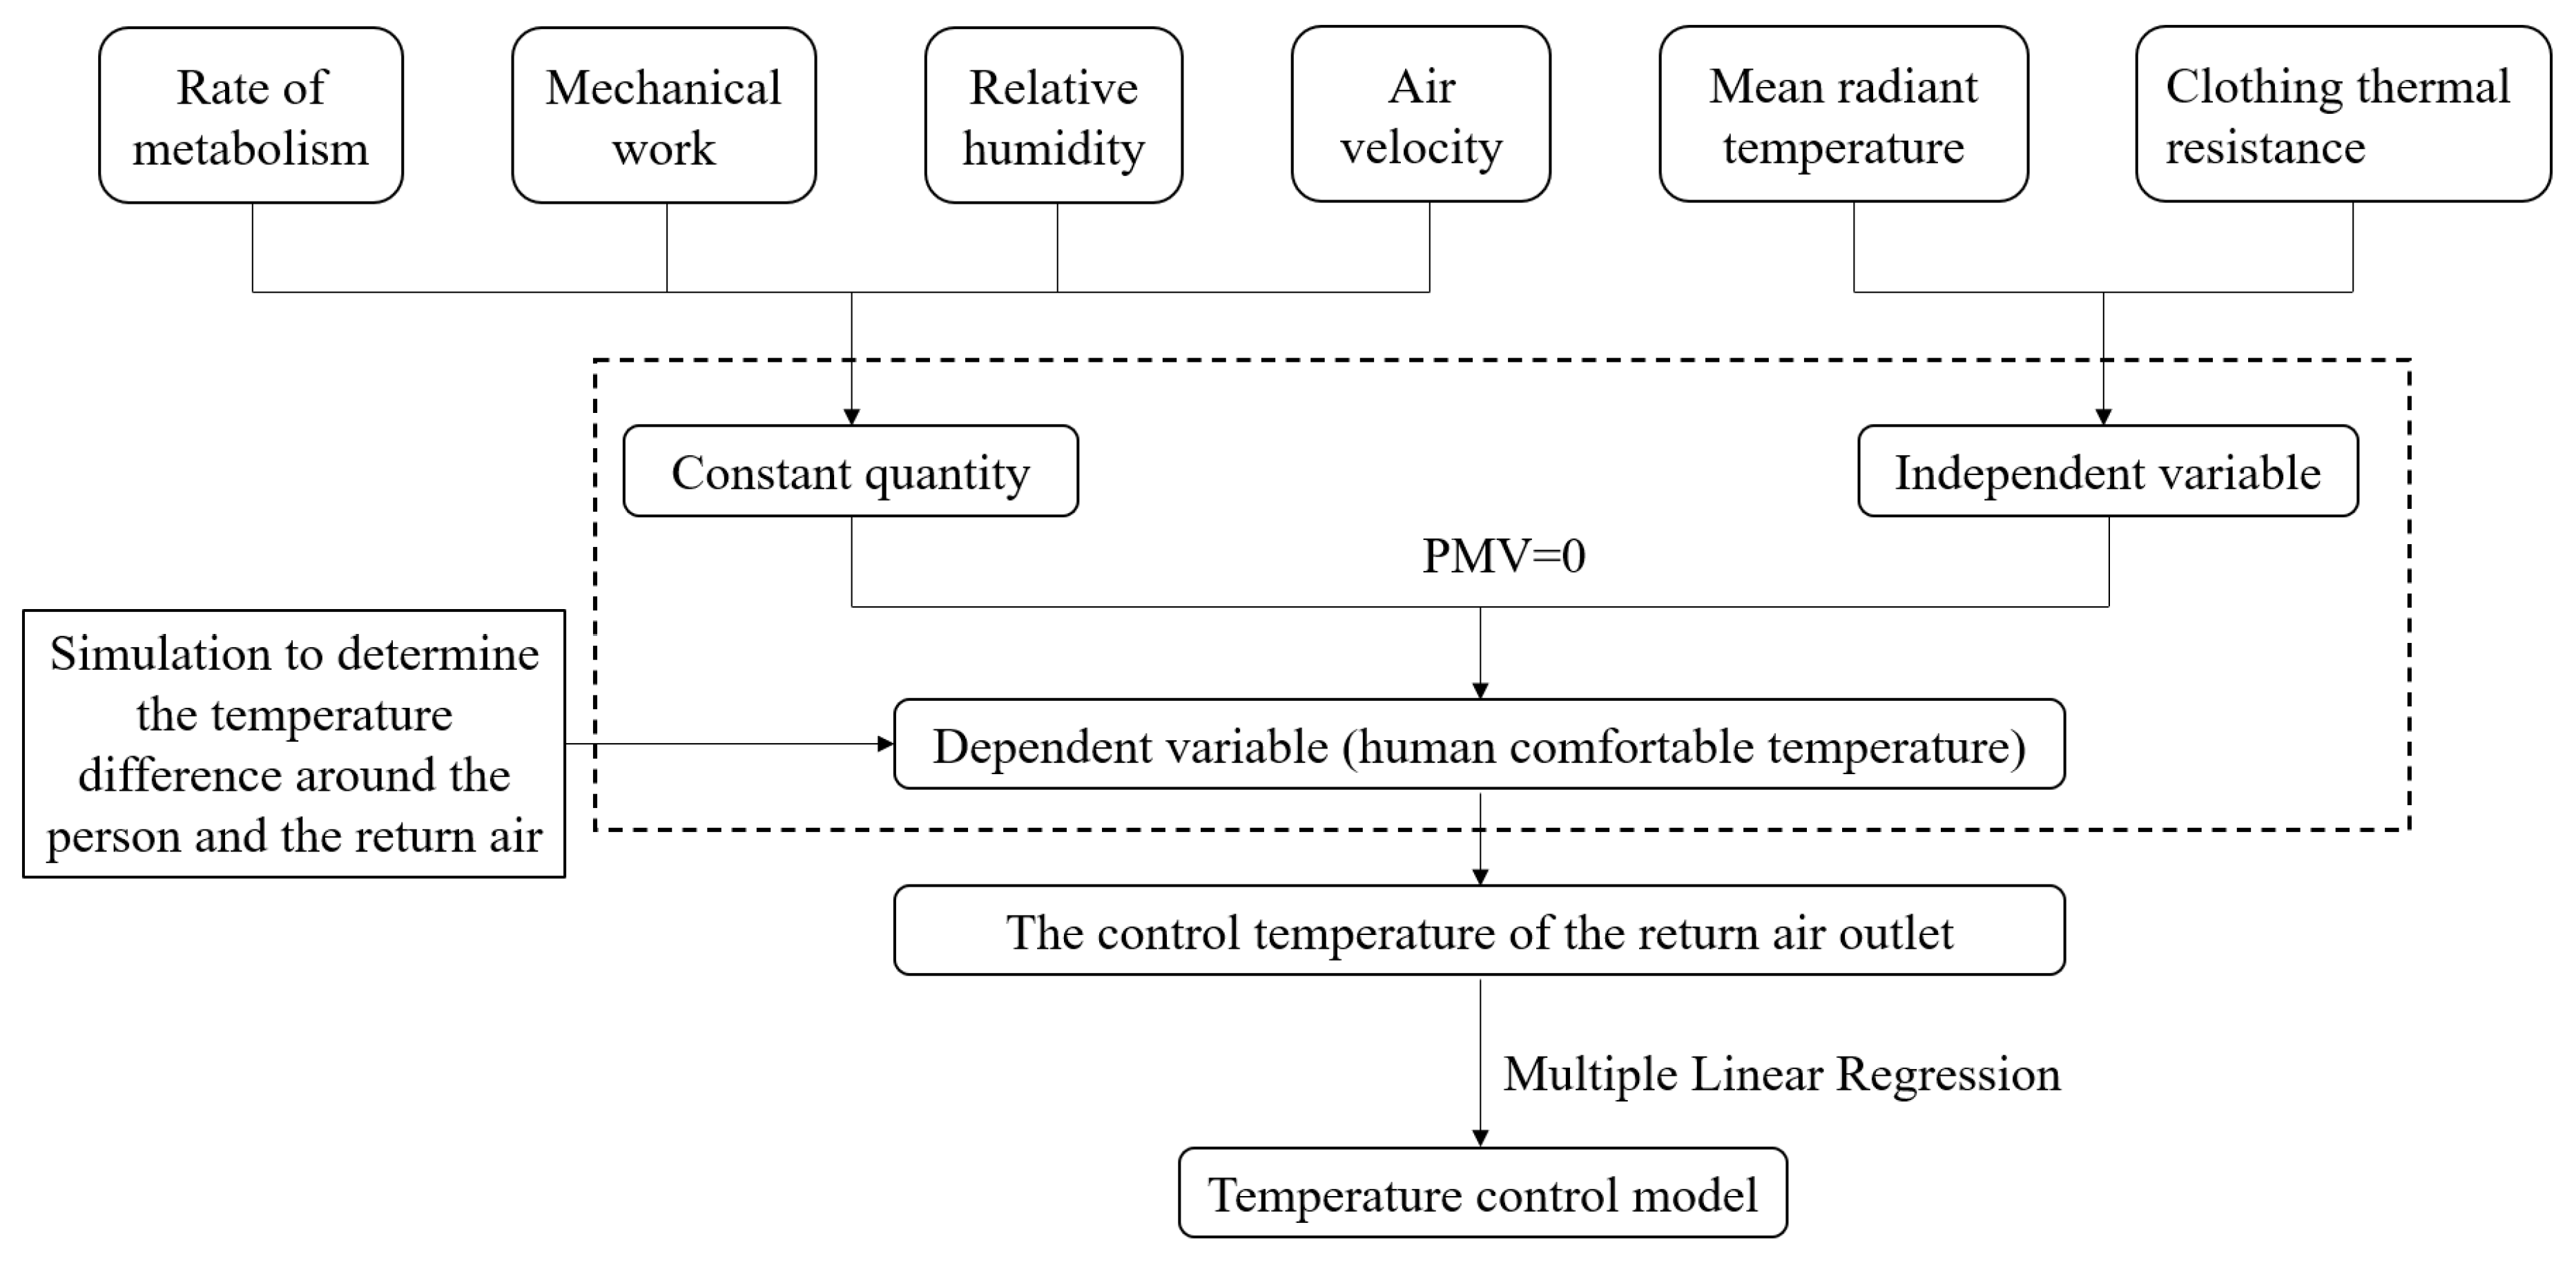
In
Figure 6, the research method for the subway train temperature-control model is described. According to Fanger’s theory and the influencing factors of the PMV index, the human metabolic rate is
M, the mechanical work performed by the human body is
W, the average radiation temperature is
tr, the air temperature is
ta, the relative air humidity is
φ, and the air-flow rate is
v. The average radiation temperature inside the subway is influenced by the passenger capacity. The temperature of the wall inside the subway and the thermal resistance of clothing are influenced by the temperature outside the car. These variables are taken as independent variables in the control model. The other influencing factors are constant parameters. The temperature of the air for human thermal comfort can be obtained by controlling PMV = 0 [
13]. As a result, the actual regulation is based on the deviation of the return-air temperature from the set value. In light of the simulation results, it is also necessary to correct the temperature difference between the 1.1m section and the return air. Finally, multiple linear regression was used to obtain the temperature-control curve for the return air inside the subway.
According to
Table 6, the average radiation temperature is related to the passenger capacity. In addition, the relationship between the clothing thermal resistance
fcl and the temperature outside the vehicle
tout is
.
4.2. Fitting Results of the Temperature-Control Curve
The metabolic rate of the human body inside the vehicle is 74 W/m2. The mechanical work performed by the human body is 0 W/m2. In the vehicle, there is a relative humidity of 65%. In accordance with the above method, for different passenger capacities and outside temperatures, the optimal control temperature is calculated at PMV = 0. Using multiple linear regression, the binary primary temperature-control curve was fitted to the passenger capacity and the outside temperature.
In cases where N is greater than 0 but less than 60 people, Q = 3795 m
3/h. For field verification, the air-flow rate was set to 0.1 m/s, and an optimal control temperature was obtained by controlling PMV = 0 as shown in
Table 7.
Multiple linear regression was used to fit the temperature-control curve based on the calculated data.
In cases where N is greater than or equal to 60 but less than 176.
The temperature-control curve was further fitted using the air-supply volume control curve. Due to the fact that the air-supply volume in this section varies in relation to the passenger capacity, it was also necessary to adjust the air-flow rate accordingly as passenger capacity changes. Therefore, it was necessary to calculate the optimal control temperature based on the different passenger capacities and the corresponding air-flow rate and the optimal control temperature, as shown in
Table 8. Based on the series of {
tin}, {
tout}, {
N}, and {
Q} values, we fit the temperature-control curve using multiple linear regression.
In Cases where N is greater than or equal to 176 but less than 351, Q = 8000 m
3/h. According to
Table 9, the optimal control temperature was obtained by controlling PMV = 0 with a flow rate of 0.3 m/s.
Based on the calculated data, the temperature-control curve was fitted using multiple linear regression.
As shown in
Figure 7, if the three control temperatures are integrated, the control temperature decreases linearly with increased passenger capacity, and increases linearly with increased outdoor temperature.
5. Passenger Compartment Flow and Temperature Field Evaluation
For the purpose of further verifying the uniformity of the flow field under the air-supply profile, a series of simulations were performed for each condition of passenger capacity under the air-supply profile. According to EN14750, the temperature and velocity fields of the passenger compartment were analyzed and evaluated [
5].
5.1. The Measurement-Point Arrangement and Evaluation Method
The layout of the measurement point is shown in
Figure 8. In total, three measurement points are located at 0.1 m, nine measurement points at 1.1 m, and three measurement points at 1.7 m. The measurement points L1-L2 are located at 0.1 m, where N = 1,2,3. At 1.1 meters, L2-N are arranged, where N is 1, 2, ..., 9. L3-N are located at a height of 1.7 m, where N is 1, 2, 3.
In accordance with the standard EN14750, the passenger compartment’s temperature uniformity and air-speed uniformity were evaluated. The resulting evaluation indexes are listed below.
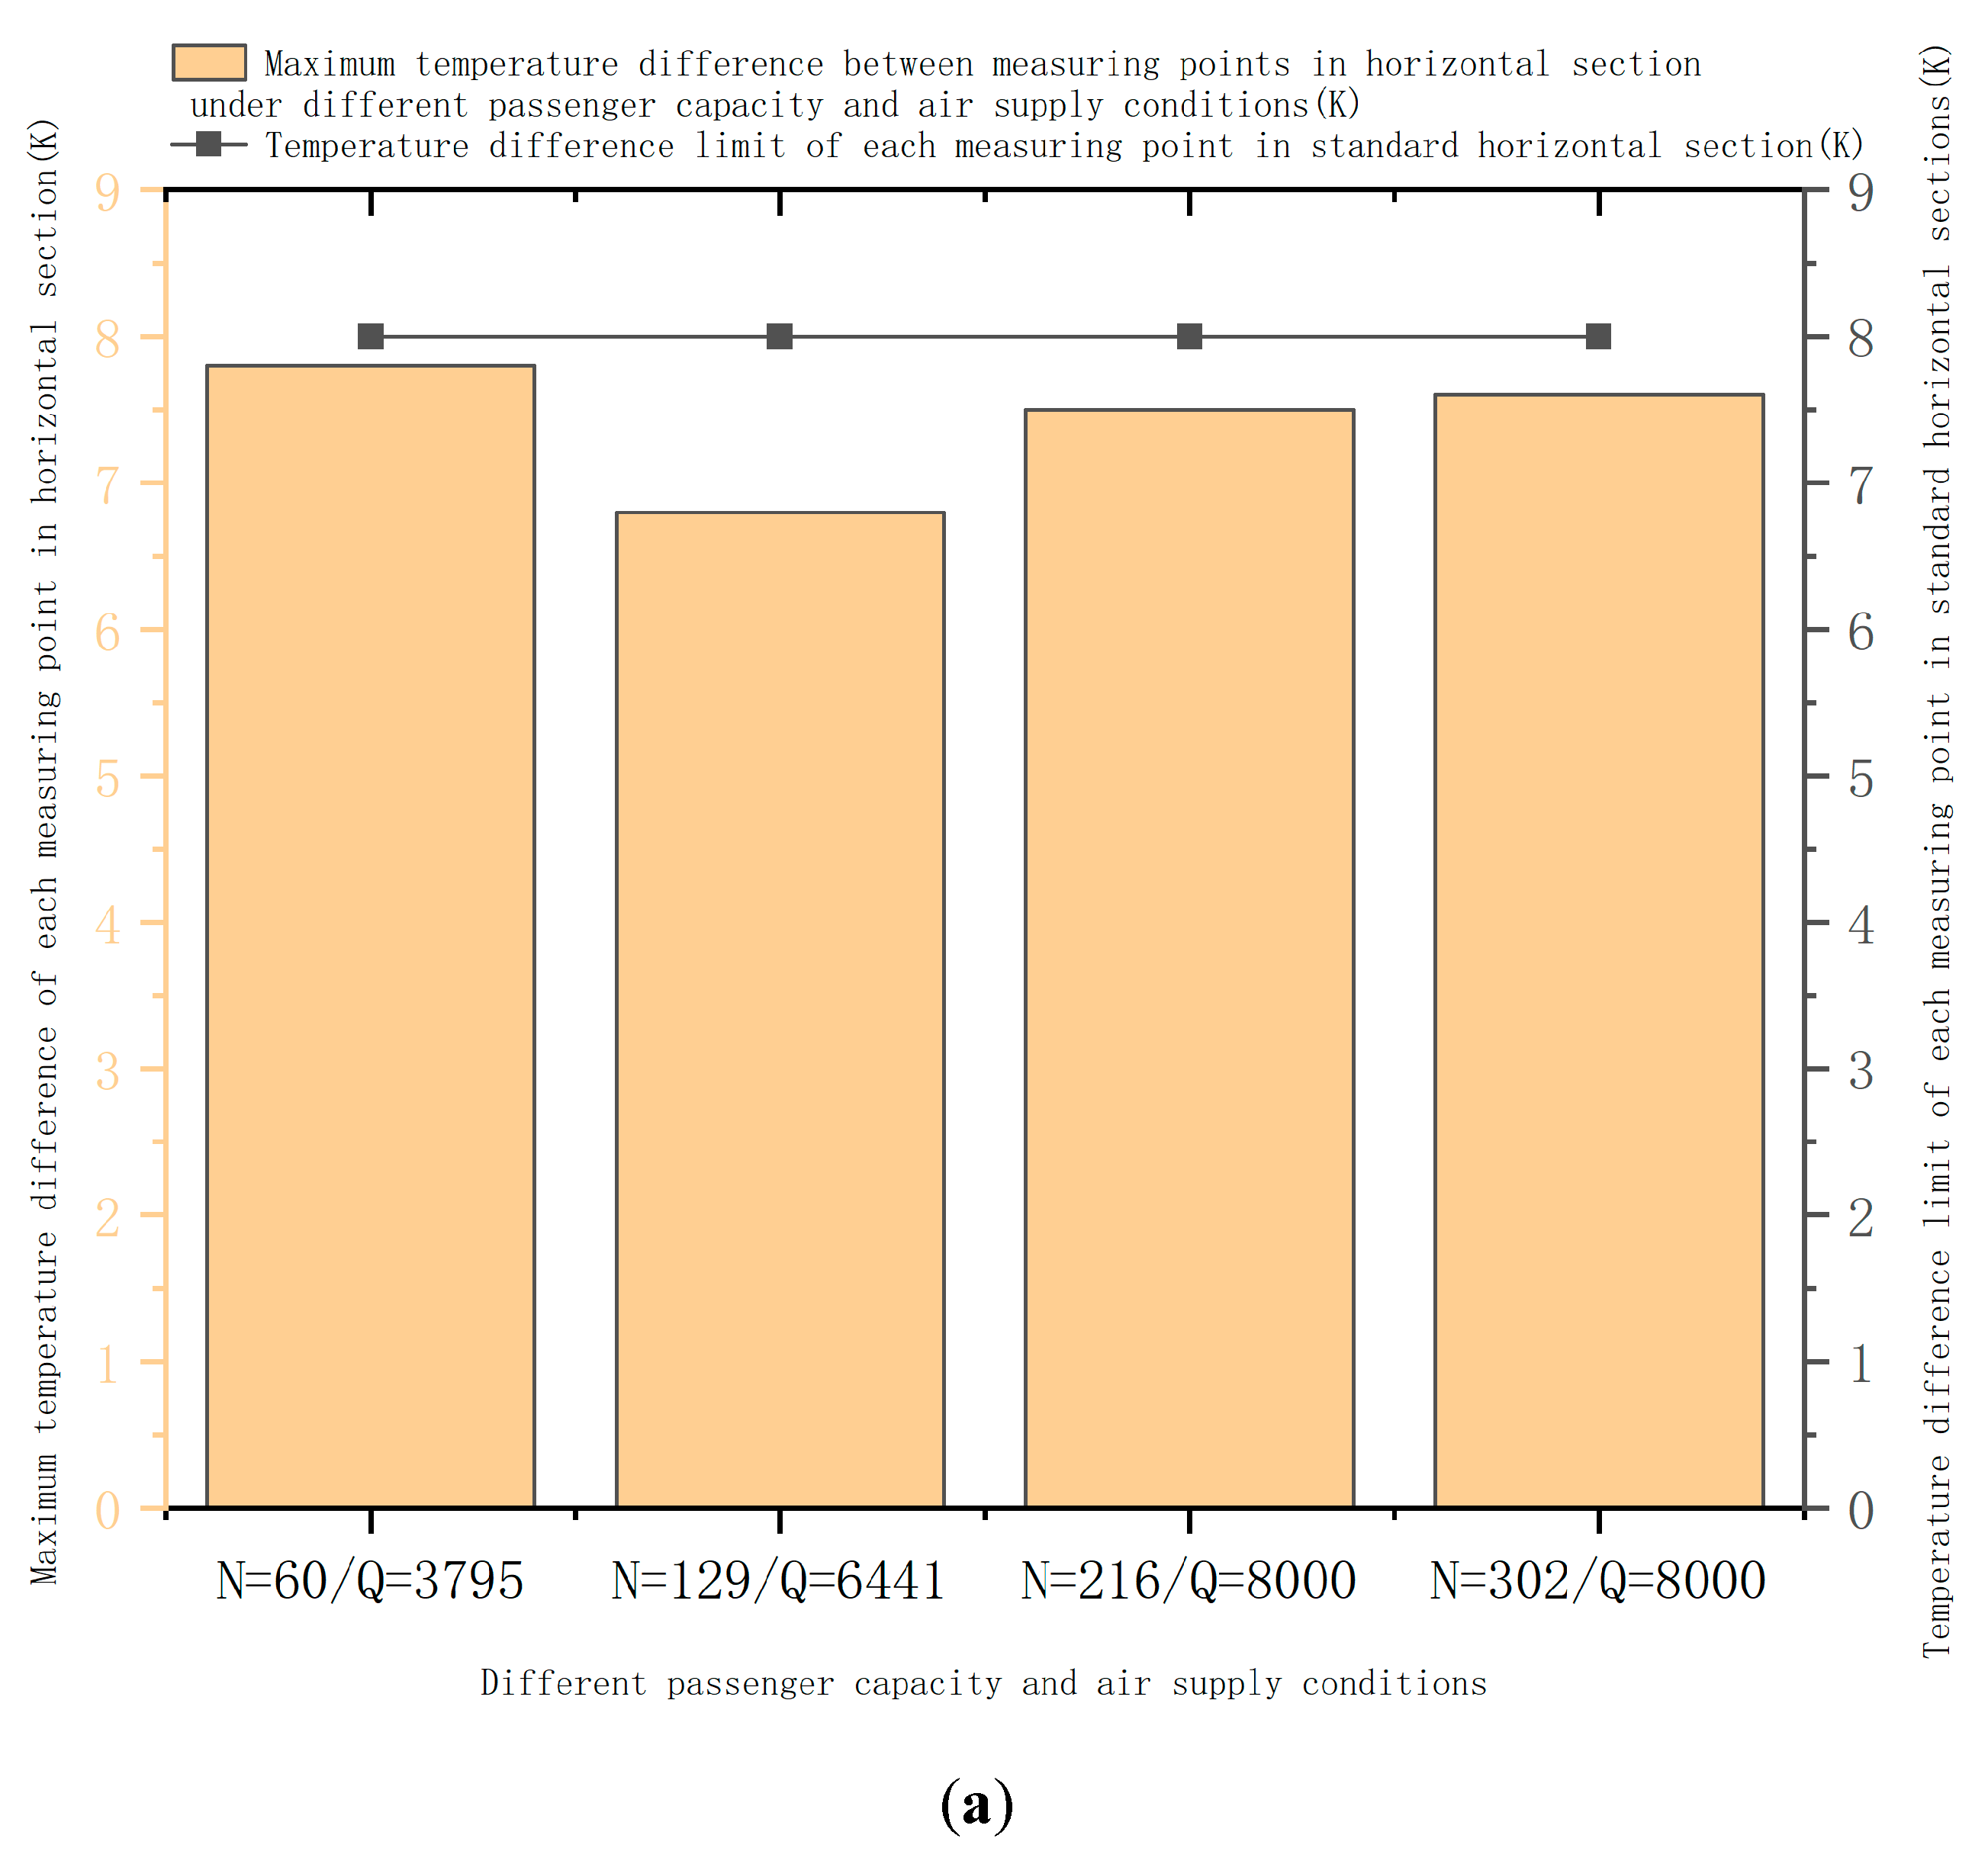
Difference in temperature of the horizontal section: a temperature difference of less than 8K should be observed at each measurement point at 1.1 m above the ground.
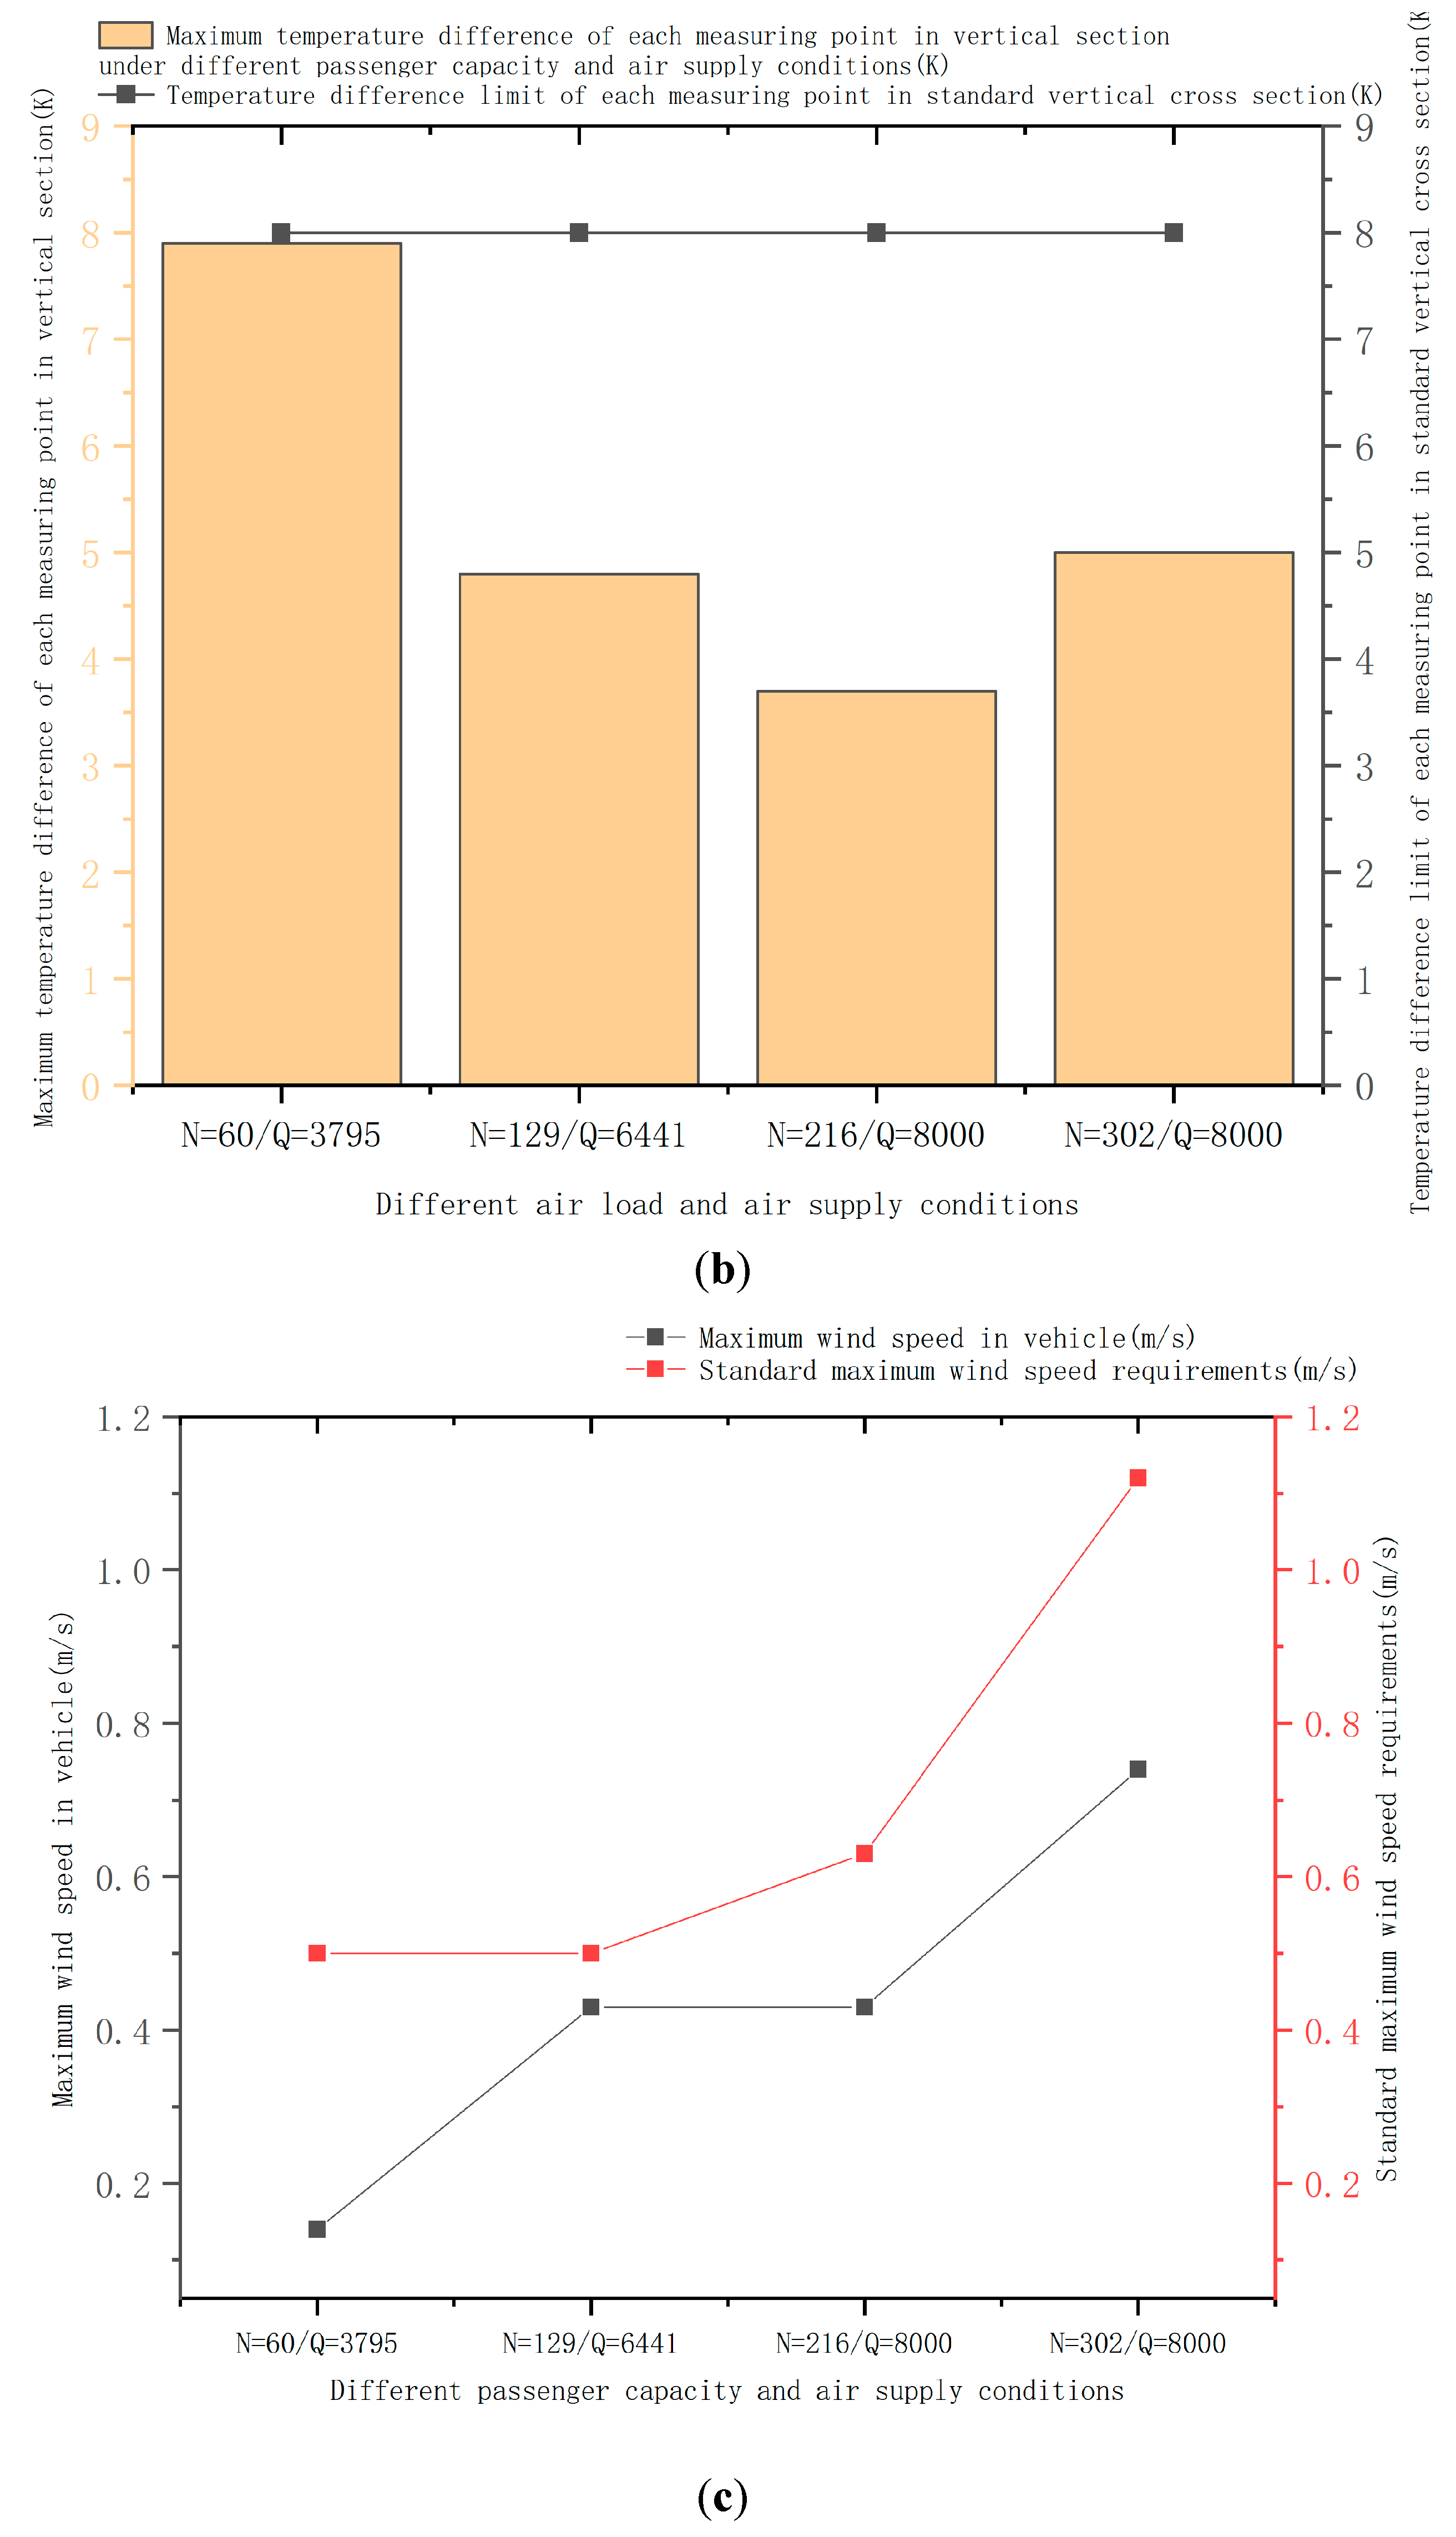
Vertical-section temperature difference: it is necessary to maintain a maximum temperature difference of less than 8K at each measurement point in the vertical direction.
Wind-speed requirement: The wind-speed value of each measurement point inside a compartment cannot exceed the maximum wind-speed requirements specified by Appendix B [
3] of EN14750-1.
5.2. Analysis of Simulation Results for Passenger Compartments
Figure 9 illustrates the temperature field and velocity field data of the passenger compartment based on simulation calculations. According to the analysis of the data, the maximum temperature difference between horizontal and vertical sections at each measurement point is less than 8K, while the maximum wind speed inside the vehicle does not exceed the EN14750-1 maximum-wind-speed requirement. Thus, the uniformity of the flow field within the passenger compartment meets the requirements of the standard under each condition of operation of the air-supply system.
6. Conclusions
The objective of this study was to determine the air-supply volume and temperature-control curve of subway trains. First, a theoretical calculation was performed to determine the minimum critical air-supply volume curve under different passenger capacities in order to account for cold and wet load requirements, in addition to fresh-air-volume requirements. Second, the numerical simulation method was used to calculate the PMV distribution under a variety of passenger capacities and air-supply volumes. It was found that controlling the air-supply volume alone was not sufficient to produce the state of thermal comfort that corresponds to PMV = 0 in the human body. According to the PMV theory formula, multiple linear regression was used to fit the temperature-control curve under different passenger capacities. Based on the simulation calculation of the passenger compartment, the uniformity of the flow field and temperature field in the passenger compartment was evaluated in accordance with EN14750. Under all air-supply conditions, the uniformity of the flow and temperature field met the requirements of the standard, which indicates that this research method is accurate and may be used to guide the design calculations of similar practical projects in the future.
Table 10 shows the governing equation for the volume of air supply and temperature of the air conditioners in subway trains that have a passenger capacity.
As a result of the control curve proposed in this paper for air-supply volume and temperature, it becomes possible to adjust the air-supply volume and temperature in real time in response to changes in passenger capacity, improve the human body’s thermal comfort in the vehicle, and reduce air-conditioning energy consumption. During real vehicle regulation, the air volume should be regulated first according to the number of passengers, and then the temperature should be further regulated. By reducing air-supply volume and duct resistance, excessive cooling output is avoided, and fan energy consumption is reduced. The method is currently being tested for use in subways.
Author Contributions
Conceptualization, Z.L. and Y.L.; methodology, M.L.; software, M.L.; validation, M.L.; formal analysis, Z.L. and P.L.; investigation, M.L.; resources, Y.L.; data curation, M.L.; writing—original draft preparation, M.L.; writing—review and editing, M.L., P.L., Z.L. and H.L.; visualization, M.L.; supervision, Y.Z. and T.Y.; project administration, Y.L.; funding acquisition, Y.L. All authors have read and agreed to the published version of the manuscript.
Funding
This research received no external funding.
Institutional Review Board Statement
Not applicable.
Informed Consent Statement
Not applicable.
Acknowledgments
Thanks to the The State Key Laboratory of Heavy Duty AC Drive Electric Locomotive Systems Integration for providing testing conditions and technical assistance for this study.
Conflicts of Interest
The authors declare no conflict of interest.
References
- Zhang, Y. Research on Energy saving and Comfort Optimization Design of rail train air conditioning. Sci. Technol. Trend 2020, 11, 12. [Google Scholar]
- Liu, J.; Bi, L.; Zhang, X.; Wang, L.; Zhao, D. Study on Conversion Transformation and energy Saving of air conditioning in Chongqing Rail Transit Line 1. China Plant Eng. 2022, 15, 20–22. [Google Scholar]
- Wang, Y. Research on Optimization of Air Conditioning Control in Subway Cars Based on Particle Swarm Algorithm. Master’s Thesis, Shenyang Jianzhu University, Shenyang, China, 2014. [Google Scholar]
- CJ/T 354-2010; Technical Conditions for Air Conditioning, Heating and Ventilation Devices for Urban Rail Transit Vehicles. Ministry of Housing and Urban-Rural Development of the People’s Republic of China: Beijing, China, 2010.
- DIN EN14750; Railway Applications-Air Conditioning for Urban and Suburban Roiling Stock-Part1: Comfort Parameters. Deutsches Institut für Normung (DE-DIN): Berlin, Germany, 2006.
- Zhu, H.; Gao, L.; Li, J.; She, K. Comparative study on the comfort standards of rail vehicle air conditioning. Refrig. Air Cond. 2020, 20, 11–17. [Google Scholar]
- UIC 553 OR-2004; Heating, Ventilation and Air-Conditioning in Coaches. International Union of Railways (UIC): Paris, France, 2004.
- GB/T 12817-1991; General Technical Conditions for Railway Passenger Cars. Standardization Administration of the People’s Republic of China: Beijing, China, 1991.
- JT/T 216-2016; Technical Conditions of Passenger Car Air Conditioning System. Ministry of Transport of the People’s Republic of China: Beijing, China, 2016.
- Zhou, Y. Simulation Research on Air Conditioning System of Air Conditioning System in Type B Subway. Master’s Thesis, Lanzhou Jiaotong University, Lanzhou, China, 2020. [Google Scholar] [CrossRef]
- Zhang, H.; Liu, P. Calculation of air supply volume of rail vehicle air conditioning units. Technol. Mark. 2014, 21, 90–92. [Google Scholar]
- ISO7730:2005; Ergonomics of the Thermal Environment: Analytical Determination and Interpretation of Thermal Comfort Using Calculation of the PMV and PPD Indices and Local Thermal Comfort Criteria. International Standard: Geneva, Switzerland, 2005.
- Qian, Y.; Zang, J.; Wang, H. Air-conditioning temperature control model for subway trains based on passenger capacity. In Proceedings of the 2013 Annual Academic Conference of Shanghai Refrigeration Society, Shanghai, China, 7–10 April 2013; pp. 285–288. [Google Scholar]
Figure 1.
The air supply volume curve based on the cooling and fresh-air-volume requirements.
Figure 1.
The air supply volume curve based on the cooling and fresh-air-volume requirements.
Figure 2.
The integrated model of the air duct and subway train.
Figure 2.
The integrated model of the air duct and subway train.
Figure 3.
The body model.
Figure 3.
The body model.
Figure 4.
Variation curve of the air supply volume based on thermal comfort.
Figure 4.
Variation curve of the air supply volume based on thermal comfort.
Figure 5.
Air supply volume range based on cooling and fresh-air volume requirements. The shaded areas indicate the air-supply volume, which meets both the PMV between (−0.5, 0.5) and the cooling and fresh-air volume requirements.
Figure 5.
Air supply volume range based on cooling and fresh-air volume requirements. The shaded areas indicate the air-supply volume, which meets both the PMV between (−0.5, 0.5) and the cooling and fresh-air volume requirements.
Figure 6.
The research method for the temperature-control model of the subway train.
Figure 6.
The research method for the temperature-control model of the subway train.
Figure 7.
Control temperature as a function of passenger capacity and outside temperature.
Figure 7.
Control temperature as a function of passenger capacity and outside temperature.
Figure 8.
The arrangement of measuring points in the passenger compartment, shown in the top view (a) and the left view (b).
Figure 8.
The arrangement of measuring points in the passenger compartment, shown in the top view (a) and the left view (b).
Figure 9.
In-vehicle temperature field and velocity field data. There is a maximum temperature difference between each measurement point in the horizontal section (a), a maximum temperature difference between each measurement point in the vertical section (b) and a maximum wind speed in the vehicle (c).
Table 1.
Outdoor parameters required for the calculation of the air-supply volume of air-conditioning units.
Table 1.
Outdoor parameters required for the calculation of the air-supply volume of air-conditioning units.
| Temperature | Relative Humidity | Enthalpy | Density | Moisture Content |
|---|
| 33 °C | 70% | 90.62 kJ/kg | 1.138 kg/m3 | 22.41 g/kg |
Table 2.
Indoor parameters required for the calculation of the air-supply volume of air-conditioning units.
Table 2.
Indoor parameters required for the calculation of the air-supply volume of air-conditioning units.
| Temperature | Relative Humidity | Enthalpy | Moisture Content |
|---|
| 27 °C | 65% | 64.32 kJ/kg | 14.57 g/kg |
Table 3.
Other relevant parameters required for the calculation of the air-supply volume of air-conditioning units.
Table 3.
Other relevant parameters required for the calculation of the air-supply volume of air-conditioning units.
| Vehicle Area | Vehicle Average Heat Transfer | Coefficient per Capita
Total Heat Load [5] | Per-Capita New
Air Volume [4] | Equipment Heat
Dissipation [11] | Per-Capita
Amount of Moisture [2] |
|---|
| 216.52 m2 | 2.3 W/(m2 K) | 120 W | 10 m3/h | 2000 W | 76 g/h |
Table 4.
Minimum air volume for each working condition.
Table 4.
Minimum air volume for each working condition.
| Passenger Capacities N (Person) | Minimum Air-Supply Volume Q (m3/h) |
|---|
| 60 | 3795 |
| 129 | 6441 |
| 144 | 7070 |
| 176 | 8000 |
Table 5.
Air-supply volume under different passenger-capacity conditions Q (m3/h).
Table 5.
Air-supply volume under different passenger-capacity conditions Q (m3/h).
| PMV | 60 | 129 | 160 | 216 | 302 | 351 |
|---|
| −0.5 | 500 | 5000 | 8000 | / | / | / |
| 0 | 100 | 1000 | 5000 | 8000 | / | / |
| 0.5 | 50 | 100 | 3000 | 3800 | 6000 | 8000 |
Table 6.
The average radiant temperature of the human body under different passenger capacities.
Table 6.
The average radiant temperature of the human body under different passenger capacities.
| Passenger Capacities N (Person) | Mean Radiant Temperature (°C) |
|---|
| 80 | 25.9 |
| 120 | 27.0 |
| 160 | 28.2 |
| 200 | 28.6 |
| 240 | 29.0 |
| 280 | 29.2 |
| 320 | 29.3 |
| 360 | 30.3 |
Table 7.
The optimal control temperature for a passenger capacity of 0 to 60 people.
Table 7.
The optimal control temperature for a passenger capacity of 0 to 60 people.
| Outdoor Air Temperature (°C) | Clothing Thermal Resistance (clo) | Optimal Control Temperature (°C) |
|---|
Passenger Capacity N
(48 People) | Passenger Capacity N
(56 People) |
|---|
| 35 | 0.30 | 26.0 | 25.5 |
| 34 | 0.33 | 25.7 | 25.1 |
| 33 | 0.36 | 25.3 | 24.8 |
| 32 | 0.39 | 24.9 | 24.4 |
| 31 | 0.42 | 24.5 | 24.0 |
| 30 | 0.45 | 24.2 | 23.7 |
| 29 | 0.48 | 23.8 | 23.3 |
| 28 | 0.51 | 23.4 | 22.9 |
| 27 | 0.54 | 23.0 | 22.6 |
| 26 | 0.57 | 22.7 | 22.2 |
| 25 | 0.60 | 22.3 | 21.9 |
| 24 | 0.63 | 21.9 | 21.5 |
Table 8.
The optimal control temperature for a passenger capacity of 60 to 176 people.
Table 8.
The optimal control temperature for a passenger capacity of 60 to 176 people.
Outdoor Air Temperature
(°C) | Clothing Thermal Resistance (clo) | Optimal Control Temperature (°C) |
|---|
Passenger Capacity N
(80 People) | Passenger Capacity N
(100 People) | Passenger Capacity N
(120 People) | Passenger Capacity N
(140 People) |
|---|
| Air-flow rate v (m/s) | 0.13 | 0.17 | 0.2 | 0.23 |
| Air-supply volume Q (m3/h) | 462 | 5408 | 6148 | 6840 |
| 35 | 0.30 | 25.8 | 25.5 | 25.2 | 24.9 |
| 34 | 0.33 | 25.7 | 25.1 | 25.0 | 24.8 |
| 33 | 0.36 | 25.5 | 24.8 | 24.8 | 24.6 |
| 32 | 0.39 | 25.3 | 24.4 | 24.7 | 24.4 |
| 31 | 0.42 | 25.2 | 24.0 | 24.5 | 24.3 |
| 30 | 0.45 | 25.0 | 23.7 | 24.4 | 24.1 |
| 29 | 0.48 | 24.8 | 23.3 | 24.2 | 23.9 |
| 28 | 0.51 | 24.7 | 22.9 | 24.0 | 23.8 |
| 27 | 0.54 | 24.5 | 22.6 | 23.9 | 23.6 |
| 26 | 0.57 | 24.4 | 22.2 | 23.7 | 23.5 |
| 25 | 0.60 | 24.2 | 21.9 | 23.5 | 23.3 |
| 24 | 0.63 | 24.0 | 21.5 | 23.4 | 23.1 |
Table 9.
The optimal control temperature considering the temperature difference between the return air and the comfort section around people.
Table 9.
The optimal control temperature considering the temperature difference between the return air and the comfort section around people.
Outdoor Air Temperature
(°C) | Clothing Thermal Resistance (clo) | Optimal Control Temperature (°C) |
|---|
Passenger Capacity N
(200 People) | Passenger Capacity N
(240 People) | Passenger Capacity N
(280 People) | Passenger Capacity N
(320 People) |
|---|
| 35 | 0.30 | 24.6 | 24.3 | 24.2 | 24.1 |
| 34 | 0.33 | 24.3 | 24.0 | 24.0 | 23.7 |
| 33 | 0.36 | 24.0 | 23.7 | 23.7 | 23.4 |
| 32 | 0.39 | 23.7 | 23.4 | 23.4 | 23.1 |
| 31 | 0.42 | 23.4 | 23.1 | 23.1 | 22.8 |
| 30 | 0.45 | 23.1 | 22.8 | 22.8 | 22.5 |
| 29 | 0.48 | 22.8 | 22.5 | 22.5 | 22.2 |
| 28 | 0.51 | 22.5 | 22.2 | 22.2 | 21.9 |
| 27 | 0.54 | 22.2 | 21.9 | 21.9 | 21.6 |
| 26 | 0.57 | 21.9 | 21.6 | 21.6 | 21.3 |
| 25 | 0.60 | 21.6 | 21.3 | 21.3 | 21.0 |
| 24 | 0.63 | 21.3 | 21.0 | 21.0 | 20.7 |
Table 10.
The air-supply volume and the temperature-control curve.
Table 10.
The air-supply volume and the temperature-control curve.
| Passenger Capacity N (People) | Air Output Q (m3/h) | Controlling Temperature tin (°C) |
|---|
| N < 60 | 3795 | |
| 60 ≤ N < 176 | | |
| N ≥ 176 | 8000 | |
| Disclaimer/Publisher’s Note: The statements, opinions and data contained in all publications are solely those of the individual author(s) and contributor(s) and not of MDPI and/or the editor(s). MDPI and/or the editor(s) disclaim responsibility for any injury to people or property resulting from any ideas, methods, instructions or products referred to in the content. |
© 2023 by the authors. Licensee MDPI, Basel, Switzerland. This article is an open access article distributed under the terms and conditions of the Creative Commons Attribution (CC BY) license (https://creativecommons.org/licenses/by/4.0/).

