
Investigating the Impact of Weather Conditions on Urban Heat Island Development in the Subtropical City of Hong Kong


Abstract
1. Introduction
2. Method
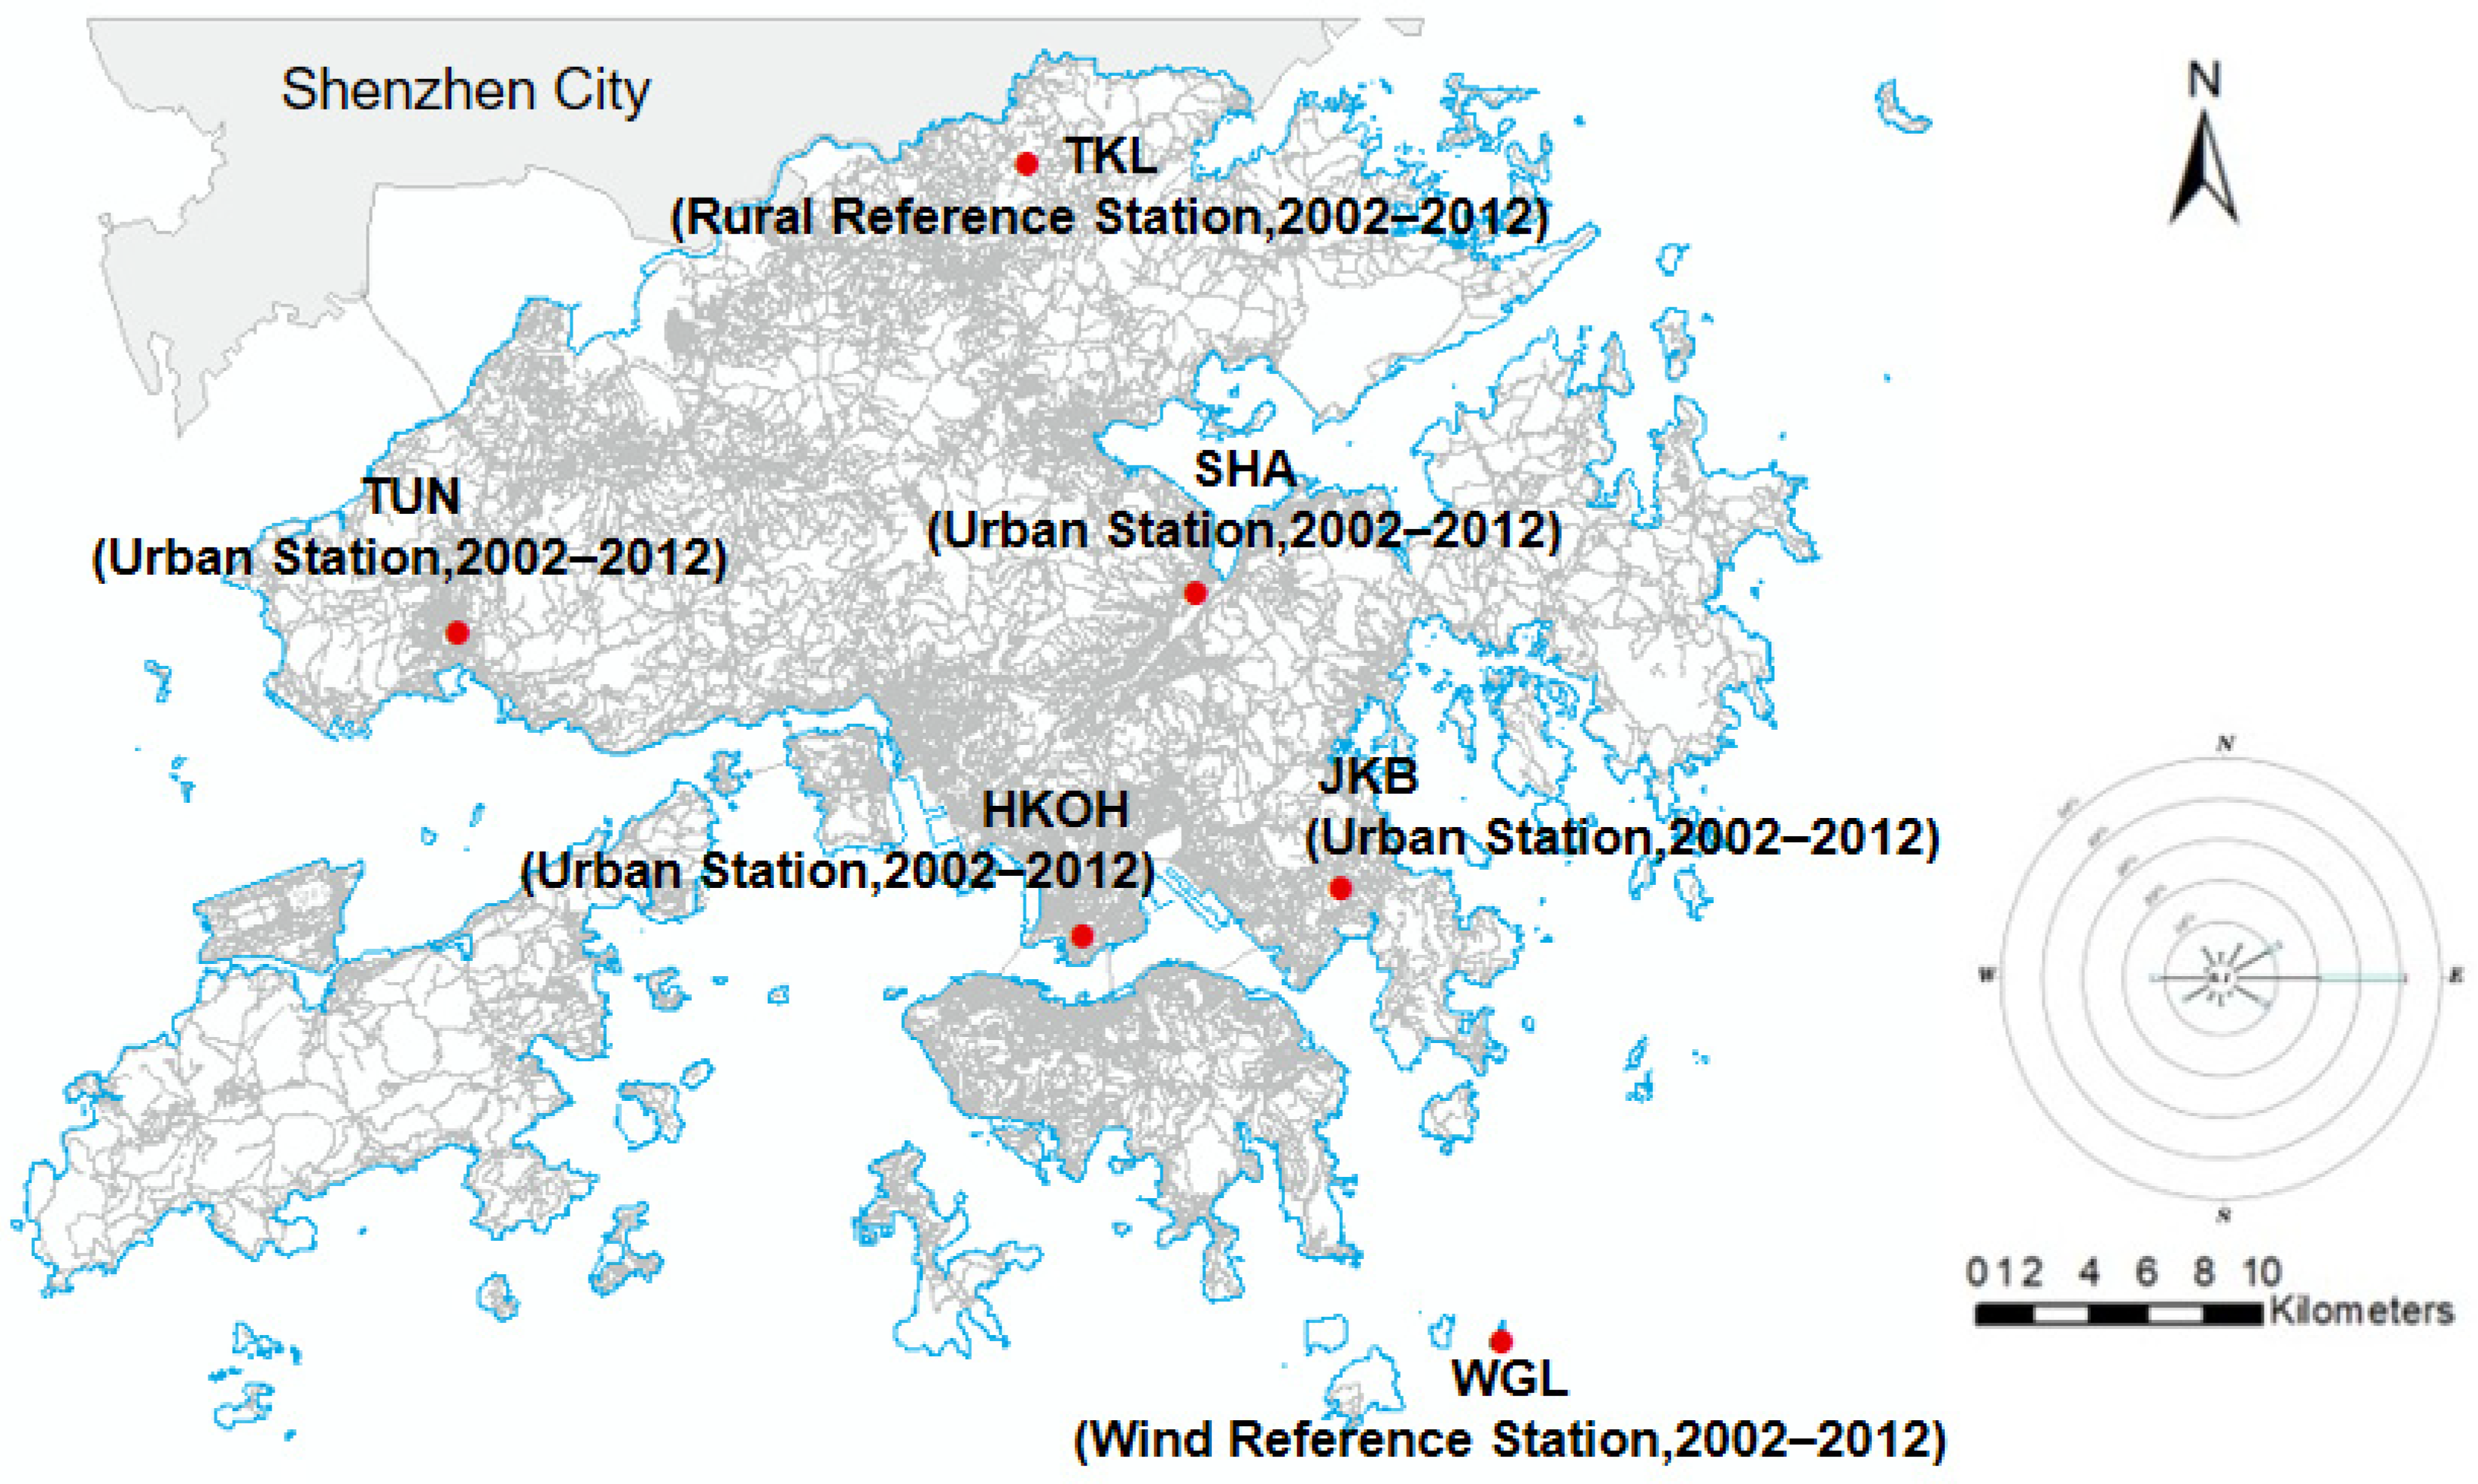
2.1. Context
2.2. Data
2.3. Quantifying UHI Intensity and Daily Weather Conditions
2.4. Statistical Analysis
3. Result and Analysis
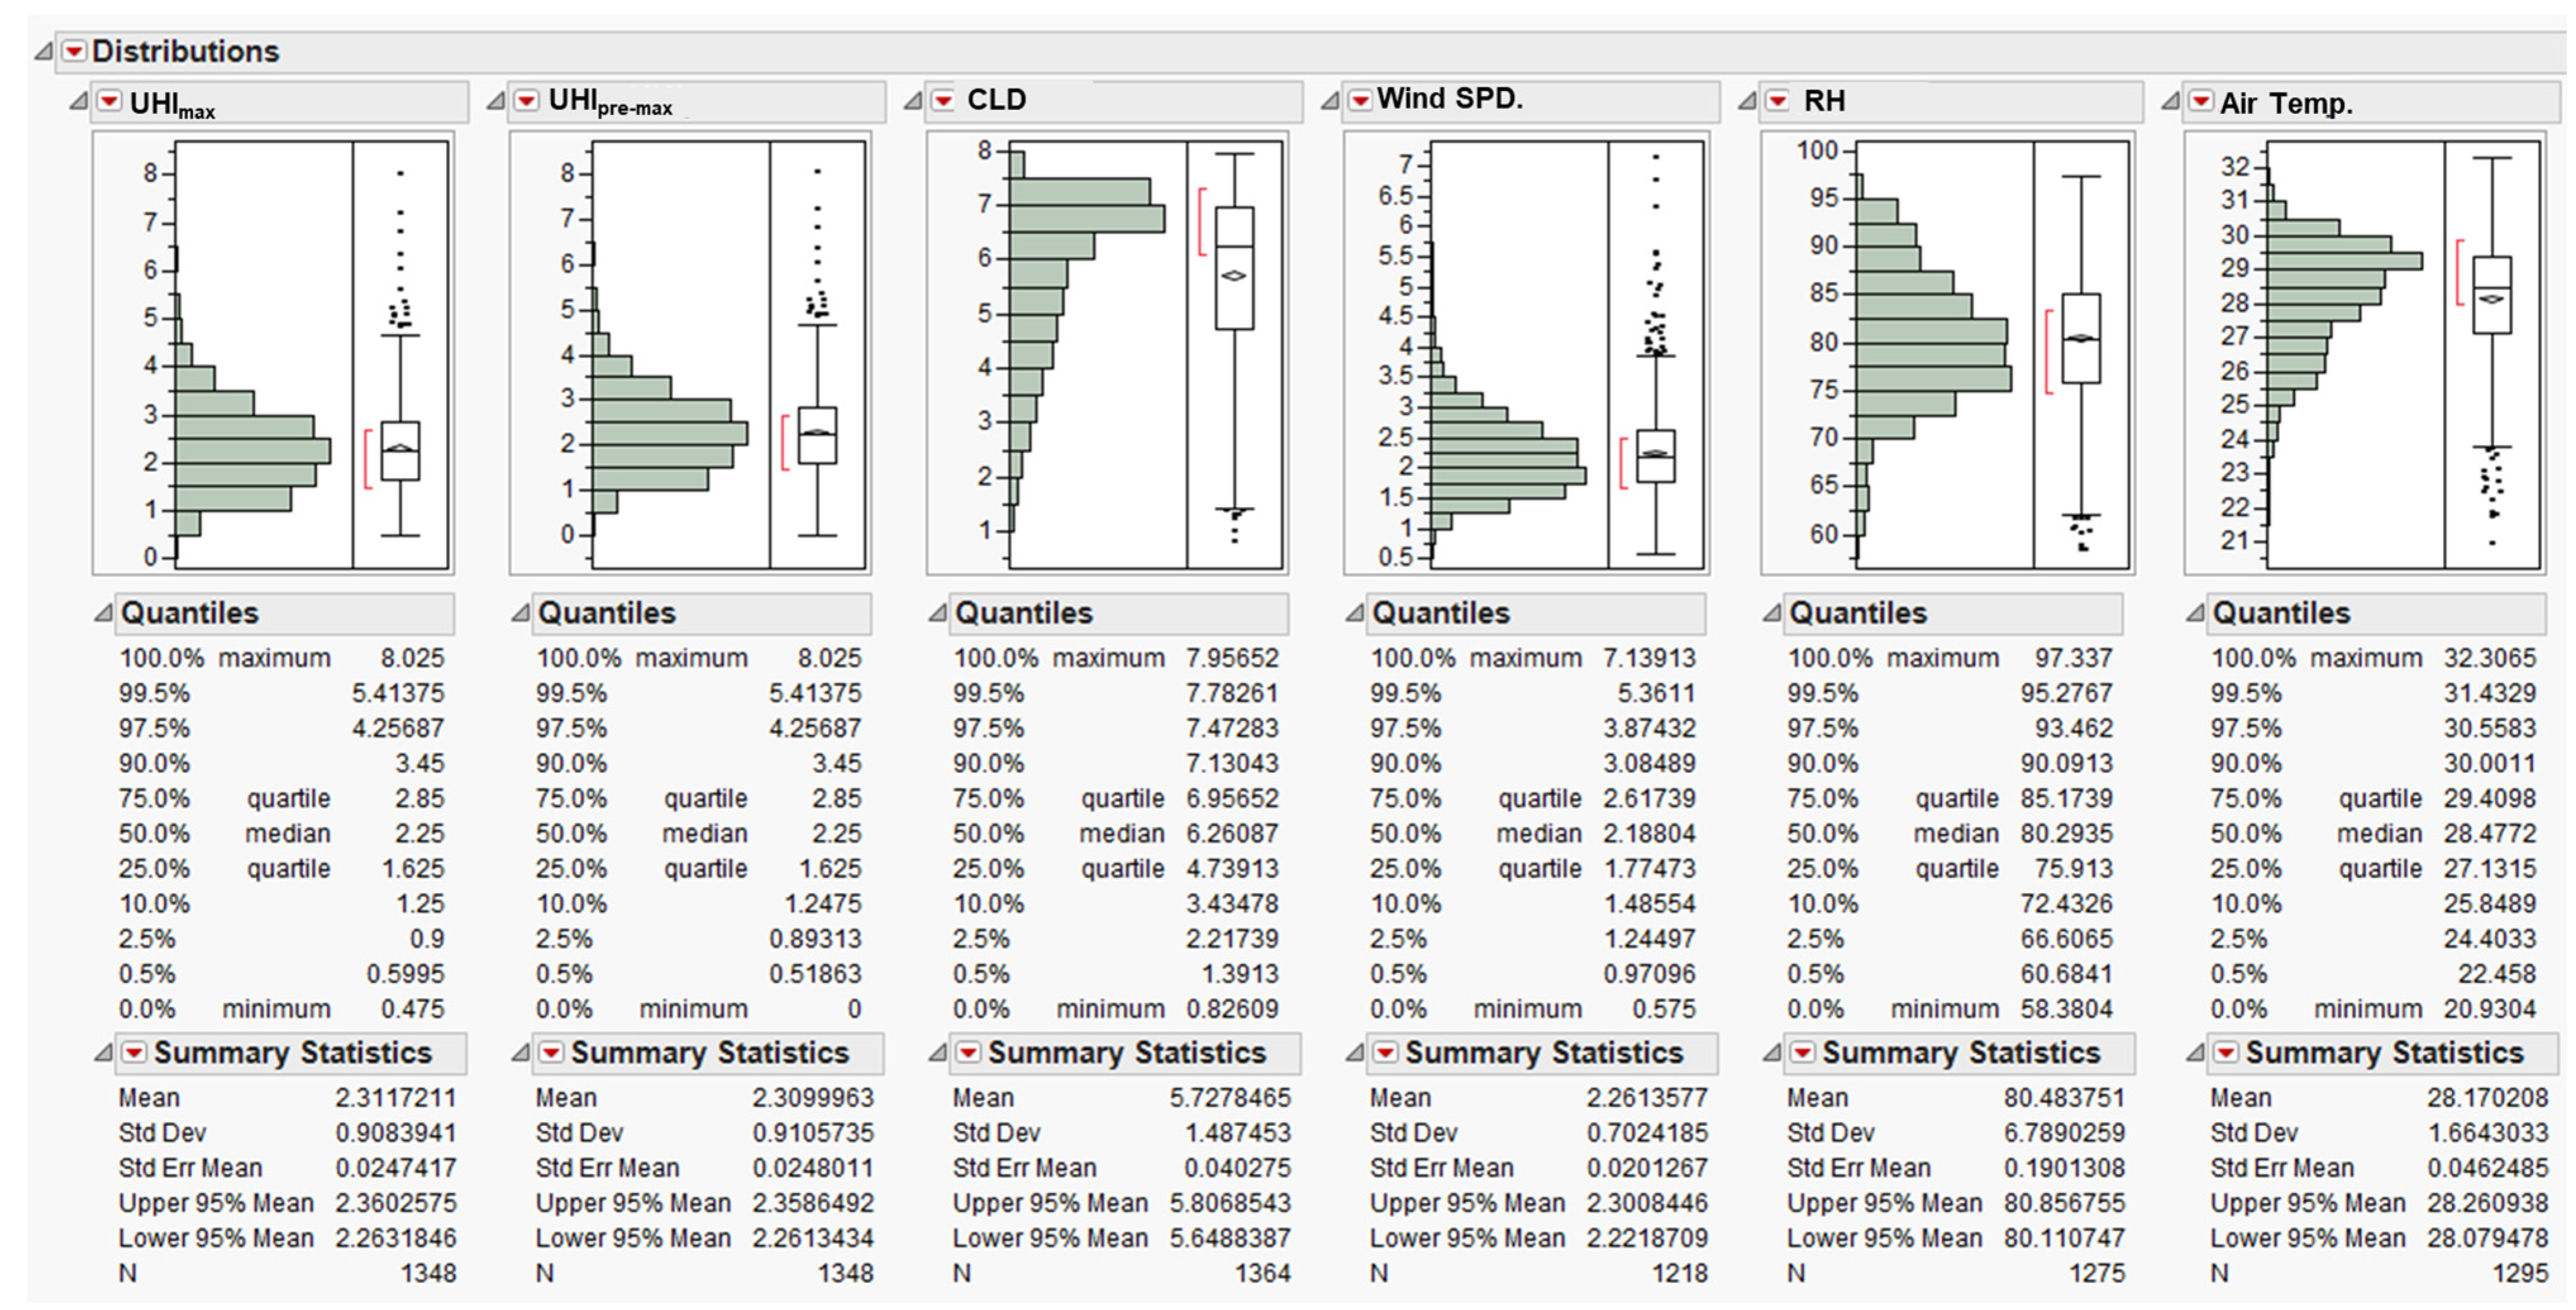
3.1. ANOVA, Distribution, and Partial Correlation Analysis
3.2. Impact of Weather Conditions and Previous-Day UHI Level on UHI Development
3.3. Modeling Daily Maximum UHI Intensity Based on Meteorological Elements and Previous UHI Conditions Using MLR
4. Discussion
4.1. Cloud Amount
4.2. Wind Speed
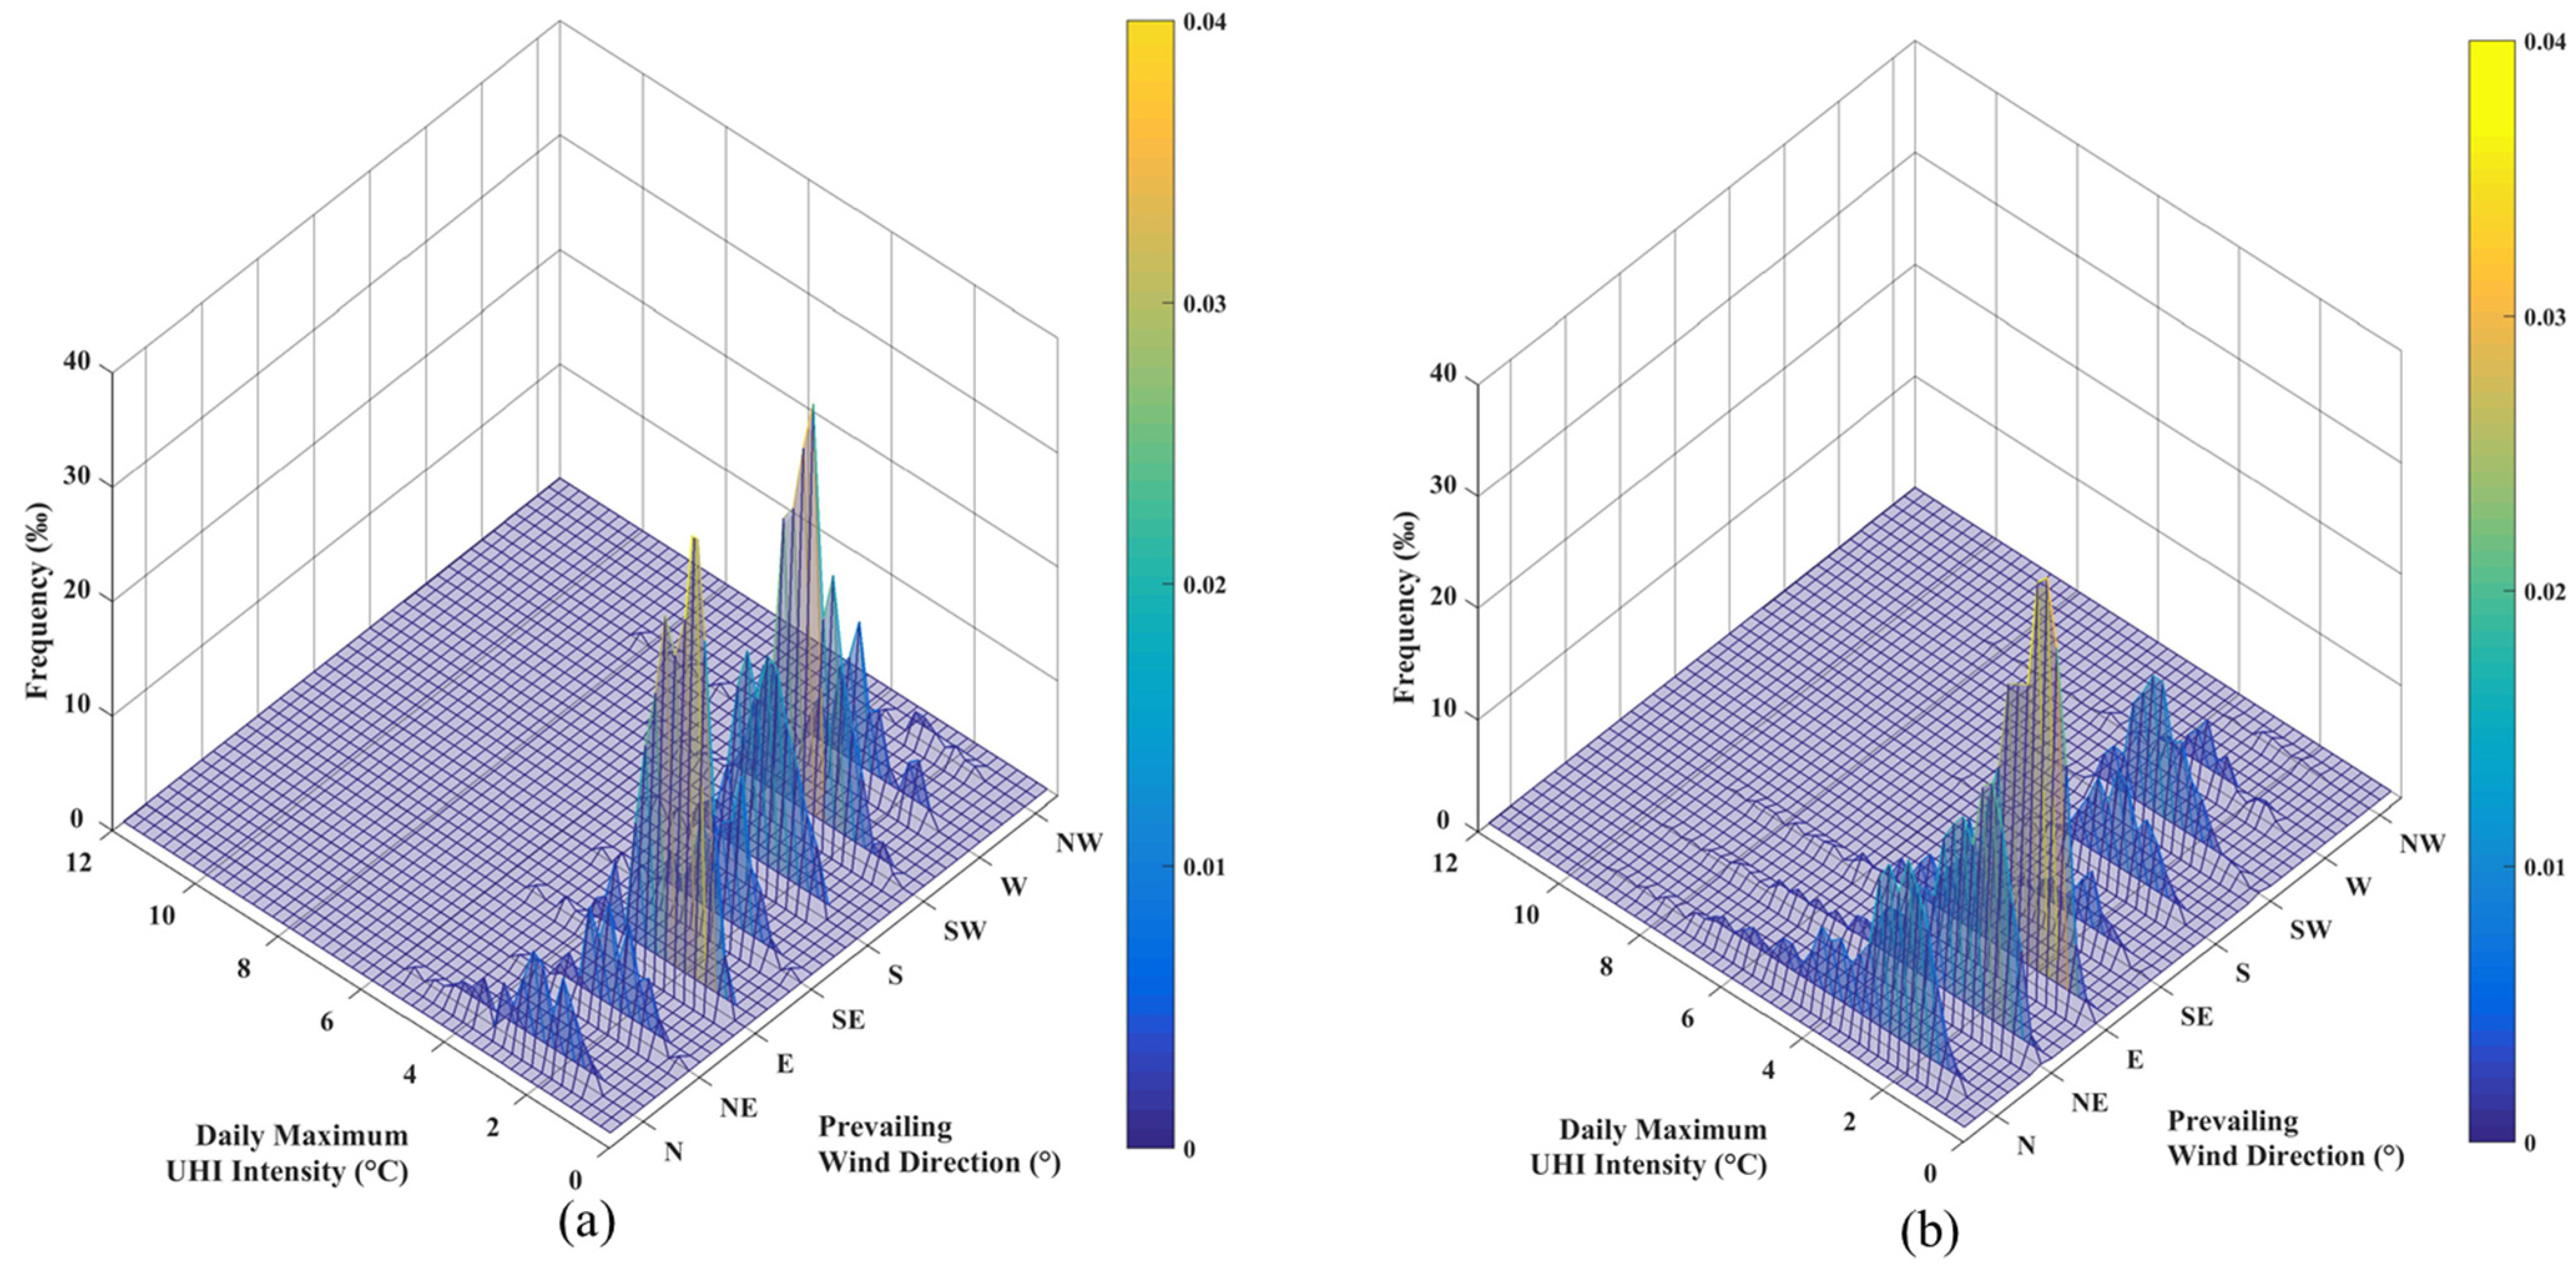
4.3. Wind Direction
4.4. UHIpre-max
4.5. Relative Humidity
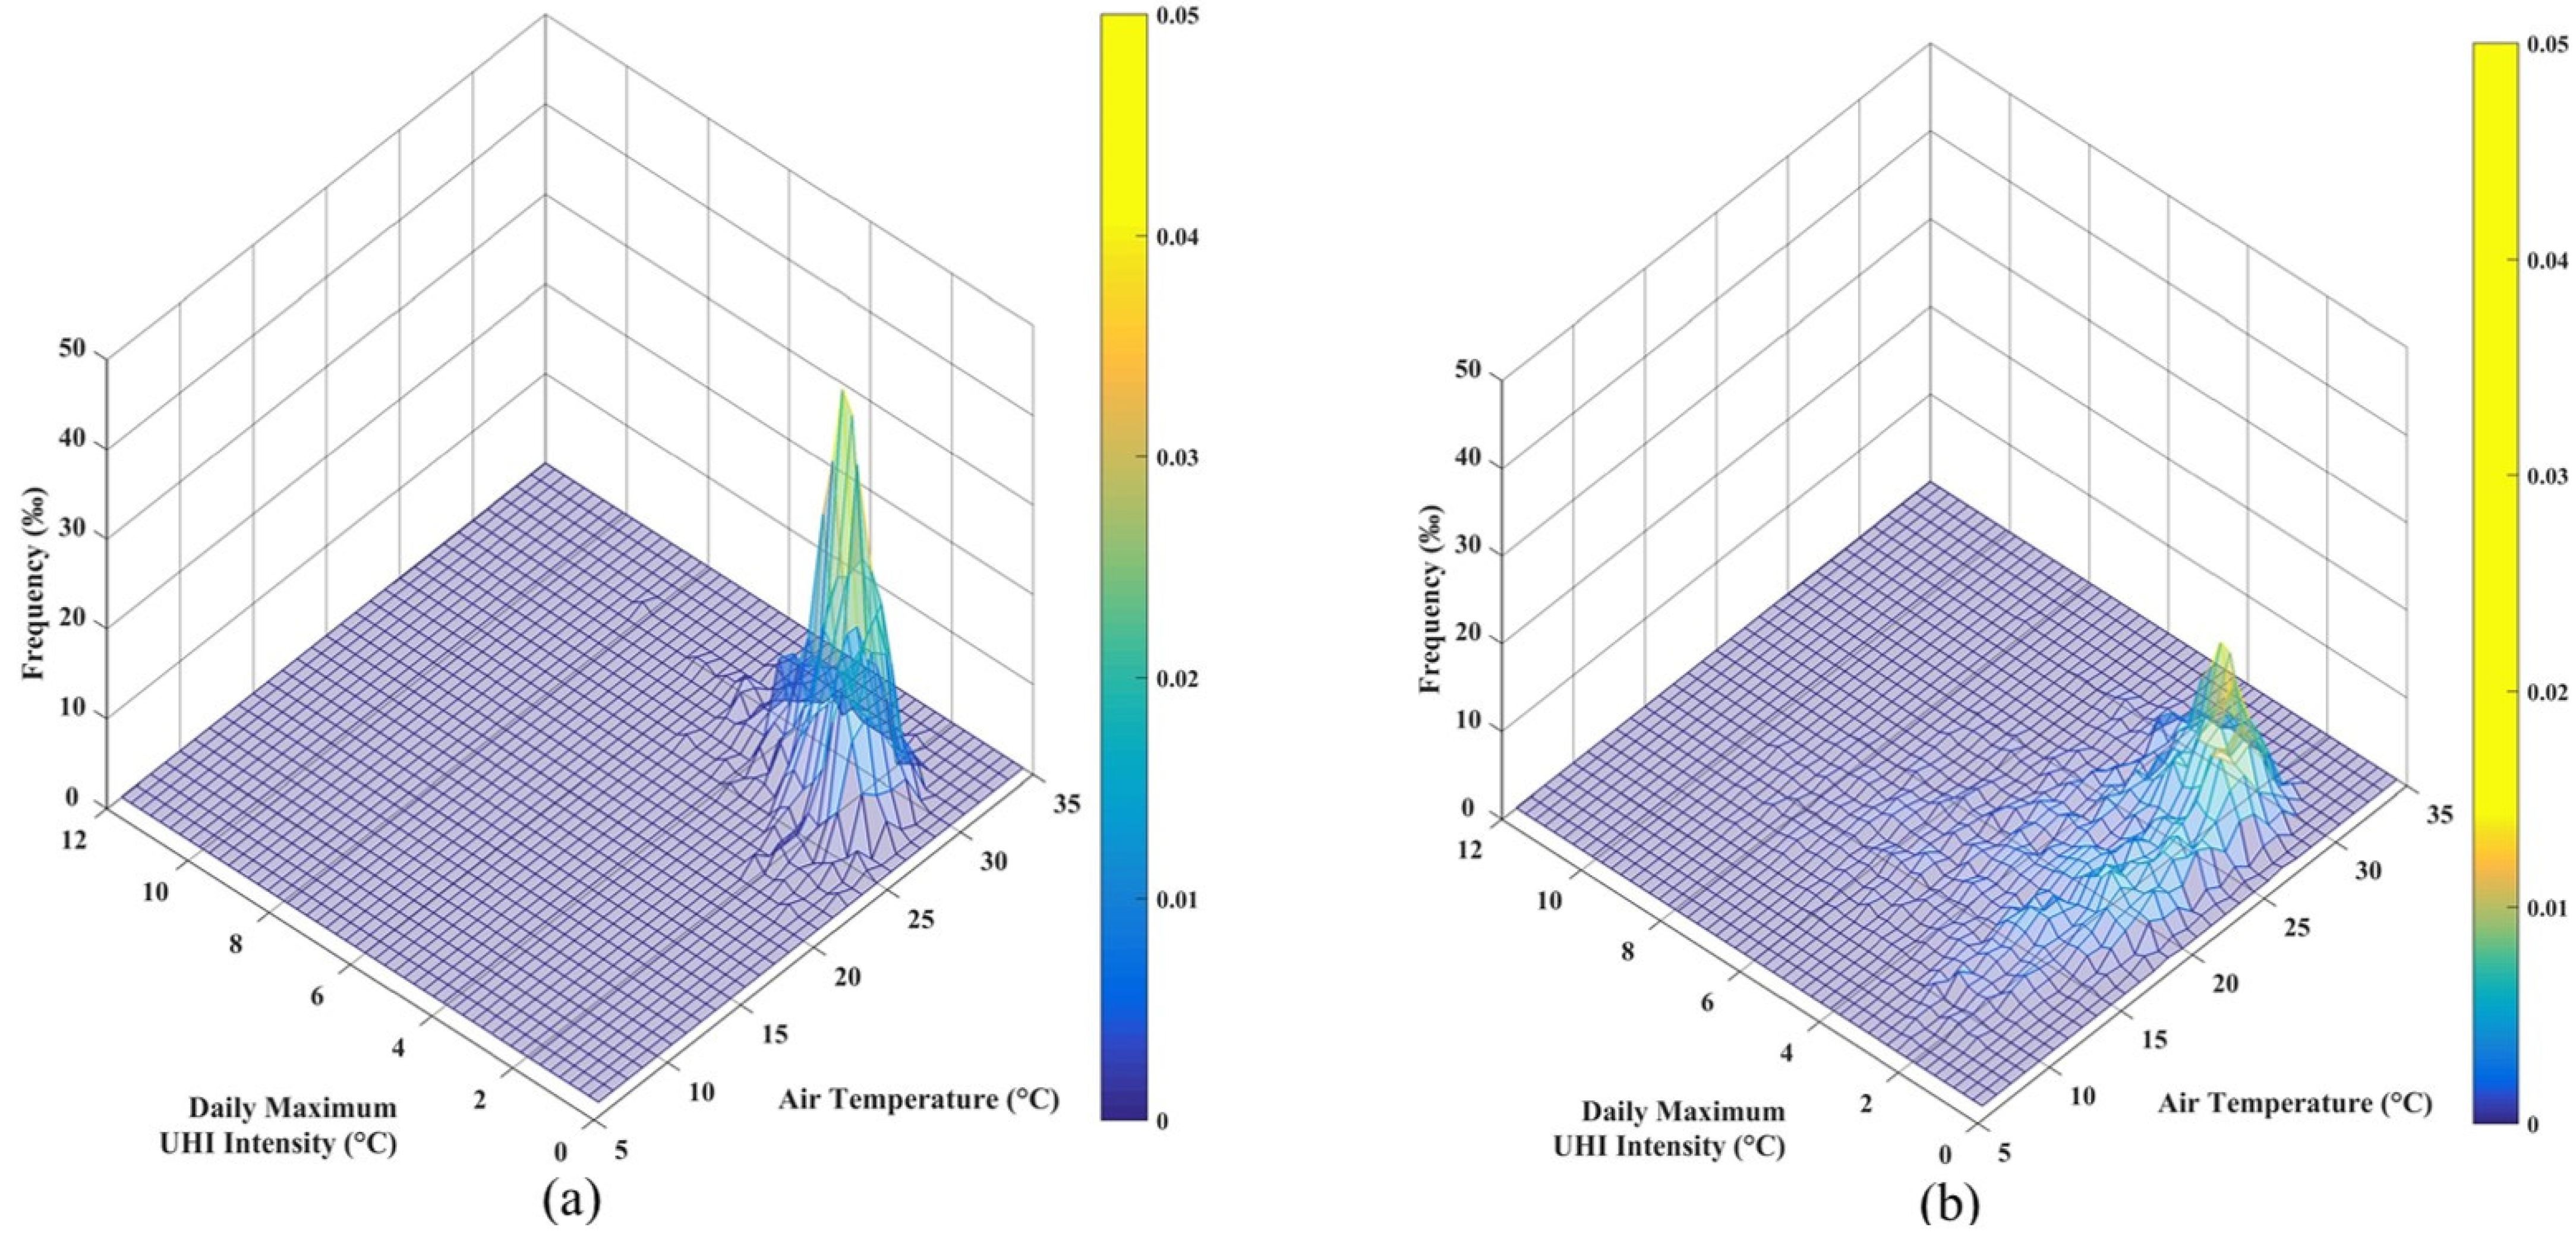
4.6. Air Temperature
5. Conclusions
- A considerable UHI intensity was recorded under the clear sky and weak wind conditions, which occurred at a low frequency both in the summer and in the whole year. Partly cloudy and light wind conditions were the dominant weather types in the summer in Hong Kong, under which the most considerable variation in the UHImax was observed, and a high UHImax above 6 K was documented.
- In the summer, key predictors of the UHImax were air temperature, the UHIpre-max, wind speed, and relative humidity. The air temperature was positively correlated with the UHImax, which implies that the UHI intensity tended to be intensified under the high temperature weather conditions. High-density urban areas may be exposed to a higher frequency, magnitude, and duration of extreme heat events due to the reinforcement of the UHI effects. Wind speed is another key meteorological element influencing UHImax, and thus improving air ventilation in urban areas would benefit local UHI mitigation.
- 3.
- The MLR method showed the influence magnitude of multiple meteorological elements and the UHIpre-max on the UHImax, through its simple linear structure among the input and output variables. The findings suggest that, in addition to cloud amount and wind speed, air temperature, relative humidity, and the UHIpre-max also need to be considered to understand the influence of weather conditions on UHI development, which is helpful to better control the weather for UHI observations. As the prevailing weather conditions in Hong Kong in the summer and the whole year are with a high cloud cover of 6–7 Octas, weak wind speed of 1.5–2.5 m/s, and high relative humidity of 70–85%, it is necessary to conduct UHI observations under the prevailing high cloud cover, weak wind, and high relative humidity conditions to evaluate local UHI patterns. In the summer, high air temperature conditions are critical for UHI observations, as the UHImax is exacerbated as the air temperature rises and the high UHI conditions further exacerbate local high temperatures. Summer days with winds coming from the west are also critical for UHI observations, as it is possible to experience a high UHImax.
Author Contributions
Funding
Institutional Review Board Statement
Informed Consent Statement
Data Availability Statement
Acknowledgments
Conflicts of Interest
References
- Oke, T.R. The Energetic Basis of the Urban Heat Island. Q. J. R. Meteorol. Soc. 1982, 108, 1–24. [Google Scholar] [CrossRef]
- Oke, T.R. Street design and urban canopy layer climate. Energy Build. 1988, 11, 103–113. [Google Scholar] [CrossRef]
- Landsberg, H.E. The Urban Climate; Academic Press: Cambridge, MA, USA, 1981; Volume 28. [Google Scholar]
- Hua, J.; Zhang, X.; Ren, C.; Shi, Y.; Lee, T.-C. Spatiotemporal assessment of extreme heat risk for high-density cities: A case study of Hong Kong from 2006 to 2016. Sustain. Cities Soc. 2021, 64, 102507. [Google Scholar] [CrossRef]
- Morakinyo, T.E.; Ren, C.; Shi, Y.; Lau, K.K.-L.; Tong, H.-W.; Choy, C.-W.; Ng, E. Estimates of the impact of extreme heat events on cooling energy demand in Hong Kong. Renew. Energy 2019, 142, 73–84. [Google Scholar] [CrossRef]
- Ho, H.C.; Lau, K.K.-L.; Ren, C.; Ng, E. Characterizing prolonged heat effects on mortality in a sub-tropical high-density city, Hong Kong. Int. J. Biometeorol. 2017, 61, 1935–1944. [Google Scholar] [CrossRef]
- Ho, J.Y.; Shi, Y.; Lau, K.K.; Ng, E.Y.; Ren, C.; Goggins, W.B. Urban heat island effect-related mortality under extreme heat and non-extreme heat scenarios: A 2010–2019 case study in Hong Kong. Sci. Total Environ. 2023, 858, 159791. [Google Scholar] [CrossRef]
- Shi, Y.; Ren, C.; Luo, M.; Ching, J.; Li, X.; Bilal, M.; Fang, X.; Ren, Z. Utilizing world urban database and access portal tools (WUDAPT) and machine learning to facilitate spatial estimation of heatwave patterns. Urban Clim. 2021, 36, 100797. [Google Scholar] [CrossRef]
- Lau, K.K.-L.; Chung, S.C.; Ren, C. Outdoor thermal comfort in different urban settings of sub-tropical high-density cities: An approach of adopting local climate zone (LCZ) classification. Build. Environ. 2019, 154, 227–238. [Google Scholar] [CrossRef]
- Nichol, J.; Fung, W.Y.; Lam, K.-s.; Wong, M.S. Urban heat island diagnosis using ASTER satellite images and ‘in situ’ air temperature. Atmos. Res. 2009, 94, 276–284. [Google Scholar] [CrossRef]
- Giridharan, R.; Ganesan, S.; Lau, S. Daytime urban heat island effect in high-rise and high-density residential developments in Hong Kong. Energy Build. 2004, 36, 525–534. [Google Scholar] [CrossRef]
- Giridharan, R.; Lau, S.; Ganesan, S. Nocturnal heat island effect in urban residential developments of Hong Kong. Energy Build. 2005, 37, 964–971. [Google Scholar] [CrossRef]
- Fung, W.Y.; Lam, K.S.; Nichol, J.; Wong, M.S. Derivation of nighttime urban air temperatures using a satellite thermal image. J. Appl. Meteorol. Climatol. 2009, 48, 863–872. [Google Scholar] [CrossRef]
- Nichol, J. Remote sensing of urban heat islands by day and night. Photogramm. Eng. Remote Sens. 2005, 71, 613–621. [Google Scholar] [CrossRef]
- Ng, E.; Cheng, V.; Gadi, A.; Mu, J.; Lee, M.; Gadi, A. Defining standard skies for Hong Kong. Build. Environ. 2007, 42, 866–876. [Google Scholar] [CrossRef]
- Li, H.W.; Lam, J.C. An analysis of climatic parameters and sky condition classification. Build. Environ. 2001, 36, 435–445. [Google Scholar] [CrossRef]
- He, B.-J. Potentials of meteorological characteristics and synoptic conditions to mitigate urban heat island effects. Urban Clim. 2018, 24, 26–33. [Google Scholar] [CrossRef]
- Santamouris, M.; Kolokotsa, D. Urban Climate Mitigation Techniques; Routledge: New York, NY, USA, 2016. [Google Scholar]
- Oke, T.R. An algorithmic scheme to estimate hourly heat island magnitude. In Proceedings of the 2nd Sym Urban Env, Albuquerque, NM, USA, 2–6 November 1998. [Google Scholar]
- Stewart, I.D. Redefining the Urban Heat Island. Ph.D. Thesis, University of British Columbia, Vancouver, BC, Canada, 2011. [Google Scholar]
- Emmanuel, R.; Krüger, E. Urban heat island and its impact on climate change resilience in a shrinking city: The case of Glasgow, UK. Build. Environ. 2012, 53, 137–149. [Google Scholar] [CrossRef]
- Coseo, P.; Larsen, L. How factors of land use/land cover, building configuration, and adjacent heat sources and sinks explain Urban Heat Islands in Chicago. Landsc. Urban Plan. 2014, 125, 117–129. [Google Scholar] [CrossRef]
- Ganbat, G.; Han, J.-Y.; Ryu, Y.-H.; Baik, J.-J. Characteristics of the urban heat island in a high-altitude metropolitan city, Ulaanbaatar, Mongolia. Asia-Pac. J. Atmos. Sci. 2013, 49, 535–541. [Google Scholar] [CrossRef]
- Hoffmann, P.; Krueger, O.; Schlünzen, K.H. A statistical model for the urban heat island and its application to a climate change scenario. Int. J. Climatol. 2012, 32, 1238–1248. [Google Scholar] [CrossRef]
- Morris, C.; Simmonds, I. Associations between varying magnitudes of the urban heat island and the synoptic climatology in Melbourne, Australia. Int. J. Climatol. 2000, 20, 1931–1954. [Google Scholar] [CrossRef]
- Kim, Y.-H.; Baik, J.-J. Maximum urban heat island intensity in Seoul. J. Appl. Meteorol. 2002, 41, 651–659. [Google Scholar] [CrossRef]
- Kim, Y.-H.; Baik, J.-J. Daily maximum urban heat island intensity in large cities of Korea. Theor. Appl. Climatol. 2004, 79, 151–164. [Google Scholar] [CrossRef]
- Dai, F.; Lee, C. Landslide characteristics and slope instability modeling using GIS, Lantau Island, Hong Kong. Geomorphology 2002, 42, 213–228. [Google Scholar] [CrossRef]
- HKPD; CUHK. Urban Climatic Map and Standards for Wind Environment—Feasibility Study, Final Report; CUHK: Ma Liu Shui, Hong Kong, 2009. [Google Scholar]
- Yim, W.; Ollier, C. Managing planet earth to make future development more sustainable: Climate change and Hong Kong. Quart. Sci. 2009, 29, 190–198. [Google Scholar]
- Lam, C.Y. On climate changes brought about by urban living. Designing high-density cities for social and environmental sustainability. In Designing High-Density Cities; Routledge: New York, NY, USA, 2010; pp. 55–61. [Google Scholar]
- Memon, R.A.; Leung, D.Y.; Liu, C.-H. An investigation of urban heat island intensity (UHII) as an indicator of urban heating. Atmos. Res. 2009, 94, 491–500. [Google Scholar] [CrossRef]
- Sakakibara, Y.; Owa, K. Urban–rural temperature differences in coastal cities: Influence of rural sites. Int. J. Climatol. 2005, 25, 811–820. [Google Scholar] [CrossRef]
- Fung, W.Y. Characterizing Urban Heat Island and Its Effects in Hong Kong. Ph.D. Thesis, The Hong Kong Polytechnic University, Hong Kong, China, 2010. [Google Scholar]
- Siu, L.W.; Hart, M.A. Quantifying urban heat island intensity in Hong Kong SAR, China. Environ. Monit. Assess. 2013, 185, 4383–4398. [Google Scholar] [CrossRef]
- Leung, Y.K. Climate Change in Hong Kong. Hong Kong Meteorological Society Bulletin; Hong Kong Observatory: Hong Kong, China, 2004. [Google Scholar]
- Leung, Y.K.; Ng, T.S. Regional Temperature Variation in Winter of Hong Kong; Hong Kong Observatory: Hong Kong, China, 1997. [Google Scholar]
- Wu, M.C.; Leung, Y.; Lui, W.; Lee, T. A study on the difference between urban and rural climate in Hong Kong. Meteor 2009, 35, 71–79. [Google Scholar]
- Karl, T.R.; Diaz, H.F.; Kukla, G. Urbanization: Its detection and effect in the United States climate record. J. Clim. 1988, 1, 1099–1123. [Google Scholar] [CrossRef]
- HKPD; CUHK. Urban Climatic Map and Standards for Wind Environment—Feasibility Study: Technical Digest; Chinese University of Hong Kong: Hong Kong, China, 2009. [Google Scholar]
- Corlett, R.T. Characteristics of vertebrate-dispersed fruits in Hong Kong. J. Trop. Ecol. 1996, 12, 819–833. [Google Scholar] [CrossRef]
- Yan, Y.Y. Climate and residential electricity consumption in Hong Kong. Energy 1998, 23, 17–20. [Google Scholar] [CrossRef]
- Zheng, Y. Planning Strategies for Urban Heat Island Mitigation: An Application of Local Climate Zone into the High-Density City of Hong Kong. Ph.D. Thesis, The Chinese University of Hong Kong, Hong Kong, China, 2016. [Google Scholar]
- Zhou, J.; Chen, Y.; Zhang, X.; Zhan, W. Modelling the diurnal variations of urban heat islands with multi-source satellite data. Int. J. Remote Sens. 2013, 34, 7568–7588. [Google Scholar] [CrossRef]
- Yan, Y.Y. The influence of weather on human mortality in Hong Kong. Soc. Sci. Med. 2000, 50, 419–427. [Google Scholar] [CrossRef]
- Bilal, M.; Nichol, J.E.; Nazeer, M.; Shi, Y.; Wang, L.; Kumar, K.R.; Ho, H.C.; Mazhar, U.; Bleiweiss, M.P.; Qiu, Z.; et al. Characteristics of fine particulate matter (PM2. 5) over urban, suburban, and rural areas of Hong Kong. Atmosphere 2019, 10, 496. [Google Scholar] [CrossRef]


| Station | Type | Meteorological Elements for Analysis |
|---|---|---|
| HKOH | Urban Representative Station | Air temperature, relative humidity, wind speed, cloud amount |
| JKB, SHA, TUN | Urban Station | Air temperature, relative humidity, wind speed |
| TKL | Rural Reference Station | Air temperature |
| WGL | Wind Reference Station | Wind direction |
| Weather Station | Grouping | UHImax (Summer, 2002–2012) | ||||||||||
|---|---|---|---|---|---|---|---|---|---|---|---|---|
| n | Mean | StdDev | Minimum | 25% | Median | 75% | Maximum | |||||
| HKOH | A | 1356 | 2.63 | 1.10 | 0.2 | 1.8 | 2.6 | 3.3 | 8.5 | |||
| JKB | B | 1356 | 1.70 | 1.11 | −0.5 | 0.9 | 1.5 | 2.3 | 8.2 | |||
| SHA | B | 1354 | 2.22 | 0.92 | −0.1 | 1.6 | 2.1 | 2.8 | 7.9 | |||
| TUN | C | 1350 | 2.71 | 1.04 | −0.3 | 2 | 2.6 | 3.3 | 9.1 | |||
| Weather Station | Grouping | UHImax (Annual, 2002–2012) | ||||||||||
| n | Mean | StdDev | Minimum | 25% | Median | 75% | Maximum | |||||
| HKOH | A | 4008 | 3.01 | 1.74 | −0.1 | 1.8 | 2.7 | 3.8 | 11 | |||
| JKB | B | 4005 | 1.91 | 1.53 | −1.1 | 0.8 | 1.6 | 2.6 | 9.4 | |||
| SHA | C | 4006 | 2.25 | 1.24 | −0.2 | 1.4 | 2 | 2.8 | 10 | |||
| TUN | D | 3999 | 2.77 | 1.41 | −0.3 | 1.8 | 2.5 | 3.4 | 10.3 | |||
| UHImax | UHIpre-max | CLD | Wind SPD | RH | Air Temp. | |
|---|---|---|---|---|---|---|
| UHImax | 0.32 | −0.02 | −0.18 | −0.14 | 0.24 | |
| UHIpre-max MAX | 0.32 | 0.05 | −0.04 | −0.04 | 0.14 | |
| CLD | −0.02 | 0.05 | 0.27 | 0.50 | −0.22 | |
| Wind SPD. | −0.18 | −0.04 | 0.27 | −0.23 | 0.15 | |
| RH | −0.14 | −0.04 | 0.50 | −0.23 | −0.29 | |
| Air Temp. | 0.24 | 0.14 | −0.22 | 0.15 | −0.29 |
| UHImax | UHIpre-max | CLD | Wind SPD | RH | Air Temp. | |
|---|---|---|---|---|---|---|
| UHImax | 0.45 | −0.29 | −0.23 | −0.23 | −0.04 | |
| UHIpre-max | 0.45 | −0.03 | 0.03 | −0.10 | −0.06 | |
| CLD | −0.29 | −0.03 | 0.22 | 0.47 | −0.21 | |
| Wind SPD | −0.23 | 0.03 | 0.22 | −0.35 | 0.10 | |
| RH | −0.23 | −0.10 | 0.47 | −0.35 | 0.30 | |
| Air Temp. | −0.04 | −0.06 | −0.21 | 0.10 | 0.30 |
| Forward Stepwise MLR | |||||||
|---|---|---|---|---|---|---|---|
| Step | Parameter | Action | R2 | 10-Fold Cross Validation R2 | AICc | ||
| 1 | Air Temp. | Entered | 0.20 | 0.20 | 2817.3 | ||
| 2 | UHIpre-max | Entered | 0.28 | 0.28 | 2686.7 | ||
| 3 | Wind SPD | Entered | 0.31 | 0.30 | 2649.5 | ||
| 4 | RH | Entered | 0.33 | 0.32 | 2615.4 | ||
| 5 | Best Model | Specific | 0.33 | 0.32 | 2615.4 | ||
| Summary of Fit | |||||||
| Dependent Variable | R2 | Adjusted R2 | RMSE | Mean of Response | p value | Observations | 10-fold Cross Validation R2 |
| Daily Maximum UHI Intensity (UHImax) | 0.33 | 0.33 | 0.74 | 2.33 | <0.0001 * | 1170 | 0.32 |
| Parameter Estimates | |||||||
| Term | Estimate | Std Error | t Ratio | Prob > |t| | VIF | ||
| Intercept | −0.10 | 0.67 | −0.15 | 0.8807 | - | ||
| Air Temp. | 0.14 | 0.02 | 9.12 | <0.0001 * | 1.53 | ||
| UHIpre-max | 0.29 | 0.03 | 11.18 | <0.0001 * | 1.12 | ||
| Wind SPD | −0.21 | 0.03 | −6.83 | <0.0001 * | 1.01 | ||
| RH | −0.02 | 0.004 | −6.04 | <0.0001 * | 1.46 | ||
| Forward Stepwise MLR | |||||||
|---|---|---|---|---|---|---|---|
| Step | Parameter | Action | R2 | 10-Fold Cross Validation R2 | AICc | ||
| 1 | UHIpre-max | Entered | 0.37 | 0.37 | 10,717.6 | ||
| 2 | CLD | Entered | 0.51 | 0.51 | 9821.0 | ||
| 3 | RH | Entered | 0.53 | 0.53 | 9692.0 | ||
| 4 | Wind SPD | Entered | 0.56 | 0.55 | 9485.6 | ||
| 5 | Air Temp. | Entered | 0.56 | 0.55 | 9481.6 | ||
| 6 | Best Model | Specific | 0.56 | 0.55 | 9481.6 | ||
| Summary of Fit | |||||||
| Dependent Variable | R2 | Adjusted R2 | RMSE | Mean of Response | p value | Observations | 10-fold Cross Validation R2 |
| UHImax | 0.56 | 0.56 | 0.91 | 2.50 | <0.0001 * | 3578 | 0.55 |
| Parameter Estimates | |||||||
| Term | Estimate | Std Error | t Ratio | Prob > |t| | VIF | ||
| Intercept | 5.74 | 0.17 | 34.75 | <0.0001 * | - | ||
| UHIpre-max | 0.38 | 0.01 | 29.86 | <0.0001 * | 1.31 | ||
| CLD | −0.19 | 0.01 | −17.84 | <0.0001 * | 1.85 | ||
| RH | −0.03 | 0.002 | −14.17 | <0.0001 * | 2.00 | ||
| Wind SPD | −0.37 | 0.03 | −14.29 | <0.0001 * | 1.15 | ||
| Air Temp. | −0.008 | 0.003 | −2.45 | <0.0001 * | 1.14 | ||
Disclaimer/Publisher’s Note: The statements, opinions and data contained in all publications are solely those of the individual author(s) and contributor(s) and not of MDPI and/or the editor(s). MDPI and/or the editor(s) disclaim responsibility for any injury to people or property resulting from any ideas, methods, instructions or products referred to in the content. |
© 2023 by the authors. Licensee MDPI, Basel, Switzerland. This article is an open access article distributed under the terms and conditions of the Creative Commons Attribution (CC BY) license (https://creativecommons.org/licenses/by/4.0/).
Share and Cite
Zheng, Y.; Li, W.; Fang, C.; Feng, B.; Zhong, Q.; Zhang, D. Investigating the Impact of Weather Conditions on Urban Heat Island Development in the Subtropical City of Hong Kong. Atmosphere 2023, 14, 257. https://doi.org/10.3390/atmos14020257
Zheng Y, Li W, Fang C, Feng B, Zhong Q, Zhang D. Investigating the Impact of Weather Conditions on Urban Heat Island Development in the Subtropical City of Hong Kong. Atmosphere. 2023; 14(2):257. https://doi.org/10.3390/atmos14020257
Chicago/Turabian StyleZheng, Yingsheng, Wenjie Li, Can Fang, Biyin Feng, Qiru Zhong, and Dongxu Zhang. 2023. "Investigating the Impact of Weather Conditions on Urban Heat Island Development in the Subtropical City of Hong Kong" Atmosphere 14, no. 2: 257. https://doi.org/10.3390/atmos14020257
APA StyleZheng, Y., Li, W., Fang, C., Feng, B., Zhong, Q., & Zhang, D. (2023). Investigating the Impact of Weather Conditions on Urban Heat Island Development in the Subtropical City of Hong Kong. Atmosphere, 14(2), 257. https://doi.org/10.3390/atmos14020257