Abstract
Polar amplification has been a research focus in climate research in recent decades. However, little attention has been paid to Antarctic amplification (AnA). We have examined the variations in annual and seasonal temperature over the Antarctic Ice Sheet and its amplification based on reconstruction covering the period 2002–2018. The results show the occurrence of annual and seasonal AnA, with an AnA index greater than 1.39 with seasonal differences, and that AnA is strong in the austral winter and spring. Moreover, AnA displays regional differences, with the greatest amplification occurring in East Antarctica, with an AnA index greater than 1.51, followed by West Antarctica. AnA is always absent in the Antarctic Peninsula. In addition, amplification in East Antarctica is most conspicuous in spring, which corresponds to the obvious warming in this season; and the spring amplification signal is weakest for West Antarctica. When considering the influence of the ocean, the AnA becomes obvious, compared to when only the land is considered. Southern Annular Mode (SAM), surface pressure and westerlies work together to affect the temperature change over Antarctica and AnA; and SAM and surface pressure are highly correlated with the temperature change over East Antarctica. The picture reflects the accelerated changes in Antarctic temperature.
1. Introduction
Global warming is an established fact, and the polar regions are sensitive areas for climate change, characterized by rapid warming; a phenomenon named as polar amplification [1,2,3]. Factors including, but not limited to, surface albedo feedback, longwave feedback, and atmospheric and oceanic heat transport are considered to play an important role in polar amplification [4,5,6]. Previous studies found asymmetry in polar amplification, with the Antarctic amplification (AnA) weaker than Arctic amplification [7,8]. Variations in albedo are closely coupled to the strength of polar amplification, and changes in surface albedo are more important relative to changes in the atmosphere, and the opposite sign can be captured in the Arctic [9]. Moreover, changes in surface albedo, cloud cover and atmospheric absorbed shortwave radiation are greater in the Arctic, which is associated with the strong Arctic amplification [9]. The role of stratospheric ozone depletion contributes to the asymmetry, and increased greenhouse gases (GHG) and ozone depletion cause dramatic changes in Southern Hemisphere circulation; the anticipated recovery from ozone depletion may offset the changes that respond to the increasing GHG [10]. In addition, the rapid decrease of Arctic sea ice and slight increase of Antarctic sea ice also play a role in the asymmetry of polar amplification [10].
Antarctica, similar to the Arctic, is located at the farthest end of the Earth and plays a vital role in the climate system [11]. Changes in Antarctica have a profound influence on sea levels and marine ecosystems, and further influence the Earth and human society [11,12,13]. Unlike the uniform warming over the Arctic, the change in Antarctic temperature has been inhomogeneous in recent years. From 1950 to the end of the 20th Century, the Antarctic Peninsula was considered one of the fastest warming regions on the Earth [14]. However, the fast warming signal has been absent since the beginning of the 21st Century, which is mainly due to the internal variability of the atmospheric circulation [15]. Similarly, West Antarctica has also experienced rapid warming in winter and spring, which is related to tropical Pacific temperature variability [16,17]. However, the temperature over East Antarctica cools down slightly, especially in summer and autumn, which is influenced by the strengthening of the midlatitude jet [18,19,20].
Due to the harsh environment in Antarctica, the establishment and maintenance of meteorological stations is very difficult, which leads to a scarcity of complete and continuous observations data [21,22]. Assessing Antarctic climate change is a well-recognized challenge owing to this limited data. Affected by the multiple factors described above, most research on polar amplification refers to Arctic amplification. Antarctic amplification receives relatively little attention. In recent years, however, reanalysis data and model data have developed rapidly, and have been widely used to study climate change over Antarctica, and the attention given to Antarctic amplification is gradually strengthening [23,24,25].
However, no published study has yet examined the Antarctic amplification based on satellite data. In this paper, we investigate changes in the near-surface temperature over Antarctica and its subregions from reconstruction data based on Moderate Resolution Imaging Spectroradiometer (MODIS) data and measured data, and further explore and make a quantitative analysis of Antarctic amplification.
2. Data and Methods
2.1. Data
The monthly reconstruction dataset over the Antarctic Ice Sheet (AIS) is produced based on the average LST datasets MODIS Level 3 data product MOD11C3v006, MYD11C3v006 and near-surface air temperature observations from 119 Antarctic weather stations, spanning January 2001 to December 2018, and July 2002 and December 2018, which is available at http://poles.tpdc.ac.cn/zh-hans/data/c8503910-3a7e-4553-af19-1c23fb5adfba/ (accessed on 10 September 2022) [26]. The MOD11C3v006 and MYD11C3v006 are derived by compositing and averaging the values from the corresponding month of Terra and Aqua global daily files, and synthesized by the NASA MODIS Data Working Group after a series of preprocessing. A correlativity study showed that the reconstruction performs better in representing the temperature in Antarctica, compared to ERA5 [26], which reanalysis data is produced by ECMWF (European Centre for Medium-Range Weather Forecasts), and has high skill in representing the Antarctic temperature [22].
To further assess the AnA, we also employ the CRU TS (Climatic Research Unit gridded Time Series) v4.06 Data, which is provided by the UK National Centre for Atmospheric Science (NCAS). Based on the station observations, the CRU monthly data covers all the land areas, excluding Antarctica, at 0.5° × 0.5° resolution [27], and the data can be downloaded from the website https://crudata.uea.ac.uk/cru/data/hrg/ (accessed on 10 September 2022). ERA5 reanalysis data are used to explore the role of the ocean and the possible mechanisms affecting AnA.
2.2. Methods
F test is used to estimate the significance of the temperature trends, with significance set at the 95% confidence level. To avoid extreme values when the trend in the Southern Hemisphere (SH) is close to zero, we imitate the new definition of the Arctic amplification index [28], and employ the formula TAIS = a0 + a1 × TSH + ε, where TAIS and TSH represent the temperature anomalies over the AIS and SH. The ordinary linear least squares solution determines parameters a0, a1 and ε, and the slope of the regression a1 is the AnA index.
3. Results
3.1. Temperature Change over Antarctica and Its Subregions
During the period 2001–2018, the annual temperature in Antarctica shows a negative trend of −0.12 °C per decade, and the temperature change in Antarctica exhibits seasonal differences (Figure 1). For Antarctica, the warming signal can be observed in austral spring and summer, with the trend of 0.13 and 0.21 °C per decade, whereas the temperature cools in austral autumn and winter. In addition, the variations in Antarctic temperature illustrate regional differences. On an annual scale, the subregions of East Antarctica, West Antarctica and the Antarctic Peninsula exhibit a negative trend, with the fastest cooling occurring in West Antarctica, with the trend of −0.22 °C per decade. In austral spring, East Antarctica shows the most obvious warming of 0.52 °C per decade, and a cooling signal can be captured in the other regions. The warming signal in Antarctica and its subregions can be observed in austral summer, with the fastest change in West Antarctica. In austral autumn and winter, only the Antarctic Peninsula exhibits a positive trend. In addition, Figure 1 also displays the annual and seasonal temperature changes in the Southern Hemisphere and in its land only region. Clearly, the temperature in the Southern Hemisphere warms in all cases, and the increasing trends in the Southern Hemisphere land region only appear in austral spring and summer, indicating that oceans are crucial to the temperature change in the Southern Hemisphere.
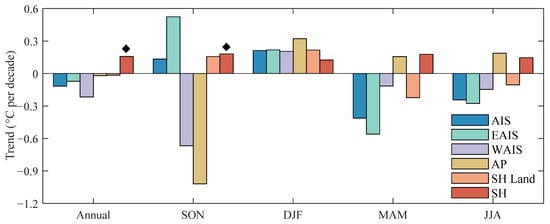
Figure 1.
Linear trends (°C per decade) of near-surface air temperature from reconstruction over the Antarctic Ice Sheet (AIS), and the subregions of East Antarctic Ice Sheet (EAIS), West Antarctic Ice Sheet (WAIS) and Antarctic Peninsula (AP), the land region of the Southern Hemisphere (SH) and the SH, respectively. The trend is on an annual and austral spring (SON, September–November), summer (DJF, December–February), autumn (MAM, March–May), and winter (JJA, June–August) basis, respectively. “ ” represent a trend that passes the 95% significance test.
” represent a trend that passes the 95% significance test.
Figure 2 shows the distribution of annual and seasonal temperature trends during the period 2001–2018 over Antarctica. The change of temperature is inhomogeneous, which corresponds to the regional differences in regional average temperature changes. On an annual scale, the warming trend can be observed in Dronning Maud Land and coastal East Antarctica. In SON (September–November), the warming is widely occurring in East Antarctica, and is absent in West Antarctica and the Antarctic Peninsula. Antarctica shows a warming of summer temperatures, and only a few areas show a decrease in temperature. The spatial pattern of temperature changes in autumn and spring in Antarctica presents the opposite distribution, and a cooling trend can be observed in East Antarctica in MAM (March–May) and a warming one in West Antarctica and the Antarctic Peninsula. During the winter time, an obvious warming appears in the 70° E to 150° E sector in Antarctic inland. The changes in temperature are not limited to the near-surface, and the mid-troposphere has warmed in all seasons during the period 1961–2010 [29]. In addition, the obvious warming at 500 hPa can be observed in austral spring and winter, which is similar to the variations in surface temperature [29]. However, this pattern changes and even reverses in spring, which displays the great warming in East Antarctica.
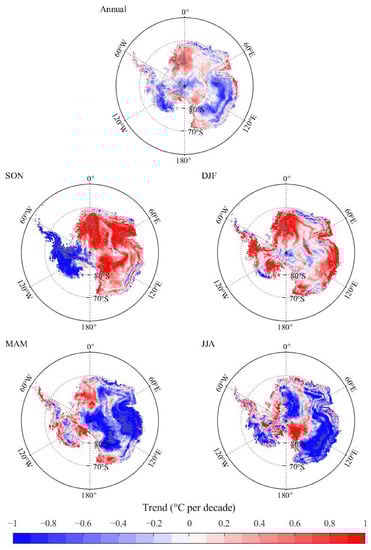
Figure 2.
The distribution of temperature trend (°C per decade) over Antarctica for annual, austral spring (SON, September–November), summer (DJF, December–February), autumn (MAM, March–May), winter (JJA, June–August), mean from reconstruction, respectively. The gray shaded areas are those with trends significant at the 95% confidence level.
3.2. Antarctic Amplification Assessment in the Southern Hemisphere
To explore whether the AnA phenomenon exists, we calculated the annual and seasonal AnA index for Antarctica and its three subregions, which are summarized in Table 1. Compared to the land region in the Southern Hemisphere, AnA occurs, with the amplification index of 1.46, 1.42, 1.39, 1.41 and 1.50 in annual, SON, DJF (December–February), MAM and JJA (June–August), respectively. Clearly, the AnA is strongest in austral winter, and weakest in summer. AnA also exhibits seasonal and regional differences. On an annual scale, the greatest amplification appears in East Antarctica, followed by West Antarctica, and AnA is absent at the Antarctic Peninsula; the corresponding amplification index is 1.67, 1.10 and −0.50, respectively. The AnA of East Antarctica is most conspicuous in austral spring, with an amplification of 1.61, and the West Antarctic amplification is strong in winter. However, the seasonal amplification of the Antarctic Peninsula always disappears. The spatial patterns of the annual and seasonal amplification index over Antarctica are shown in Figure 3. On an annual scale, AnA concentrates on the East Antarctica, and the signal is absent in the East Antarctic coast and the Antarctic Peninsula. Similarly, the seasonal amplification basically domains East Antarctica. In DIF, amplification can be observed in the western side of Antarctic Peninsula, and generally disappears in the other seasons. In addition, the summer amplification in West Antarctica only appears in the coastal area, while it occurs elsewhere in other cases.

Table 1.
Amplification index of annual and seasonal temperature in the Antarctic Ice Sheet (AIS), and the subregions of East Antarctic Ice Sheet (EAIS), West Antarctic Ice Sheet (WAIS) and Antarctic Peninsula (AP). The bold indicates that the r2 of regression is higher than 0.7.
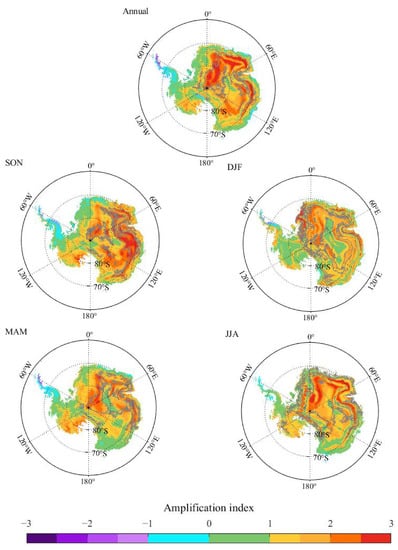
Figure 3.
Spatial patterns of the amplification index that compared the change of land region in the Southern Hemisphere to the Antarctica for annual, austral spring (SON, September–November), summer (DJF, December–February), autumn (MAM, March–May), winter (JJA, June–August), mean from reconstruction, respectively. The gray line outlines areas with r2 > 0.7.
The ocean plays an important role in the Southern Hemisphere. The amplification index compared to the whole region (land and ocean) in the Southern Hemisphere was calculated (Table 1). On the whole, the intensity of the AnA becomes strong when the influence of the ocean is considered. The annual amplification occurs in Antarctica and its subregions, with the amplification index of 1.82, 2.15, 1.26 and −1.41 in Antarctica, East Antarctica, West Antarctica and the Antarctic Peninsula, respectively. For Antarctica, amplification is strongest in JJA, and weakest in spring. Among the three subregions, the East Antarctic amplification is most obvious, with a seasonal amplification index higher than 2.74, and is weakest in the Antarctic Peninsula. The spatial patterns of the amplification index over Antarctica that consider the influence of the ocean are shown in Figure 4. On an annual scale, AnA also concentrates on East Antarctica, and is absent in West Antarctica. Unlike on the land region, a strong amplification signal can be observed in the western side of the Antarctic Peninsula. On a seasonal scale, the occurrence of amplification affects all domains of Antarctica in general.
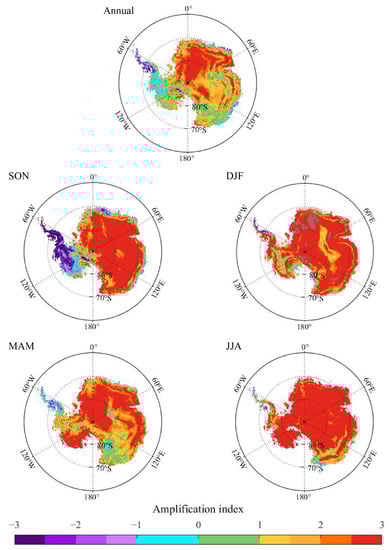
Figure 4.
Similar to Figure 3, but compared to the change of whole region (land and ocean) in the Southern Hemisphere.
The Southern Annular Mode (SAM) is considered to be an important factor affecting the change of Antarctic near-surface temperature [30]. The annual correlation coefficients between SAM and temperature anomaly in Antarctica, East Antarctica, West Antarctica and the Antarctic Peninsula are −0.74, −0.72, −0.64 and 0.18, respectively (Figure 5). For Antarctica, SAM has a great impact on the temperature change in austral autumn and winter, with the significant correlation coefficients of 0.87 and 0.90. Among the subregions, SAM has the lowest correlation with temperature change on the Antarctic Peninsula, and the correlation coefficient (0.22) is the largest in autumn. Moreover, the influence of SAM in the temperature change in East Antarctica and West Antarctica is most conspicuous in austral winter, with the significant correlation coefficients higher than −0.80.
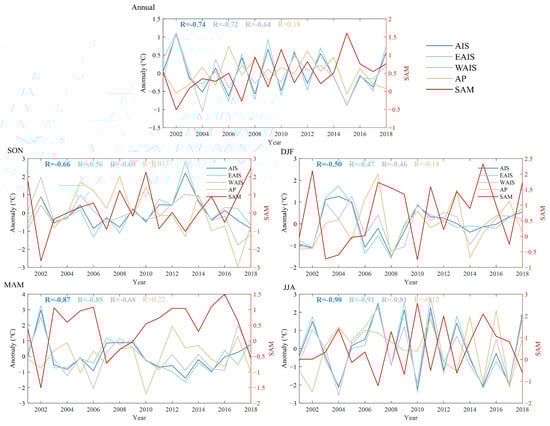
Figure 5.
Time series of near-surface air temperature anomalies, from reconstruction, spatially averaged over Antarctic Ice Sheet (AIS), and the subregions of the East Antarctic Ice Sheet (EAIS), West Antarctic Ice Sheet (WAIS) and Antarctic Peninsula (AP), and the time series of Southern Annular Mode (SAM) index, for annual, austral spring (SON, September–November), summer (DJF, December–February), autumn (MAM, March–May), winter (JJA, June–August), respectively. Bold represents a correlation coefficient that passes the 95% significance test.
The intensity of AnA is different in different periods, and was strongest in 2005–2014, and the spring warming in Antarctica is 1.83 °C per decade, with the amplification index of 4.78. Therefore, this period was selected to further explore the mechanism of temperature change. In SON, the correlation coefficients between SAM and the temperature anomaly in Antarctica, East Antarctica, West Antarctica and Antarctic Peninsula is −0.61, −0.65, −0.27 and 0.76, respectively (Figure 6). Attention should be paid to the significant impact of SAM on the temperature change in the Antarctic Peninsula. Negative correlations between SAM and temperature anomaly affect all domains in East Antarctica, and positive correlation coefficients can be observed in the Antarctic Peninsula. In addition, the spring surface pressure increases in East Antarctica and West Antarctica, with a high value center in inland Antarctic, and a decrease in the Antarctic Peninsula, the Weddell Sea and Drake Passage (Figure 7). In East Antarctica, a high positive correlation between surface pressure and temperature can be observed, and this positive correlation also exists in the Ross Ice Shelf. It should be noted that the correlation seems to be related to the terrain. The westerly jet also has a great impact on the Antarctic temperature (Figure 8). The jet speed is positively correlated with temperature on the Antarctic Peninsula, and a negative correlation can be observed in 70 °E to 170 °E sector in East Antarctica. Moreover, the location of the westerly jet affects the Antarctic temperature. During the period 2005–2014, the center of westerlies moved northward, and positive correlations between the jet latitude index and temperature occurred in West Antarctica and the 70 °E to 170 °E sector in East Antarctica, while negative correlation appeared in the Antarctic Peninsula. Changes in sea ice also have an important effect on the temperature over the Antarctic coast by influencing circulation and the flux of heat from the ocean [15]. The annual average of the Antarctic sea ice extent exhibited a strong increase from 1979 to 2014, and then decreased [31]. During 2005–2014, the Antarctic Peninsula exhibited a downward tendency, and this connected to increases in sea ice over the northern Antarctic Peninsula and the northern part of the Weddell Sea, which was associated with strengthening cyclonic conditions in the Drake Passage and northwestern Weddell Sea. This circulation caused cold air to be transported towards the Antarctic Peninsula [15]. In austral spring, the sea ice in the Amundsen and Bellingshausen seas decreases, and 80% warming over the Antarctic Peninsula and 20−30% warming over inland West Antarctica are consistent with variations in the Bellingshausen Sea ice [32].
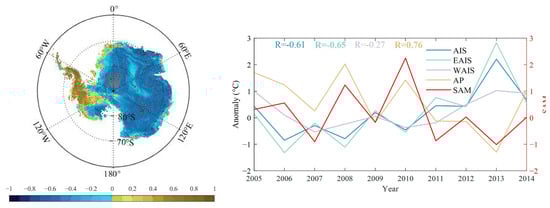
Figure 6.
Spatial patterns of correlation coefficients in SON, mean Southern Annular Mode (SAM) index and the temperature over Antarctica during the period 2005–2014, and the time series of temperature anomalies from reconstruction, spatially averaged over the Antarctic Ice Sheet (AIS), and the subregions of the East Antarctic Ice Sheet (EAIS), West Antarctic Ice Sheet (WAIS) and Antarctic Peninsula (AP), and the time series of the SAM index. The gray shaded areas represent a correlation coefficient that passes the 95% significance test.
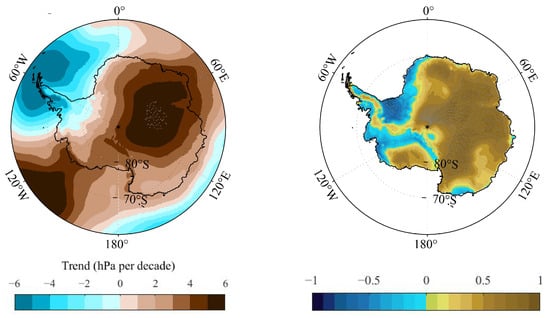
Figure 7.
Spatial patterns of the trend in surface pressure in SON, and the correlation coefficients in surface pressure and near-surface temperature over Antarctica during the period 2005–2014. The gray shaded areas represent a correlation coefficient that passes the 95% significance test.
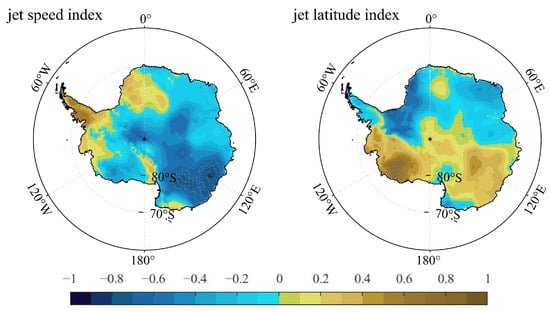
Figure 8.
Spatial patterns of correlation coefficients in SON mean temperature and jet latitude index (left), and jet speed index (right) over the Antarctica during the period 2005–2014. The gray shaded areas represent a correlation coefficient that passes the 95% significance test.
4. Discussion
The variations in Antarctic temperature from reconstruction during the period 2002–2018 is inhomogeneous, whereas the spatial distribution characteristics are different from those in the second half of the 20th century [14]. Attention should be paid to the conspicuous warming of spring temperatures and their amplification over East Antarctica. This phenomenon also can be observed in the temperature change during the period 1979–2019 from ERA5, although the warming of West Antarctica and the Antarctic Peninsula also exists in the meantime [25]. Ice core records of oxygen isotopes from coastal Dronning Maud Land also found warming of 0.45 °C per decade during the period 1942–2019, which coincides with the increase in ENSO events and its strong antiphase relation with SAM [33]. Moreover, there is a strong connection between autumn climate change in western East Antarctica and ENSO [34]. The autumn temperature over East Antarctica cools down, and is associated with increased La Niña conditions, which can increase anticyclonic circulation over the South Atlantic and induce cold air advection [20]. The warming over the Antarctic Peninsula is closely related to atmospheric circulation, which is influenced by climate change in the tropics [35]. In addition, the increasing sea surface temperature in the Tasman Sea can change the Southern Ocean storm track and deepens the Amundsen Sea low, which can induce warm advection and induce winter warming over the Antarctic Peninsula [36].
The amplification of Antarctica is weaker than that of the Arctic, which is related to the weaker surface albedo feedback and stronger ocean heat uptake in the Southern Ocean [7,37]. The amplification of the Arctic subregions of the Barents and Kara seas (BK), East Siberian and Laptev seas (ESL), Beaufort and Chukchi seas (BC), Canadian Archipelago and Baffin Bay (ArB), Greenland Sea (Gre), Sea of Okhotsk (Okh) and Bering Sea (Ber) show that the intensity of Arctic amplification increased during the period 1990–2010, and illustrated a slight downward trend after 2010, with the exception of Ber and BC [38]. Local atmospheric blocking is the main contributor to the appearance of regional Arctic amplification [38]. Eddy heat fluxes are vital for transferring heat between low and high latitudes, and was significantly enhanced in the Southern Hemisphere around 2000, which is related to the cooling of the surface temperature of the Southern Ocean in recent decades [39], and weakens the overall temperature change in the Southern Hemisphere. In this study, the influence of ocean heat uptake is reflected in the amplification index, with the index that considered the influence of the ocean higher than that which only considered the land region. In addition, the undulating topography of Antarctica also plays an important role in the slower warming and the weaker AnA [7]. If the elevation of the Antarctic Ice Sheet decreases, the troposphere over Antarctica will become warmer and wetter, and the energy transported towards the Antarctic from the lower latitudes will be enhanced [40]. On an annual scale, surface albedo feedback contributes most to polar amplification, followed by net cloud feedback. In addition, external forcing and atmospheric dynamic transport play a positive role in polar amplification, whereas water vapor feedback weakens polar amplification because it causes more intense warming in low latitudes [41]. The exploration of Antarctic amplification is mostly based on model data and reanalysis data, and the mechanisms of Antarctic temperature change are still not fully understood and are limited by observation data. In addition, processes such as the large-scale sea–air interaction have not been directly detected [24,42]. Future research needs to more closely combine measured data, reanalysis data and satellite data, and use this multisource data to deeply explore Antarctic amplification and the potential mechanisms of temperature change over Antarctica.
It is important to note that the study is based on a short record from 2002 to 2018, and the trend may not be robust. Research has pointed out that the cooling of the Antarctic Peninsula in 1995–2015 may be highly sensitive to the choice of time interval, and the temperature changes are consistent with internal variability, when time segments are shorter than 30 years [43]. Therefore, the results above are specific to the 18 years studied.
5. Conclusions
In this study, temperature changes in the Antarctic Ice Sheet and its subregions of East Antarctica, West Antarctica and the Antarctic Peninsula during the period 2001–2018 based on reconstruction, have been analyzed. On this basis, we explored the existence of Antarctic amplification (AnA) and calculated an amplification index to quantify the intensity of AnA.
Based on reconstruction, the variations in temperature over Antarctica exhibit seasonal differences, with a warming trend in austral spring and summer, and cooling in autumn and winter. In addition, regional differences can be observed. In austral spring, East Antarctica illustrates an obvious warming, whereas the warming signal is absent in West Antarctica and the Antarctic Peninsula, and the opposite pattern occurs in autumn.
On an annual and seasonal scale, the signal of AnA can be captured, with an amplification index higher than 1.39, and the amplification is strong in austral spring and winter. AnA also displays seasonal and regional differences. Among the subregions, the amplification in East Antarctica is most conspicuous, with an annual amplification index of 1.67, and the amplification is strong in austral spring and winter. For West Antarctica, the greatest amplification occurs in winter, followed by autumn, and the weakest signal appears in austral spring. However, AnA in the Antarctic Peninsula cannot be observed in all cases. When considering the influence of the ocean, the intensity of AnA increases in general, and amplification is still most obvious in East Antarctica. The warming amplification was strongest in spring during 2005–2014, which is influenced by the Southern Annular Mode, surface pressure and westerlies, and this effect is particularly evident in East Antarctica.
This study illustrates the existence of AnA, with seasonal and regional differences in terms of changes in temperature. However, the mechanism of temperature change over Antarctica and AnA is not known clearly, and future research needs more observation data to explore the influencing factors.
Author Contributions
Conceptualization, J.Z. and A.X.; methodology, J.Z. and A.X.; software, J.Z. and B.X.; validation, A.X., X.Q. and Y.W.; formal analysis, J.Z.; resources, A.X.; writing—original draft preparation, J.Z.; writing—review and editing, A.X. and X.Q.; visualization, J.Z.; supervision, A.X.; project administration, A.X. All authors have read and agreed to the published version of the manuscript.
Funding
This research was funded by the National Natural Science Foundation of China, grant number 42276260 and 41671073, and the 2021 technical support talent project of the Chinese Academy of Sciences.
Institutional Review Board Statement
Not applicable.
Informed Consent Statement
Not applicable.
Data Availability Statement
ReERA5 data presented in this study are openly available at https://cds.climate.copernicus.eu/#!/search?text=ERA5&type=dataset (accessed on 10 September 2022). Reconstructions are openly available at http://poles.tpdc.ac.cn/zh-hans/data/c8503910-3a7e-4553-af19-1c23fb5adfba/ (accessed on 10 September 2022), and the CRU TS v4.06 data can be downloaded from the website https://crudata.uea.ac.uk/cru/data/hrg/ (accessed on 10 September 2022).
Acknowledgments
We thank Zhang X.Y., Wang Y.T., the National Centre for Atmospheric Science and European Center for Medium-Range Weather Forecasts for providing data to improve the paper.
Conflicts of Interest
The authors declare no conflict of interest.
References
- Holland, M.M.; Bitz, C.M. Polar amplification of climate change in coupled models. Clim. Dynam. 2003, 21, 221–232. [Google Scholar] [CrossRef]
- Pithan, F.; Mauritsen, T. Arctic amplification dominated by temperature feedbacks in contemporary climate models. Nat. Geosci. 2014, 7, 181–184. [Google Scholar] [CrossRef]
- Stuecker, M.F.; Bitz, C.M.; Armour, K.C.; Proistosescu, C.; Kang, S.M.; Xie, S.P.; Kim, D.; McGregor, S.; Zhang, W.J.; Zhao, S.; et al. Polar amplification dominated by local forcing and feedbacks. Nat. Clim. Chang. 2018, 8, 1076–1081. [Google Scholar] [CrossRef]
- Graversen, R.G.; Mauritsen, T.; Tjernstrom, M.; Kallen, E.; Svensson, G. Vertical structure of recent Arctic warming. Nature 2008, 451, 53–56. [Google Scholar] [CrossRef] [PubMed]
- Screen, J.A.; Simmonds, I. The central role of diminishing sea ice in recent Arctic temperature amplification. Nature 2010, 464, 1334–1337. [Google Scholar] [CrossRef]
- Goosse, H.; Kay, J.E.; Armour, K.C.; Bodas-Salcedo, A.; Chepfer, H.; Docquier, D.; Jonko, A.; Kushner, P.J.; Lecomte, O.; Massonnet, F.; et al. Quantifying climate feedbacks in polar regions. Nat. Commun. 2018, 9, 1919. [Google Scholar] [CrossRef]
- Salzmann, M. The polar amplification asymmetry: Role of Antarctic surface height. Earth Syst. Dynam. 2017, 8, 323–336. [Google Scholar] [CrossRef]
- Smith, D.M.; Screen, J.A.; Deser, C.; Cohen, J.; Fyfe, J.C.; Garcia-Serrano, J.; Jung, T.; Kattsov, V.; Matei, D.; Msadek, R.; et al. The Polar Amplification Model Intercomparison Project (PAMIP) contribution to CMIP6: Investigating the causes and consequences of polar amplification. Geosci. Model Dev. 2019, 12, 1139–1164. [Google Scholar] [CrossRef]
- Södergren, A.H.; McDonald, A.J. Quantifying the Role of Atmospheric and Surface Albedo on Polar Amplification Using Satellite Observations and CMIP6 Model Output. J. Geophys. Res. Atmos. 2022, 127, e2021JD035058. [Google Scholar] [CrossRef]
- Screen, J.A.; Bracegirdle, T.J.; Simmonds, I. Polar Climate Change as Manifest in Atmospheric Circulation. Curr. Clim. Chang. Rep. 2018, 4, 383–395. [Google Scholar] [CrossRef]
- Rintoul, S.R.; Chown, S.L.; DeConto, R.M.; England, M.H.; Fricker, H.A.; Masson-Delmotte, V.; Naish, T.R.; Siegert, M.J.; Xavier, J.C. Choosing the future of Antarctica. Nature 2018, 558, 233–241. [Google Scholar] [CrossRef] [PubMed]
- Ducklow, H.W.; Baker, K.; Martinson, D.G.; Quetin, L.B.; Ross, R.M.; Smith, R.C.; Stammerjohn, S.E.; Vernet, M.; Fraser, W. Marine pelagic ecosystems: The West Antarctic Peninsula. Phil. Trans. R. Soc. B 2007, 362, 67–94. [Google Scholar] [CrossRef] [PubMed]
- Wong, T.E.; Bakker, A.M.R.; Keller, K. Impacts of Antarctic fast dynamics on sea-level projections and coastal flood defense. Clim. Chang. 2017, 144, 347–364. [Google Scholar] [CrossRef]
- Steig, E.J.; Schneider, D.P.; Rutherford, S.D.; Mann, M.E.; Comiso, J.C.; Shindell, D.T. Warming of the Antarctic ice-sheet surface since the 1957 International Geophysical Year. Nature 2009, 457, 459–462. [Google Scholar] [CrossRef]
- Turner, J.; Lu, H.; White, I.; King, J.C.; Phillips, T.; Hosking, J.S.; Bracegirdle, T.J.; Marshall, G.J.; Mulvaney, R.; Deb, P. Absence of 21st century warming on Antarctic Peninsula consistent with natural variability. Nature 2016, 535, 411–415. [Google Scholar] [CrossRef]
- Bromwich, D.H.; Nicolas, J.P.; Monaghan, A.J.; Lazzara, M.A.; Keller, L.M.; Weidner, G.A.; Wilson, A.B. Central West Antarctica among the most rapidly warming regions on Earth. Nat. Geosci. 2013, 6, 139–145. [Google Scholar] [CrossRef]
- Nicolas, J.P.; Bromwich, D.H. New Reconstruction of Antarctic Near-Surface Temperatures: Multidecadal Trends and Reliability of Global Reanalyses. J. Clim. 2014, 27, 8070–8093. [Google Scholar] [CrossRef]
- Turner, J.; Colwell, S.R.; Marshall, G.J.; Lachlan-Cope, T.A.; Carleton, A.M.; Jones, P.D.; Lagun, V.; Reid, P.A.; Iagovkina, S. Antarctic climate change during the last 50 years. Int. J. Climatol. 2005, 25, 279–294. [Google Scholar] [CrossRef]
- Monaghan, A.J.; Bromwich, D.H.; Chapman, W.; Comiso, J.C. Recent variability and trends of Antarctic near-surface temperature. J. Geophys. Res. Atmos. 2008, 113, D04105. [Google Scholar] [CrossRef]
- Clem, K.R.; Renwick, J.A.; McGregor, J. Autumn Cooling of Western East Antarctica Linked to the Tropical Pacific. J. Geophys. Res. Atmos. 2018, 123, 89–107. [Google Scholar] [CrossRef]
- Huai, B.J.; Wang, Y.T.; Ding, M.H.; Zhang, J.L.; Dong, X. An assessment of recent global atmospheric reanalyses for Antarctic near surface air temperature. Atmos. Res. 2019, 226, 181–191. [Google Scholar] [CrossRef]
- Zhu, J.P.; Xie, A.H.; Qin, X.; Wang, Y.T.; Xu, B.; Wang, Y.C. An Assessment of ERA5 Reanalysis for Antarctic Near-Surface Air Temperature. Atmosphere 2021, 12, 217. [Google Scholar] [CrossRef]
- Hahn, L.C.; Armour, K.C.; Zelinka, M.D.; Bitz, C.M.; Donohoe, A. Contributions to Polar Amplification in CMIP5 and CMIP6 Models. Front. Earth Sci. 2021, 9, 710036. [Google Scholar] [CrossRef]
- Wang, S.M.; Xie, A.H.; Zhu, J.P. Does polar amplification exist in Antarctic surface during the recent four decades? J. Mt. Sci. 2021, 18, 2626–2634. [Google Scholar] [CrossRef]
- Xie, A.H.; Zhu, J.P.; Kang, S.C.; Qin, X.; Xu, B.; Wang, Y.C. Polar amplification comparison among Earth’s three poles under different socioeconomic scenarios from CMIP6 surface air temperature. Sci. Reps. 2022, 12, 16548. [Google Scholar] [CrossRef]
- Zhang, X.Y.; Dong, X.; Zeng, J.; Hou, S.G.; Smeets, P.; Reijmer, C.H.; Wang, Y.T. Spatiotemporal Reconstruction of Antarctic Near-Surface Air Temperature from MODIS Observations. J. Clim. 2022, 35, 5537–5553. [Google Scholar] [CrossRef]
- Harris, I.; Osborn, T.J.; Jones, P.; Lister, D. Version 4 of the CRU TS monthly high-resolution gridded multivariate climate dataset. Sci. Data 2020, 7, 109. [Google Scholar] [CrossRef]
- Fang, M.; Li, X.; Chen, H.W.; Chen, D. Arctic amplification modulated by Atlantic Multidecadal Oscillation and greenhouse forcing on multidecadal to century scales. Nat. Commun. 2022, 13, 1865. [Google Scholar] [CrossRef]
- Screen, J.A.; Simmonds, I. Half-century air temperature change above Antarctica: Observed trends and spatial reconstructions. J. Geophys. Res. 2012, 117, D16108. [Google Scholar] [CrossRef]
- Marshall, G.J. Half-century seasonal relationships between the Southern Annular mode and Antarctic temperatures. Int. J. Climatol. 2007, 27, 373–383. [Google Scholar] [CrossRef]
- Simmonds, I.; Li, M. Trends and variability in polar sea ice, global atmospheric circulations, and baroclinicity. Ann. N. Y. Acad. Sci. 2021, 1504, 167–186. [Google Scholar] [CrossRef] [PubMed]
- Schneider, D.P.; Deser, C.; Okumura, Y. An assessment and interpretation of the observed warming of West Antarctica in the austral spring. Clim. Dyn. 2012, 38, 323–347. [Google Scholar] [CrossRef]
- Ejaz, T.; Rahaman, W.; Laluraj, C.M.; Mahalinganathan, K.; Thamban, M. Rapid Warming Over East Antarctica Since the 1940s Caused by Increasing Influence of El Nino Southern Oscillation and Southern Annular Mode. Front. Earth Sci. 2022, 10. [Google Scholar] [CrossRef]
- Marshall, G.J.; Thompson, D.W.J. The signatures of large-scale patterns of atmospheric variability in Antarctic surface temperatures. J. Geophys. Res. Atmos. 2016, 121, 3276–3289. [Google Scholar] [CrossRef]
- Ciasto, L.M.; Simpkins, G.R.; England, M.H. Teleconnections between Tropical Pacific SST Anomalies and Extratropical Southern Hemisphere Climate. J. Clim. 2015, 28, 56–65. [Google Scholar] [CrossRef]
- Sato, K.; Inoue, J.; Simmonds, I.; Rudeva, I. Antarctic Peninsula warm winters influenced by Tasman Sea temperatures. Nat. Commun. 2021, 12, 1497. [Google Scholar] [CrossRef]
- Marshall, J.; Armour, K.C.; Scott, J.R.; Kostov, Y.; Hausmann, U.; Ferreira, D.; Shepherd, T.G.; Bitz, C.M. The ocean’s role in polar climate change: Asymmetric Arctic and Antarctic responses to greenhouse gas and ozone forcing. Philos. Trans. R. Soc. A 2014, 372, 20130040. [Google Scholar] [CrossRef]
- Zhuo, W.Q.; Yao, Y.; Luo, D.F.; Simmonds, I.; Huang, F. The key atmospheric drivers linking regional Arctic amplification with East Asian cold extremes. Atmos. Res. 2023, 283, 106557. [Google Scholar] [CrossRef]
- Chemke, R.; Polvani, L.M. Linking midlatitudes eddy heat flux trends and polar amplification. Npj Clim. Atmos. Sci. 2020, 3, 8. [Google Scholar] [CrossRef]
- Tewari, K.; Mishra, S.K.; Dewan, A.; Dogra, G.; Ozawa, H. Influence of the height of Antarctic ice sheet on its climate. Polar Sci. 2021, 28, 100642. [Google Scholar] [CrossRef]
- Taylor, P.C.; Cai, M.; Hu, A.X.; Meehl, J.; Washington, W.; Zhang, G.J. A Decomposition of Feedback Contributions to Polar Warming Amplification. J. Clim. 2013, 26, 7023–7043. [Google Scholar] [CrossRef]
- Holland, P.R.; Jenkins, A.; Holland, D.M. Ice and ocean processes in the Bellingshausen Sea, Antarctica. J. Geophys. 2010, 115, C05020. [Google Scholar] [CrossRef]
- Gonzalez, S.; Fortuny, D. How robust are the temperature trends on the Antarctic Peninsula? Antarct. Sci. 2018, 30, 322–328. [Google Scholar] [CrossRef]
Disclaimer/Publisher’s Note: The statements, opinions and data contained in all publications are solely those of the individual author(s) and contributor(s) and not of MDPI and/or the editor(s). MDPI and/or the editor(s) disclaim responsibility for any injury to people or property resulting from any ideas, methods, instructions or products referred to in the content. |
© 2023 by the authors. Licensee MDPI, Basel, Switzerland. This article is an open access article distributed under the terms and conditions of the Creative Commons Attribution (CC BY) license (https://creativecommons.org/licenses/by/4.0/).