Article

Research on Typhoon Multi-Stage Cloud Characteristics Based on Deep Learning

1
Academy of Eco-Civilization Development for Jing-Jin-Ji Megalopolis, Tianjin Normal University, Tianjin 300378, China
2
Institute of Disaster Prevention, College of Ecology and Environment, Beijing 101601, China
3
Faculty of Architecture and Urban Planning, Chongqing University, Chongqing 400044, China
*
Authors to whom correspondence should be addressed.
Atmosphere 2023, 14(12), 1820; https://doi.org/10.3390/atmos14121820
Submission received: 17 November 2023 / Revised: 6 December 2023 / Accepted: 6 December 2023 / Published: 13 December 2023
(This article belongs to the Section Meteorology)

Abstract

:
Analyzing the development and evolution characteristics of typhoons are conducive to improving typhoon monitoring and optimizing early warning models. Based on the deep learning model YOLOv5 and Himawari-8 data products, this study analyzes the movement path and cloud evolution of typhoon “Infa”. The specific conclusions of this study are as follows. (1) Based on the YOLOv5 model and brightness temperature perturbation algorithm, the central positioning of the typhoon is realized, where the Himawari-8 bright temperature image is used as the input of the model and the output of the model is the typhoon range boundary. The results show that this method was 90% accurate for monitoring ocular typhoons and 83% accurate for blind typhoons. The typhoon center location determined by the brightness temperature perturbation algorithm closely matched the CMA best-path dataset (CMA) (goodness of fit ≈0.99). (2) This study observed that as typhoons developed, cloud parameters evolved with the cloud cluster becoming denser. However, as the typhoon neared land, the cloud structure collapsed and cloud parameters decreased rapidly. (3) Changes in the typhoon cloud system were linked to topography and surface temperature. Changes in cloud optical thickness (COT) were influenced by the digital elevation model (correlation −0.18), while changes in cloud top temperature (CTT) and cloud top height (CTH) were primarily affected by surface temperature changes (correlation values: CTT −0.69, CTH −0.37). This suggests that the ocean environment supports the vertical development of typhoon clouds and precipitation. In summary, this study optimized the positioning simulation of typhoon movement paths and cloud change trends, and this is helpful for improving the early warning and response-ability of typhoons in coastal cities and for reducing the threat of typhoons to the daily life of residents in coastal areas.

1. Introduction

Typhoons are highly harmful weather systems that are typically accompanied by strong winds and heavy rains and often cause serious economic losses and casualties during landing. China is located in the northwest Pacific region with frequent typhoons and is one of the countries that are most affected by typhoons worldwide. However, the evolution of typhoons is a result of the joint action and mutual influence of various driving factors. Their formation and development also exert real-time, dynamic, and direct effects on various parameters, such as the cloud phase, atmospheric boundary layer height, and temperature within their radius range [1,2]. However, typhoon movement trends exhibit significant variability and uncertainty under the influence of various complex weather conditions. Therefore, it is important to analyze typhoon movement paths and cloud system changes to improve typhoon monitoring models and enhance disaster response capabilities.
With the development of satellite remote-sensing observation technology, meteorological satellite cloud images provide a more accurate and stable real-time monitoring method for typhoon changes and have become the primary means of typhoon monitoring [3]. Based on the textural characteristics of the typhoon cloud system in satellite cloud images, researchers have effectively located the typhoon center through artificial visual interpretation. However, subjective visual interpretation by researchers cannot satisfy the accuracy and timeliness requirements for typhoon positioning. Therefore, high-precision automatic typhoon monitoring technology has gradually become the focus of research [4], including wavelet transform, fractal geometry, and fuzzy theory [5,6]. Although these methods can improve the speed of typhoon monitoring, monitoring accuracy requires further improvement. Currently, deep learning technology is widely used in the field of image recognition, and certain scholars have begun to apply deep learning methods to typhoon classification. A deep learning model can extract and learn the textural features of clouds from satellite images to achieve automatic classification of typhoon clouds [7,8,9]. Reference [7] introduces a novel GCN-LSTM model framework by integrating graph convolutional network (GCN) and long short-term memory (LSTM) network structures, which can use satellite cloud images to classify and monitor typhoons of different grades. The experimental results demonstrate that the model can effectively improve the accuracy of typhoon classification. When considering the particularity of typhoon clouds, Shi [10] speculated that local rich texture information may be more important than global information. Based on this, it is recommended to use deep convolutional activation features (DCAF) for typhoon cloud classification. These methods effectively improve the accuracy of cloud classification; however, they exhibit limitations in regard to dealing with the special structures of typhoons (such as typhoon eyes and spiral cloud bands). Therefore, a number of scholars have begun to incorporate typhoon structures into monitoring frameworks to further improve the accuracy and applicability of typhoon monitoring. Zhao [11] located the typhoon area by detecting the eye of the typhoon. The experimental results indicate that this method can often obtain typhoon information from satellite cloud images. Tan [12] proposed a new large typhoon center location dataset (TCLD) to train the TCLNet model, and this improved the typhoon monitoring accuracy by 92.7%. In summary, technology based on deep learning has facilitated many breakthroughs in the field of typhoon monitoring; however, achieving real-time or near-real-time positioning speed based on improving monitoring accuracy remains an urgent problem that must be solved. Certain scholars believe that transforming the typhoon monitoring problem into a target detection problem and locating the typhoon area in the satellite cloud image without an in-depth analysis of the characteristics of the cloud system can significantly improve the efficiency of typhoon monitoring [13]. Compared to other deep learning algorithms, YOLOv5 (You Only Look Once version 5), as a deep learning network, has been widely used in target detection-related research due to its friendly deployment support and rapid training speed [14]. Therefore, combined with satellite cloud images, the YOLOv5 model can be used to quickly and accurately identify typhoon targets in real-time or near real-time, and this is of great significance for facilitating real-time warnings of typhoon paths.
In addition to typhoon monitoring, the change in typhoon characteristics is also an important direction of current research that helps researchers understand the evolution of typhoons more comprehensively. Most existing studies have simplified the typhoon into a single feature and then studied its changing trend in the development of typhoon movement such as precipitation [15,16]. Nayak [17] used typhoon wind speed as an important indicator for measuring the intensity of typhoons to analyze the trends of typhoons in Japan. Wu [18] analyzed the precipitation when Typhoon “Lekima” landed to quantify the intensity change after the typhoon landed. However, as a complex weather system, the development and evolution of typhoons are affected by the interactions among many factors. It is difficult to understand the microphysical processes of typhoon development and evolution fully by relying solely on a single characteristic parameter. In contrast, the cloud top height (CTH), cloud top temperature (CTT), and cloud optical thickness (COT) of typhoons are important characteristic parameters of cloud systems that play an important role in the internal structure and heat exchange process of typhoons. Therefore, it is very important to study the change trends of cloud parameters closely related to typhoon structure. The simulation and analysis of typhoon clouds in traditional studies typically requires the use of numerical models and parametric schemes to simulate their physical processes [19,20]. However, the existing parameterization schemes still possess certain limitations regarding the detailed characteristics and dynamic simulation of the typhoon cloud system [21,22]. Using satellite monitoring, researchers can effectively analyze the static structural characteristics of typhoons [23]. However, most satellites can only scan the same area twice each day (typically simultaneously), and this limits the dynamic assessment of typhoon cloud characteristics [24]. The Himawari-8 is a new generation of Japanese geostationary satellites that can monitor typhoon activity with finer spatial and temporal resolutions, and this is of great significance for the dynamic assessment of typhoon cloud structures [25]. L2 cloud products are widely used in typhoon-related research [26]. Himawari-8 L2 level cloud products can provide more comprehensive and detailed information.
In summary, based on a deep learning model, this study investigated the multistage cloud characteristics of typhoons. First, the YOLOv5 model was used to monitor typhoon targets in real-time to obtain typhoon location information. Based on the L2 level cloud product data from the Himawari-8 satellite, the dynamic characteristics of the typhoon cloud system were analyzed. This study possesses important scientific and application significance for typhoon monitoring.

2. Materials and Methods

2.1. Data Introduction

(1)
Himawari-8 satellite products
The Himawari-8 geostationary satellite which became operational on 7 July 2015 is a pioneer in the next generation of geosynchronous meteorological satellites. Himawari-8 possesses the capacity for 16 observed spectra, including three visible light, three near-infrared, and ten infrared bands that are primarily used to detect meteorological data, such as cloud characteristics, aerosol characteristics, and sea surface temperature. The observation area is 60 S–60 N and 80 E–160 W and covers most of the western North Pacific, and it provides a full scan every 1 h with a spatial resolution of 5 km [27,28]. In this study, the brightness temperature data of the 13-band infrared (wavelength:10.4) were selected as the original typhoon positioning data.
The Himawari-8 L2 cloud mask product (CMP) is developed based on the cloud-mask algorithm of the NoWCasting (NWC, Brussels, Belgium) Satellite Application Facility (SAF, Darmstadt, Germany) and National Oceanic and Atmospheric Administration (NOAA, Silver Spring, MD, USA) National Environmental Satellite Data and Information Service (NESDIS, Silver Spring, MD, USA) [29]. In the CMP dataset, a series of detection algorithms is used to identify the characteristics of the cloud [30,31]. Previous studies have demonstrated that Himawari-8 cloud products are highly reliable for evaluating cloud-top height, cloud-top temperature, and other cloud characteristics [32].
In this study, the cloud top height (CTH), cloud optical thickness (COT), and cloud type (CTYPE) in Himawari-8 cloud product data were used to analyze the cloud characteristics at different stages of the Typhoon “Infa”, the specific data types used in this study are shown in Table 1. Among them, COT reflects the thickness of clouds and the concentration of cloud particles that can be used to determine the degree of vertical development and density of clouds. A larger COT indicates denser clouds, the CTH provides the overall vertical structure information of the typhoon cloud system, and a higher CTH is typically related to strong convective activity and rapid vertical motion. Additionally, CTT is an important indicator that reflects the cold and warm states of clouds, and a lower CTT can provide information detailing cloud cooling and vertical stability. Lower cloud-top temperatures are typically associated with strong convective activities and precipitation-intensive areas. These variables can be used to represent typhoon intensity characteristics to a certain extent.
(2)
CMA Best-Path Dataset
The best-track dataset (CMA) was obtained from the official website of the Tropical Cyclone Data Center of the China Meteorological Administration. The CMA tropical cyclone best-track dataset has provided the location and intensity information of tropical cyclones in the Northwest Pacific (including the South China Sea, north of the equator, and west of 180° E) since 1949 every 6 h and is stored in separate text files according to year [9,33]. After 2018, for typhoons that landed in China, the optimal path events were encrypted once every 3 h at 24 h before their landing and during their land activities in China, including the latitude and longitude, maximum average wind speed, maximum atmospheric pressure, and maximum wind speed of each typhoon center [33,34]. This dataset was used to verify typhoon positioning results, the specific data information for the CMA dataset is shown in Table 2.

2.2. Methods

Based on the YOLOv5 deep learning model and Himawari-8 data product, this study analyzes the movement path and cloud evolution characteristics of typhoon “Infa” during its movement. This process is illustrated in Figure 1. The specific steps included (1) data collection and preprocessing, (2) regional typhoon monitoring, (3) typhoon center positioning, and (4) evolution of cloud characteristics and analysis of influencing factors.

2.2.1. YOLOv5 Model

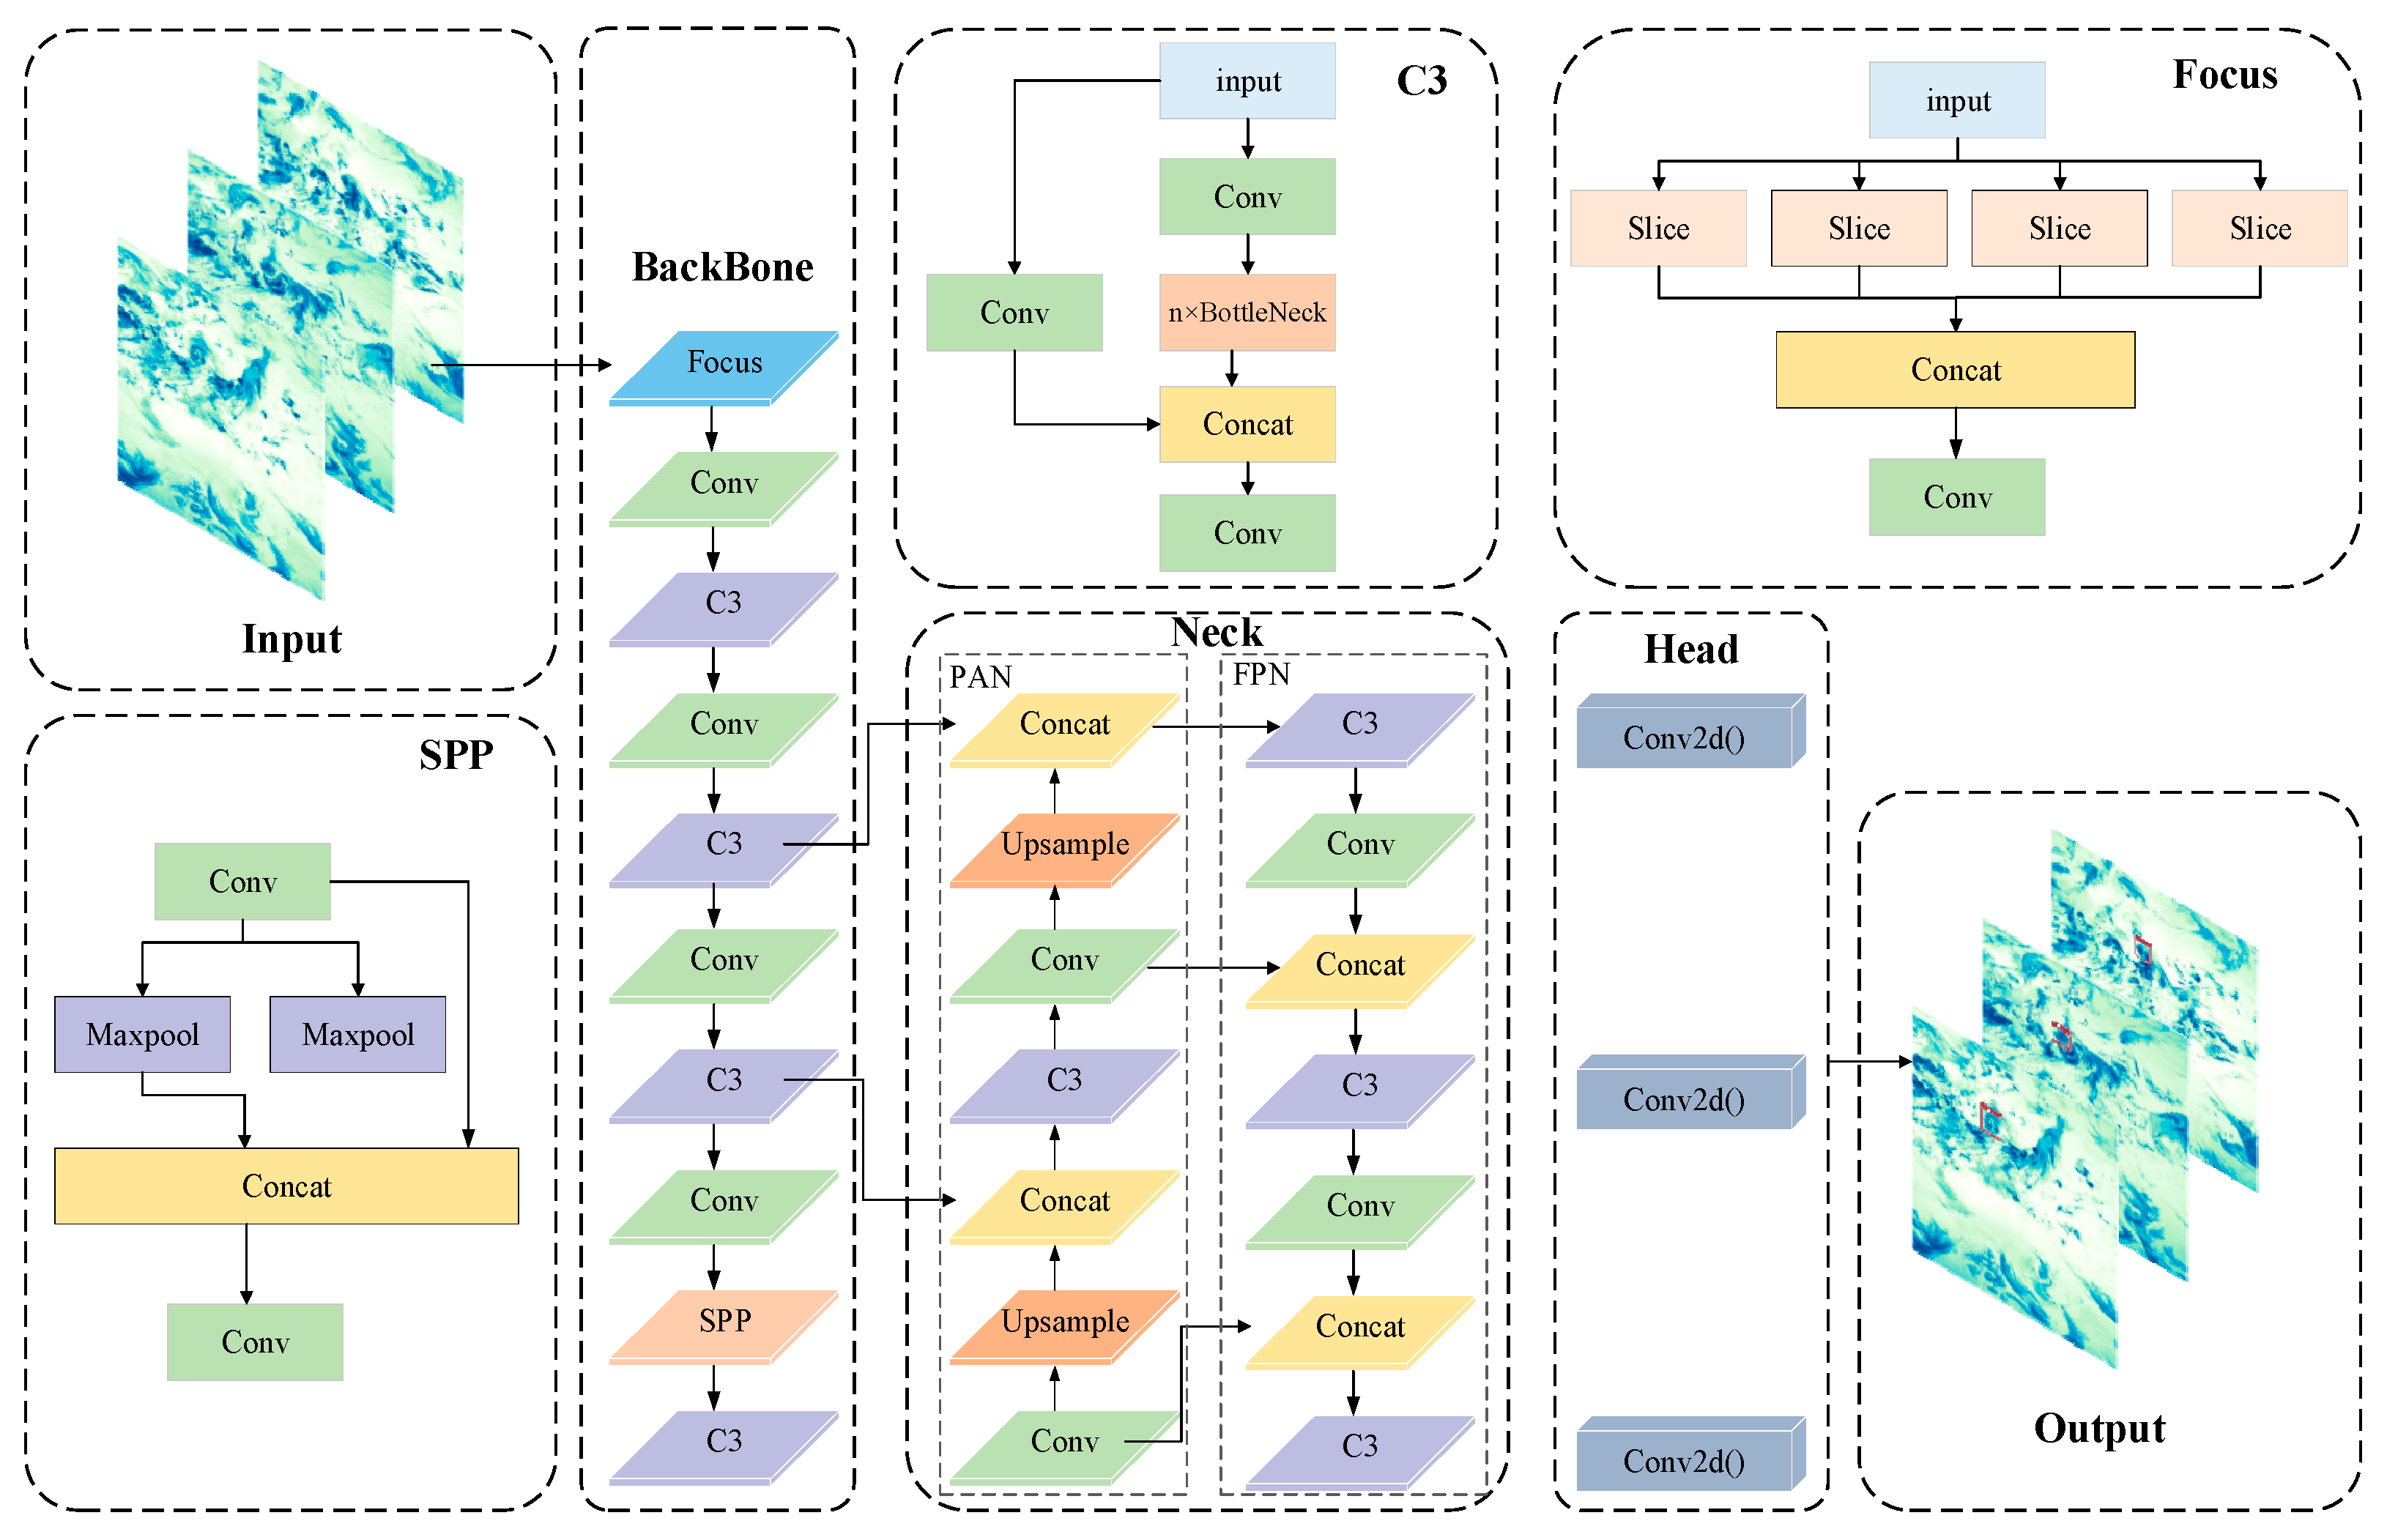
The YOLO series includes multiple models that perform differently on different datasets. According to the Web of Science data, compared to other models of the YOLO series the number of related studies based on YOLOv5 is on the rise. YOLOv5 (GitHub-ultralytics/yolov5: YOLOv5) is favored due to its easy deployment and training and also its good reliability and stability [35]. It can be observed that YOLOv5 exhibits strong competitiveness in a number of YOLO models. Therefore, this study chose the YOLOv5 model as the primary application model for the typhoon monitoring experiments. YOLOv5 is a commonly used deep-learning framework. Based on the differences in the network depth and width, YOLOv5 can be divided into four different scale network structures that include YOLOv5s, YOLOv5m, YOLOv5l, and YOLOv5x. YOLOv5 regards the target detection task as a simple regression problem and uses a neural network (CNN) to perform a single forward propagation of an image to directly monitor the target object in the image. Figure 2 presents the basic network structure of the YOLOv5 model [13,36]. The model was primarily composed of four modules. First, mosaic data enhancement, adaptive anchor box calculations, and adaptive image scaling were used to increase the number of typhoon samples. Second, the image samples containing typhoon information were sent to the backbone to extract the typhoon features. Then, to further process and mine the deeper typhoon information (including positioning and semantic information) in the feature map, the feature map is transmitted to the neck, the output of the neck is transmitted to the prediction layer (head), and the specific typhoon location and category information are obtained by convolution and output through the anchor box.
(1)
BackBone
The backbone layer is the core of the entire YOLOv5 network and is responsible for extracting the features of the input image, thereby helping the model to better understand typhoon information. The backbone layer consists of a Focus, a Convolution Layer (Conv), and C3 and SPP modules. The Focus was primarily used for reducing the number of parameters and improving the forward and backward speeds of the model. In this part of the process, the input image is copied into four copies, and the four images are cut into four slices by a slicing operation. The slices are then connected by Concat and sent to the next convolution layer. C3 is the most important module of the backbone layer and includes two branches. One connects a given number of bottleneck modules in series, and the other is the convolutional layer. The two were connected by a cat to increase network depth. Conv is the basic convolution module of YOLOv5 that can perform convolution, regularization, and activation operations on the image input to assist the C3 module in extracting typhoon features. The SPP connects multiple pooling layers (maxpool) to achieve feature fusion at different scales and enhances the feature expression ability of the backbone layer.
(2)
Neck
YOLOv5 uses a feature pyramid network (FPN) and a path aggregation network (PAN) as the neck layer [37]. In the FPN structure, the typhoon feature map was upsampled (upsample) to form a pyramid from top to bottom, and semantic features were transferred from the high-level feature map to the low-level feature map. The PAN structure is the opposite and can directly transfer typhoon location features from the low-level feature map to the high-level feature map. The interaction between the two enhances the feature-fusion ability of the neck layer.
(3)
Head
The head corresponds to the prediction stage of the YOLOv5 model that outputs the typhoon category, confidence level, and anchor box position of the typhoon in the satellite cloud image through two-dimensional convolution. In the YOLOv5 network, the location of anchor boxes containing typhoon information was obtained using the K-means clustering algorithm [38]. The basic idea of this algorithm is to randomly initialize K centers ci from typhoon dataset x, where each center corresponds to a category yi. Then, for each sample x in the dataset, the typhoon sample was assigned to the nearest center by calculating its distance from each center ci, and the center of each category was calculated again.
c i = 1 y i x y i K x
For the new center position, data x are reclassified and repeated a certain number of times until the center remains unchanged. Based on the above steps, the center position of the monitored typhoon target was obtained. Subsequently, based on the center position, the coordinate information of the entire anchor box was calculated.
b x = 2 σ ( t x ) 0.5 + c x b y = 2 σ ( t y ) 0.5 + c y b w = p w ( 2 σ ( t w ) ) 2 b h = p h ( 2 σ ( t h ) ) 2
In the formula, bx, by, bw, and bh represent the final coordinate information of the typhoon monitored in the entire satellite image; tx, ty, tw, and th represent the coordinate information of the typhoon monitored in the whole satellite image; pw and py represent the size of the monitoring anchor box; cx and cy represent the upper left corner coordinates of the grid where the anchor box center point is located; and σ denotes the sigmoid function that normalizes the grid coordinates to 0–1.
Finally, monitoring accuracy was evaluated using the loss function (GIoU). In the YOLOv5 network structure, GIoU is an important index for measuring the similarity between the anchor selection frame and the actual position of the typhoon [39]. It is assumed that Apred represents the typhoon position information as monitored in the satellite cloud image, Agrou represents the actual position of the typhoon in the satellite cloud image, and IoU represents the overlap ratio of the two positions. The specific calculation formula for the GIoU is:
G I o U ( A p r e d , A g r o u ) = I o U A C A p r e d A g r o u A C
where C represents the minimum rectangular box of the typhoon monitoring position and actual position.
Based on the above steps, the YOLOv5 algorithm can achieve rapid and accurate monitoring and positioning of typhoon targets in the Himawari-8 satellite cloud image, thus providing a basis for subsequent typhoon center positioning and regional cloud feature evolution analysis.

2.2.2. Brightness Temperature Perturbation Algorithm

The typhoon center location algorithm that is based on bright temperature differences is a widely used typhoon center location method. The algorithm uses the brightness temperature disturbance characteristics of the typhoon center area to locate the typhoon center by calculating the brightness temperature gradient, curl, divergence, and brightness temperature disturbance values [40]. It is typically believed that the position with the lowest brightness temperature disturbance value in the typhoon eye is the typhoon center. The basic steps of the algorithm are as follows.
First, in the typhoon region determined by the YOLOv5 model, the brightness temperature gradient was calculated by comparing the brightness temperature values of the pixels in different regions. The brightness temperature gradient represents the change in brightness temperature in space. In BT, the calculation formula for the brightness temperature gradient G B T is
G B T = B T x + B T y
We used the brightness temperature gradient to calculate the curl and divergence of typhoons. After calculating the brightness temperature gradient of the typhoon area, the divergence and curl of the brightness temperature gradient were calculated using Equations (2) and (3) [41]. Here, the divergence represents the diffusion or contraction of the brightness temperature field as expressed as d i v G B T where the unit is N · m 3 × 10 7 . The curl describes the degree of rotation of the brightness temperature as expressed as c u r l G B T where the unit is N · m 3 × 10 7 .
d i v G B T = G B T x + G B T y
c u r l G B T = ( G B T x G B T y )
The brightness temperature perturbation value of the typhoon area is calculated according to the curl and divergence. The brightness temperature perturbation value reflects the abnormal degree of the brightness temperature field, and the lowest value corresponds to the center position of the typhoon [42]. As the typhoon eye area is primarily affected by the joint action of divergence and curl, the calculated divergence and curl are both positive and negative. If only the mean value of the two is considered, the value is offset to zero. Therefore, the square of divergence and vorticity is first calculated separately, and then the square root of the sum of their squares is taken. Finally, the brightness temperature disturbance value was calculated using divergence and curl.P:
P = ( d i v G B T ) 2 + ( c u r l G B T ) 2

3. Results

3.1. Typhoon Positioning Results Analysis

Typhoon “Infa” was generated in the Northwest Pacific Ocean at 18:00 UTC on 17 July 2021. At 00:00 on 19 July, it strengthened to tropical storm level and moved westward. At 00:00 on 21 July, it intensified into a strong typhoon, entered the 24 h warning line in China and landed on the coast of Putuo, Zhoushan in Zhejiang Province, China at approximately 04:30 on 25 July. After the landing, “Infa” remained in northern Zhejiang and southern Jiangsu for a long period of time and gradually weakened. It weakened to a tropical depression at 00:00 on the 28th and then moved northward, ultimately becoming an extratropical cyclone at 12:00 on the 30th. Typhoon “Infa” was a highly disastrous typhoon, its precipitation began on 22 July, and its influence gradually expanded from Zhejiang to Shanghai, Jiangsu, Anhui, Shandong, Henan, and the Beijing-Tianjin-Hebei region, ultimately causing a wide range of precipitation and serious impacts on the southeast coast of China [43]. Additionally, during the slow westward movement of typhoon “Infa” over the sea surface east of Taiwan and based on the combined action of the subtropical high on the north and typhoon “Chapaka” on the southwest, a large amount of water vapor was exported to inland areas that was closely related to the rainstorm in Henan Province on 21 July [44]. Compared to other typhoon events, typhoon “Infa” exhibits the characteristics of slow-moving speed, strong wind and rain intensity, and wide influence range. Its structure is symmetrical, the cloud system is closed and thick, and possesses a clear eye structure. This provides a good data basis for monitoring typhoon events and further analyzing the evolution of typhoon cloud system characteristics.
Based on the YOLOv5 model and brightness temperature perturbation algorithm, this study located and analyzed the center of typhoon “Infa”. In this experiment, Himawari-8 observation images from 2021 to 2022 in the southwest Pacific were selected to construct a typhoon dataset. The dataset contains 1186 real typhoon events with a size of 2401 × 2401 pixels. This dataset contains 900 satellite cloud images with eye typhoon events and 168 satellite cloud images without eye typhoon events. The number of typhoons in each satellite cloud image is one. During the training process, 90% of the satellite cloud images in the dataset were randomly selected as the training set for the experiment, and the remaining 10% were used as the test set of the experiment. During the training process, the monitoring accuracy of the YOLOv5 model for typhoons was improved by continuously adjusting the weight and deviation. The model achieves monitoring and positioning of the typhoon area by learning the characteristics related to the typhoon from satellite cloud images.
In the process of model monitoring, this study selected 200 satellite cloud images during the occurrence of typhoon “Infa”. The monitoring results indicate that a total of 168 typhoon events were successfully monitored in 200 satellite cloud images containing typhoon events with a monitoring rate of 84%. Among them, the monitoring rate of eyed typhoons was 100%, and the monitoring rate of eyeless typhoons was 64%. These results confirm the effectiveness of the YOLOv5 model for typhoon event monitoring. In particular, the YOLOv5 model exhibited excellent monitoring capabilities for eyed typhoons. However, compared to typhoons with eyes, the monitoring rate of typhoons without eyes is lower, but its monitoring effect is still effective. In future studies, the proportion of typhoon-free eye samples in the training set can be expanded to further improve the YOLOv5 model.
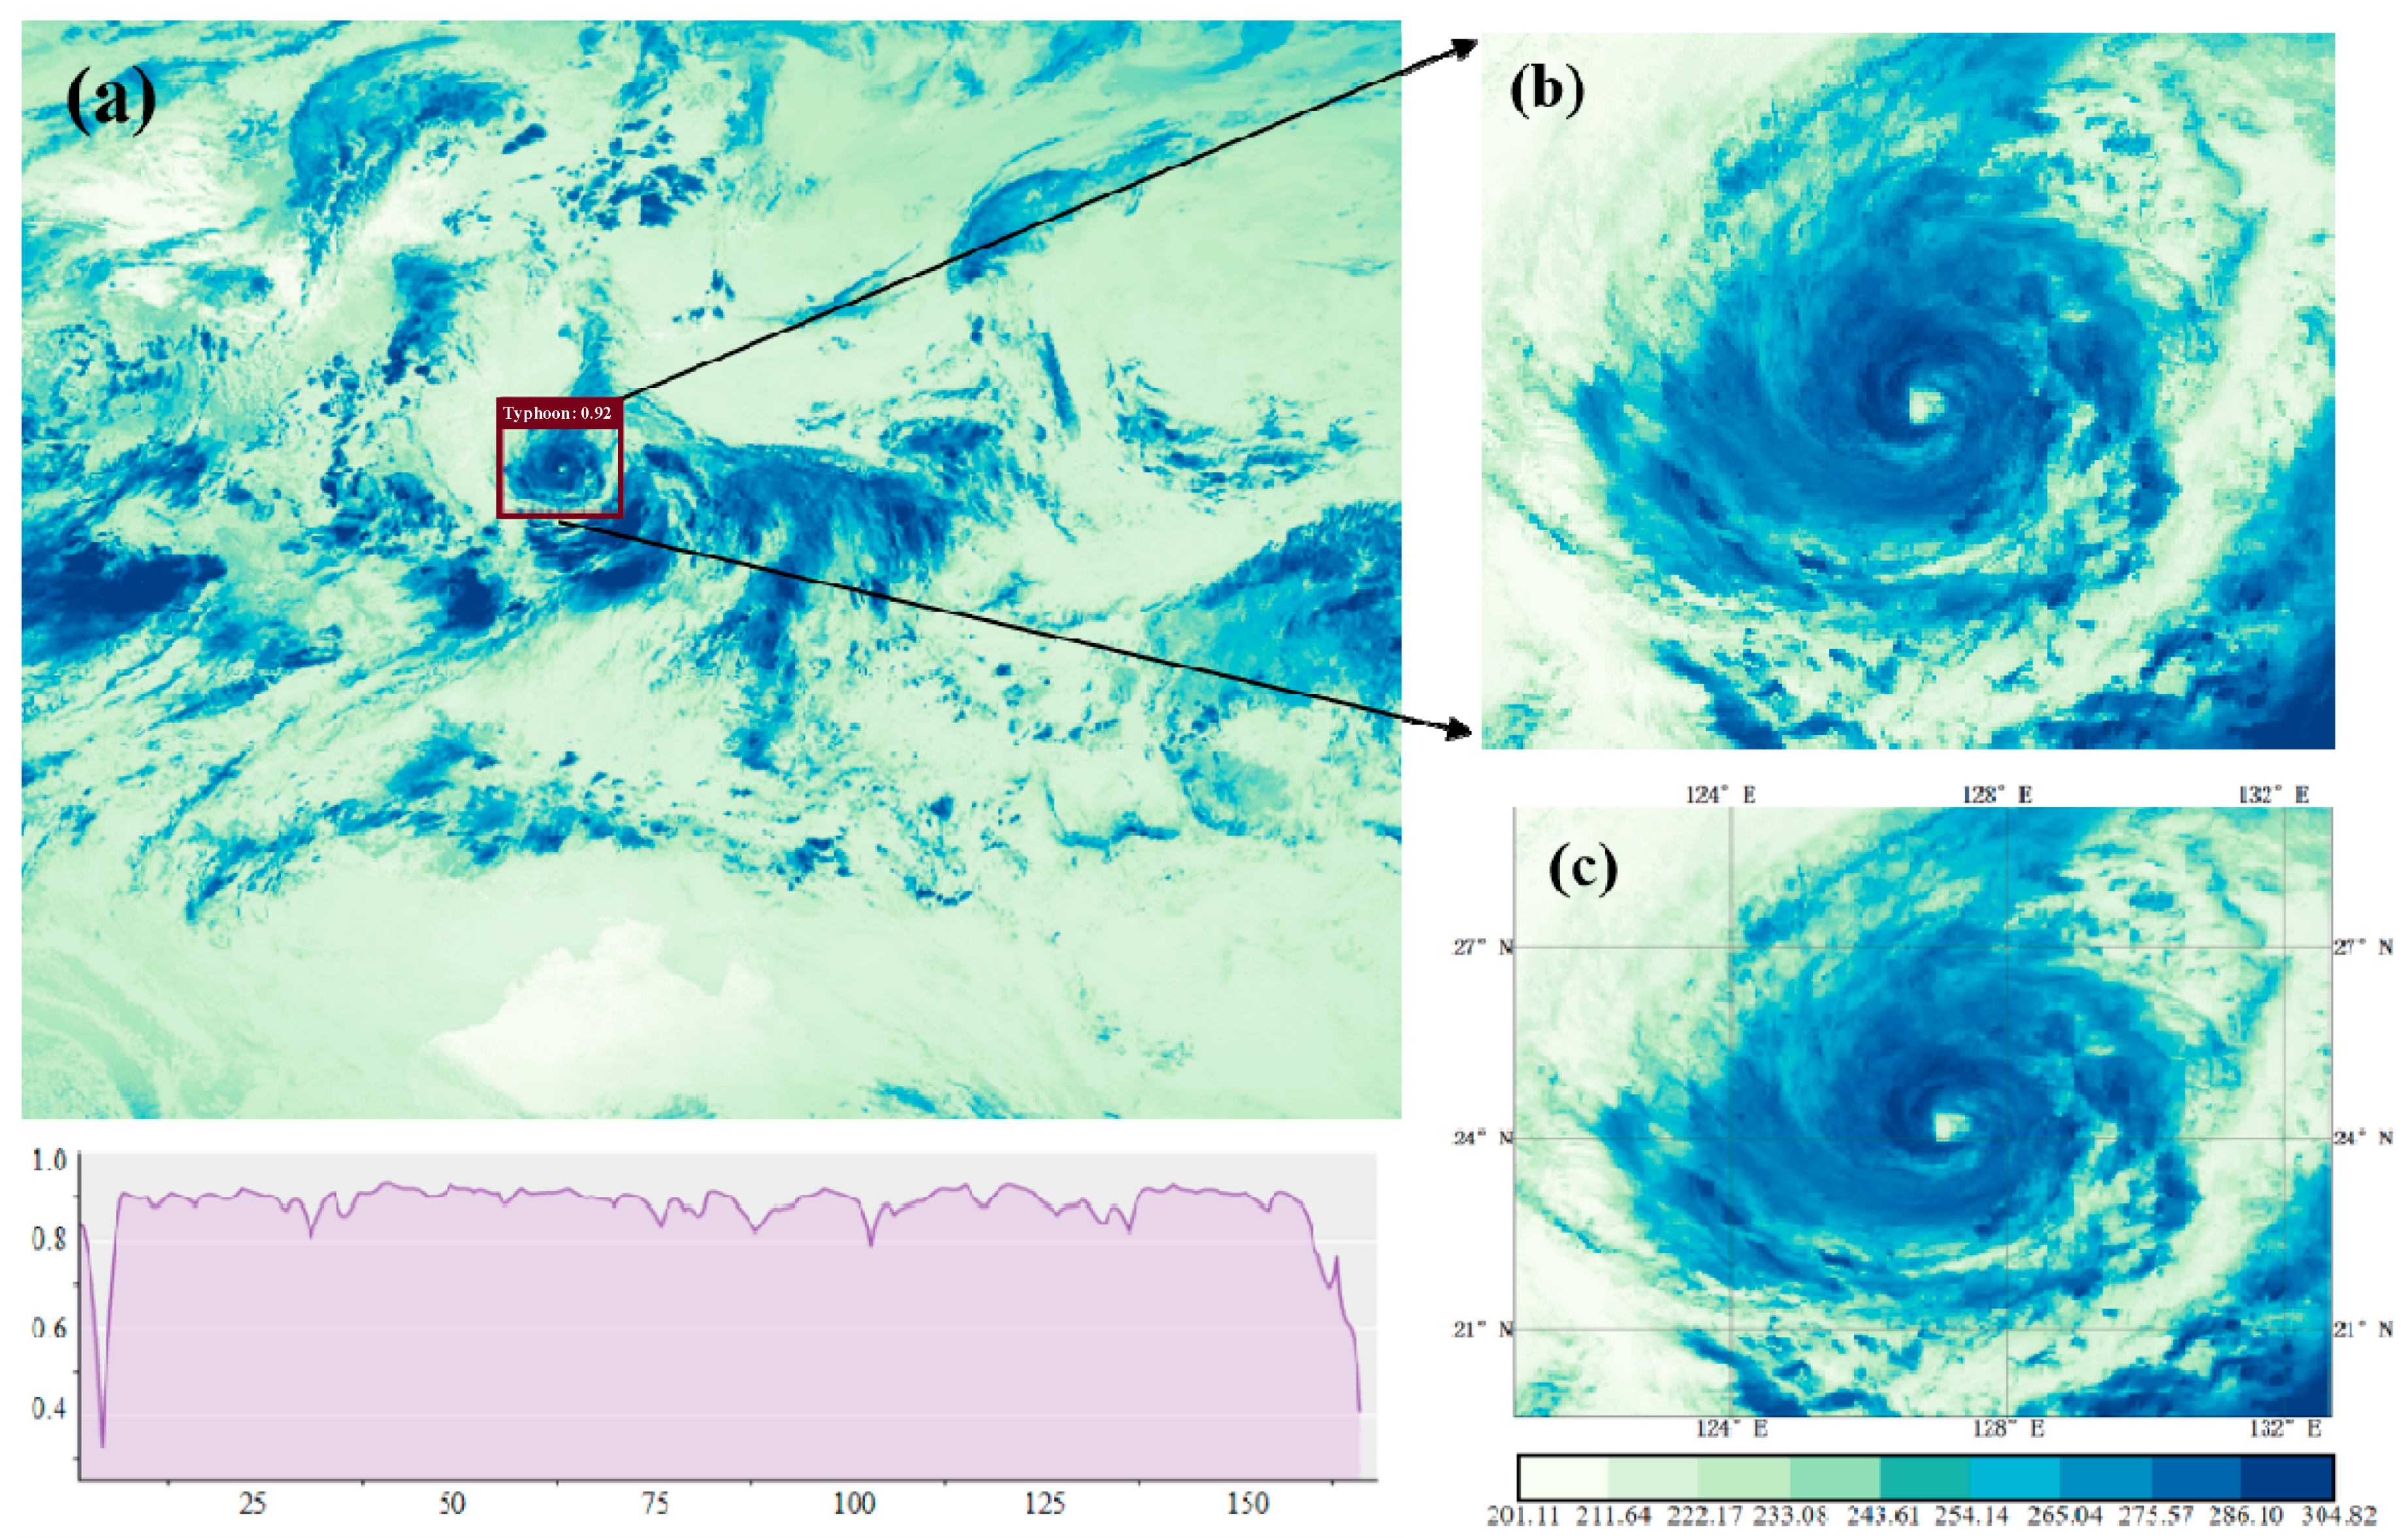
Additionally, the YOLOv5 model exhibited good monitoring accuracy. Figure 3 illustrates the accuracy of the YOLOv5 model in regard to typhoon event monitoring. Figure 3a presents the hourly positioning accuracy of the typhoon from 0:00 on 18 July to 6:00 on 28 July 2021. The positioning results at 6:00 on 21 July are presented. Figure 3b,c provides the positioning results of the typhoon area and the corresponding brightness temperature data at 6:00 on 21 July 2021. To further validate the accuracy of the YOLOv5 model in typhoon event detection, this study computed the average confidence level of the target detection model specifically for typhoon events. This metric offers a comprehensive assessment of the model’s overall confidence level in detecting typhoon events. A high average confidence level indicates that the model is more confident in its performance in detecting typhoon events overall. The experimental results revealed that the average confidence of typhoon events monitored by the YOLOv5 model was 0.87; this result indicates that the YOLOv5 model demonstrates a certain level of reliability in detecting the “Infa” typhoon event. Of this, the average confidence of the eyed typhoons was approximately 0.9, and that of the eyeless typhoons was approximately 0.83; this indicates that the YOLOv5 model is more reliable in detecting typhoons with an eye. The above research results demonstrate that the YOLOv5 model can accurately monitor the position of a typhoon in an infrared brightness temperature image and provide auxiliary support for positioning the typhoon center.
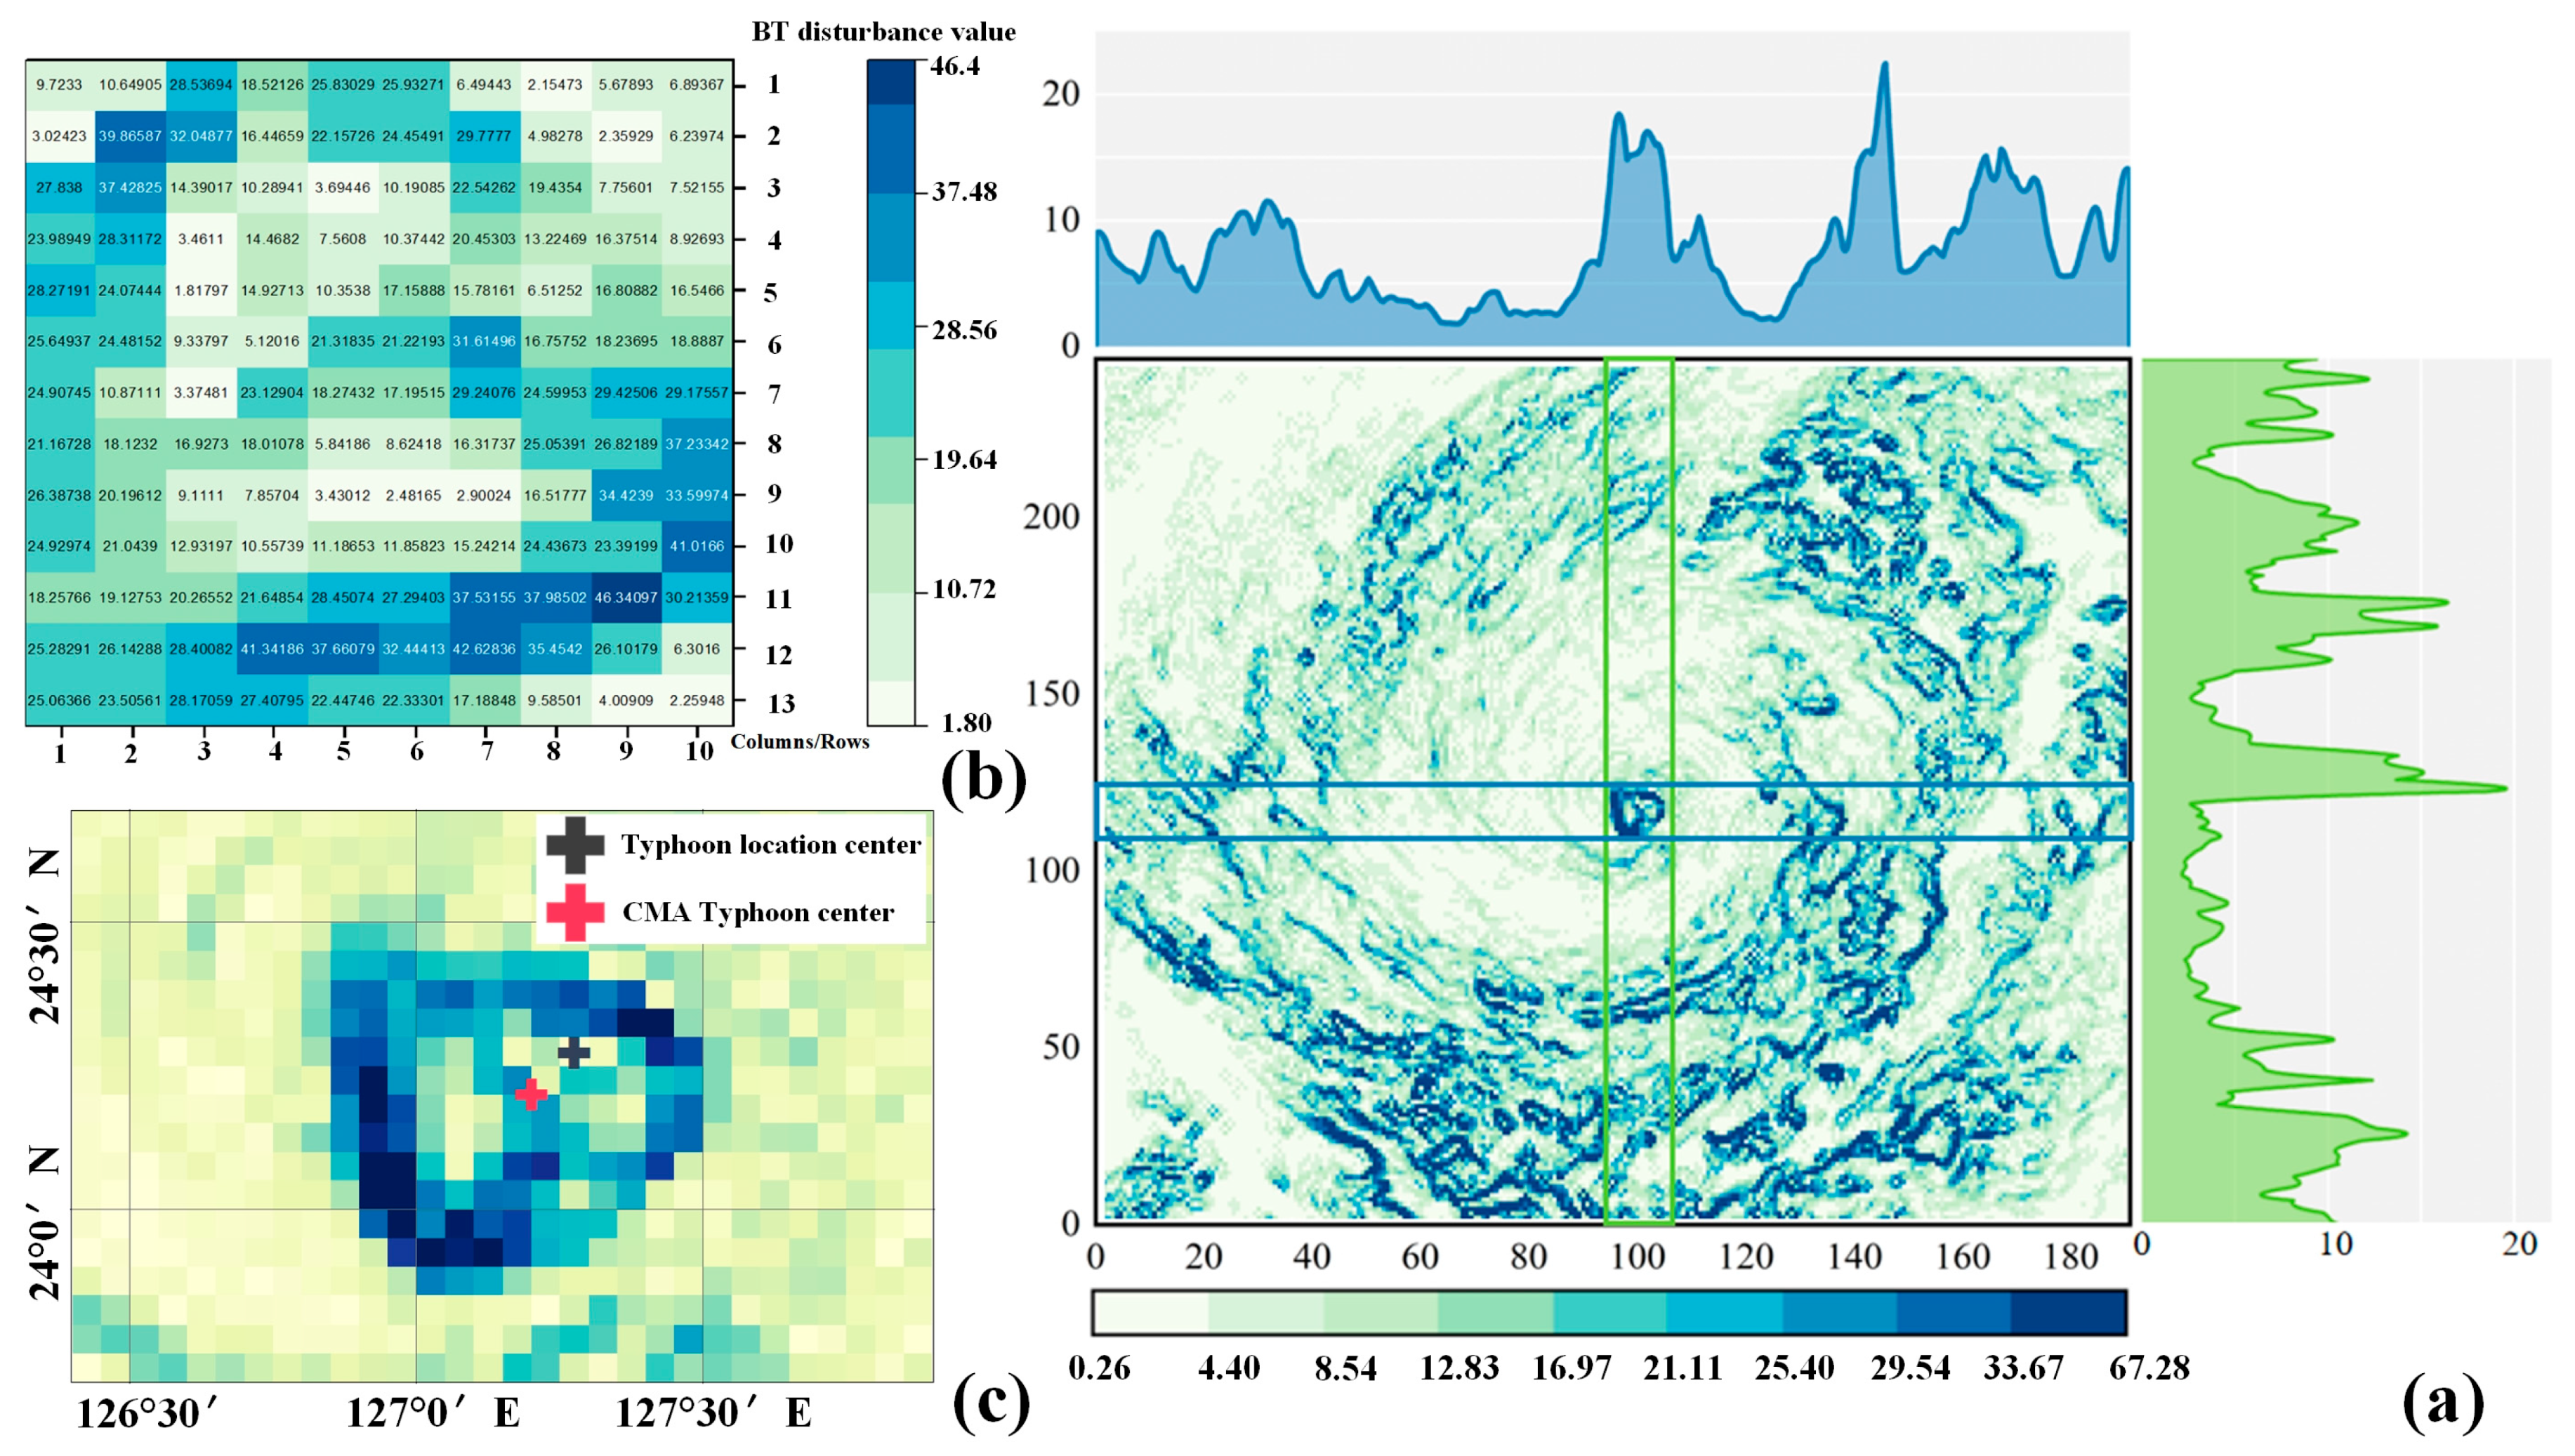
To further locate the typhoon center, this study calculated the brightness temperature perturbation value of the typhoon area as determined by the YOLOv5 model based on the brightness temperature perturbation algorithm and analyzed the spatial distribution of the perturbation value in the typhoon center to achieve accurate positioning of the typhoon center. The calculated brightness temperature disturbance values for the typhoon area are presented in Figure 4. Figure 4 presents the spatial distribution of the brightness temperature disturbance values in the typhoon area at 6:00 on 21 July 2021. The results indicate that the cloud layer surrounding the typhoon was thicker, and the brightness temperature disturbance value was smaller. At the junction of the typhoon cloud wall area and the eye area and due to the large temperature difference and humidity change between the cloud area and the ocean, there is a large brightness temperature disturbance characteristic. Due to the relatively calm weather conditions in the typhoon eye area, the brightness temperature disturbance value in this area was low. By identifying the pixel position with the smallest brightness temperature disturbance value in the typhoon eye area, accurate positioning of the typhoon center can be achieved. Figure 4b presents the spatial distribution characteristics of the brightness temperature disturbance value in the typhoon eye area, and this further provides support for the positioning of the typhoon center. Specifically, the minimum brightness temperature disturbance value of the typhoon eye area at 6:00 on 21 July was 1.82, and this is the location of the typhoon center. To further evaluate the accuracy of the positioning results, the typhoon center at the corresponding time of the optimal path dataset was superimposed on the spatial distribution map of the disturbance value (as presented in Figure 4c). The results demonstrate that the positioning result is only approximately two pixels different from the typhoon center data provided by the China Meteorological Administration. This demonstrates that more accurate typhoon center positioning can be achieved using the brightness temperature perturbation algorithm and image analysis.
Additionally, combined with the positioning results of the YOLOv5 model and the brightness temperature perturbation algorithm, this study mapped the moving path of typhoon “Infa” as presented in Figure 5. Figure 5a presents a comparison between the moving path of typhoon “Infa” determined in this study and the moving path of CMA. The black line in the figure represents the typhoon path based on the CMA optimal path dataset, and the red line represents the typhoon path determined in this study. In the figure, the red and black line segments possess a certain overlap, particularly at certain time nodes, and the two trends exhibit very high similarity. Additionally, Figure 5b,c provides the correlation analysis results of the latitude and longitude of the typhoon center and the latitude and longitude of the CMA typhoon center. The results demonstrate that the latitude and longitude of the typhoon center and the latitude and longitude of the CMA typhoon center R value are 0.99, and this confirms that there is a highly consistent relationship between the typhoon center positioning results of this study and the CMA typhoon center positioning results. Specifically, the trends of the two are highly similar. Table 3 presents the distance comparison data between the typhoon center position as determined in this study and that determined by the CMA. The data can further reflect the distance difference between the typhoon center position determined in this study and the typhoon center position determined by the CMA. The results indicate that the maximum distance difference between the typhoon center position determined by this study and the typhoon center position determined by CMA is 48.4 km, the minimum distance difference is 3.5 km, and the average distance difference is 20.9 km. The results demonstrate that the method of combining the YOLOv5 model and the brightness temperature perturbation algorithm possesses a certain reliability and accuracy in regard to typhoon center positioning and can locate the typhoon center relatively accurately.
In summary, the experimental results demonstrate that the method of combining the YOLOv5 model and the brightness temperature perturbation algorithm can effectively extract typhoon features and achieve accurate positioning of typhoon centers. To deeply analyze the variation characteristics of typhoon “Infa”, this study further uses the typhoon area detected based on the YOLOv5 model to analyze the characteristics of cloud changes in different stages of typhoons to improve the understanding of the development and evolution of typhoons.

3.2. Analysis of Cloud Characteristics Evolution in Different Stages of Typhoons

To further analyze the structural characteristics of typhoons at different stages, this study divided the typhoon “Infa” into six stages according to the typhoon intensity determined by the CMA dataset species and the typhoon landing status and these included strong tropical storm (STS), typhoon (TY) and strong typhoon (STY) before landing, and typhoon (TY), storm (STS), and tropical storm (TS) after landing. By comparing the temporal and spatial changes in cloud characteristics at different stages of typhoons, we can reveal the evolution process of the structural characteristics of typhoon cloud systems over time and space to better understand the development and attenuation process of typhoons. In the analysis, the COT, CTT, and CTH were used as important parameters to describe the characteristics of typhoon clouds.
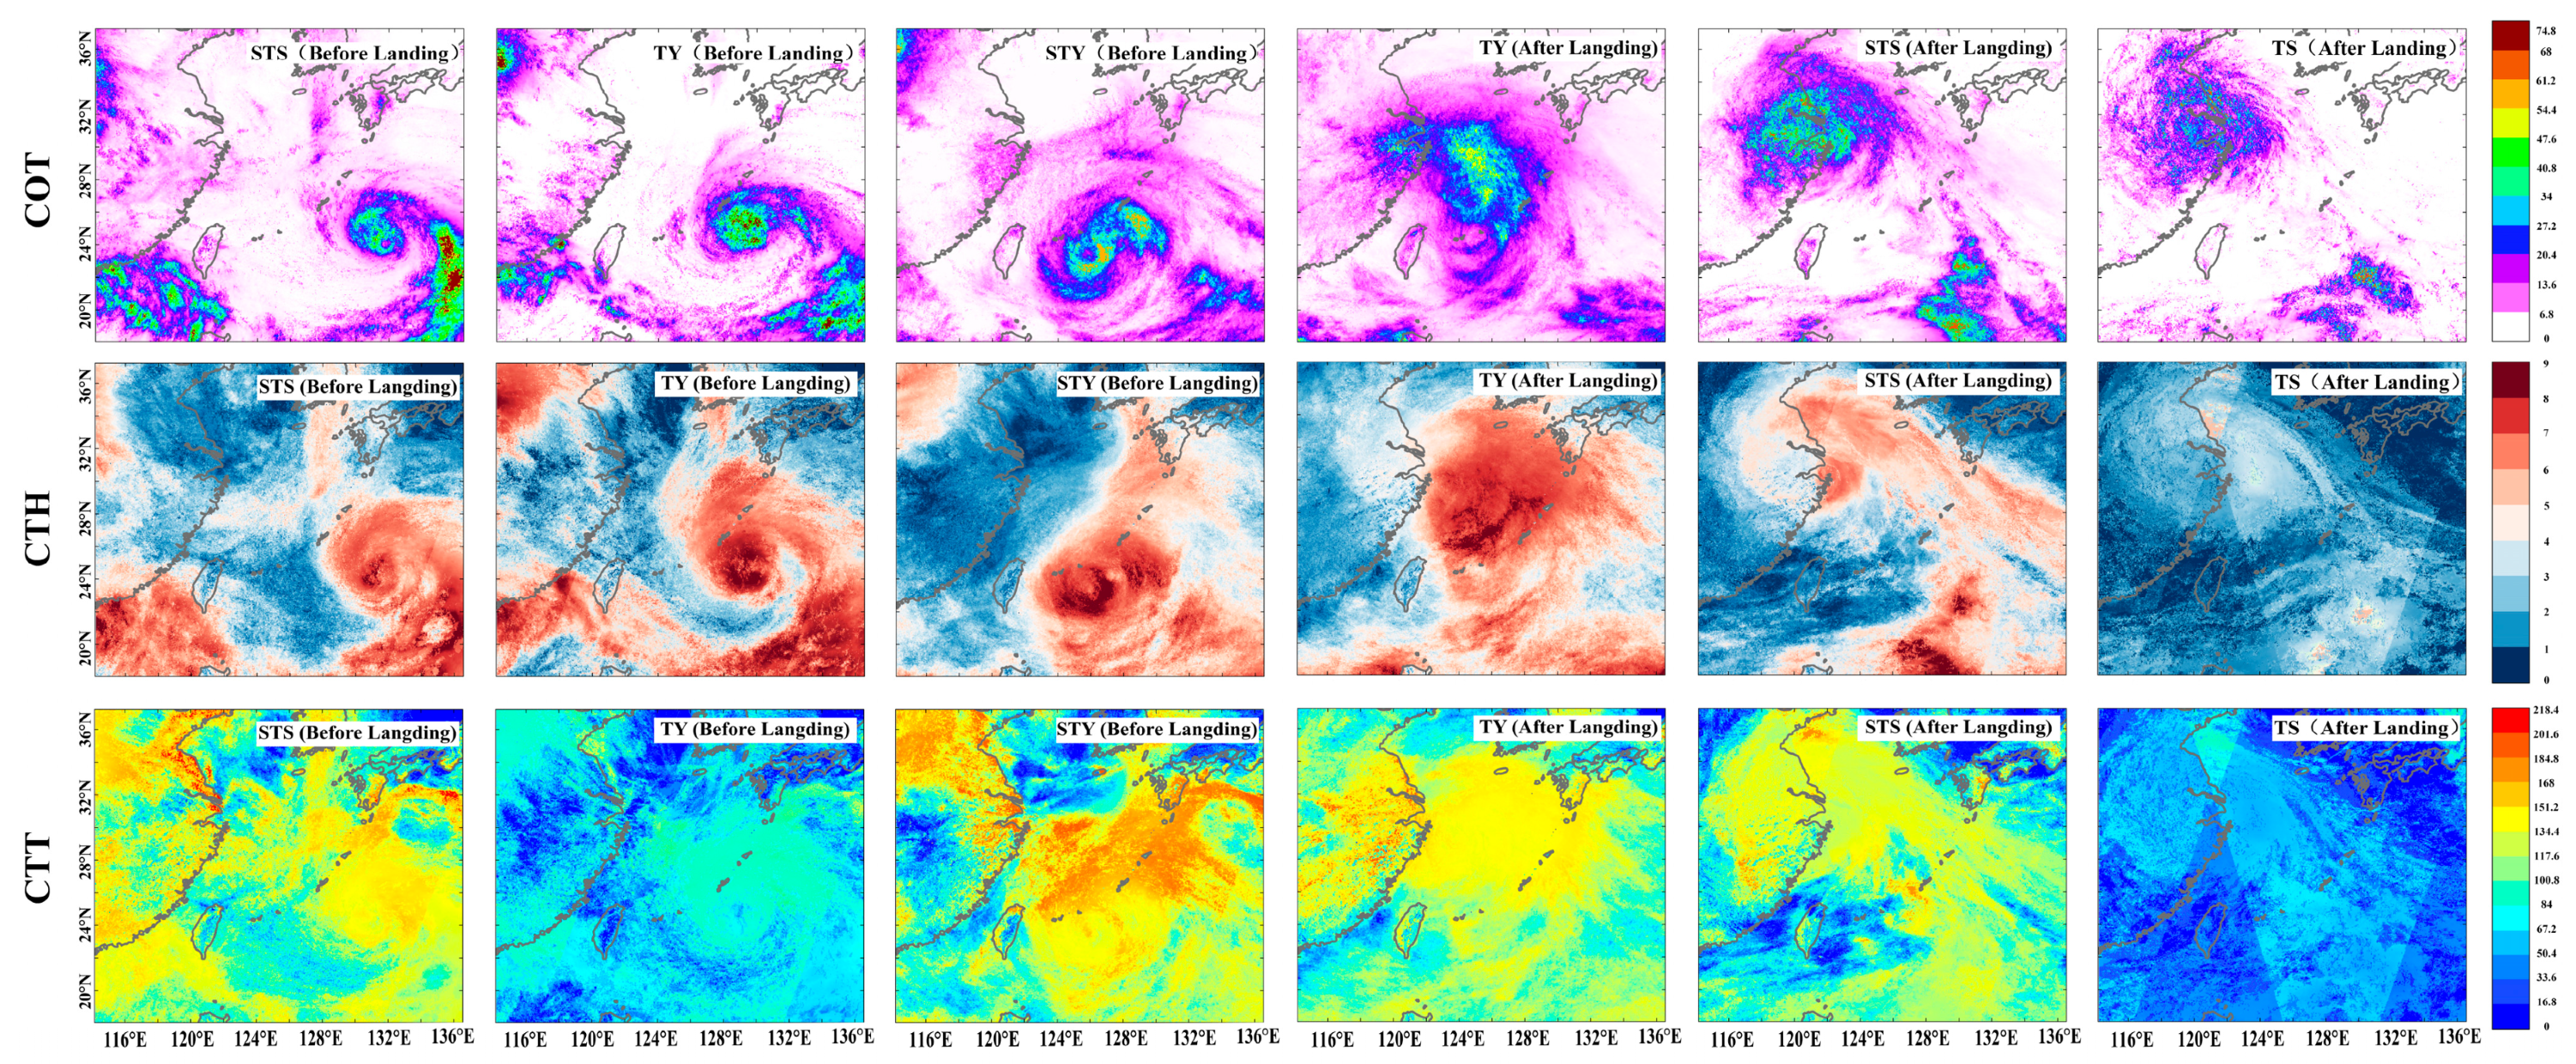
Figure 6 presents the spatial variations in the typhoon COT, CTH, and CTT. During the early stages of typhoon formation, the cloud system characteristics were relatively weak. With the gradual development of typhoons in the STS stage, the characteristics of the cloud system are enhanced, and the cloud clusters become more concentrated and denser and form denser clouds. With the intensification of convective activity, cloud optical thickness, and cloud top height are increased. The cloud top height in the typhoon center area can reach up to 6–7 km. However, compared to the typhoon stage, the convective activity was still relatively weak, and the cloud-top temperature was still relatively warm. When it further developed to the typhoon stage, the characteristics of the cloud system changed more significantly. The clouds were denser and larger and formed a more complete typhoon structure, and the cloud optical thickness in the typhoon area was significantly enhanced. In addition to the typhoon eye, the optical cloud thickness of a typhoon can reach high levels. With the development of typhoons, the height of the cloud top increases further, and the range of the high cloud area expands. The cloud-top height reached 8 km in the central area of the typhoon. The expansion of the high-cloud area indicates the existence of strong convective activity and vertical motion inside the typhoon. Additionally, with strong convective motion, the rise of cold air leads to a significant decrease of approximately 50 K in the cloud-top temperature. When it reaches the strong typhoon stage, the typhoon exhibits a relatively obvious annular structure, and the typhoon eye is clearly visible. However, the overall characteristics of the cloud system were similar to those observed during the typhoon stage, and the cloud clusters were still large and dense. At this time, the cloud optical thickness, cloud top height, and cloud top temperature increased slightly. As the typhoon gradually approached the land and finally landed, the characteristics of the typhoon cloud system changed significantly, and the cloud structure gradually disintegrated as it approached the land. After the typhoon landed, it lost the energy source provided by the ocean and experienced a process from TY to STS and then to TS within a short period of time, and this also indicates that the development of clouds was hindered as the underlying surface became more complex. The specific performance is as follows. First, due to the weakening of convective activity, the cloud clusters begin to disperse, ultimately resulting in a gradual decrease in optical thickness. Second, the weaker convective motion cannot push the cloud to a higher height and the cloud top height decreases accordingly. This is particularly evident in the STS stage, and the cloud top heights in the land and ocean regions are significantly different. Finally, as the initial increase in cold air decreased, the cloud-top temperature increased in some areas but typically decreased due to the dissipation of cloud clusters.
Figure 7 further reveals the temporal variation trend of cloud characteristics in the typhoon area. Figure 7a presents the trend of COT, CTH, and CTT with time. On the whole, the changes in COT and CTH are relatively stable, but there are large changes after landing. This is reflected in the relatively calm marine environment before landing which causes the cloud thickness and cloud top height to exhibit a stable trend. However, during landing and due to the influence of the complex terrain environment, COT and CTH exhibit a rapid decline trend and gradually stabilize after landing. However, the CTT changed markedly during the entire typhoon process. It exhibited a clear warming trend during the landing process and gradually decreased after stabilization. Figure 7b and Table 4 further explain the variation characteristics of COT, CTH, and CTT at different stages. The results demonstrate that the standard deviation of COT is 0.97 with a variance of 0.94, and this indicates that the variation degree of COT is low in different typhoon stages. Additionally, the data are relatively concentrated with a range of 2.78, thus suggesting that the change in COT is relatively stable and that the overall level is relatively consistent. The standard deviation of CTH is 1.01, and the variance is 1.01, thus indicating that CTT is consistent at different stages. Additionally, the range is 3.00, thus indicating that there are certain differences in CTH at different stages and that there may be clouds of different heights. The standard deviation of typhoon CTT is 29.04, and the variance is 843.55. The larger variance and standard deviation imply that the variation degree of typhoon CTT at different stages is higher. Additionally, the range is 72.49, thus indicating that there are obvious temperature differences in CTT at different stages. It is worth noting that the characteristics of typhoon cloud systems exhibit an obvious change trend before and after landing that can be observed as a slow rise followed by a rapid decline.
In summary, the characteristic changes in typhoon formation and development are continuous and progressive, and there is typically no clear division into stages. However, when a typhoon is close to land, the characteristics of the typhoon cloud system change significantly. Next, we analyzed the reasons for this change.

3.3. Analysis of the Reasons for the Evolution of Typhoon Cloud Characteristics

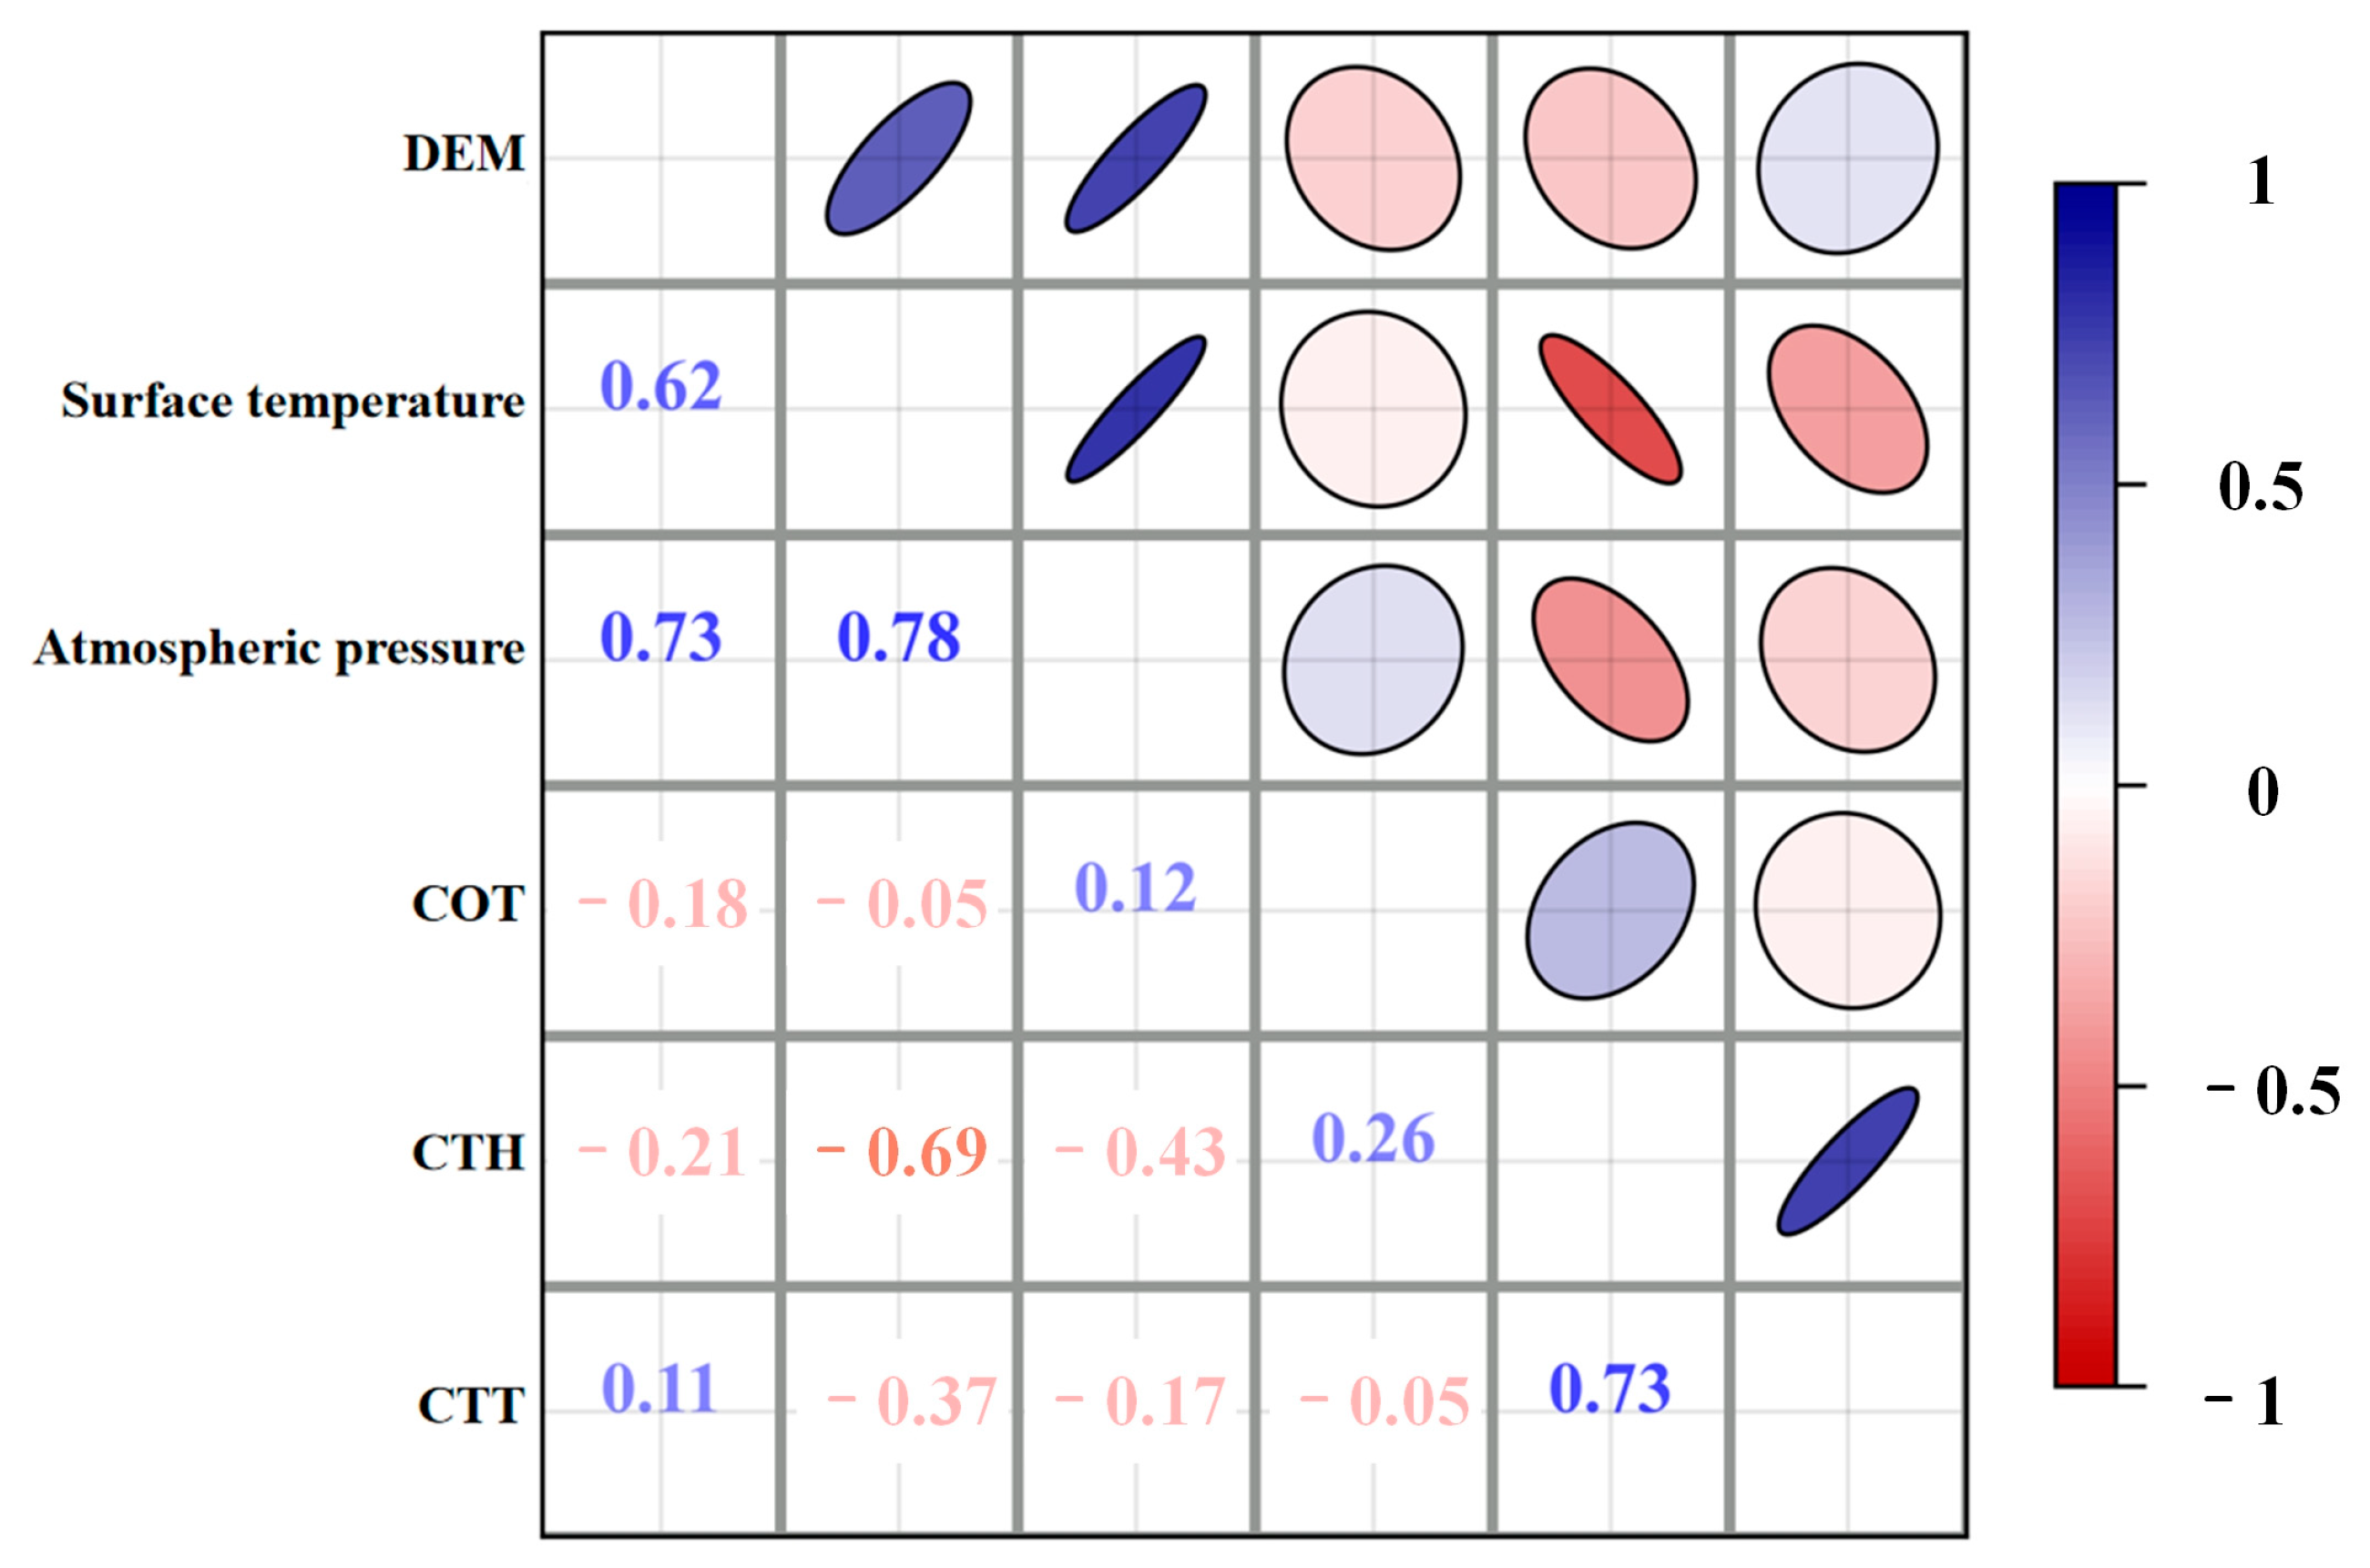
To further analyze the reasons underlying the changes in COT, CTH, and CTT at different typhoon stages, this study selected a digital elevation model (DEM) and land surface temperature (LST) as research objects, and the relevant results are presented in Figure 8. Among them, DEM and LST data are obtained from the STRM 30 m dataset and the ERA5 atmospheric reanalysis product, respectively. Both datasets are available from Google Earth Engine (GEE, https://code.earthengine.google.com/, accessed on 1 June 2023). The results demonstrated that the correlation coefficients between land surface temperature and COT, CTH, and CTT were −0.05, −0.69, and −0.37, respectively, whereas those between DEM and COT, CTH, and CTT were −0.18, −0.21, and 0.11, respectively. These results indicate that there is a negative correlation between changes in typhoon cloud characteristics and changes in surface temperature and terrain. Specifically, the changes in CTH and CTT were primarily affected by changes in the surface temperature, whereas the change in COT was more highly affected by changes in the terrain. During the development of typhoon “Infa”, the increase in surface temperature appears to lead to the downward trend of the top of the typhoon cloud. This is consistent with relevant research results. Specifically, the change in surface temperature contributes to the divergence of the low-pressure area and the convergence of the high-pressure area, thus affecting the vertical movement of the atmosphere and the shape and height of the typhoon cloud [45]. Additionally, as the surface temperature increases, convective activity also increases, ultimately prompting more moist air to rise to form clouds. These updrafts cooled the cloud top inside the cloud, thus causing a decrease in cloud-top temperature. However, the change in topography suggests that the typhoon gradually moved from ocean to land. As the typhoon landed, it gradually lost its heat supply to the ocean, thus resulting in a gradual weakening of the typhoon intensity. The internal structure of the typhoon and the characteristics of the cloud layer also changed, ultimately resulting in a more dispersed cloud layer and relatively low COT values.
The above results indicate that with the landing of a typhoon, the changes in surface temperature and topography exert a significant impact on the characteristics of typhoon clouds. Therefore, the COT, CTH, and CTT exhibit a significant change trend before and after the landing of the typhoon. However, during the complex evolution of typhoons, their development and changes are affected by many dynamic and meteorological factors. The roles of topography and surface temperature are only one of many complex factors explaining the evolution of typhoons. A comprehensive analysis of the various factors affecting the evolution of typhoons can provide a more comprehensive understanding of the specific mechanisms underlying typhoon cloud development and a more accurate theoretical basis for typhoon prediction.

4. Discussion

4.1. The Relationship between the Variation of Typhoon Cloud Characteristics and Precipitation

Precipitation is an important characteristic of typhoons. At different stages of typhoon development, the microphysical characteristics of clouds within the typhoon constantly change, and this directly affects the generation and development of typhoon precipitation [46]. It is typically believed that in the gradual development of typhoons, the strong updraft promotes the condensation of water vapor into cloud droplets that further aggregate into precipitation particles, thus causing precipitation. During this process, changes in the macroscopic and microscopic physical processes of clouds play an important role [47]. Therefore, this study further discusses the relationship between changes in typhoon cloud characteristics and precipitation.
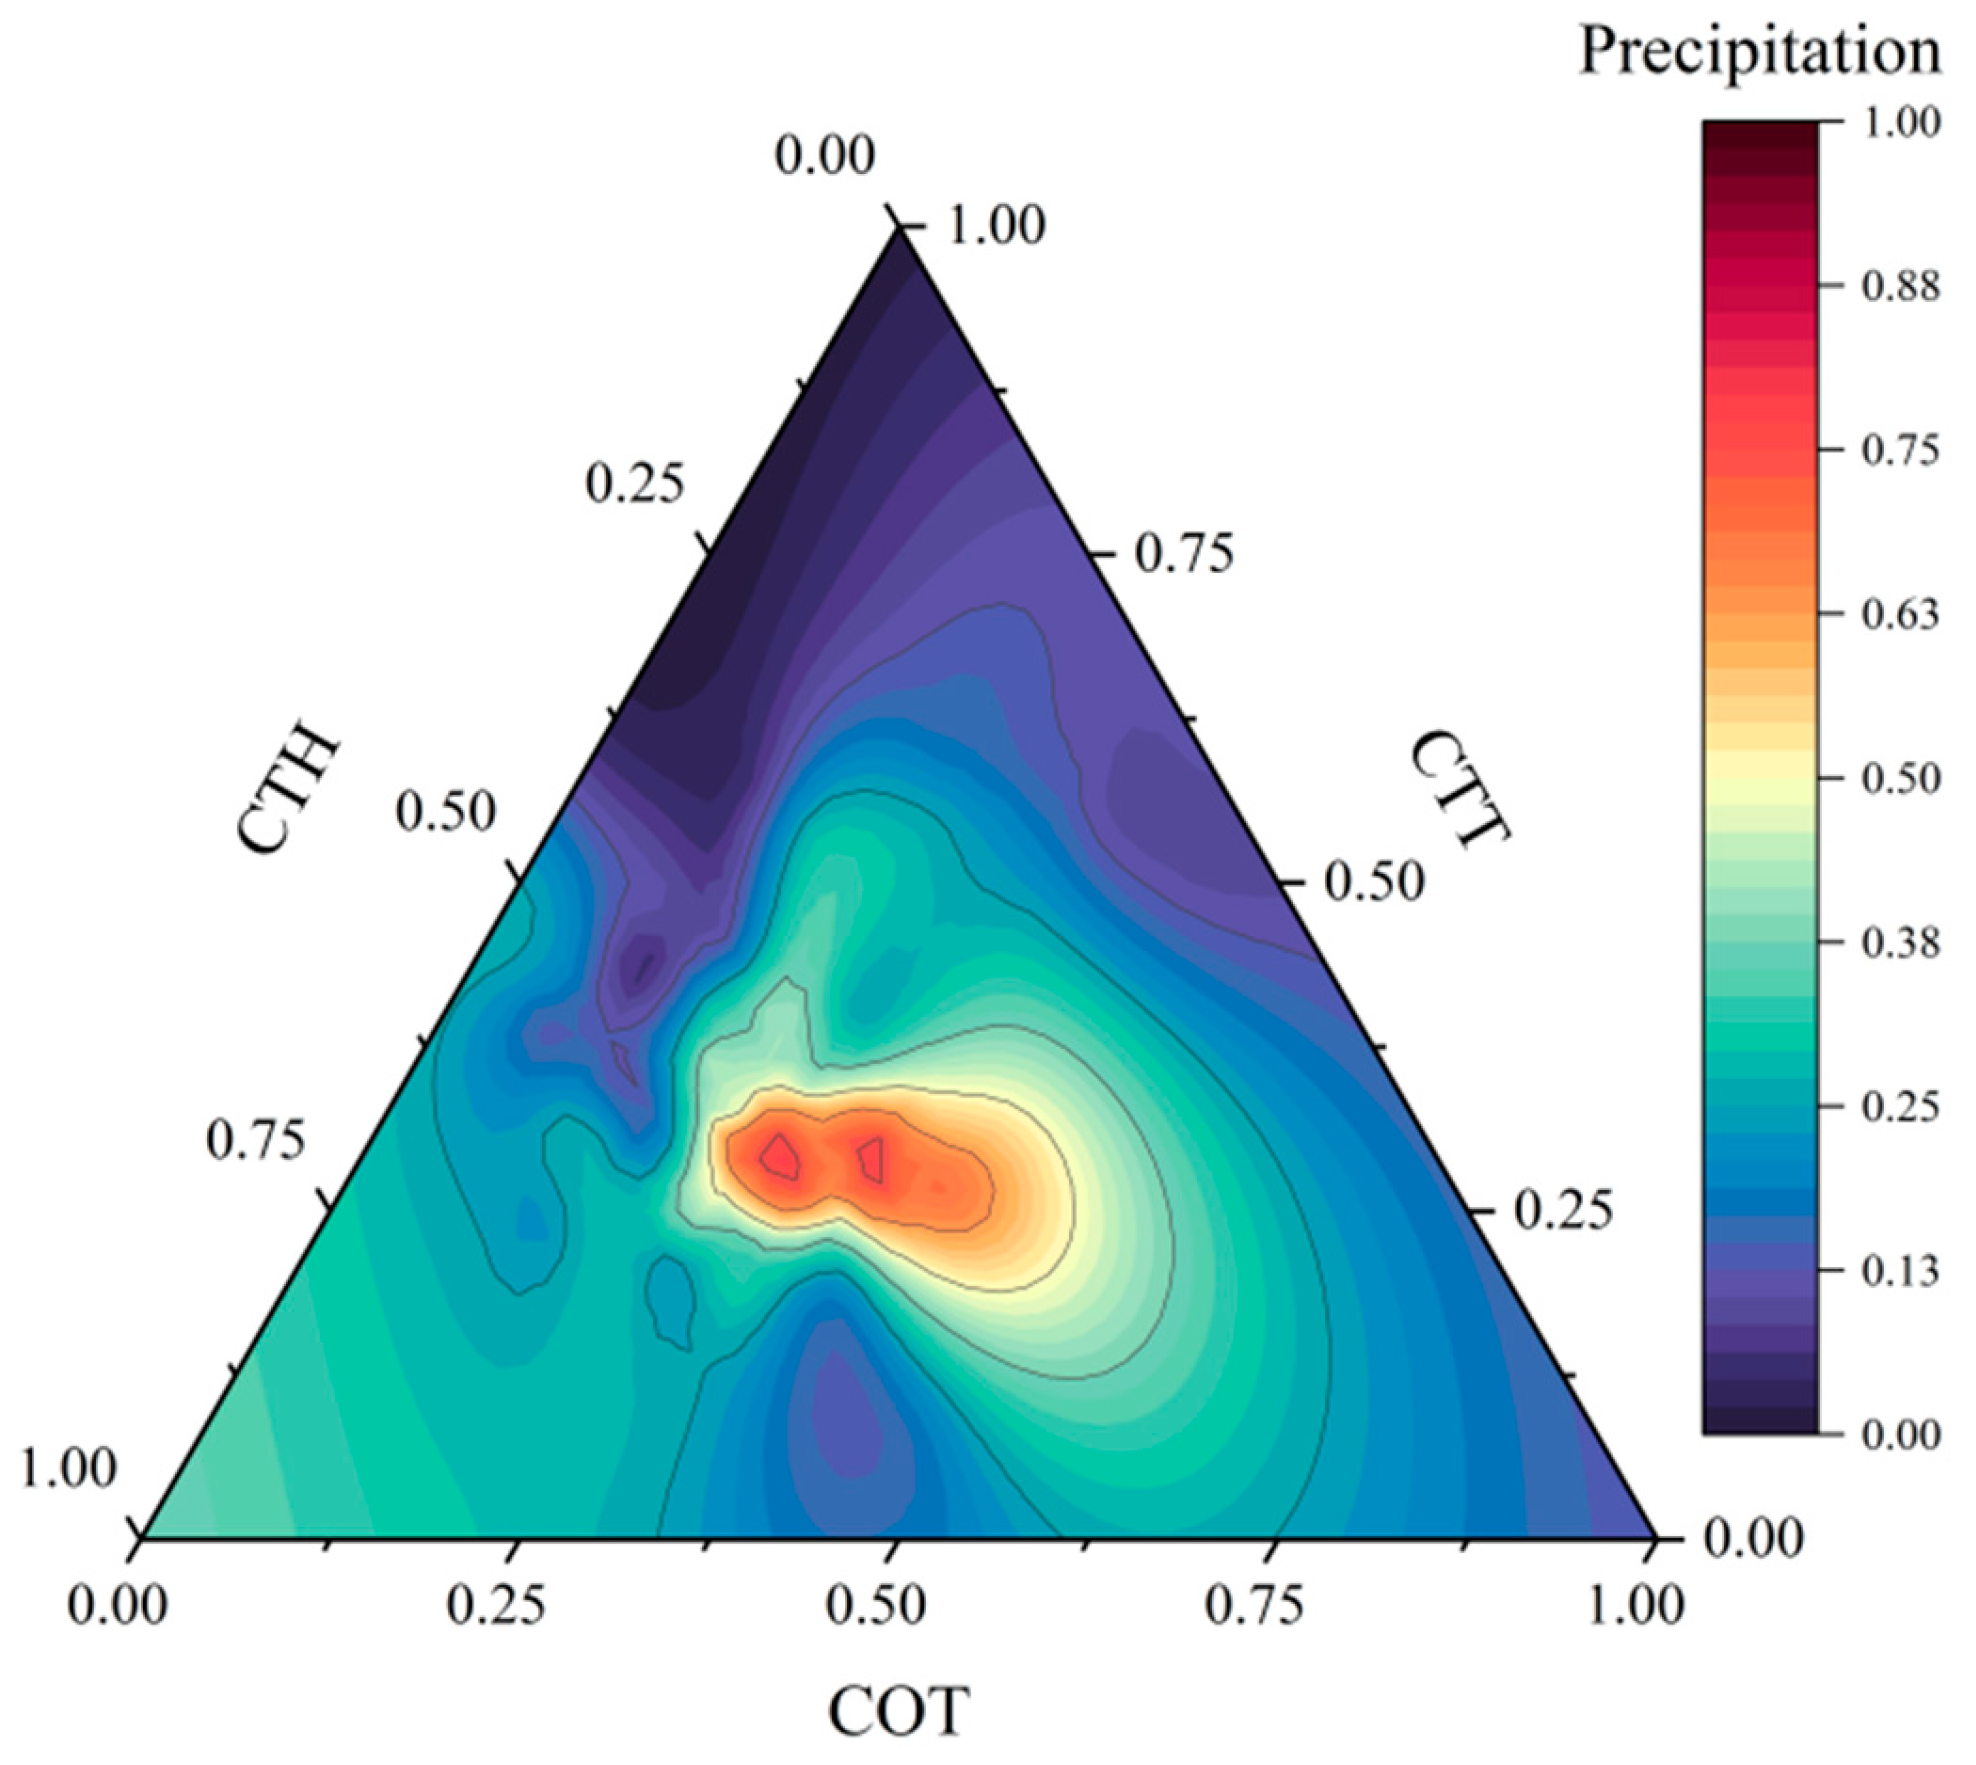
Figure 9 and Figure 10 provide a correlation between the cloud characteristics and typhoon precipitation. Figure 9a–c indicates the relationship between the COT, CTT, CTH, and typhoon precipitation. The results revealed that high precipitation occurred in the high- and low-CTH regions. A higher CTH reflects a stronger vertical development of clouds. In the high-CTH region, the updraft in the cloud system was strong, and the cloud droplets condensed at a higher position, whereas a lower CTT was more conducive to the condensation of water vapor. The interaction between the two provides a suitable atmospheric environment for heavy typhoon precipitation. Additionally, Figure 10 presents the relationship among surface temperature, CTH, and CTT which also indicates that the ocean is more conducive to the vertical development of typhoon clouds, thus enhancing the precipitation process.
In summary, there is a close relationship between the change in typhoon cloud characteristics and precipitation. Within the scope of a typhoon, high CTH and low CTT areas are more likely to form heavy precipitation, and compared to that of CTT and CTH, the relationship between COT and precipitation is not obvious. However, the relationship between cloud characteristics and precipitation is complex and variable and is affected by many factors. In addition to cloud height and top temperature, other factors, such as water vapor content, vertical airflow intensity, and atmospheric stability, also exert an impact on precipitation. Therefore, in future studies, it will be necessary to comprehensively consider cloud characteristics and other meteorological factors to fully understand the mechanisms and variations in typhoon precipitation.

4.2. Influence and Limitations

Typhoons are common natural disasters in East Asia and are often accompanied by strong hurricanes and rainstorms. They not only pose a great threat to the normal production and the life of coastal residents but also exert an important impact on the regional climate and environment. This is an important natural weather system [48,49]. Studying the activity and variation characteristics of typhoons is of great significance not only for society but also in the context of science. Common studies examining typhoon activity and variation characteristics have predominantly focused on analyzing typhoon movement paths and internal structural characteristics. Although a numerical model based on dynamics can simulate the movement trend of typhoons well [50,51], due to the complexity of the atmospheric structure, its simulation accuracy must be further verified. Additionally, for a dynamic analysis of typhoon motion trends, it is important to obtain real-time typhoon simulation or monitoring results. The Himawari-8 satellite provides real-time satellite cloud images and helps researchers obtain continuous typhoon data. However, morphological image monitoring methods sometimes lack important information regarding typhoons [5,6]. The typhoon monitoring method based on the YOLOv5 model can quickly and accurately locate typhoon areas in satellite cloud images and provide real-time typhoon monitoring data for dynamic analysis of typhoon structures. This method exhibits good accuracy for monitoring regular typhoon structures such as the eye or spiral typhoon structures. However, in the early stages of typhoon formation and typhoon dissipation, the monitoring results of the YOLOv5 model may possess errors due to the irregular structural characteristics of typhoons.
Additionally, to analyze the changing trend of typhoon characteristics, the characteristic parameters of typhoons were simplified to the characteristics of wind speed or precipitation at the center of a typhoon [17,52]. As important indices for evaluating the intensity of typhoons, precipitation and wind speed typically provide important information regarding the characteristics of typhoon changes [53]. However, as typhoons are complex weather systems, it is difficult to obtain complete typhoon details by relying only on a single parameter, such as the central wind speed or precipitation, due to the interaction of various factors. In contrast, the cloud top height, cloud top temperature, and cloud optical thickness of a typhoon, all of which are important characteristic parameters of a cloud system, can not only reflect the structure and intensity information of a typhoon but also reveal the energy exchange process and thermal characteristics of typhoons. This is of great significance for studying the internal structural transformation characteristics of typhoons at each stage. However, due to the limitations of geostationary meteorological satellite observation methods, Himawari-8 L2 cloud products can only provide information on the changes in typhoon clouds and cannot directly obtain the vertical structural characteristics of typhoons. This makes it difficult to further reveal the vertical exchange of energy within the typhoon system, and therefore, it is impossible to study the internal structural transformation of typhoons at different stages.
In summary, by analyzing the variations in typhoon characteristics, the evolution mechanism of typhoons can be understood. This is of great significance for improving typhoon monitoring, early warning models, and typhoon disaster response capabilities. However, there are still some unsolved problems in this study that must be further explored in future research.

4.3. Prospect

The movement trends of typhoons are affected by multiple physical processes and systems. These effects involve the dynamics and thermodynamic processes within the typhoon, the interaction between the typhoon and the environment, and the change in the underlying surface [54]. The prediction and mechanism research of its change trend remains a challenging scientific problem. In this study, the typhoon “Infa” was taken as an example. Based on the Himawari-8 L2 cloud product, the change trend of cloud characteristics within the typhoon “Infa” was discussed, and this exerted a profound impact on the in-depth understanding of the evolution mechanism inside the typhoon. The results indicate that the formation and development of typhoons are a continuous and gradual process. The cloud characteristics within a typhoon typically exhibit a slow changing trend with no obvious fluctuation characteristics. However, when the typhoon system is close to land and makes landfall, there may be an obvious trend inside the typhoon that is closely related to changes in the underlying surface. However, typhoons are three-dimensional climate systems, and their internal structures may exhibit complex characteristics and changes in the vertical direction. Their vertical characteristics are of great significance for studying energy exchange trends within typhoons. The Himawari-8 L2 cloud product typically presents the characteristic cloud information in the form of a two-dimensional image, and therefore, it cannot directly express the vertical structure inside the typhoon that hinders further understanding of the thermal energy exchange in the typhoon system. To further obtain the vertical structure within a typhoon, other observation methods can be combined in future research, such as weather radar [55] and aircraft detection [56]. By obtaining the vertical distribution information of precipitation and clouds within a typhoon, the vertical structure and variation characteristics inside the typhoon can be more comprehensively understood.
Additionally, typhoon activity may undergo many changes [57,58]. Global warming may lead to an increase in ocean surface temperatures. A warm ocean surface is more conducive to the formation and strengthening of typhoons that will bring great challenges to the safety of life and property for coastal residents. In future research, we can strengthen the research on the relationship between typhoons and climate change, further analyze and monitor the trends of future typhoon activities, and provide a scientific basis for disaster response and adaptation measures.

5. Conclusions

In view of the change in cloud structure in the process of typhoon movement, this study uses Himawari-8 satellite data and typhoon “Infa” as an example to study multi-stage cloud characteristics in the process of typhoon evolution. The specific conclusions are described below.
First, combined with the YOLOv5 model and the brightness temperature perturbation algorithm, the typhoon “Infa” is monitored and located to obtain a high-precision typhoon path. The results demonstrated that the YOLOv5 model performed well in the context of typhoon monitoring. The monitoring rate and accuracy of eyed typhoons are 99% and 90%, and the monitoring rate and accuracy of eyeless typhoons were 64% and 83%. This further confirms the feasibility and accuracy of the YOLOv5 algorithm for typhoon event monitoring. Additionally, the brightness temperature perturbation algorithm can provide high-precision typhoon positioning results. The goodness of the fit of the positioning longitude and latitude to the latitude and longitude of the CMA typhoon center was approximately 0.99, thus indicating that this method can provide a scientific and effective means for monitoring typhoon tracks. To compensate for the shortcomings of this method in regard to monitoring eyeless typhoon events, future research could improve the accuracy and reliability of eyeless typhoon monitoring by expanding the proportion of eyeless typhoons in the dataset to provide more comprehensive and accurate data support for the monitoring of various typhoon events.
Second, to deeply understand the structural changes during the typhoon movement, this study analyzes the multi-stage cloud characteristics of typhoon “Infa” based on typhoon positioning results and the Himawari-8 L2 cloud product data. The results revealed that during the development of the typhoon, the characteristics of the cloud system gradually increased, the cloud clusters became denser, and parameters such as cloud optical thickness, cloud top height, and cloud top temperature changed significantly. However, when a typhoon is close to land, a change in the underlying surface will affect the internal heat exchange of the typhoon, the cloud structure will gradually collapse, and the cloud parameters will decrease rapidly.
Finally, to understand the reasons for the change in the typhoon “Infa” cloud system, this study further analyzed the influence of terrain and surface temperature on typhoon characteristics. The results demonstrate that there is a correlation between the change in the typhoon cloud system, terrain, and surface temperature. Among them, the change in COT is primarily affected by terrain factors, and its correlation is −0.18. The changes in CTT and CTH were primarily affected by changes in surface temperature, and the correlations were −0.69 and −0.37, respectively. Compared to land and ocean, the ocean area is more conducive to the vertical development of typhoon clouds and provides favorable conditions for extreme precipitation. Considering the interaction between topography and surface temperature is helpful for understanding the mechanism of typhoon cloud formation and evolution and exerts an important influence on further analysis of typhoon precipitation conditions.
In summary, this study has performed a more comprehensive analysis of the cloud characteristics and trends of typhoon “Infa”, and this provides an important basis for further understanding the evolution mechanism inside the typhoon. Simultaneously, through the analysis of surface temperature and terrain, this study also provides a new research idea for the monitoring and early warning of typhoon characteristics. This is of great significance for typhoon disaster prevention and mitigation and also for studying the impact of future climate change on typhoon activity.

Author Contributions

M.W.: data analysis, methodology, writing. Y.C.: supervision, data analysis, funding acquisition. J.Y.: data analysis, review and editing. H.Z.: review and editing. N.Z.: review and editing. X.J.: review and editing. J.L. and Z.G.: review and editing. All authors have read and agreed to the published version of the manuscript.

Funding

This work was jointly supported by grants from the Belt and Road Special Foundation of the State Key Laboratory of Hydrology-Water Resources and Hydraulic Engineering (2021nkzd02), and the study on automatic correction of atmospheric scattering error of satellite laser measurement based on deep learning (42301501).

Institutional Review Board Statement

Not applicable.

Informed Consent Statement

Not applicable.

Data Availability Statement

The data presented in this study are available on request from the corresponding author. The data are not publicly available due to privacy restrictions.

Conflicts of Interest

The authors declare no conflict of interest.

References

  1. Chen, R.; Zhang, W.; Wang, X. Machine learning in tropical cyclone forecast modeling: A review. Atmosphere 2020, 11, 676. [Google Scholar] [CrossRef]
  2. Nakamura, J.; Camargo, S.J.; Sobel, A.H.; Henderson, N.; Emanuel, K.A.; Kumar, A.; LaRow, T.E.; Murakami, H.; Roberts, M.J.; Scoccimarro, E. Western North Pacific tropical cyclone model tracks in present and future climates. J. Geophys. Res. Atmos. 2017, 122, 9721–9744. [Google Scholar] [CrossRef]
  3. Rüttgers, M.; Lee, S.; Jeon, S.; You, D. Prediction of a typhoon track using a generative adversarial network and satellite images. Sci. Rep. 2019, 9, 6057. [Google Scholar] [CrossRef] [PubMed]
  4. Yang, X.; Zhan, Z.; Shen, J. A deep learning based method for typhoon recognition and typhoon center location. In Proceedings of the IGARSS 2019—2019 IEEE International Geoscience and Remote Sensing Symposium, Yokohama, Japan, 28 July–2 August 2019; pp. 9871–9874. [Google Scholar]
  5. Intajag, S.; Paithoonwatanakij, K.; Cracknell, A.P. Iterative satellite image segmentation by fuzzy hit-or-miss and homogeneity index. IEE Proc. Vis. Image Signal Process. 2006, 153, 206–214. [Google Scholar] [CrossRef]
  6. Ooi, W.S.; Lim, C.P. Fuzzy clustering of color and texture features for image segmentation: A study on satellite image retrieval. J. Intell. Fuzzy Syst. 2006, 17, 297–311. [Google Scholar]
  7. Zhou, J.; Xiang, J.; Huang, S. Classification and prediction of typhoon levels by satellite cloud pictures through GC–LSTM deep learning model. Sensors 2020, 20, 5132. [Google Scholar] [CrossRef] [PubMed]
  8. Jiaqi, Y.; Jiyi, C.; Yun, C.; Chaozhen, L.; Guoyuan, L. Cloud detection of remote sensing images based on deep learning and condition random field. Sci. Surv. Mapp. 2019, 258, 121–127. [Google Scholar]
  9. Bai, L.; Tang, J.; Guo, R.; Zhang, S.; Liu, K. Quantifying interagency differences in intensity estimations of Super Typhoon Lekima (2019). Front. Earth Sci. 2022, 16, 5–16. [Google Scholar] [CrossRef]
  10. Shi, C.; Wang, C.; Wang, Y.; Xiao, B. Deep convolutional activations-based features for ground-based cloud classification. IEEE Geosci. Remote Sens. Lett. 2017, 14, 816–820. [Google Scholar] [CrossRef]
  11. Zhao, L.; Chen, Y.; Sheng, V.S. A real-time typhoon eye detection method based on deep learning for meteorological information forensics. J. Real-Time Image Process. 2020, 17, 95–102. [Google Scholar] [CrossRef]
  12. Tan, C. Tclnet: Learning to locate typhoon center using deep neural network. In Proceedings of the 2021 IEEE International Geoscience and Remote Sensing Symposium IGARSS, Brussels, Belgium, 11–16 July 2021; pp. 4600–4603. [Google Scholar]
  13. Li, L.; Shuai, Z.; Hu, J.; Zhang, Y. Classification of Tropical Cyclone Intensity Based on Deep Learning and YOLO V5. In Proceedings of the International Conference on Artificial Intelligence and Security, Qinghai, China, 22–26 July 2022; pp. 280–291. [Google Scholar]
  14. Jocher, G.; Chaurasia, A.; Stoken, A.; Borovec, J.; Kwon, Y.; Fang, J.; Michael, K.; Montes, D.; Nadar, J.; Skalski, P. Ultralytics/Yolov5: V6. 1-Tensorrt, Tensorflow Edge Tpu and Openvino Export and Inference; Version 6.1; Zenodo: Meyrin, Switzerland, 2022. [Google Scholar] [CrossRef]
  15. Takemi, T.; Unuma, T. Environmental factors for the development of heavy rainfall in the eastern part of Japan during Typhoon Hagibis (2019). Sola 2020, 16, 30–36. [Google Scholar] [CrossRef]
  16. Choi, J.; Lee, J.; Kim, S. Impact of sea surface temperature and surface air temperature on maximizing typhoon rainfall: Focusing on typhoon maemi in Korea. Adv. Meteorol. 2019, 2019, 1930453. [Google Scholar] [CrossRef]
  17. Nayak, S.; Takemi, T. Statistical analysis of the characteristics of typhoons approaching Japan from 2006 to 2019. Geomat. Nat. Hazards Risk 2023, 14, 2208722. [Google Scholar] [CrossRef]
  18. Wu, Z.; Huang, Y.; Zhang, Y.; Zhang, L.; Lei, H.; Zheng, H. Precipitation characteristics of typhoon Lekima (2019) at landfall revealed by joint observations from GPM satellite and S-band radar. Atmos. Res. 2021, 260, 105714. [Google Scholar] [CrossRef]
  19. Wanting, C.; Wenhua, G.; Yihong, D.; Lin, D. The impact of cloud microphysical processes on typhoon numerical simulation. J. Appl. Meteorol. Sci. 2019, 30, 443–455. [Google Scholar]
  20. Tsuboki, K.; Luo, Y. High-resolution simulations of heavy rainfalls in association with monsoon systems and typhoons using cloud-resolving models. Multiscale Glob. Monsoon Syst. 2020, 10, 113–131. [Google Scholar]
  21. Zhao, Y.; Zhao, C.; Sun, R.; Wang, Z. A multiple linear regression model for tropical cyclone intensity estimation from satellite infrared images. Atmosphere 2016, 7, 40. [Google Scholar] [CrossRef]
  22. Judt, F.; Chen, S.S. Predictability and dynamics of tropical cyclone rapid intensification deduced from high-resolution stochastic ensembles. Mon. Weather Rev. 2016, 144, 4395–4420. [Google Scholar] [CrossRef]
  23. Huang, Y.; Siems, S.T.; Manton, M.J.; Rosenfeld, D.; Marchand, R.; McFarquhar, G.M.; Protat, A. What is the role of sea surface temperature in modulating cloud and precipitation properties over the Southern Ocean? J. Clim. 2016, 29, 7453–7476. [Google Scholar] [CrossRef]
  24. Huang, Y.; Siems, S.; Manton, M.; Protat, A.; Majewski, L.; Nguyen, H. Evaluating Himawari-8 cloud products using shipborne and CALIPSO observations: Cloud-top height and cloud-top temperature. J. Atmos. Ocean. Technol. 2019, 36, 2327–2347. [Google Scholar] [CrossRef]
  25. Tan, J.; Yang, Q.; Hu, J.; Huang, Q.; Chen, S. Tropical cyclone intensity estimation using Himawari-8 satellite cloud products and deep learning. Remote Sens. 2022, 14, 812. [Google Scholar] [CrossRef]
  26. Lu, J.; Feng, T.; Li, J.; Cai, Z.; Xu, X.; Li, L.; Li, J. Impact of assimilating Himawari-8-derived layered precipitable water with varying cumulus and microphysics parameterization schemes on the simulation of Typhoon Hato. J. Geophys. Res. Atmos. 2019, 124, 3050–3071. [Google Scholar] [CrossRef]
  27. Bessho, K.; Date, K.; Hayashi, M.; Ikeda, A.; Imai, T.; Inoue, H.; Kumagai, Y.; Miyakawa, T.; Murata, H.; Ohno, T. An introduction to Himawari-8/9—Japan’s new-generation geostationary meteorological satellites. J. Meteorol. Soc. Japan. Ser. II 2016, 94, 151–183. [Google Scholar] [CrossRef]
  28. Letu, H.; Nagao, T.M.; Nakajima, T.Y.; Riedi, J.; Ishimoto, H.; Baran, A.J.; Shang, H.; Sekiguchi, M.; Kikuchi, M. Ice cloud properties from Himawari-8/AHI next-generation geostationary satellite: Capability of the AHI to monitor the DC cloud generation process. IEEE Trans. Geosci. Remote Sens. 2018, 57, 3229–3239. [Google Scholar] [CrossRef]
  29. Heidinger, A. Algorithm Theoretical Basis Document: ABI Cloud Mask; University of Wisconsin: Madison, WI, USA, 2011. [Google Scholar]
  30. Nakajima, T.Y.; Nakajma, T. Wide-area determination of cloud microphysical properties from NOAA AVHRR measurements for FIRE and ASTEX regions. J. Atmos. Sci. 1995, 52, 4043–4059. [Google Scholar] [CrossRef]
  31. Yang, Y.; Zhao, C.; Fan, H. Spatiotemporal distributions of cloud properties over China based on Himawari-8 advanced Himawari imager data. Atmos. Res. 2020, 240, 104927. [Google Scholar] [CrossRef]
  32. Purbantoro, B.; Aminuddin, J.; Manago, N.; Toyoshima, K.; Lagrosas, N.; Sumantyo, J.T.S.; Kuze, H. Comparison of Aqua/Terra MODIS and Himawari-8 satellite data on cloud mask and cloud type classification using split window algorithm. Remote Sens. 2019, 11, 2944. [Google Scholar] [CrossRef]
  33. Ying, M.; Zhang, W.; Yu, H.; Lu, X.; Feng, J.; Fan, Y.; Zhu, Y.; Chen, D. An overview of the China Meteorological Administration tropical cyclone database. J. Atmos. Ocean. Technol. 2014, 31, 287–301. [Google Scholar] [CrossRef]
  34. Lu, X.; Yu, H.; Ying, M.; Zhao, B.; Zhang, S.; Lin, L.; Bai, L.; Wan, R. Western North Pacific tropical cyclone database created by the China Meteorological Administration. Adv. Atmos. Sci. 2021, 38, 690–699. [Google Scholar] [CrossRef]
  35. Liu, Z.; Gao, X.; Wan, Y.; Wang, J.; Lyu, H. An Improved YOLOv5 Method for Small Object Detection in UAV Capture Scenes. IEEE Access 2023, 11, 14365–14374. [Google Scholar] [CrossRef]
  36. Wu, W.; Liu, H.; Li, L.; Long, Y.; Wang, X.; Wang, Z.; Li, J.; Chang, Y. Application of local fully Convolutional Neural Network combined with YOLO v5 algorithm in small target detection of remote sensing image. PLoS ONE 2021, 16, e0259283. [Google Scholar] [CrossRef] [PubMed]
  37. Qiu, M.; Huang, L.; Tang, B.-H. Bridge detection method for HSRRSIs based on YOLOv5 with a decoupled head. Int. J. Digit. Earth 2023, 16, 113–129. [Google Scholar] [CrossRef]
  38. Krishna, K.; Murty, M.N. Genetic K-means algorithm. IEEE Trans. Syst. Man Cybern. Part B 1999, 29, 433–439. [Google Scholar] [CrossRef] [PubMed]
  39. Rezatofighi, H.; Tsoi, N.; Gwak, J.; Sadeghian, A.; Reid, I.; Savarese, S. Generalized intersection over union: A metric and a loss for bounding box regression. In Proceedings of the IEEE/CVF Conference on Computer Vision and Pattern Recognition, Long Beach, CA, USA, 15–20 June 2019; pp. 658–666. [Google Scholar]
  40. Xie, T.; Chen, J.; Yan, J. A New Objective Typhoon Location Algorithm Considering a Perturbation Factor Based on FY-4A Brightness Temperature Data. J. Atmos. Ocean. Technol. 2022, 39, 2023–2038. [Google Scholar] [CrossRef]
  41. Tao, X.; Jiajun, C.; Junjie, Y. Research on the spatial disturbance characteristic of brightness temperature in typhoon center region and the application of typhoon positioning. J. Nat. Disasters 2023, 32, 161–177. [Google Scholar]
  42. Xie, T.; Perrie, W.; Chen, W. Gulf Stream thermal fronts detected by synthetic aperture radar. Geophys. Res. Lett. 2010, 37, L06601. [Google Scholar] [CrossRef]
  43. Jian, Y.; Lin, D.; Jing, C.; Jingzhuo, W.; Hongqi, L. Effect of Ensemble Initial Perturbations with Rescaling on the Forecast of Typhoon In-Fa (2106). Meteorol. Mon. 2023, 49, 773–789. [Google Scholar]
  44. Nie, Y.; Sun, J. Moisture sources and transport for extreme precipitation over Henan in July 2021. Geophys. Res. Lett. 2022, 49, e2021GL097446. [Google Scholar] [CrossRef]
  45. Min, Z.; Zhang, H.; Hai-Bo, W.; Xi-Xun, Z.; Li, Z.; Qi, A.; Qi, C. The change of cloud top height over East Asia during 2000–2018. Adv. Clim. Change Res. 2020, 11, 110–117. [Google Scholar]
  46. Rezaei, M.; Farajzadeh, M.; Kant, S. The observational evidence of association between types of aerosol mode-cloud-precipitation interaction over Iran. Atmos. Pollut. Res. 2023, 14, 101760. [Google Scholar] [CrossRef]
  47. Qian, Z.; Chengyan, M.; Lihua, D.; Junyu, L.; Xin, P.; Pei, L.; Yiwen, L.; Yi, H. Comparison of cloud characteristics between Typhoon Lekima (1909) and Typhoon Yagi (1814). J. Appl. Meteorol. Sci. 2022, 33, 43–55. [Google Scholar]
  48. Chen, W.; Yang, S.; Wu, Z.; Cai, F. Large-scale atmospheric features favoring the tropical cyclone activity affecting the Guangdong–Hong Kong–Macao Greater Bay Area of China. Environ. Res. Lett. 2022, 17, 104057. [Google Scholar] [CrossRef]
  49. Chen, A.; Huang, H.; Wang, J.; Li, Y.; Chen, D.; Liu, J. An analysis of the spatial variation of tropical cyclone rainfall trends in Mainland Southeast Asia. Int. J. Climatol. 2023, 43, 5912–5926. [Google Scholar] [CrossRef]
  50. Sun, J.-P.; Lv, G.-J.; Ma, X.-G. An improved typhoon simulation method based on Latin hypercube sampling method. Sci. Rep. 2022, 12, 9313. [Google Scholar] [CrossRef] [PubMed]
  51. Zhang, Y.; Cao, S.; Zhao, L.; Cao, J. A case application of WRF-UCM models to the simulation of urban wind speed profiles in a typhoon. J. Wind Eng. Ind. Aerodyn. 2022, 220, 104874. [Google Scholar] [CrossRef]
  52. Gao, Y.; Zhang, Y.; Lei, L.; Tang, J. Multi-scale characteristics of an extreme rain event in Shandong Province, produced by Typhoon Lekima (2019). Front. Earth Sci. 2023, 10, 1093545. [Google Scholar] [CrossRef]
  53. Rüttgers, M.; Jeon, S.; Lee, S.; You, D. Prediction of typhoon track and intensity using a generative adversarial network with observational and meteorological data. IEEE Access 2022, 10, 48434–48446. [Google Scholar] [CrossRef]
  54. Tsujino, S.; Tsuboki, K. Intensity change of Typhoon Nancy (1961) during landfall in a moist environment over Japan: A numerical simulation with spectral nudging. J. Atmos. Sci. 2020, 77, 1429–1454. [Google Scholar] [CrossRef]
  55. Miao, H.; Wang, X.; Liu, Y.; Wu, G. An evaluation of cloud vertical structure in three reanalyses against CloudSat/cloud-aerosol lidar and infrared pathfinder satellite observations. Atmos. Sci. Lett. 2019, 20, e906. [Google Scholar] [CrossRef]
  56. Yamada, H.; Ito, K.; Tsuboki, K.; Shinoda, T.; Ohigashi, T.; Yamaguchi, M.; Nakazawa, T.; Nagahama, N.; Shimizu, K. The double warm-core structure of Typhoon Lan (2017) as observed through the first Japanese eyewall-penetrating aircraft reconnaissance. J. Meteorol. Soc. Japan. Ser. II 2021, 99, 1297–1327. [Google Scholar] [CrossRef]
  57. Li, S.; Otto, F.E. The role of human-induced climate change in heavy rainfall events such as the one associated with Typhoon Hagibis. Clim. Change 2022, 172, 7. [Google Scholar] [CrossRef]
  58. Lee, T.-C.; Knutson, T.R.; Nakaegawa, T.; Ying, M.; Cha, E.J. Third assessment on impacts of climate change on tropical cyclones in the Typhoon Committee Region—Part I: Observed changes, detection and attribution. Trop. Cyclone Res. Rev. 2020, 9, 1–22. [Google Scholar] [CrossRef]
Figure 1. Research flow chart.
Atmosphere 14 01820 g001
Figure 2. YOLOv5 model network structure.
Atmosphere 14 01820 g002
Figure 3. YOLOv5 target detection results. (a) includes the typhoon event and confidence detected by YOLOv5, (b) is the amplification area of typhoon events, and (c) is the bright temperature value distribution of typhoon events.
Atmosphere 14 01820 g003
Figure 4. Typhoon center positioning results. (a) is the calculation result of the light temperature disturbance of the typhoon event, (b) is the distribution matrix of the light temperature disturbance value in the typhoon eye area, and (c) the result is the positioning result of the typhoon center.
Atmosphere 14 01820 g004
Figure 5. Typhoon track. (a) is the typhoon path obtained in this experiment, and (b) and (c) are similar results of the direction of longitude and latitude of the typhoon positioning center and the typhoon center of CMA, respectively.
Atmosphere 14 01820 g005
Figure 6. The spatial distribution of wind cloud characteristics.
Atmosphere 14 01820 g006
Figure 7. Time series of cloud characteristics at different stages of typhoons. (a) including the change trend of COT, CTH and CTT over time, (b) is the change of COT, CTH and CTT in each stage of typhoon.
Atmosphere 14 01820 g007
Figure 8. The relationship between typhoon cloud characteristics, surface temperature, and DEM.
Atmosphere 14 01820 g008
Figure 9. The relationship between Taiwan storm characteristics, rainfall and surface temperature and DEM. (a) is the relationship between COT and DEM and rainfall, (b) is the relationship between CTT and surface temperature and rainfall, and (c) is the relationship between CTH and surface temperature and rainfall.
Atmosphere 14 01820 g009
Figure 10. Typhoon cloud characteristics and precipitation.
Atmosphere 14 01820 g010
Table 1. Himawari-8 Product Introduction.
DatasetProductData Type
Himawari-8 L1 data#13Brightness temperature
Himawari-8 L2 Cloud ProductsCOTCloud optical thickness
CTHCloud-top height
CTTCloud-top temperature
CTYPECloud type (ISCCP definition)
Table 2. The specific composition of the CMA optimal path dataset of typhoon “Infa”.
Variable NameDescription
YYYYMMDDHHRecord the time of typhoon
IThe intensity of typhoon is marked by the average wind speed of 2 min before the positive point.
0—weaker than the tropical depression (TD), or the level is unknown.
1—tropical low (TD, 10.8—17.1 m/s).
2—Tropical storm (TS, 17.2—24.4 m/s).
3—Severe Tropical Storm (STS, 24.5—32.6 m/s).
4—Typhoon (TY, 32.7—41.4 m/s).
5—Strong Typhoon (STY, 41.5—50.9 m/s).
6—Super Typhoon (SuperTY, ≥51.0 m/s).
9—degeneration
LATThe current latitude of typhoon is (0.1° N).
LONGThe current longitude of the typhoon (0.1° N)
PRESThe lowest pressure in typhoon center (hPa)
WNDTyphoon 2-min average near-center maximum wind speed (m/s)
OWDTyphoon 2 min average wind speed (m/s)
Table 3. The distance between the positioning results and the CMA typhoon center.
DateThe Distance from the CMA Typhoon Center of the Location ResultDateThe Distance from the CMA Typhoon Center of the Location Result
19 July 0:003.523 July 12:0029.6
19 July 20:0011.223 July 18:003.8
20 July 0:007.924 July 0:0022.3
20 July 12:008.324 July 12:0048.8
20 July 18:0011.124 July 21:0011.3
21 July 6:00425 July 0:0020.6
21 July 12:0016.125 July 3:0017.4
21 July 18:001625 July 6:0047.5
22 July 0:0011.425 July 15:0047
22 July 6:003.725 July 18:0033
22 July 12:0035.926 July 6:0043.3
22 July 18:008.326 July 9:0031.6
Table 4. Cloud characteristics at each stage of typhoons.
COTCTHCTT
Standard deviation0.971.0129.04
Variance0.941.01843.55
Maximum6.594.16106.68
Minimum3.821.1634.19
Max-Min2.783.0072.49
Disclaimer/Publisher’s Note: The statements, opinions and data contained in all publications are solely those of the individual author(s) and contributor(s) and not of MDPI and/or the editor(s). MDPI and/or the editor(s) disclaim responsibility for any injury to people or property resulting from any ideas, methods, instructions or products referred to in the content.