Article

Assessment of the Air Cleaning Performance and Humidity and Temperature Control by Five Evergreen Woody Plants

1
Department of Horticultural Science, Chungbuk National University, Cheongju 28644, Republic of Korea
2
Division of Garden and Plant Resources, Korea National Arboretum, Pocheon 11186, Republic of Korea
*
Author to whom correspondence should be addressed.
Atmosphere 2023, 14(12), 1819; https://doi.org/10.3390/atmos14121819
Submission received: 27 September 2023 / Revised: 29 November 2023 / Accepted: 12 December 2023 / Published: 13 December 2023
(This article belongs to the Section Air Quality and Human Health)

Abstract

:
Indoor air quality (IAQ) directly affects human health. The increase in PM and CO2 concentration indoors caused an increase in the prevalence of sick building syndrome (SBS) symptoms. Plants could contribute to reducing particulate matter (PM) and CO2. This study identifies the most efficient evergreen plant species for improving indoor air quality by assessing the ability of five different indigenous Korean evergreen plant species to reduce PM and CO2 and regulate humidity and temperature under indoor environmental conditions in acrylic chambers. The clean air delivery rates (CADR) were calculated to evaluate the efficacy of plants in reducing PM and CO2. We assessed the performance of removing the five study plants on PM1 (~0.68–3.01 m3/h/leaf area), PM2.5 (~0.73–3.08 m3/h/leaf area), PM10 (~0.67–3.04 m3/h/leaf area), and CO2 (~0.48–1.04 m3/h/leaf area). The species Ilex pedunculosa, Pittosporum tobira, and Gardenia jasminoides were the most effective at reducing PM. The CADR of CO2 also differed among the five plant species and corresponded to their photosynthetic rate. Viburnum odoratissimum var. awabuki, which had the high photosynthetic rate, was most effective at reducing CO2. By contrast, PM reduction was correlated with plant leaf structure. Plants with a high leaf density can accumulate more PM. The plants were also able to control temperature and humidity. The average temperature of the control chamber was higher, and the humidity was lower than that of the plant chambers. In this study, the five evergreen species effectively reduced air pollutants and can be used to improve IAQ.

1. Introduction

Numerous studies have confirmed that urban residents spend more than 80% of their time indoors [1]. Therefore, indoor air quality (IAQ) is important. IAQ has a significant influence on human health, representing one of the greatest threats to well-being [2]. In some metropolitan areas, the indoor air is more polluted than the outdoor air. Poor IAQ can lead to sick building syndrome (SBS), which is characterized by symptoms for example headaches, nausea, lightheadedness, eye irritation, mucous membranes, and respiratory systems [3]. The SBS influenced people’s well-being, health, and productivity in indoor environments. High CO2 levels and low humidity contribute to sicknesses, such as eye dryness, migraines, and decreased academic performance. SBS has proven to be complex to understand, while symptom frequencies tend to be higher in women because of historical reasons, social position, lack of knowledge of female physiology, and chemical hypersensitivity [4]. Moreover, poor IAQ also results in increased absenteeism and negative emotions [5]. IAQ needs to be monitored and controlled to limit detrimental effects on human health.
Common indoor air pollutants include particulate matter (PM), total volatile organic compounds, and CO2. Indoor PM sources include outdoor infiltration and indoor origins. Meanwhile, the outdoor infiltration PM was created through the migration of the PM, which has an outdoor origin from the outdoor into the indoor environment [3]. The indoor origins of PM were set through people’s daily activities such as cooking and combustion (burning mosquito coils, candles, fireplaces, kerosene heaters, and cigarette smoking) [6]. Traditional buildings have used natural or mechanical ventilation to replace stale indoor air with fresh outdoor air. Natural ventilation uses pressure from wind or indoor–outdoor temperature differences to make natural airflow, while mechanical ventilation uses a fan input or output vents created for ventilation consumption to make an airflow [7]. However, these systems often lead to increased pollution due to outdoor-sourced pollutants such as PM or ozone [8,9,10]. Although ventilation systems and air conditioning are the most effective solutions for reducing air pollutants, they result in significant heat loss and energy consumption, particularly in winter [11]. Increasing ventilation rates and decreasing indoor air pollution may be the best solution to limit the detrimental effects of poor IAQ on human health. Using ventilation, isolation, and air cleaning to remove air pollution needs high energy and substantial capital investment [12]. To address these limitations, more effective methods must be developed to reduce air pollution and save energy. Using plants to reduce indoor air pollution can contribute to reducing ventilation requirements and helps reduce energy consumption for improving IAQ. By removing CO2, plants help reduce indoor ventilation requirements by about 6% under certain conditions [13]. Cummings and Waring [14] demonstrated that using plants to reduce indoor air pollution can save up to 10–20% of the energy loads from ventilation and air conditioning. Plants act as bio-purifiers by accumulating PM from the environment. Many studies have demonstrated the positive effects of plants on indoor and outdoor air quality [15,16,17,18]. Moreover, plants play a crucial role in balancing CO2 concentration, temperature, and humidity [19]. They utilize CO2, water, and light via photosynthesis, which is essential for their growth and survival [20]. During photosynthesis, plants can reduce the CO2 levels in the environment [21]. In addition, photosynthesis in plants generates negative air ions that are beneficial to human health [22]. However, studies on the correlation between CO2 levels and plants’ capability to remove CO2 are limited. Plants’ ability to mitigate PM and CO2 differs among plant species and environmental conditions [14]. Leaf characteristics, such as leaf area and hair, influence the amount of PM accumulated by plants [14,17,23]. Moreover, the accumulation of PM by plants is influenced by the PM concentration in the environment [24]. Under the same environmental conditions, the amount of PM accumulated on plant leaves varies depending on the adaptability of plants to air pollution [24,25]. Plants with leaf hair showed the more effective accumulation of PM than plants without hair. The presence of hair on leaves increased the surface area available for PM accumulation [26]. Przybysz et al. [27] found that plants with rough surfaces accumulated more PM compared to smoother plants. Additionally, the quantity and composition of leaf wax were influenced by PM accumulation [24]. Conversely, PM also affected the growth and development of plants. PM deposition on the leaf surface can block the stomata, leading to a reduction in light absorption and stomatal conductance, leading to a decrease in the photosynthetic rate of plants [28]. However, the extent of damage varied among plant species in response to environmental stress [29]. The tolerance level is affected by the damage level of the plant under stress from the environment. Similarly, the ability of plants to reduce CO2 is related to their photosynthetic rate [8]. However, the effectiveness of plants in reducing CO2 concentrations in indoor environments is affected by light conditions [11]. To maintain human comfort during occupancy, light intensities are often set between 500 and 1000 lx (photosynthetic photon flux densities of 10–50 μmol m−2 s−1). This is lower than the photosynthetic demand of numerous plant species [30]. Light intensity, temperature, and humidity can affect the photosynthetic rate of plants, thereby influencing their ability to reduce air pollution [19]. The density of CO2 ranged from 635 ppm to 650 ppm in the room without plants, while it could be decreased to 400 ppm in the room with plants within 6 h under light [10]. Therefore, selecting effective plants to reduce indoor air pollution under specific environmental conditions can enhance their ability to improve IAQ. The clean air delivery rate (CADR) indicates the clean air volume the treatment system delivers. Within construction engineering, the indoor air-cleaning capacity of the equipment is expressed by the clean air delivery rate (CADR) [31]. The CADR serves as a measure of the indoor air-cleaning potential of a standalone device. It represents the effective volumetric flow rate at which ‘clean’ air is supplied to the environment, thereby facilitating the removal of pollutants [14]. In the case of plants, the CADR can be used to reflect their air-cleaning ability.
The objective of this study was to determine the air-cleaning performance and ability to control the humidity and temperature of five Korean indigenous evergreen plants that can grow in indoor environments: Ilex × wandoensis C.F.Mill. & M.Kim, Ilex pedunculosa Miq., Gardenia jasminoides J.Ellis, Pittosporum tobira (Thunb.) W.T.Aiton, and Viburnum odoratissimum Ker Gawl. ex Rümpler var. awabuki (K.Koch) Zabel ex Rümpler. Additionally, the photosynthetic rate of these plants was examined to analyze its correlation with their capacity to mitigate atmospheric pollution. The analysis of air filtration was predicated on the clean air delivery rate (CADR) of PM and CO2. Five evergreen plant species were selected, and their effectiveness in reducing air pollution was assessed. By comparing these plant species, this study aimed to identify the most efficient evergreen plant species for optimizing air quality in an indoor environment. The results of this study provide information on the effectiveness of Korean indigenous evergreen plants in controlling IAQ under the state of the indoor environment.

2. Materials and Methods

2.1. Study Plant Species

Almost all the indoor plants used for indoor air phytoremediation are shrubs and herbs. This plant is limited to a small number of model species. In Korea, using diversified plant species for indoor landscapes is encouraging, especially using evergreens. Five indigenous Korean evergreen plants were selected for this study (Table 1, Figure 1). This study obtained and used the plants for the experiment from the Korea National Arboretum. Ilex × wandoensis is a hybrid formed by the natural crossbreeding of I. cornuta and I. integra. This hybrid exhibits intermediate characteristics between the two parent species, including spine on the leaf margin and leaf curvature, typical of both horned holly and elegance female holly. Ilex pedunculosa is native to Central China, Central Japan, and Taiwan. It primarily grows as a shrub or small tree in temperate ecosystems. This species is a hardy evergreen with red berries, small pleasantly scented flowers, and showy foliage. It lacks spines and resembles mountain laurel. Gardenia jasminoides is distributed from Indo-China to South, Central, and Southwestern Japan. It grows as a shrub mainly in subtropical ecosystems. It is used as a medicine and also for environmental purposes and as food. Pittosporum tobira is native to South Korea and South Central Japan, and it primarily grows as a shrub in subtropical ecosystems. It is utilized for medicinal and environmental purposes. Viburnum odoratissimum var. awabuki is distributed from Korea and Central and Southwestern Japan to Taiwan. It grows as a shrub or tree mainly in subtropical ecosystems.
Horticultural substrates (Wonjomix, Nongkyung Agroindustrial Co., Ltd., Jincheon, Korea) were used for this study. The study plants were planted in 15 cm diameter plastic pots and kept in a greenhouse for three months. Before the experiment, all plants for the experiment were cultivated in a laboratory with the same light intensity (50 μmol m−2 s−1) and temperature (25 °C) for three months indoors. For each plant species, 20 potted plants with relatively uniform growth were selected for the PM and CO2 experiments. The photosynthetic rate of each plant species was determined using a portable photosynthesis system (LCpro+, ADC BioScientific Ltd., Hoddesdon, UK). The leaf area meter (LI-3000A, LI-COR, Nebraska, USA) was used to evaluate the leaf area of each plant species after the study.

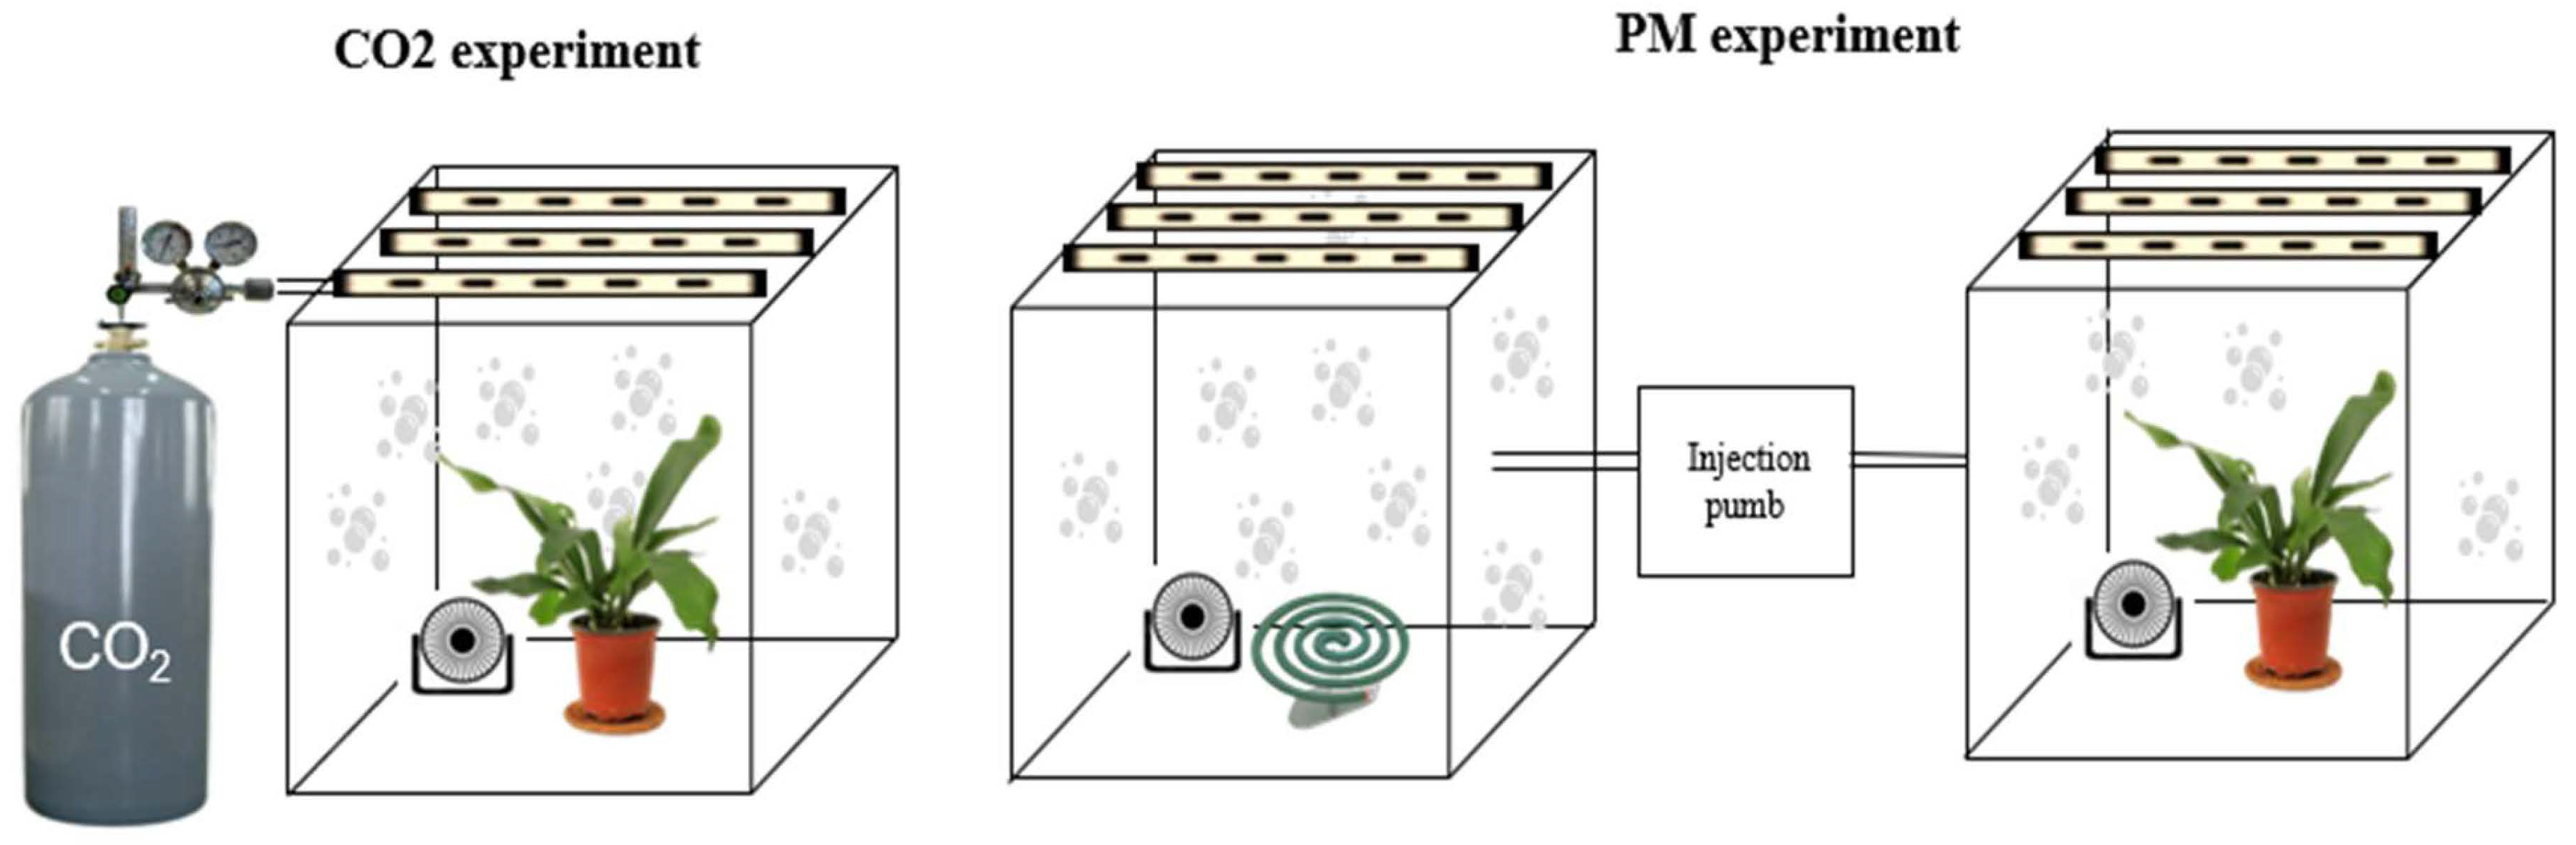
2.2. The PM and CO2 Reduction Study

Six acrylic chambers (800 mm × 800 mm × 1000 mm, L × W × H) were constructed as a model for the indoor environment. During the tests, an LED white light source panel was activated and placed on the top of the test chamber to provide light for the plants (50 μmol m−2 s−1). All test chambers were located in a controlled laboratory with a temperature of 25 °C, achieved using air conditioning. Two experimental chambers were prepared for the experiments: a treatment chamber (with plants) and a control chamber (without plants). Each set of experiments was repeated five times to evaluate the experimental conditions consistently. Five randomly selected potted plants were placed in the treatment chamber. A mosquito coil was used as the PM source. The coil was burned in a closed chamber connected to the treatment chamber by a valve to channel the smoke into the chamber as a PM source. After burning the mosquito coil for 10 min, PM was injected into the chamber until the initial concentration of PM was 300 µgm−3. A PM counter (GT-531S, MET One Instruments, Inc., Grants Pass, OR, USA) was put on in the middle of the chamber to record the concentrations of PM1, PM2.5, and PM10 inside the chamber every minute for 7 h. The same method was performed for the chamber without plants to determine the concentration of PM in the control chamber (Figure 2).
The same chamber configuration was used for the CO2 removal experiments. Indoor Air Quality Meters (IAQ-CALC Indoor Air Quality Meter model 7545, TSI Inc., Shoreview, MN, USA) were placed at the center of the chamber to determine the CO2 concentration every minute for 7 h. Two experimental chambers were prepared for the experiments: a treatment chamber (with plants) and a control chamber (without plants). In this experiment, a CO2 cylinder was used to inject CO2 into the chamber until the initial concentration of CO2 reached 1000 ppm. Each set of experiments for both the treatment and control chambers were conducted five times to ensure consistency. Simultaneously, the temperature and humidity were recorded every 30 minutes to determine the effectiveness of the plant in controlling these parameters during the PM and CO2 testing (Figure 2).

2.3. Clean Air Delivery Rate (CADR) Analysis

A modified method of Armijos-Moya et al. [8] was used to analyze the CADR of PM and CO2 of the five plant species in this study. The amounts of PM and CO2 depleted inside the chamber were evaluated using the following formula:
λ = l n ( N t N 0 ) t ,
where λ = disintegration rate (h−1), N(t) = mass of pollutant after time t (µg/m3) or (mg/m3), and N(0) = starting mass of pollutant at t = 0 h (µg/m3) or (mg/m3).
The following formula was used to determine the CADR of the experiment chamber:
CADR = [(λe − λn) × V]/A,
where λe = total disintegration rate (h−1); λn = natural disintegration rate, which indicates the decrease in the pollutants in the control chamber (h−1); V = volume of the chamber (m3); and A = leaf area (m2).
The following formula was used to determine the removal capability under various study conditions:
ŋ = ( N 0 N t   ) N 0 × 100
where ŋ = efficiency (%), N(t) = mass of pollutant after time t (µg/m3) or (mg/m3), and N(0) = starting mass of pollutant at t = 0 h (µg/m3) or (mg/m3).

3. Statistical Analysis

The difference in the concentration of PM1, PM2.5, and PM10 between before and after the treatment of each plant species was converted to the initial value of mass concentration to the m3/h/leaf area using the CADR analyses method. The concentration of CO2 (ppm) was converted to the mass concentration based on the molecular weight of CO2 and then converted to m3/h/leaf area by the valued CADR. For the temperature and humidity, the average of their value during the seven hours was valued and used to analyze. All data were expressed as mean ± standard error for all parameters in each experiment with n = 5. The SAS software version 9.4 (SAS Institute, NC, USA) was used with analyses of variance (ANOVA) and Duncan’s Multiple Range Test (DMRT) to determine the data of this study. The significance level was set at 5%.

4. Results and Discussion

4.1. The Effect of Reducing PM of Plants

In this study, the result showed that the CADR of the five plant species was significantly different between plant species (p < 0.0001). The CADR of PM1 ranged from 0.68 to 3.01 m3/h/leaf area (Table 2). Among the five plants, I. pedunculosa showed the highest PM1 CADR, followed by P. tobira and G. jasminoides. The plant with the lowest PM1 CADR was V. odoratissimum var. awabuki. The CADR of PM2.5 and PM10 ranged from 0.73 to 3.08 m3/h/leaf area and 0.67 to 3.04 m3/h/leaf area, respectively. The CADR of PM2.5 and PM10 showed the same tendency as that of PM1, with I. pedunculosa showing the highest CADR, followed by P. tobira and G. jasminoides. V. odoratissimum var. awabuki had the lowest PM2.5 and PM10 CADR (Table 2).
In this study, the result showed that the CADR of the five plant species was significantly different between plant species (p < 0.0001). The CADR of PM1 ranged from 0.68 to 3.01 m3/h/leaf area (Table 2). Among the five plants, I. pedunculosa showed the highest PM1 CADR, followed by P. tobira and G. jasminoides. The plant with the lowest PM1 CADR was V. odoratissimum var. awabuki The CADR of PM2.5 and PM10 ranged from 0.73 to 3.08 m3/h/leaf area and 0.67 to 3.04 m3/h/leaf area, respectively. The CADR of PM2.5 and PM10 showed the same tendency as that of PM1, with I. pedunculosa showing the highest CADR, followed by P. tobira and G. jasminoides. V. odoratissimum var. awabuki had the lowest PM2.5 and PM10 CADR (Table 2).
Many different treatment technologies, such as physicochemical and biological technologies, can be used to maintain contaminants [31]. Using plants is one of the methods of biological technology. Plants reduce PM by two mechanisms, including physical processes or chemical processes, to minimize air pollution [32]. Plants can absorb and metabolize toxic compounds from air pollution [33]. Plants can absorb PM on the leaf surface and wax layer [24]. Conversely, PM with a smaller diameter can go through the stomata and inside plants. This study indicated that five plant species effectively reduced PM, while the effective removal of PM differed significantly between the five plant species and by PM particle sizes. Jang et al. [30] indicated that plants can reduce more than 80% PM2.5 concentrations and more than 90% PM10 concentrations inside the testing chamber after 8 h. Another study showed that the most effective plant (Epipremnum aureum) removal was about 74.46% PM2.5 concentration after 3 h [34]. Notably, the reduction rates of PM1, PM2.5, and PM10 showed similar tendencies, with PM2.5 and PM10 exhibiting higher reduction rates due to the impact of gravitational sedimentation [35]. Plants removed air pollution through stomatal uptake (absorption) and deposition on the leaf. PM has a small diameter that can go inside the stomata of plants. In this study, the CARD PM1 of the I. pedunculosa and the V. odoratissimum var. awabuki is lower than their CARD PM2.5. The differences in stomatal structures between various plant species can be the reason for the difference in the CARD PM1 of these plant species. The difference in the CADR between plant species is due to their ability to accumulate PM on plant leaves [35].
The variation in the CADR between plant species can be attributed to their ability to accumulate particles in their leaves. Leaf structure, area, shape, and density influence the PM reduction ability of plants [27]. Additionally, the ability of plants to accumulate PM is influenced by various factors, including surface roughness, leaf size, stomata density, and trichome length [36]. The leaf traits that could help to maximize PM accumulation are coniferous needle leaves, small, rough, and textured broad leaves, extended oval shapes, waxy coatings, and high-density trichomes [15]. Sæbø et al. [37] demonstrated that plants with a higher leaf density also contribute to increased PM accumulation. Plants with larger leaf areas demonstrate more capable PM reduction than others with smaller leaf areas [38]. Furthermore, PM does not only accumulate on the leaf surface but also on the wax layer [39]. Relative humidity has also been found to be correlated with PM reduction, whereas pH affects the deposition velocity of fine particles [30]. In a humid environment, the deposition velocity of particles increased compared to dry conditions due to the size increment of particles in humid conditions [40]. Kim et al. [41] demonstrated that the removal efficiency and deposition constant of PM were higher in humid conditions than in dry conditions. In a closed-chamber experiment, Pettit et al. [42] found that relative humidity, influenced by plant evapotranspiration, served as a governing parameter for the PM removal performance of plants. Panyametheekul et al. [43] indicated that the characteristics of the leaf surface and plant transpiration impacted plants’ ability to accumulate PM. Jang et al. [30] indicated that the potential reduction pollutants of plants increased with the increase in humidity in the environment. In the present study, the average humidity of the testing chamber with P. tobira exhibited lower relative humidity, but it showed higher PM accumulation than plant species with higher average humidity (Figure 3). This indicated that humidity might not be the critical factor that impacted the PM accumulation of plant species in this study. The difference in the leaf characteristics of plants could more effectively influence the ability to accumulate the PM of plants. The structure of the wax layer also plays a significant role in PM reduction. PM accumulation increased with the increasing amount of wax in plants [44]. The PM deposition and capture per unit leaf area were strongly impacted by leaf microstructure and the characteristics of the cuticle [35]. The wettability of leaves has an important influence on the ability of leaves to capture PM. For plants with a smooth leaf surface, the contact area between the particles and the leaf surface decreased because of epicuticular wax’s hydrophobic properties [45]. Kwon et al. [46] indicated that V. odoratissimum var. awabuki was the lowest effective reduction in PM due to the leaf structure. The same result has been reported previously. In this study, the structure of the wax layer also plays a significant role in PM reduction. Ilex × wandoensis exhibited the lowest CADR, primarily because of the structure of its wax layer, which resulted in a high contact angle and decreased its CADR. In addition, the concentration of PM in the environment affects the effective reduction in PM by plants [47]. In the indoor environment, many factors, such as light, humidity, and temperature, impact the growth of plants. So, the complex correlation between PM accumulation and the environment needs to be studied to optimize plants’ effect on improving air pollution. There are many factors that could impact the ability to reduce the PM of plants. In addition, the factor environment (humidity and PM concentration), leaf structure, and stomatal also need to be studied to more exactly understand the ability of specific plant species to induce a reduction in PM.

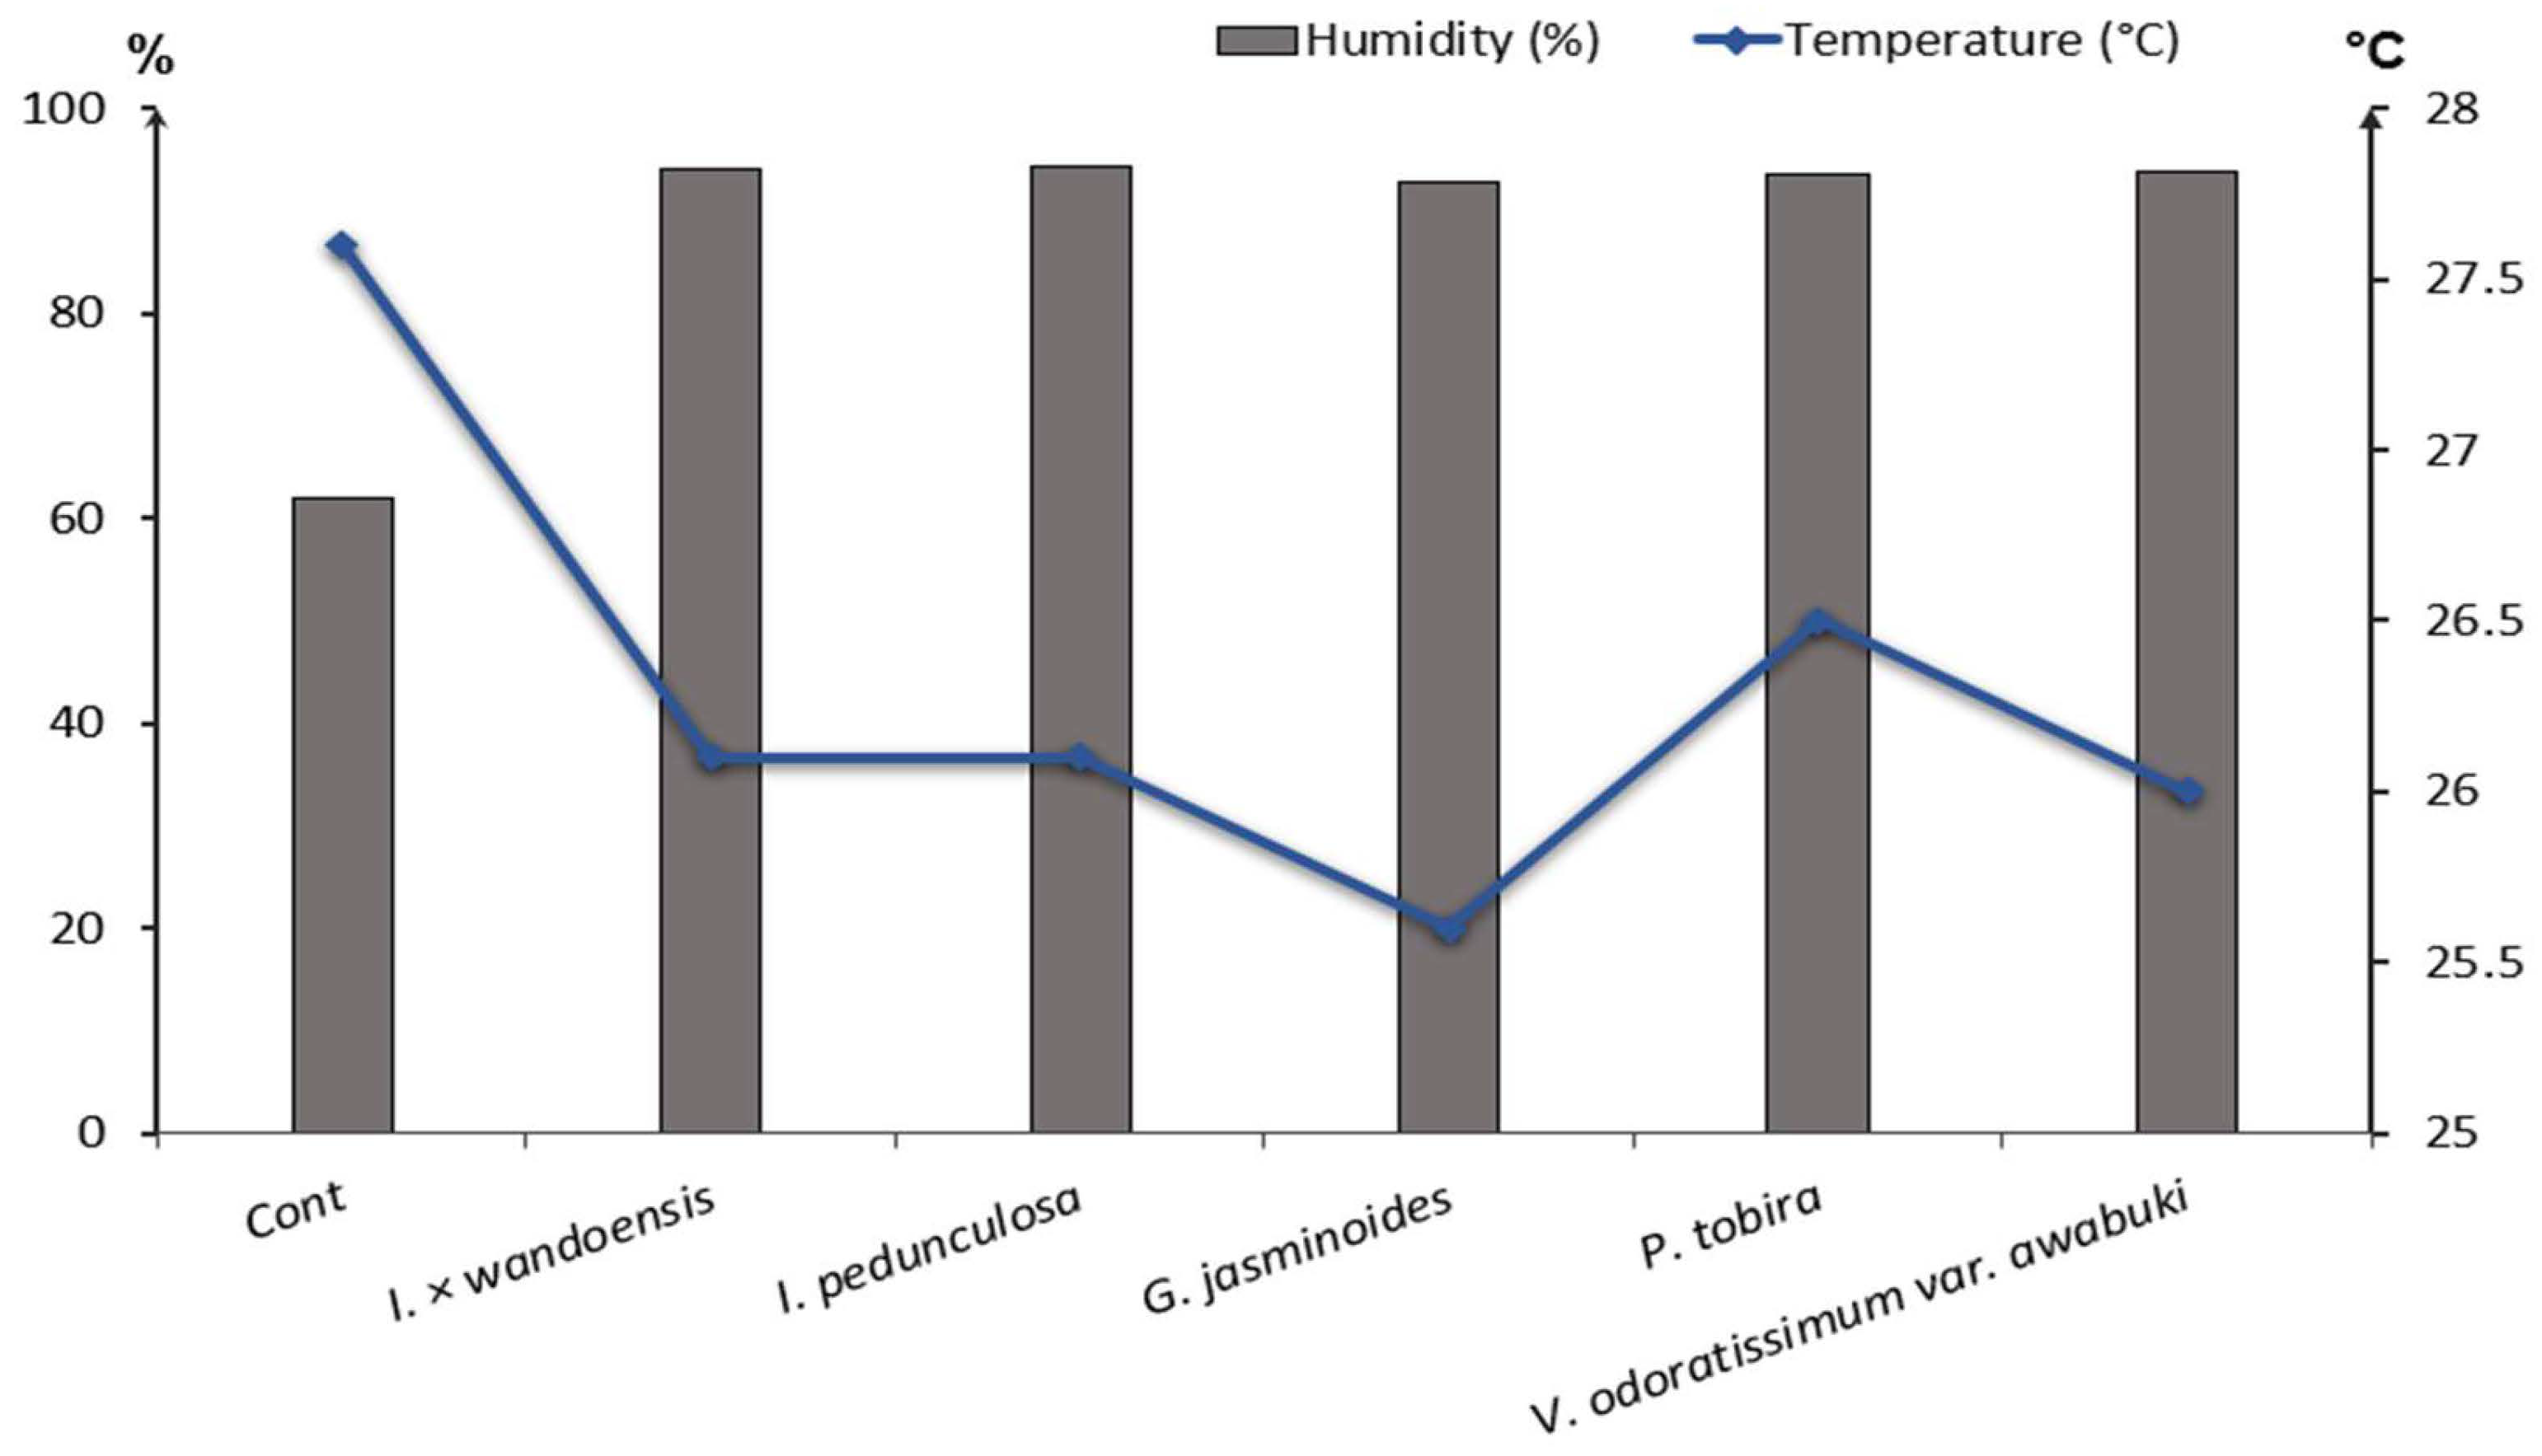
4.2. The Effectiveness of Plants at Reducing CO2 and Controlling Temperature and Humidity

The CO2 CADR was significantly different between the five plant species, ranging from 0.48 to 1.04 m3/h (p < 0.002), as shown in Table 3. Viburnum odoratissimum var. awabuki exhibited the highest CADR, followed by I. × wandoensis and I. pedunculosa. P. tobira had the lowest CADR. Additionally, the average temperature in the control chamber was 27.6 °C, while the temperature of the treatment chamber ranged from 25.6 to 26.1 °C. The temperature in the control chamber was significantly higher than that in the treatment chamber (p < 0.0001). Gardenia jasminoides exhibited the lowest temperature in the test chamber, whereas the chamber temperatures of the other plant species did not differ significantly. Moreover, there were not any significant differences in humidity among the five species, which ranged from 92.84 to 94.20%. However, the humidity in the control chamber was significantly lower, with an average of 62.01% (p < 0.0001) (Table 3, Figure 3).
Nearly all indoor plant species are able to remove CO2 if provided with satisfactory lighting. Jung and Awad [48] showed that plants contributed to reduced CO2 concentrations in the classroom, while the CO2 concentration in the classroom with plants (642 ppm) was lower than in the classroom without plants (1205 ppm). However, the effectiveness of CO2 reduction depends on the photosynthetic rate of plants [8]. Plants with high photosynthetic rates reduce CO2 more effectively than those with low photosynthetic rates. In this study, the photosynthetic rate of plants ranged from 1.40 to 3.20 µmol CO2 m−2 s−1. The plants with the highest photosynthetic rates were V. odoratissimum var. awabuki and I. × wandoensis. These plants also exhibited the highest CO2 CADR values. The I. × wandoensis have the highest photosynthesis, but the CADR of this plant was lower than V. odoratissimum var. awabuki, which had the second highest photosynthetic rate among five plant species. The difference in the response of each plant under high CO2 can impact the ability to reduce CO2 [49]. These plants also exhibited the highest CO2 CADR values. In a closed environment, an increase of more than 90% could impact the activity of the stomatal plants [50]. Under specific environments, the stomatal movement could be disturbed [47]. Some stomata developed at high RH closed, whereas others closed partly. This may have an impact on the CARD CO2 of plants. Notably, P. tobira had a high photosynthetic rate but showed the lowest CADR. Many studies have shown that the effective reduction in CO2 in plants depends not only on their photosynthetic rate but also on other environmental factors [38,39,40,41,42,43,44,45,46,47]. For example, the effective reduction in CO2 is also influenced by environmental conditions such as humidity and temperature [14]. Over time, changes in the temperature and humidity in the test chamber can affect stomatal sensitivity, leading to decreased CO2 removal by plants [14,51,52]. Additionally, CO2 concentrations in the environment can affect the ability of plants to reduce CO2. Some plants showed more effective CO2 removal, whereas others showed less CO2 removal at high CO2 concentrations. Moreover, many studies have demonstrated that plants can regulate indoor relative humidity [14,51,52,53,54]. Additionally, the light condition also impacted the ability to reduce the concentration of CO2 in plants. In the indoor environment, adjusting light conditions based on the day can affect metabolic activities, directly impacting plants’ potential removal of CO2 [55]. Suhaimi et al. [56] showed that the absorbed CO2 of plants was affected by the light intensity. The absorption of CO2 in plants increased with the increase in the light intensity. Weerasinghe et al. [48] indicated that elevated light intensity to 1500 and 2000 lux led to an increasing reduction in CO2 in a few plant species. Dominici et al. [21] showed that plants showed the highest CO2 removal in 200 μmol m−2s−1 with the 15° light inclinations. Other plants showed the ability to reduce their concentrations of CO2 even when the intensity of light was low [57]. Through transpiration, water is transported from the roots to the leaves, where it is released into the atmosphere as water vapor, leading to an increase in the humidity of the chamber containing the plant. Bandehali et al. [12] showed that plants raise humidity by about 40 to 80%. In this study, the humidity increased by more than 50% for all of the treatment chambers. Plants also possess the potential for thermal regulation [11]. They can absorb up to 70% of radiation, and the absorption of radiant energy is lower than the demanded energy for transpiration, causing the plants’ temperature to decrease and cooling the ambient temperature [10]. Through transpiration, plants helped raise humidity, which led to decreasing ambient temperature. In this study, the result indicated that the temperature of the control chamber (without plants) was higher than that of the treatment chambers (with plants) by approximately 1 °C. Among the five plant species, P. tobira, which has the smallest leaf area, had the highest average chamber air temperature. The small leaf area may be the main reason for increased temperatures in the plant chambers. High humidity and low light intensity are stresses for plants that affect their growth. More studies about the response of plants to the environment, such as CO2 concentration and humidity, need to be considered to find the key factors impacting the CO2 reduction ability of the same plant species.

5. Conclusions

Under low light intensity, all five plant species in this study effectively reduced PM and CO2 levels. The decrease in temperature and increase in humidity were found in the plant’s testing chamber, indicating the plants’ capabilities to balance indoor relative humidity and temperature. The reduction rate of PM2.5 and PM10 was higher than that of PM1 in this study. Air pollution reduction effectiveness varies among plant species. The various leaf structures, such as density and area and the humidity of the environment, may be related to the ability of the plant to remove PM. Plants with larger leaf areas are more effective at reducing PM. Leaf structure could be one of the most important factors that decide the abilities of plants to reduce PM. Of the five plant species studied, I. pedunculosa, P. tobira, and G. jasminoides were the most effective at removing PM. Plants have also demonstrated the ability to remove CO2, and this ability is closely related to their photosynthetic rate. Plants with higher photosynthetic rates are more effective at reducing CO2 levels. Among the tested plant species, V. odoratissimum var. awabuki, I. × wandoensis, and I. pedunculosa were the most effective at reducing CO2. In indoor environments, plants can be used to remove air pollutants and regulate temperature and humidity. Utilizing plant species that are particularly effective can lead to improved air pollutant removal and energy savings in indoor air quality control. The analysis of the impact of the environment, such as humidity, differences in light intensity, CO2 concentrations, and leaf characteristics, needs to be studied to determine more exactly the ability of plants to remove air pollution. Various factors in the real environment, such as ventilation, temperature, and humidity, can impact plants’ abilities to remove air pollution. Assessing the removal capacity of indoor plants needs to be conducted with actual models, such as a house, office, or class, to fully clarify the real ability of plants to reduce indoor air pollution.

Author Contributions

Conceptualization, W.C. and B.-J.P.; methodology, W.C. and B.-J.P.; investigation, H.-T.B., J.P. and E.L.; resources, W.C. and H.K.; data analysis, H.-T.B., J.P. and E.L.; writing—original draft preparation, H.-T.B. and H.K.; writing—review and editing, W.C. and B.-J.P.; funding acquisition, W.C. and B.-J.P.; project administration, B.-J.P. All authors have read and agreed to the published version of the manuscript.

Funding

This study is conducted with the support of the project “Development of year-round cultivation and flowering control technique for native wild flowers commercialization and its diversification of utilization (Project No. KNA1-2-33, 17-8)” by the Korea National Arboretum.

Institutional Review Board Statement

Not applicable.

Informed Consent Statement

Not applicable.

Data Availability Statement

All data supporting the conclusions of this article are included in this manuscript.

Conflicts of Interest

The authors declare no conflict of interest.

References

  1. Nehr, S.; Duarte, R.M.B.O.; Almeida, A.S.; Baus, L.; Bergmann, K.C. Assessing the relevance of allergenic pollen in indoor environments-current knowledge base and research needs. Allergo J. Int. 2023, 32, 167–175. [Google Scholar] [CrossRef]
  2. Gubb, C.; Blanusa, T.; Griffiths, A.; Pfrang, C. Potted plants can remove the pollutant nitrogen dioxide indoors. Air Qual. Atmos. Health 2022, 15, 479–490. [Google Scholar] [CrossRef]
  3. Sowa, J.; Hendiger, J.; Maziejuk, M.; Sikora, T.; Osuchowski, Ł.; Kamińska, H. Potted plants as active and passive biofilters improving indoor air quality. IOP Conf. Ser. Earth Environ. Sci. 2019, 290, 012150. [Google Scholar] [CrossRef]
  4. Niza, I.L.; de Souza, M.P.; da Luz, I.M.; Broday, E.E. Sick building syndrome and its impacts on health, well-being and productivity: A systematic literature review. Indoor Built Environ. 2023. [Google Scholar] [CrossRef]
  5. Deng, L.; Deng, Q. The basic roles of indoor plants in human health and comfort. Environ. Sci. Pollut. Res. Int. 2018, 25, 36087–36101. [Google Scholar] [CrossRef] [PubMed]
  6. Vardoulakis, S.; Giagloglou, E.; Steinle, S.; Davis, A.; Sleeuwenhoek, A.; Galea, K.S.; Dixon, K.; Crawford, J.O. Indoor exposure to selected air pollutants in the home environment: A systematic review. Int. J. Environ. Res. Public Health 2020, 17, 8972. [Google Scholar] [CrossRef] [PubMed]
  7. Wargocki, P.; Sundell, J.; Bischof, W.; Brundrett, G.; Fanger, P.O.; Gyntelberg, F.; Hanssen, S.O.; Harrison, P.; Pickering, A.; Seppänen, O.; et al. Ventilation and health in non-industrial indoor environments: Report from a European multidisciplinary scientific consensus meeting (EUROVEN). Indoor Air 2002, 12, 113–128. [Google Scholar] [CrossRef] [PubMed]
  8. Armijos-Moya, T.; de Visser, P.; Ottelé, M.; van den Dobbelsteen, A.; Bluyssen, P.M. Air cleaning performance of two species of potted plants and different substrates. Appl. Sci. 2022, 12, 248. [Google Scholar] [CrossRef]
  9. Jomehzadeh, F.; Nejat, P.; Calautit, J.K.; Yusof, M.B.M.; Zaki, S.A.; Hughes, B.R.; Yazid, M.N.A.W.M. A review on windcatcher for passive cooling and natural ventilation in buildings, part 1: Indoor air quality and thermal comfort assessment. Renew. Sustain. Energy Rev. 2017, 70, 736–756. [Google Scholar] [CrossRef]
  10. Liu, F.; Yan, L.; Meng, X.; Zhang, C. A review on indoor green plants employed to improve indoor environment. J. Build. Eng. 2022, 53, 104542. [Google Scholar] [CrossRef]
  11. Torpy, F.; Zavattaro, M.; Irga, P. Green wall technology for the phytoremediation of indoor air: A system for the reduction of high CO2 concentrations. Air Qual. Atmos. Health 2017, 10, 575–585. [Google Scholar] [CrossRef]
  12. Bandehali, S.; Miri, T.; Onyeaka, H.; Kumar, P. Current state of indoor air phytoremediation using potted plants and green walls. Atmosphere 2021, 12, 473. [Google Scholar] [CrossRef]
  13. Pérez-Urrestarazu, L.; Fernández-Cañero, R.; Franco, A.; Egea, G. Influence of an active living wall on indoor temperature and humidity conditions. Ecol. Eng. 2016, 90, 120–124. [Google Scholar] [CrossRef]
  14. Cummings, B.E.; Waring, M.S. Potted plants do not improve indoor air quality: A review and analysis of reported VOC removal efficiencies. J. Expo. Sci. Environ. Epidemiol. 2020, 30, 253–261. [Google Scholar] [CrossRef] [PubMed]
  15. Corada, K.; Woodward, H.; Alaraj, H.; Collins, C.M.; de Nazelle, A. A systematic review of the leaf traits considered to contribute to removal of airborne particulate matter pollution in urban areas. Environ. Pollut. 2021, 269, 116104. [Google Scholar] [CrossRef] [PubMed]
  16. Lee, J.K.; Kim, D.Y.; Park, S.H.; Woo, S.Y.; Nie, H.; Kim, S.H. Particulate matter (PM) adsorption and leaf characteristics of ornamental sweet potato (Ipomoea batatas L.) cultivars and two common indoor plants (Hedera helix L. and Epipremnum aureum Lindl. & Andre). Horticulturae 2022, 8, 26. [Google Scholar] [CrossRef]
  17. Popek, R.; Fornal-Pieniak, B.; Chyliński, F.; Pawełkowicz, M.; Bobrowicz, J.; Chrzanowska, D.; Piechota, N.; Przybysz, A. not only trees matter—Traffic-related PM accumulation by vegetation of urban forests. Sustainability 2022, 14, 2973. [Google Scholar] [CrossRef]
  18. Ter, S.; Chettri, M.K.; Shakya, K. Air pollution tolerance index of some tree species of Pashupati and Budhanilkantha area, Kathmandu. Amrit Res. J. 2020, 1, 20–28. [Google Scholar] [CrossRef]
  19. Gubb, C.; Blanusa, T.; Griffiths, A.; Pfrang, C. Interaction between plant species and substrate type in the removal of CO2 indoors. Air Qual. Atmos. Health 2019, 12, 1197–1206. [Google Scholar] [CrossRef]
  20. Wu, Y.; Zhong, H.; Li, J.; Xing, J.; Xu, N.; Zou, H. Water use efficiency and photosynthesis of Calamagrostis angustifolia leaves under drought stress through CO2 concentration increase. J. Plant Interact. 2022, 17, 60–74. [Google Scholar] [CrossRef]
  21. Dominici, L.; Fleck, R.; Gill, R.L.; Pettit, T.J.; Irga, P.J.; Comino, E.; Torpy, F.R. Analysis of lighting conditions of indoor living walls: Effects on CO2 removal. J. Build. Eng. 2021, 44, 102961. [Google Scholar] [CrossRef]
  22. Zhang, Z.; Tao, S.; Zhou, B.; Zhang, X.; Zhao, Z. Plant stomatal conductance determined transpiration and photosynthesis both contribute to the enhanced negative air ion (NAI). Ecol. Indic. 2021, 130, 108114. [Google Scholar] [CrossRef]
  23. Weerakkody, U.; Dover, J.W.; Mitchell, P.; Reiling, K. Quantification of the traffic-generated particulate matter capture by plant species in a living wall and evaluation of the important leaf characteristics. Sci. Total Environ. 2018, 635, 1012–1024. [Google Scholar] [CrossRef] [PubMed]
  24. Bui, H.T.; Odsuren, U.; Kim, S.Y.; Park, B.J. Particulate matter accumulation and leaf traits of ten woody species growing with different air pollution conditions in Cheongju city, South Korea. Atmosphere 2022, 13, 1351. [Google Scholar] [CrossRef]
  25. Moya, T.A.; van den Dobbelsteen, A.; Ottelé, M.; Bluyssen, P.M. A review of green systems within the indoor environment. Indoor Built Environ. 2019, 28, 298–309. [Google Scholar] [CrossRef]
  26. Räsänen, J.V.; Holopainen, T.; Joutsensaari, J.; Ndam, C.; Pasanen, P.; Rinnan, Å.; Kivimäenpää, M. Effects of species-specific leaf characteristics and reduced water availability on fine particle capture efficiency of trees. Environ. Pollut. 2013, 183, 64–70. [Google Scholar] [CrossRef] [PubMed]
  27. Przybysz, A.; Popek, R.; Stankiewicz-Kosyl, M.; Zhu, C.Y.; Małecka-Przybysz, M.; Maulidyawati, T.; Mikowska, K.; Deluga, D.; Griżuk, K.; Sokalski-Wieczorek, J.; et al. Where trees cannot grow–Particulate matter accumulation by urban meadows. Sci. Total Environ. 2021, 785, 147310. [Google Scholar] [CrossRef]
  28. Sgrigna, G.; Baldacchini, C.; Dreveck, S.; Cheng, Z.; Calfapietra, C. Relationships between air particulate matter capture efficiency and leaf traits in twelve tree species from an Italian urban-industrial environment. Sci. Total Environ. 2020, 718, 137310. [Google Scholar] [CrossRef]
  29. Yadav, R.; Pandey, P. Assessment of air pollution tolerance index (APTI) and anticipated performance index (API) of roadside plants for the development of greenbelt in urban area of Bathinda city, Punjab, India. Bull. Environ. Contam. Toxicol. 2020, 105, 906–914. [Google Scholar] [CrossRef]
  30. Jang, B.K.; Park, K.; Lee, S.Y.; Lee, H.; Yeon, S.H.; Ji, B.; Lee, C.H.; Cho, J.S. Screening of particulate matter reduction ability of 21 indigenous Korean evergreen species for indoor use. Int. J. Environ. Res. Public Health 2021, 18, 9803. [Google Scholar] [CrossRef]
  31. Mølgaard, B.; Koivisto, A.J.; Hussein, T.; Hämeri, K. A new clean air delivery rate test applied to five portable indoor air cleaners. Aerosol Sci. Technol. 2014, 48, 409–417. [Google Scholar] [CrossRef]
  32. Mata, T.M.; Martins, A.A.; Calheiros, C.S.; Villanueva, F.; Alonso-Cuevilla, N.P.; Gabriel, M.F.; Silva, G.V. Indoor air quality: A review of cleaning technologies. Environments 2022, 9, 118. [Google Scholar] [CrossRef]
  33. Han, K.T.; Ruan, L.W. Effects of indoor plants on air quality: A systematic review. Environ. Sci. Pollut. Res. 2020, 27, 16019–16051. [Google Scholar] [CrossRef] [PubMed]
  34. Cao, Y.; Li, F.; Wang, Y.; Yu, Y.; Wang, Z.; Liu, X.; Ding, K. Assisted deposition of PM2.5 from indoor air by ornamental potted plants. Sustainability 2019, 11, 2546. [Google Scholar] [CrossRef]
  35. Zhang, W.; Zhang, Y.; Gong, J.; Yang, B.; Zhang, Z.; Wang, B.; Zhu, C.; Shi, J.; Yue, K. Comparison of the suitability of plant species for greenbelt construction based on particulate matter capture capacity, air pollution tolerance index, and antioxidant system. Environ. Pollut. 2020, 263, 114615. [Google Scholar] [CrossRef]
  36. Li, Y.; Wang, S.; Chen, Q. Potential of thirteen urban greening plants to capture particulate matter on leaf surfaces across three levels of ambient atmospheric pollution. Int. J. Environ. Res. Public Health 2019, 16, 402. [Google Scholar] [CrossRef] [PubMed]
  37. Sæbø, A.; Popek, R.; Nawrot, B.; Hanslin, H.M.; Gawronska, H.; Gawronski, S.W. Plant species differences in particulate matter accumulation on leaf surfaces. Sci. Total Environ. 2012, 427–428, 347–354. [Google Scholar] [CrossRef]
  38. Zhang, W.; Zhang, Z.; Meng, H.; Zhang, T. How does leaf surface micromorphology of different trees impact their ability to capture particulate matter? Forests 2018, 9, 681. [Google Scholar] [CrossRef]
  39. Kong, L.; Yu, H.; Chen, M.; Piao, Z.; Dang, J.; Sui, Y. Effects of particle matters on plant: A review. Phyton 2019, 88, 367–378. [Google Scholar] [CrossRef]
  40. Sengupta, S.; Sengupta, S.; Chanda, C.K.; Saha, H. Modeling the effect of relative humidity and precipitation on photovoltaic dust accumulation processes. IEEE J. Photovolt. 2021, 11, 1069–1077. [Google Scholar] [CrossRef]
  41. Kim, J.J.; Hann, T.; Lee, S.J. Effect of flow and humidity on indoor deposition of particulate matter. Environ. Pollut. 2019, 255, 113263. [Google Scholar] [CrossRef] [PubMed]
  42. Pettit, T.; Irga, P.J.; Torpy, F.R. The in situ pilot-scale phytoremediation of airborne VOCs and particulate matter with an active green wall. Air Qual. Atmos. Health 2019, 12, 33–44. [Google Scholar] [CrossRef]
  43. Panyametheekul, S.; Rattanapun, T.; Ongwandee, M. Ability of artificial and live houseplants to capture indoor particulate matter. Indoor Built Environ. 2018, 27, 121–128. [Google Scholar] [CrossRef]
  44. Das, M.; Das, M.; Mukherjee, A. Air pollution tolerance index (APTI) used for assessing air quality to alleviate climate change: A review. Res. J. Pharm. Biol. Chem. Sci. 2018, 9, 45–54. [Google Scholar]
  45. Muhammad, S.; Wuyts, K.; Samson, R. Immobilized atmospheric particulate matter on leaves of 96 urban plant species. Environ. Sci. Pollut. Res. 2020, 27, 36920–36938. [Google Scholar] [CrossRef] [PubMed]
  46. Kwon, K.J.; Urrintuya, O.; Kim, S.Y.; Yang, J.C.; Sung, J.W.; Park, B.J. Removal potential of particulate matter of 12 woody plant species for landscape planting. J. People Plants Environ. 2020, 23, 647–654. [Google Scholar] [CrossRef]
  47. Dela Cruz, M.; Christensen, J.H.; Thomsen, J.D.; Müller, R. Can ornamental potted plants remove volatile organic compounds from indoor air?—A review. Environ. Sci. Pollut. Res. Int. 2014, 21, 13909–13928. [Google Scholar] [CrossRef] [PubMed]
  48. Jung, C.; Awad, J. Improving the IAQ for learning efficiency with indoor plants in university classrooms in Ajman, United Arab Emirates. Buildings 2021, 11, 289. [Google Scholar] [CrossRef]
  49. Driesen, E.; Van den Ende, W.; De Proft, M.; Saeys, W. Influence of environmental factors light, CO2, temperature, and relative humidity on stomatal opening and development: A review. Agronomy 2020, 10, 1975. [Google Scholar] [CrossRef]
  50. El-Sharkawy, M.A.; Cock, J.H.; Del Pilar Hernandez, A. Stomatal response to air humidity and its relation to stomatal density in a wide range of warm climate species. Photosynth. Res. 1985, 7, 137–149. [Google Scholar] [CrossRef]
  51. Lichtenthaler, H.K.; Babani, F.; Langsdorf, G. Chlorophyll fluorescence imaging of photosynthetic activity in sun and shade leaves of trees. Photosynth. Res. 2007, 93, 235–244. [Google Scholar] [CrossRef] [PubMed]
  52. Torpy, F.R.; Irga, P.J.; Burchett, M.D. Profiling indoor plants for the amelioration of high CO2 concentrations. Urban For. Urban Green. 2014, 13, 227–233. [Google Scholar] [CrossRef]
  53. Mulenga, C.; Clarke, C.; Meincken, M. Physiological and growth responses to pollutant-induced biochemical changes in plants: A review. Pollution 2020, 6, 827–848. [Google Scholar] [CrossRef]
  54. Chauhan, A. Photosynthetic pigment changes in some selected trees induced by automobile exhaust in Dehradun, Uttarakhand. New York Sci. J. 2010, 3, 45–51. [Google Scholar]
  55. Zheng, Y.; Li, F.; Hao, L.; Shedayi, A.A.; Guo, L.; Ma, C.; Huang, B.; Xu, M. The optimal CO2 concentrations for the growth of three perennial grass species. BMC Plant Biol. 2018, 18, 27. [Google Scholar] [CrossRef]
  56. Suhaimi, M.M.; Leman, A.M.; Afandi, A.; Hariri, A.; Idris, A.F.A.; Dzulkifli, S.N.M.; Gani, P. Effectiveness of indoor plant to reduce CO2 in indoor environment. MATEC Web Conf. 2017, 103, 05004. [Google Scholar] [CrossRef]
  57. Weerasinghe, N.H.; Silva, P.K.; Jayasinghe, R.R.; Abeyrathna, W.P.; John, G.K.P.; Halwatura, R.U. Reducing CO2 level in the indoor urban built environment: Analysing indoor plants under different light levels. Clean. Eng. Technol. 2023, 14, 100645. [Google Scholar] [CrossRef]
Figure 1. Five evergreen woody plants were used in the present study. (a) Ilex × wandoensis, (b) Ilex pedunculosa, (c) Gardenia jasminoides, (d) Pittosporum tobira, and (e) Viburnum odoratissimum var. awabuki.
Atmosphere 14 01819 g001
Figure 2. The acrylic chamber schematic diagram used for the PM and CO2 removal experiments.
Atmosphere 14 01819 g002
Figure 3. The average humidity (columns) and temperature (line) of both the control chamber and the treatment chambers for five plant species during the 7 h CO2 reduction experiment.
Atmosphere 14 01819 g003
Table 1. Mean ± standard deviation (n = 20) of the plant height, leaf area, and photosynthetic rate of the five plant species in this study.
SpeciesPlant Height
(cm)
Leaf Area
(cm−2)
Photosynthetic Rate
(µmol CO2 m−2s−1)
Ilex × wandoensis41.66 ± 3.23979.85 ± 235.463.20 ± 0.09
Ilex pedunculosa40.80 ± 5.56877.01 ± 103.711.40 ± 0.03
Gardenia jasminoides43.12 ± 4.60710.61 ± 126.521.95 ± 0.02
Pittosporum tobira42.32 ± 2.08443.89 ± 152.562.63 ± 0.04
Viburnum odoratissimum var. awabuki38.98 ± 5.40961.28 ± 168.713.03 ± 0.01
Table 2. The effectiveness of five plants in reducing particulate matter (PM) of different particle sizes (PM1, PM2.5, and PM10) after 7 h. We used Duncan’s Multiple Range Test to determine the significance of the differences in PM’s clean air delivery rate (CADR) among the five plant species. All values indicate p < 0.0001. Data are mean ± SE, n = 5.
SpeciesCADR (m3/h/Leaf Area)
PM1PM2.5PM10
Ilex × wandoensis1.02 ± 0.390.99 ± 0.380.85 ± 0.18
Ilexpedunculosa3.01 ± 0.943.08 ± 0.963.04 ± 0.97
Gardenia jasminoides1.26 ± 0.471.18 ± 0.451.04 ± 0.41
Pittosporum tobira1.37 ± 0.201.26 ± 0.361.13 ± 0.46
Viburnum odoratissimum var. awabuki0.68 ± 0.090.73 ± 0.100.67 ± 0.11
Table 3. The effectiveness of five plants in reducing CO2 after 7 h. The following variables were measured, RH: relative humidity (%), T: Temperature (°C), N(0): starting mass of pollutant at t = 0 h (µg/m3) or (mg/m3), N(t): mass of pollutant after time t (µg/m3) or (mg/m3), λe: total disintegration rate (h−1), λn: natural disintegration rate (h−1), CADR: clean air delivery rate (m3/h/leaf area), and ŋ: efficiency (%).
SpeciesTime (h)RH (%)T
(°C)
N(0)N(t)λeλnCADR
(m3/h/Leaf Area)
ŋ
(%)
Control762.01 ± 1.2327.6 ± 0.251848.971835.65 0.001-0.72
Ilex × wandoensis793.98 ± 2.5826.1 ± 0.591800.37701.280.135 0.87 ± 0.2261.05
Ilexpedunculosa794.20 ± 3.0926.1 ± 0.681801.09805.680.115 0.83 ± 0.1555.27
Gardenia jasminoides792.84 ± 3.9325.6 ± 0.491889.651091.170.078 0.70 ± 0.1342.26
Pittosporum tobira793.63 ± 1.2026.5 ± 0.271800.731414.450.034 0.48 ± 0.2721.45
Viburnum odoratissimum var. awabuki793.81 ± 3.2026.0 ± 0.701789.57592.200.158 1.04 ± 0.0666.91
Disclaimer/Publisher’s Note: The statements, opinions and data contained in all publications are solely those of the individual author(s) and contributor(s) and not of MDPI and/or the editor(s). MDPI and/or the editor(s) disclaim responsibility for any injury to people or property resulting from any ideas, methods, instructions or products referred to in the content.

