Article

Dynamic and Thermodynamic Contributions to Late 21st Century Projected Rainfall Change in the Congo Basin: Impact of a Regional Climate Model’s Formulation

1
Climate Service Center Germany (GERICS), Helmholtz-Zentrum Hereon, 20095 Hamburg, Germany
2
European Commission, Joint Research Centre (JRC), 21027 Ispra, Italy
3
Laboratory for Environmental Modelling and Atmospheric Physics (LEMAP), Physics Department, University of Yaoundé 1, Yaoundé P.O. Box 812, Cameroon
*
Author to whom correspondence should be addressed.
Atmosphere 2023, 14(12), 1808; https://doi.org/10.3390/atmos14121808
Submission received: 13 November 2023 / Revised: 1 December 2023 / Accepted: 8 December 2023 / Published: 9 December 2023
(This article belongs to the Special Issue Simulation and Analysis of Hydroclimate)

Abstract

:
Addressing the impacts of climate change requires, first of all, understanding the mechanisms driving changes, especially at the regional scale. In particular, policymakers and other stakeholders need physically robust climate change information to drive societal responses to a changing climate. This study analyses late 21st-century (2071–2100) precipitation projections for the Congo Basin under representative concentration pathway (RCP) 8.5, using the Rossby Centre Regional Climate Model (RCM) RCA4. Specifically, we examine the impact of the RCM formulation (reduction of turbulent mixing) on future change in seasonal mean precipitation by comparing the results of the modified model version (RCA4-v4) with those of the standard version (RCA4-v1) used in CORDEX (Coordinated Regional Climate Downscaling Experiment). The two RCM versions are driven by two global climate models participating in the Coupled Model Intercomparison Project phase 5 (CMIP5). The results show that seasonal precipitation is largely affected by modifications in the atmospheric column moisture convergence or divergence, and, in turn, associated with changes in the dynamic (ΔDY) and thermodynamic (ΔTH) components of the moisture-budget equation. Projected decreased precipitation in the dry seasons (December–January–February and June–July–August) is linked to increased moisture divergence driven by dynamic effects (changes in circulation), with most experiments showing ΔDY as the main contributor (>60%) to the total moisture budget. Overall, precipitation is projected to increase in the wet seasons (March–April–May and September–October–November), which can be attributed to both dynamic and thermodynamic effects, but with a larger thermodynamic contribution (changes in specific humidity, ΔTH > 45%), compared to the dynamic one (ΔDY > 40%). Through a comparison of the two model versions, we found that the formulation (reducing turbulent mixing) and boundary conditions (driving GCM) strongly influence precipitation projections. This result holds substantial value for ensuring the fitness of models for future projections intended for decision-makers.

1. Introduction

The formulation (including physical parameterization and tuning) of a climate model plays a paramount role in the representation of regional processes, especially those underpinning the rainfall system [1,2]. For instance, incorporating additional components of the Earth system, such as coupling with an oceanic model, can result in the significantly enhanced credibility of climate projections in regions where air–sea interaction is strong [3,4,5,6]; introducing aerosol interactions substantially influences regional patterns’ change of both temperature and precipitation [7,8]; neglecting the physiological response of plants to the increase in greenhouse gases in the atmosphere results in a substantial underestimation of extreme temperature increases across Europe [9]; mixing in stable boundary layers, in particular, the momentum mixing which has a strong impact on the surface heat, significantly modifies surface–atmosphere interactions [2,10].
To properly assess how formulations designed and validated using historical climatology can impact the future climate, it is essential to evaluate how the physical processes most relevant for a region’s climate are simulated, and how they are modified under future warming [11]. Such process-based evaluations and analyses are becoming more and more common, as they can provide insight into understanding the relevant processes driving e.g., the projected changes, and, hence, provide more confidence in the projections [12,13,14,15,16,17]. For instance, References [14,15] investigated processes driving changes in the Congo Basin in December-February (one of the dry seasons) and September-November (one of the wet seasons), respectively, using a set of coarse resolution global climate models (GCMs) participating in phase 5 of the Coupled Model Intercomparison Project (CMIP5, [18]). They found that, in DJF, the region is projected to become wetter due to increased convection and changes in atmospheric patterns. In SON, the west experiences wetter conditions in the north and drier conditions in the south due to factors like Atlantic sea surface temperatures and moisture transport. In the east, there is an increase in precipitation over the northeast region, which is linked to changes in the African easterly jet and moisture convergence. However, such analysis of projections in the Congo Basin is still not widely used as a common approach, especially for RCMs.
Another important aspect of process-based evaluation is the assessment of the plausibility of expected changes. The modelprojected change (e.g., projected drying) is not necessarily linked to the model’s performance under the historical climate (e.g., dry bias) [12,19]. The occasional lack of respect for the “wet-gets-wetter” mechanism, which consists of an enhanced moisture convergence, in response to projected climate change, in regions which already feature convergence is illustrative to this end. For instance, using a set of Coordinated Regional Climate Downscaling Experiment (CORDEX) regional climate models (RCMs) over West Africa, ref. [20] found a decrease in the dynamic component of the moisture budget over areas of intense rainfall, which matched with a weaker moisture convergence.
The seasonality of the Congo Basin’s (10° E–35° E; 10° S–10° N) precipitation is strongly correlated with that of the moisture convergence/divergence [21,22,23]. CMIP models simulating dry (wet) biases also feature strong divergent moisture from (convergent moisture into) the region [16,24]. This region is characterised by two wet seasons, from March to May (MAM), and from September to November (SON), as well as two dry seasons, from December to February (DJF), and from June to August (JJA) (see Figure 1a); these match with the times of the peaks of moisture convergence and divergence, respectively. Some work [23,25,26,27,28] has demonstrated that this moisture originates from both the Atlantic and the Indian Oceans, as well as from other continental sources (dynamical contribution) and from local evaporation through the recycling process (thermodynamic contribution). Ref. [29] showed that the increased atmospheric column moisture due to warming responds to the thermodynamic contribution. This corresponds to the situation of decreasing evaporation minus precipitation; the dynamic contribution involves changes in atmospheric circulation on regional and local changes in precipitation, including its extreme forms.
Ref. [2] evaluated a modified version of the Rossby Centre Atmospheric RCM RCA4 over the CORDEX-Africa domain with a reduced turbulent mixing in the stable boundary layer. This change reduced turbulent mixing in the convective planetary-boundary layer (PBL) and improved simulated local wind shear [10]. They found that this modified version (hereafter RCA4-v4) improved the annual cycle of precipitation over Central Africa, and reduced the rate of dry biases, compared to the standard version used in CORDEX (hereafter RCA4-v1; see [16]); in fact, RCA4-v1 generally features dry biases over the Congo Basin, which are related to a stronger mid-tropospheric moisture divergence, which is, in turn, associated with a misrepresentation of African easterly jets (AEJs; [16]). In contrast, RCA4-v4 considerably attenuates the dry biases shown by RCA4-v1 and improves the annual cycle of precipitation, in response to a sequence of offsetting effects in a chain of processes [2,17]; in fact, RCA4-v4 simulates a stronger low-level moisture convergence associated with a strengthening of the Congo Basin low-level cell [30], and thus low-level westerlies (LLWs). In turn, the moisture surplus from LLWs overfeeds mesoscale convective systems via AEJs, thereby increasing the rainfall amount. Both versions of RCA4 are found to be plausible choices to model the Congo Basin’s climate system, where the word “plausible” is understood as the ability of an RCM to model interlinkages between precipitation and related physical processes and drivers, although biases may still persist.
In the present study, we focus on the process-based evaluation of the simulated future (2071–2100) Congo Basin climate system projections from the two configurations of RCA4 (following [2,17]). The objectives of this study are dual: First, examine changes in the basin’s precipitation associated with some drivers from the late 21st century. Second, understand the effect of the RCM formulation on projected precipitation changes. The paper is structured as follows: details of the model are briefly described in the next section (Section 2); Section 3 summarises changes in precipitation and examines mechanisms underlying precipitation changes; the effects of the model formulation are highlighted in Section 4; and the paper closes with a summary and discussions of the results in Section 5.

2. Model Data and Methods

Data used in this work are derived from two different configurations (see details in Table 1) of the latest version of the Rossby Centre Atmospheric (RCA) model RCA4 (namely, RCA4-v1 and RCA4-v4), which are used to dynamically downscale two GCMs (see details in Table 1) participating in CMIP5. Details of the RCA4 configurations are extensively described in [2,31] and references therein, and can be summarised as follows: Broadly, the RCA4 simulation over the CORDEX-Africa domain [32], with approximately 50 km horizontal resolution, is based on the HIRLAM numerical weather prediction model. This model incorporates enhanced physical and dynamical parameterizations. The land-surface scheme utilizes a quadrilled approach, with one to three key tiles based on land-use information recommendations. The convection scheme, following Kain–Fritsch, assumes non-precipitating shallow convection. The radiation scheme is derived from the modified HIRAM radiation scheme, designed to consider carbon dioxide absorption and improve the treatment of the water vapor cycle. The simulation employs vegetation-dependent land-surface parameters. Additionally, a six-order linear horizontal diffusion, associated with a two time-level, semi-Lagrangian, and semi-implicit scheme, is applied to the prognostic variables. Historical simulations cover the period from 1950 to 2005 (here, 1976–2005 is selected as the reference period), based on the observed natural and anthropogenic greenhouse gas (GHG) concentrations. Future projections (2006–2100) are driven by representative concentration pathway (RCP) 8.5 [33]. As in other studies, e.g., [34], our study focuses on projections directed solely towards the end of the century (2071–2100) for the high-emission scenario RCP8.5. This choice is made because in the near-future timeframe, or under a low-emission scenario, internal variability can mask the emergence of the anthropogenic signal in precipitation changes, particularly at the regional scale [11]. The two RCA4 configurations have been thoroughly assessed in the recent past (1981–2005) over Central Africa, including the evaluation of relevant physical processes [2,16,17,35,36]. Rather, we focus on the analysis of the effect of model configuration on the changes in the precipitation climatology and in some interlinked drivers for the late 21st century (2071–2100) relative to the reference period (1976–2005).
In our analysis, we focus on the regional moisture convergence; throughout the tropospheric column, the moisture transport can be separated into zonal (Qz in kg m−2s−1) and meridional (Qm in kg m−2s−1) components, as follows:
Q z = q t , z , y , x u t , z , y , x
Q m = q t , z , y , x v t , z , y , x
where u is the zonal wind and v the meridional wind (in m/s) components, q is the specific humidity (g/Kg), and g (in N/Kg) is the gravitational acceleration. Terms q, u, and v are functions of time (t), pressure levels (z), latitudes (y), and longitudes (x). Transient moisture (in Kg m−2s−1) across each boundary of the Congo Basin region is then obtained using the following equations:
Q w e s t = x = 10 ° E . Q z t , z , y d y
Q e a s t = x = 35 ° E . Q z t , z , y d y
Q s o u t h = y = 10 ° S . Q m t , z , x d x
Q n o r t h = y = 10 ° N . Q m t , z , x d x
The net zonal (Zqconv, in Kg m−2s−1) and net meridional (Mqconv, in Kg m−2s−1) regional moisture convergence are obtained as follows:
Zqconv = QwestQeast
Mqconv = QsouthQnorth
Future changes (Δ) in the moisture convergence in the zonal (ΔZqconv, in Kg m−2s−1) and meridional (ΔMqconv, in Kg m−2s−1) directions are estimated using the differences
ΔZqconv = Zqconv(future) − Zqconv(historic)
ΔMqconv = Mqconv(future) − Mqconv(historic)
The total regional moisture convergence change (ΔTqconv, in Kg m−2s−1) is obtained by adding the changes in the zonal and meridional components as follows:
ΔTqconv = ΔZqconv + ΔMqconv
Besides the analysis of moisture convergence, it is interesting to investigate the roles of the thermodynamic (ΔTH) and dynamic (ΔDY) components of the moisture budget [39]. Dynamic and thermodynamic changes affecting the moisture budget in a given region can be approximated using the linearized equation, as follows [20,29,39,40]:
ρ g Δ E m P Δ T H + Δ D Y + Δ T E + Δ R e s
where ρ is the water density, ΔEmP represents the changes in the atmospheric moisture budget, E is evaporation, P precipitation. ΔTH is the thermodynamic term (moisture-budget changes related to changes in the specific humidity), and ΔDY the dynamic term (moisture-budget changes associated with changes in the atmospheric circulation), ΔTE is the synoptic term and ΔRes the residual term.
ΔTH and ΔDY are expressed, respectively, as follows:
Δ T H = 1 ρ g p b o t p t o p Δ q V ¯ d p
Δ D Y = 1 ρ g p b o t p t o p q ¯ Δ V d p
Also, ΔEmP is obtained as follows:
Δ E m P = Δ E Δ P
In Equations (14) and (15), Δq = q(future) − q(historic) represents changes in the specific humidity; and ΔV = V(future) − V(historic), changes in the wind; V ¯ (in m/s) is the mean climatology value of the horizontal wind (u and v); q ¯ (in g/Kg) is the mean climatology value of the specific humidity; pbot is the surface pressure; and ptop is the pressure of the top level (300 hPa); ΔE = E(future) − E(historic) represents changes in the total evaporation; and ΔP = P(future) − P(historic) means changes in precipitation. Changes in atmospheric water vapour at time scales longer than synoptic (ΔTE) can be approximated to zero [41]; also, the contribution of the residual term (ΔRes) is generally small, and is approximated to zero, as in other studies, e.g., [20,42].
Observed precipitation (rainband) and the vertical profile of moisture convergence are obtained from the Global Precipitation Climatology Centre (GPCC-v8) [43] and the European Centre for Medium-Range Weather Forecasts (ECMWF) ERA-Interim reanalysis dataset [44], respectively. The availability of RCA4 outputs over the entire tropospheric column (the only CORDEX RCM providing atmospheric variables u, v, q at all pressure levels) offers the possibility of quantifying each term and accounting for the contributions of all pressure levels.

3. Results

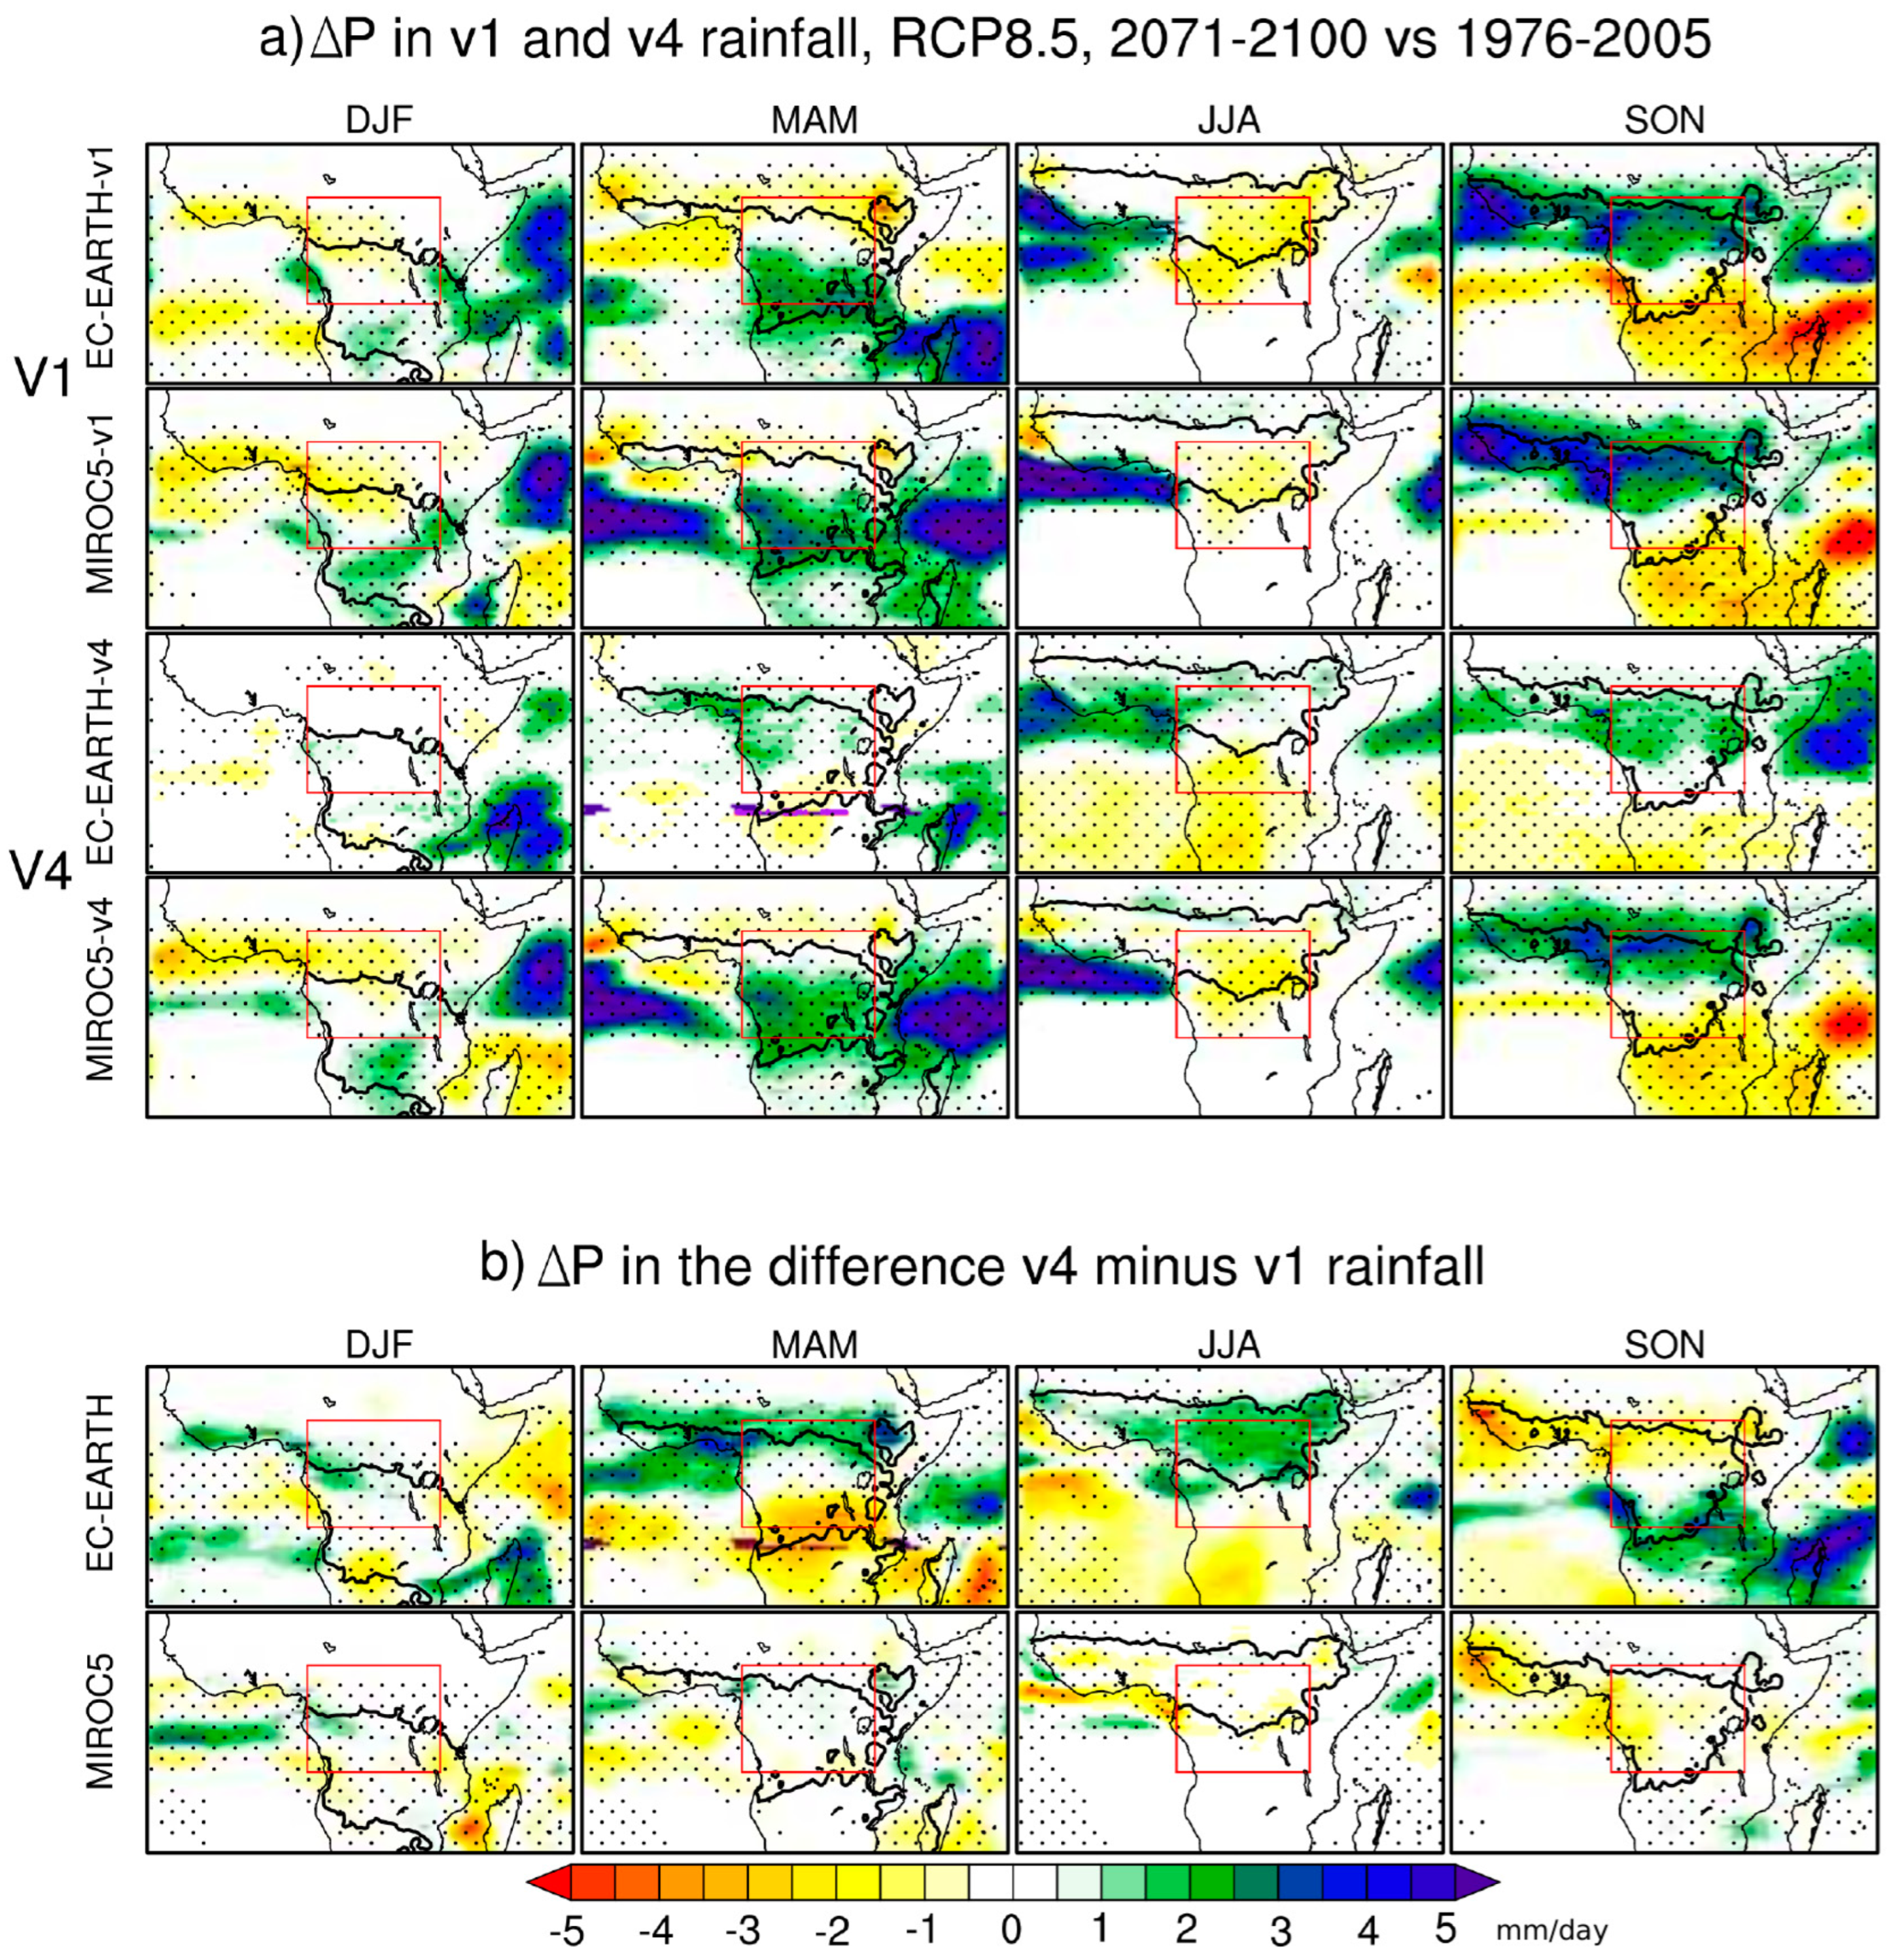
3.1. Precipitation Changes

As mentioned previously, a thorough assessment of the two RCA4 versions in capturing the climatology of Congo Basin rainfall (along with the underlying physical processes and mechanisms) was the primary focus of several previous studies [2,16,17,36] that showed how RCA4-v4 considerably reduces the dry biases shown by RCA4-v1 and improves the annual cycle of precipitation. Hence, here we focus on the analysis of the simulated future change in precipitation and the physical mechanisms responsible for it.
Changes in the mean seasonal precipitation climatology for the two RCA4 configurations driven by the two GCMs are shown in Figure 1a. For all seasons, the spatial pattern of rainfall change for RCA4-v1 is largely independent of the driving GCMs, whereas substantial differences are visible for RCA4-v4. Indeed, RCA4-EC-EARTH-v1 and RCA4-MIROC5-v1 exhibit similar rainfall change patterns for all seasons, suggesting that rainfall projections from RCA4-v1 are insensitive to the boundary conditions. In contrast, the patterns of rainfall change projections for RCA4-EC-EARTH-v4 and RCA4-MIROC5-v4 vary across all seasons, indicating that RCA4-v4 is more responsive to the forcing imparted by the driving GCM.
All RCA4-v1 runs project drier future conditions over most of the Congo Basin in DJF and JJA and a general increase in precipitation for the wet seasons’ MAM and SON. On the contrary, RCA4-EC-EARTH-v4 shows very small precipitation changes during DJF and MAM (and in JJA within the rainband) and a moderate increase in SON. In contrast, RCA4-MIROC5-v4 shows a relatively strong magnitude of change, with seasonal patterns similar to those of RCA4-v1.
Historical and future rainfall distributions are highly positively correlated with the spatial correlation values r ≥ 0.88 for dry seasons and r ≥ 0.77 for wet seasons. A similar result has been reported by [14], hypothesising possible common processes driving historical and future precipitation climatology. In this sense, factors controlling the intensity and spatial distribution of future precipitation might be found in usually-observed mechanisms which drive the regional climate. This topic will be analysed in the coming sections.

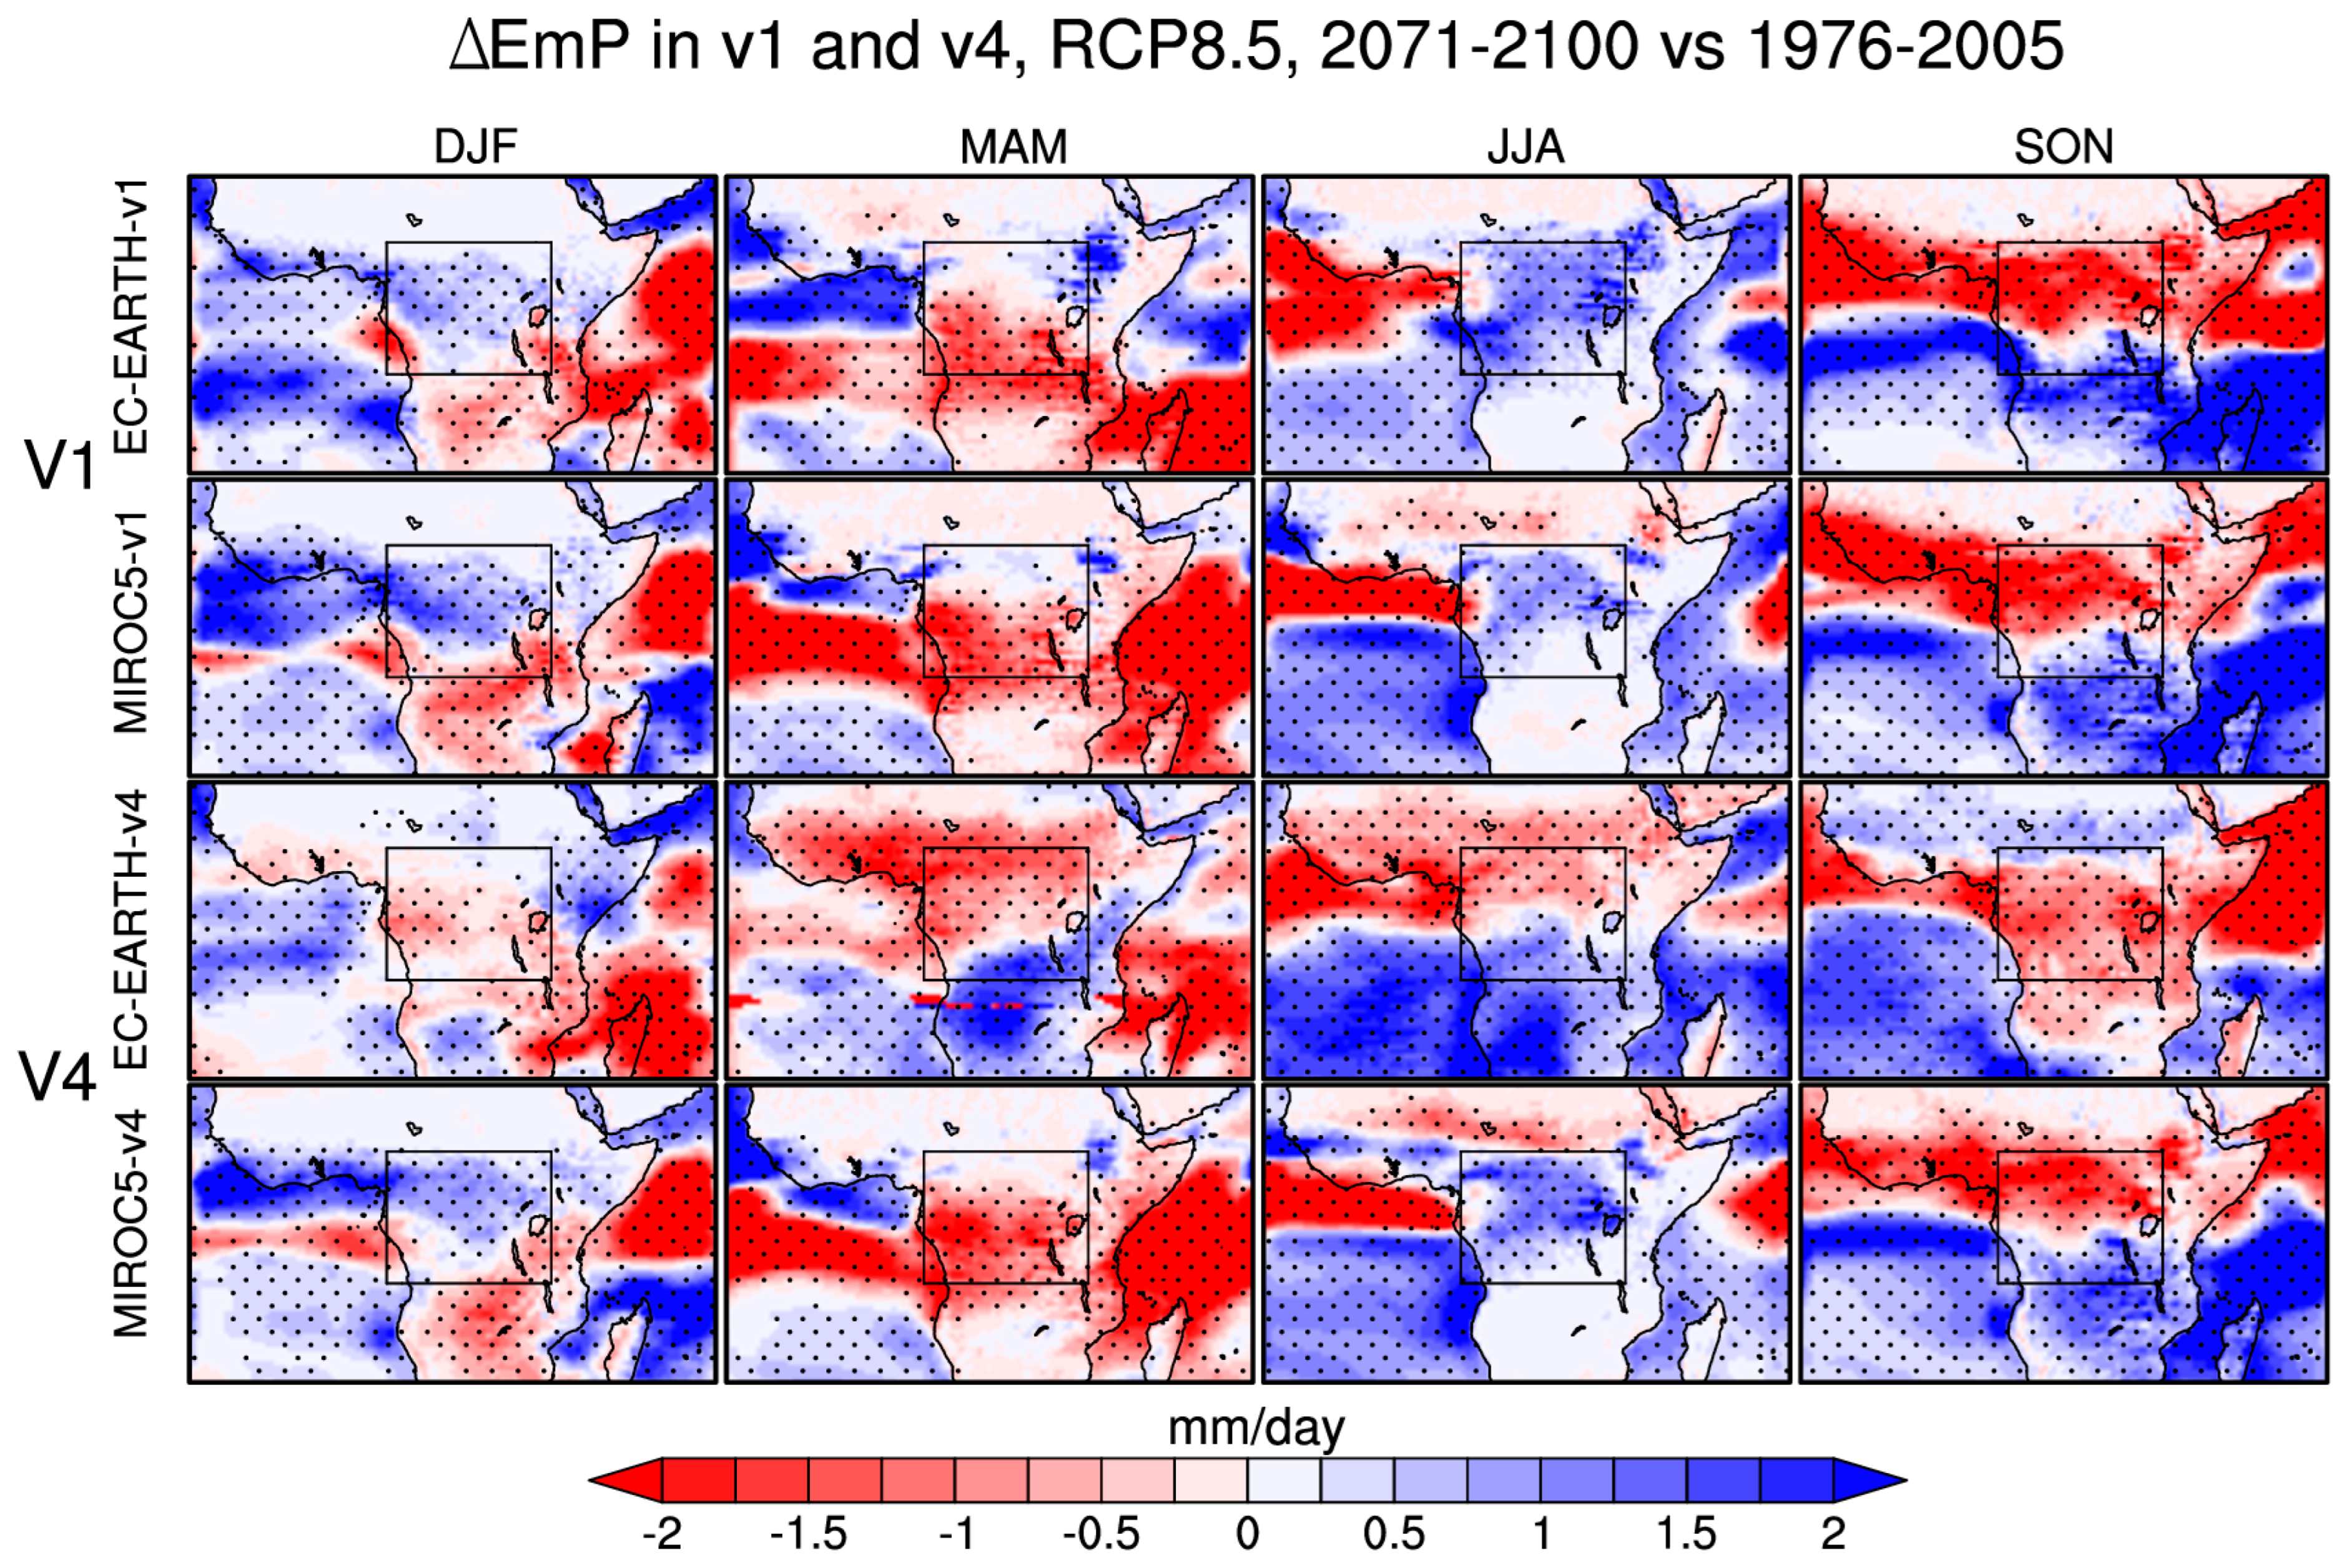
3.2. Potential Mechanisms for Precipitation Changes

3.2.1. Moisture Convergence Changes

Previous studies demonstrated the ability of RCA4-v1 [16,36] and RCA4-v4 [17] to reproduce the observed atmospheric circulation across the Congo Basin. When driven by GCMs, the two RCA4 configurations satisfactorily reproduce inter-linkages between the seasonality of precipitation and that of the moisture budget. Figure 2 shows changes in the vertical profile of the regional moisture convergence, separated into the zonal (ΔZqconv) and meridional (ΔMqconv) components. For the zonal component (Figure 2a, first column), all experiments project a strengthening of the moisture convergence (divergence) from the lower atmosphere (975 hPa) to the mid-layers (700 hPa), from April to June (January to March). This may suggest a strengthening in LLWs and AEJs, respectively [21,45]. Both RCA4-EC-EARTH configurations show an increase in moisture divergence in the mid-layers (850–600 hPa) from July to October, while the RCA4-MIROC5 ones show weakening. In the MAM rainy season, RCA4-MIROC5-v1 shows a strong increase in moisture convergence, with peaks centred in April; RCA4-MIROC5-v4 projects a strengthening in the divergence in March, but increased moisture convergence in the rest of the season. Both RCA4-EC-EARTH runs display similar patterns, with an increased moisture divergence in March from the lower layers to the upper layers. A similar feature can be noticed for moisture convergence from April to June. In the SON rainy season, all experiments are foreseen to strengthen the moisture convergence (divergence) in the bottom (upper) layers.
In terms of the meridional component of moisture (ΔMqconv, Figure 2a, second column), there are notable differences between the RCA4-v1 and RCA4-v4 runs. RCA4-v1 shows enhanced moisture divergence in MAM, expanding from January–February to June (RCA4-EC-EARTH-v1), while SON experiences increased moisture convergence extending into December, with the peak in November, at around 700 hPa. RCA4-EC-EARTH-v1 shows strengthened moisture convergence in JJA, from the surface up to 500 hPa, extending into September in the upper layers. RCA4-EC-EARTH-v4 exhibits increased moisture convergence in layers ≤ 850 hPa from January to May, and the reverse pattern from October to December, with a strengthening of moisture convergence in JJA and divergence in September. On the contrary, RCA4-MIROC5-v4 shows increased moisture convergence from April to October in the lower layers (≤850 hPa) and strongly increased divergence in the middle layers, which is not visible in the other experiments. In addition, in the middle layers, RCA4-MIROC5-v4 shows hardly any change in convergence in October and November (where other experiments showed large increase) and a large convergence increase in January and February, where other experiments showed a decrease.
As a result of the wet seasons’ MAM and SON, some experiments (driven by both RCA4-EC-EARTH and RCA4-MIROC5-v1) show a strengthening of the total divergence throughout all the vertical layers (ΔTqconv, Figure 2a, third column), from January to March and July to September, followed by increased convergence during April to June and October to December. In contrast, RCA4-MIROC5-v4 projects an increased moisture divergence for the first month and a strengthened moisture convergence for the two final months. For the drier seasons DJF and JJA, an intensification of moisture divergence will prevail. These patterns of changes in the vertical structure of the atmospheric moisture are consistent with the patterns of precipitation changes (Figure 1a) and thereby corroborate the “wet-gets-wetter” mechanism. However, modifications in the vertical profile of moisture convergence do not allow for an understanding of what underlies the projected dipole-like precipitation change during wet seasons.

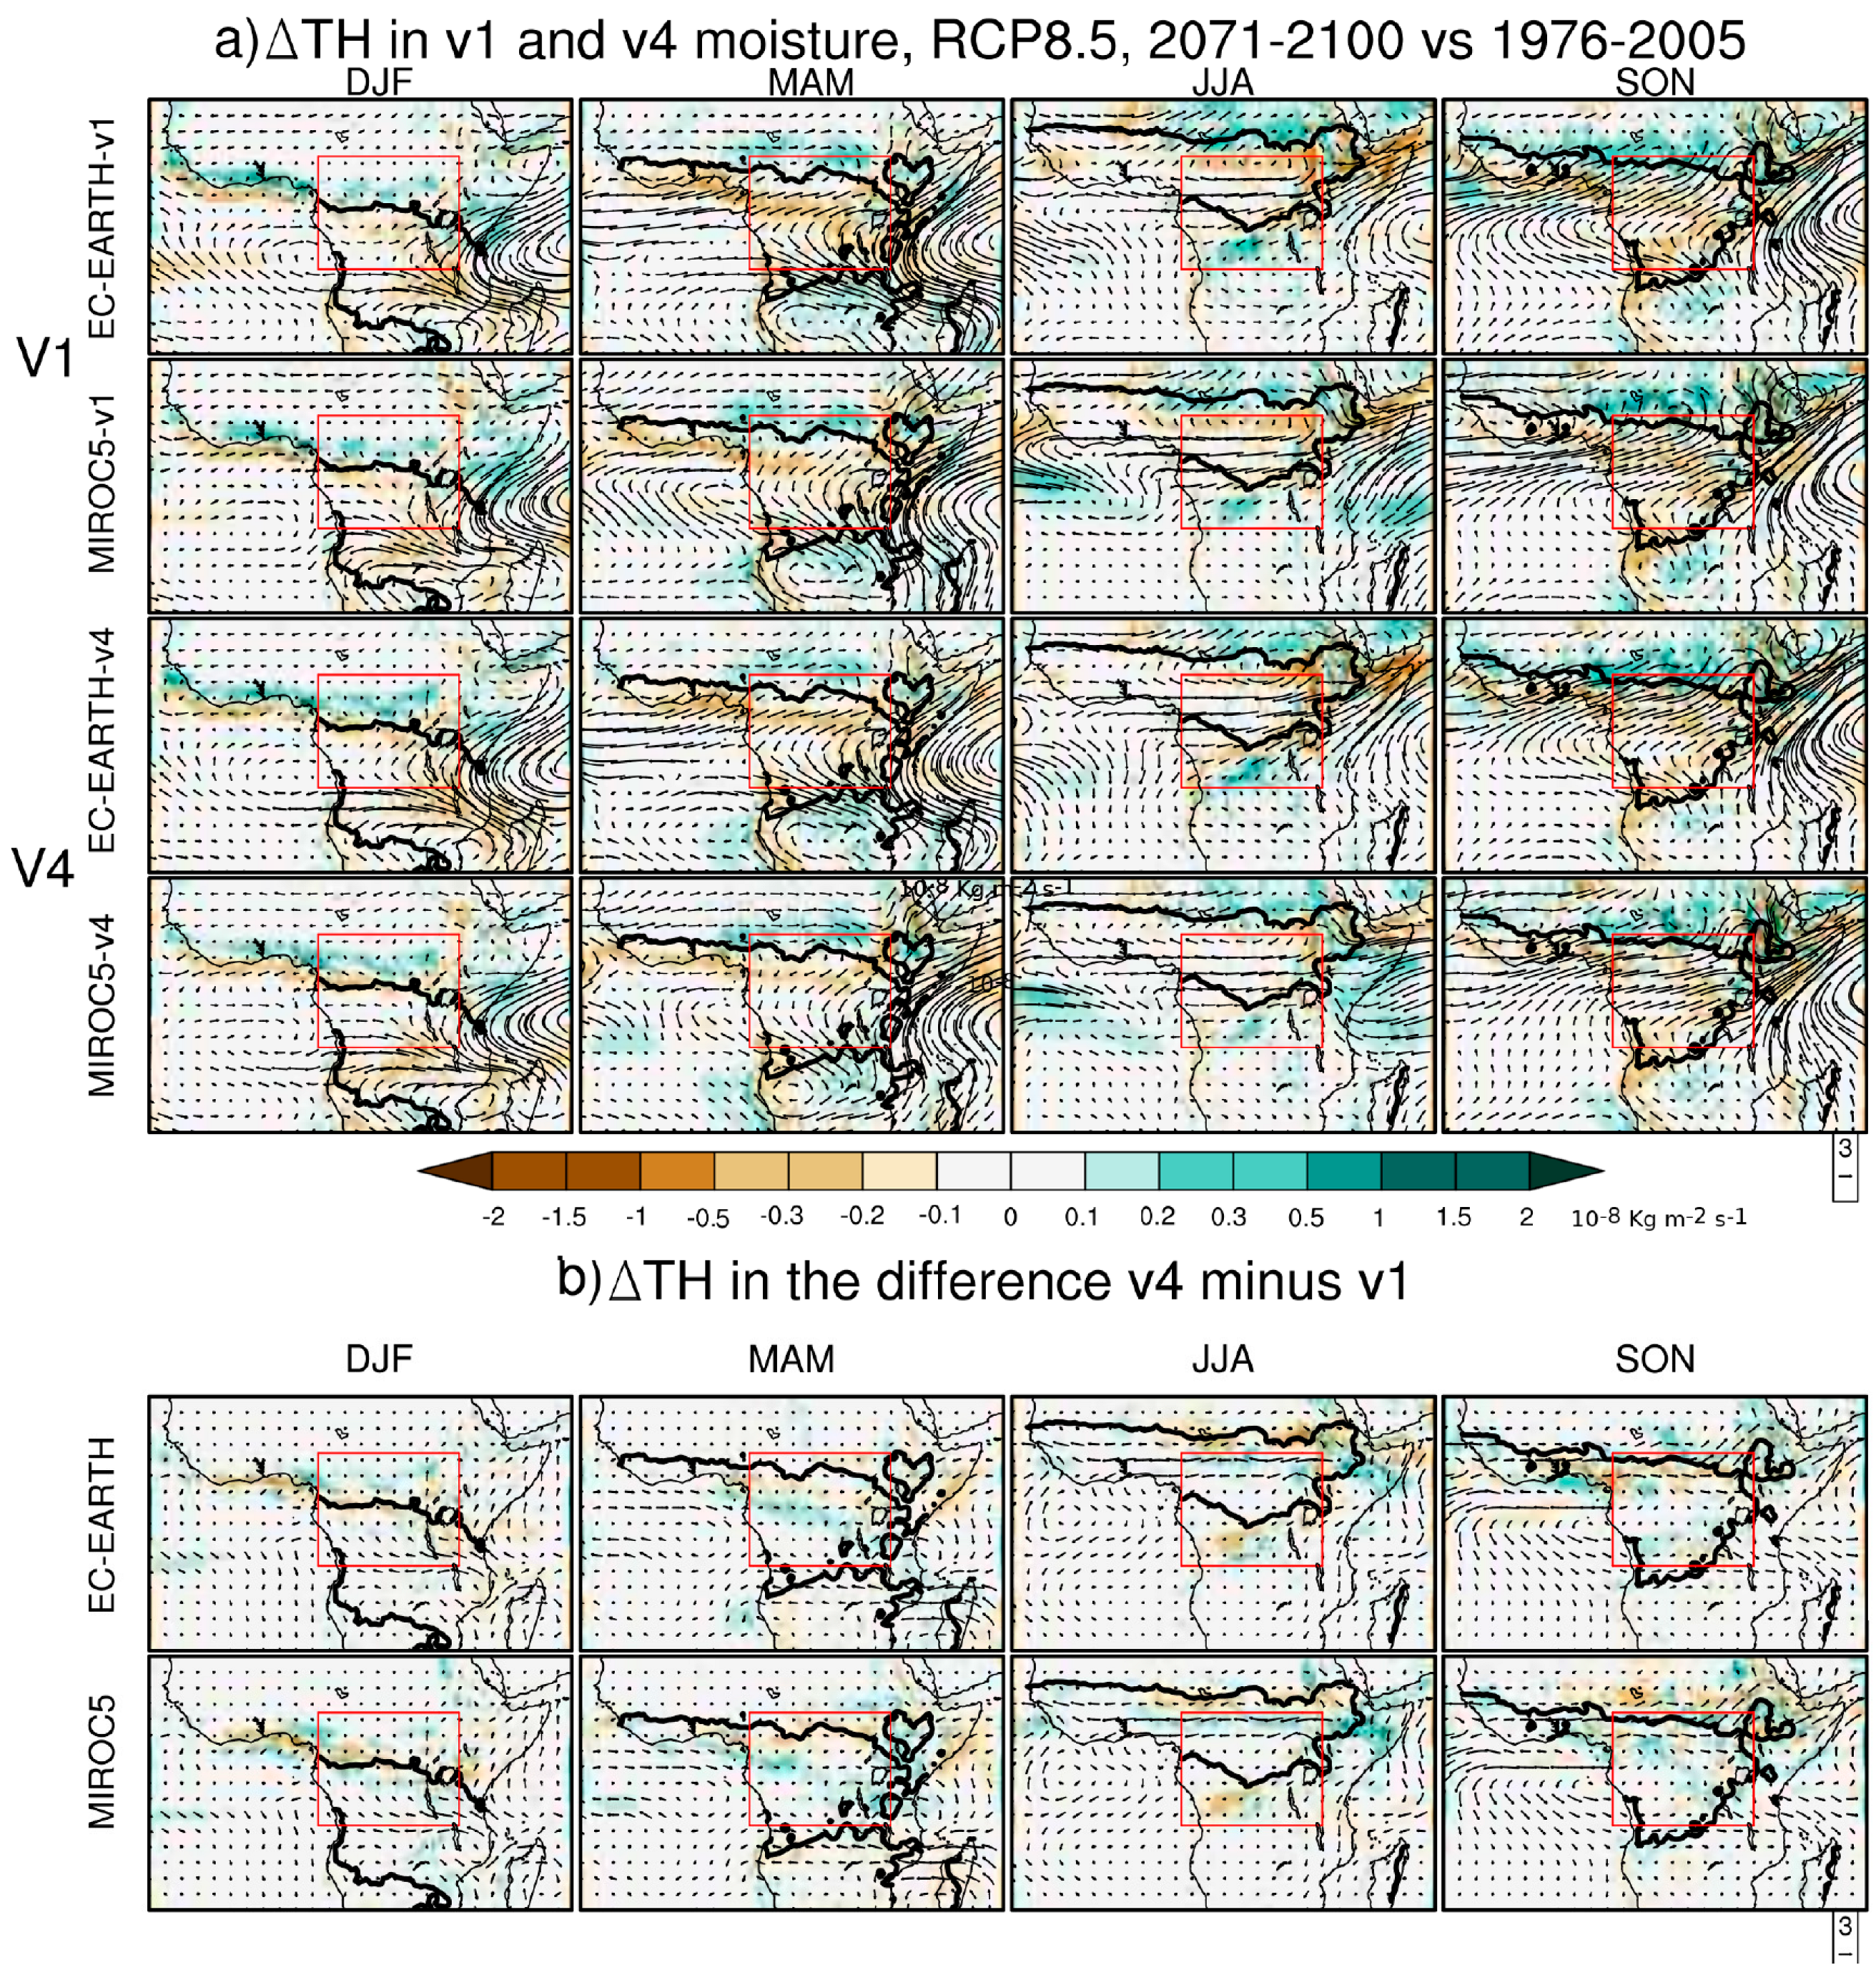
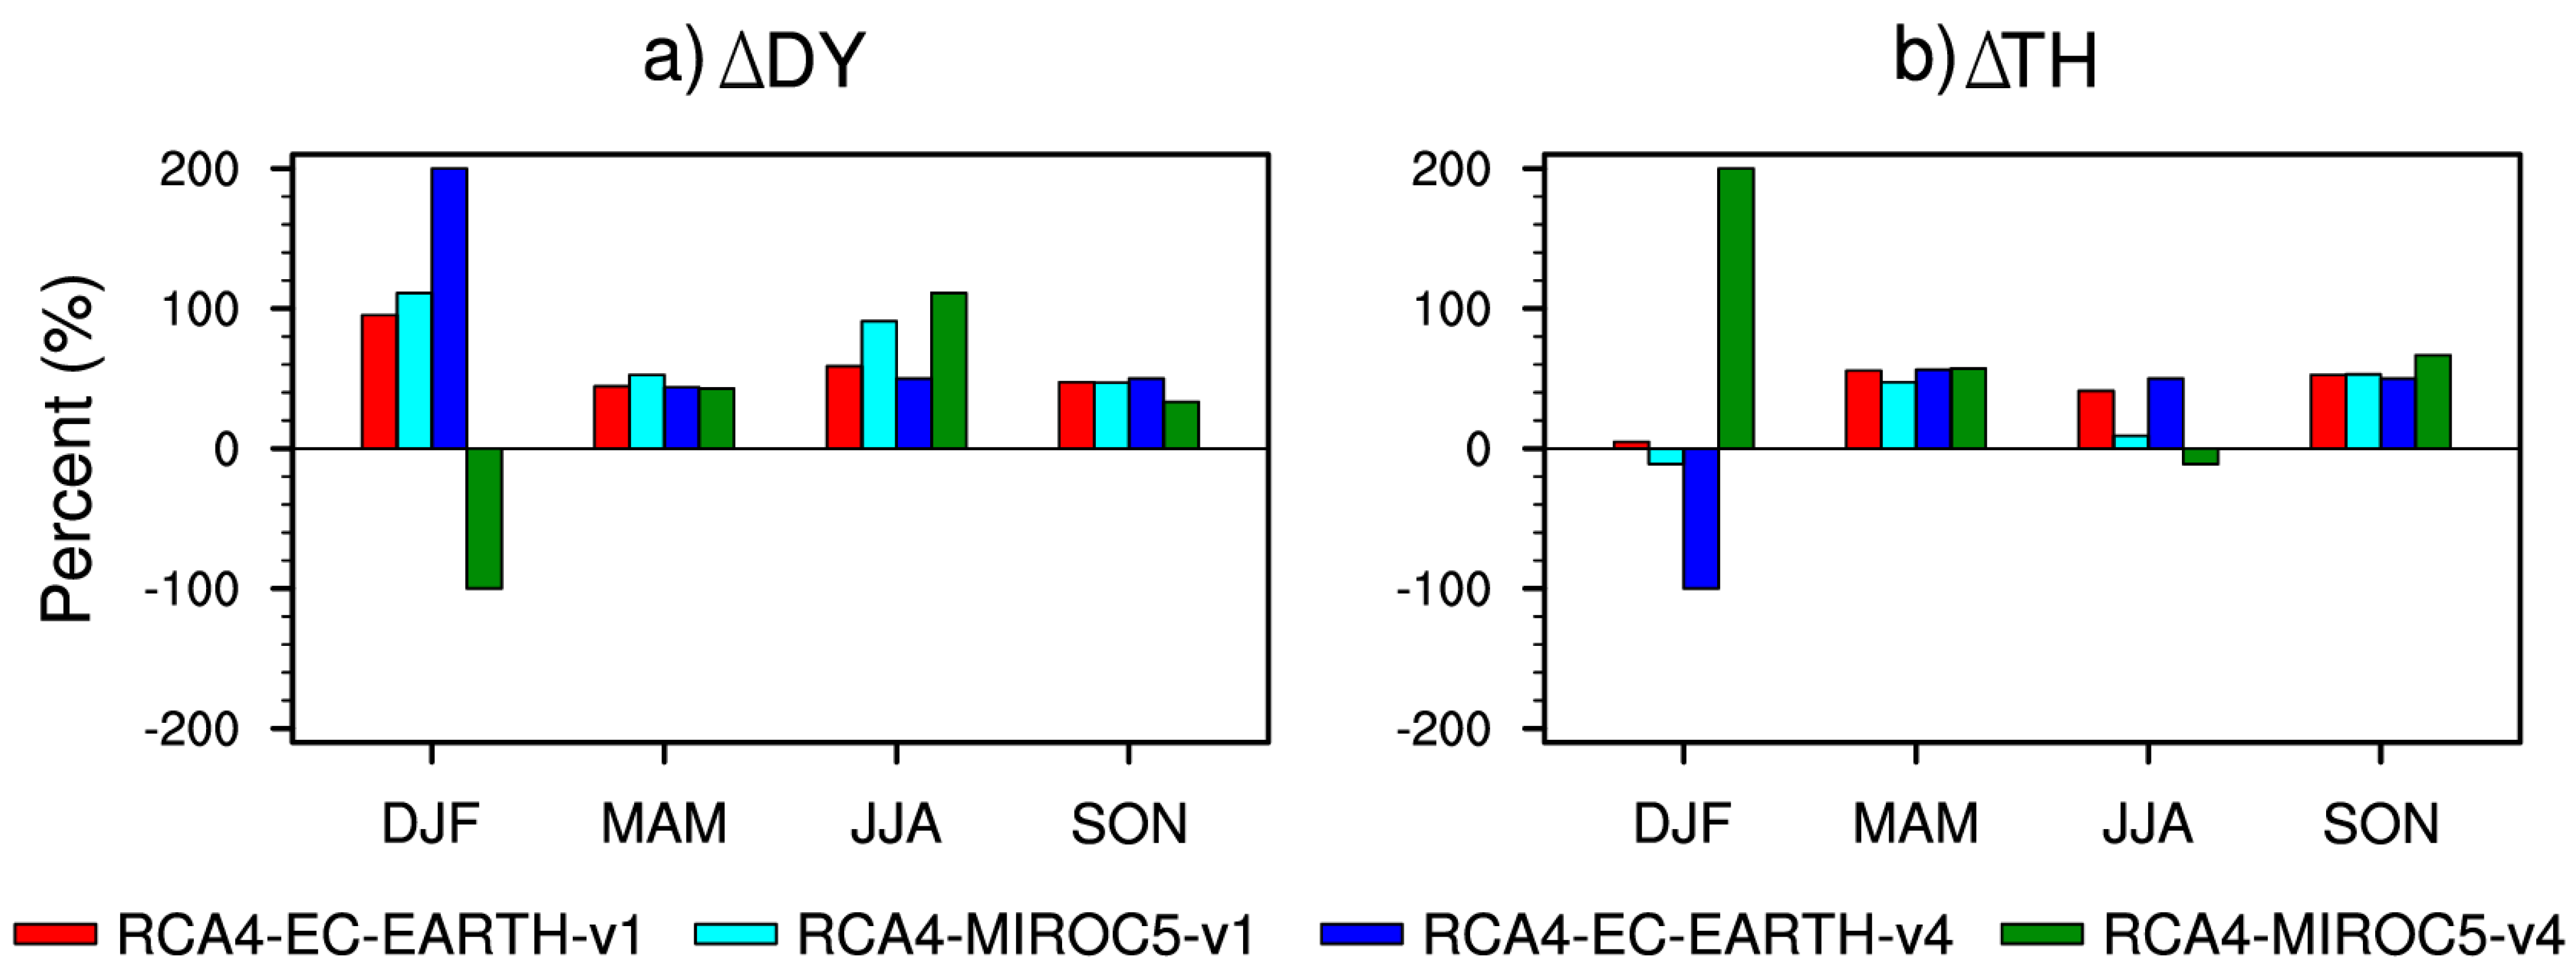
3.2.2. Dynamic and Thermodynamic Contributions to Moisture Changes

In order to analyse the effects of projected warming on the change in moisture budget and the relative contribution of each term, we examine the seasonal spatial pattern of changes in evaporation minus precipitation (noted ΔEmP, see Figure 3). For the two RCM configurations, ΔEmP patterns (Figure 3) are strongly correlated with the changes in precipitation (Figure 1a), with values of r larger than 0.87 in the dry seasons and 0.81 in the wet seasons. In particular, dry seasons showing future decreases in precipitation feature increases in ΔEmP (except RCA4-EC-EARTH-v4). On the other hand, wet seasons, characterised by increased precipitation, feature decreased ΔEmP apart from over the southern basin boundary in SON (RCA4-ECARTH-v1, RCA4-MIROC5-v1 and RCA4-MIROC5-v4). These results suggest different factors contributing to rainfall change in the two seasons.
We examined processes underpinning seasonal rainfall change patterns through an investigation of the ΔDY and ΔTH components of the moisture budget. Notably, an increase (decrease) in ΔDY will increase (reduce) moisture inflow into the basin, therefore enhancing (reducing) the moisture availability, which, in turn, might contribute to enhancing (attenuating) convection. As far as ΔTH is concerned, its increase (decrease) will intensify (slow down) the hydrological cycle through an increase (decrease) in evaporation, which modulates the atmospheric water vapour content. From Figure 4 and Figure 5, it appears that the pattern of the change in the two components of the moisture budget is consistent with both the pattern of rainfall change and ΔEmP, as consistently represented by the two model configurations; the seasonal north–south dipole-like changes, as in rainfall and ΔEmP, are also depicted in ΔDY during the wet seasons, especially in SON (Figure 4), whereas the change in ΔTH is relatively small in all seasons (Figure 5). Wet (dry) seasons which featured stronger (weaker) rainfall change (Figure 1) and ΔEmP (Figure 3) also feature stronger (weaker) change in the moisture-budget components; in fact, ΔDY is projected to decrease (increase) over most parts of the Congo Basin in MAM and over the southern part in SON (northern part in SON), but features rather heterogeneous changes in other seasons. There is a prevalence of decreasing ΔTH for all seasons and simulations. However, ΔDY (Figure 4) features a stronger change than ΔTH (Figure 5), consistent with findings by Dosio et al. (2020) regarding West Africa. Refs. [46,47] likewise reported the dominant effects of the ΔDY component over the West African Sahel and the tropical Indian Ocean, respectively.
Figure 6 summarises the mean seasonal contribution of each moisture-budget term to the total moisture-budget change, calculated as follows:
% Δ D Y = Δ D Y ¯ Δ D Y ¯ + Δ T H ¯ × 100 % Δ T H = Δ T H ¯ Δ D Y ¯ + Δ T H ¯ × 100
where Δ D Y ¯ represents the regional averaged dynamic changes, and Δ T H ¯ is the regional averaged thermodynamic changes. This analysis shows that ΔDY is the main contributor to moisture change in most experiments in DJF (with the notable exception of MIROC5-RCA4-v4) and for the two MIROC5-driven runs in JJA. In contrast, for the wet seasons (MAM and SON), changes in both ΔDY and ΔTH are equally important. Using a set of CMIP5 models, ref. [14] likewise found that changes in both humidity and wind prevail in models that already project wetness, instead of the sole dominance of changes in winds in those foreseeing dryness.
Specifically, during the dry seasons (DJF and JJA), warming reduces atmospheric moisture availability, resulting in the suppression of convection and a subsequent decline in precipitation. The reduction in atmospheric moisture content is linked to amplified moisture divergence triggered by ΔDY. Conversely, in wet seasons (MAM and SON), enhanced radiative forcing leads to increased atmospheric moisture availability, supporting convection. In this case, both ΔDY and ΔTH co-contribute to strengthening atmospheric moisture content.

4. Impacts of the Model Formulation on the Simulated Future Climate

One of the main results of this study is the response of precipitation (and its change) to both the model formulation and large-scale boundary conditions. In fact, RCA4-EC-EARTH-v4, which is, in the present climate, wetter than RCA4-EC-EARTH-v1 in all seasons [17], projects a wetter future (compared to RCA4-EC-EARTH-v1) in the dry seasons (DJF and JJA), but a drier one in most parts of the basin in the wet seasons (MAM and SON) (Figure 1b); conversely, RCA4-MIROC5-v4, which is also historically wetter than RCA4-MIROC5-v1 [17], tends to project a drier future in all seasons (Figure 1b). These differences highlight the role of large-scale forcing through boundary conditions (driving GCMs). Indeed, when driven by quasi-perfect boundary conditions from ERA-Interim reanalysis, ref. [2] found that model formulation had the primary control on precipitation climatology in Africa. However, ref. [48] found that the RCM COSMO-CLM performance levels on the historical climate depended more on the driving GCM than on horizontal resolution, model version, and configuration.
As for future projections, the increase in anthropogenic forcings would induce modifications in the physical processes driving the regional precipitation system climatology [49]. In addition, imperfect boundary conditions from GCMs might play an important role in RCM results [50]. For instance, in the zonal tropospheric column, RCA4-EC-EARTH-v4, which features higher moisture divergence in MAM under the historical climate than RCA4-EC-EARTH-v1, also does so in the future; the same run that exhibited the most significant low-level moisture convergence in SON in the past climate will display the weakest convergence in the future (see column 1 in Figure 2b). RCA4-MIROC5-v4, which displayed a stronger historical low-level (mid-layers) moisture convergence (divergence) in both MAM and SON seasons [17] is projected to strengthen moisture divergence all over at the late 21st century. All RCA4-v4 experiments simulate a stronger ΔDY compared to RCA4-v1, except in SON, whereas the two model versions experience a quasi-similar ΔTH in all seasons (Figure 4b and Figure 5b, respectively).

5. Summary and Discussion

This study analysed changes in the Congo Basin precipitation system using two configurations of the Rossby Centre regional atmospheric model RCA4: the standard version employed in CORDEX (RCA4-v1) and a modified version in which the turbulent mixing was reduced (RCA4-v4). The analysis focused on the future changes in the spatial distribution of seasonal mean precipitation, the vertical structure of moisture convergence, and the dynamic and thermodynamic contributions to moisture changes. The analysis of the impact of the model formulations on the projections in the late 21st century (2071–2100 vs. 1976–2005) was also performed.
The results show that the wetter seasons, MAM and SON, are projected to become wetter, with a more pronounced north–south dipole, which is particularly evident in SON; in drier seasons DJF and JJA, moderately decreased precipitation is projected. All runs are consistent with the fact that the response of the hydrological cycle to the warming climate in the Congo Basin will be associated with modifications of atmospheric moisture convergence and divergence, which are further related to dynamic and thermodynamic effects; in fact, changes in precipitation are associated with patterns of changes in the vertical profile of the atmospheric moisture convergence over the region. Moisture convergence (divergence) is, overall, projected to strengthen in wetter (drier) seasons. Seasonal ΔEmP are strongly correlated with seasonal rainfall changes, which is consistent with patterns of ΔTH and ΔDY. Most experiments indicate that while both ΔDY and ΔTH prevail during the wet seasons, only ΔDY dominates during the dry seasons.
Several physical underlying mechanisms are involved in the change in tropical rainfall under projected global warming, including both “wet-gets-wetter” [51] and “warmer-gets-wetter” [52,53] mechanisms. For instance, ref. [54] showed that in tropical regions, the annual pattern of rainfall is associated with the “warmer-gets-wetter” mechanism, whereas seasonal precipitation anomalies are closer to the “wet-gets-wetter” mechanism. In the present study, we found a trend towards wetter (drier) conditions during the wet (dry) seasons, correspondingly associated with an increased moisture convergence (divergence), which is in line with the “wet-gets-wetter” mechanism. Furthermore, this mechanism involves changes in the atmospheric water vapour, as dynamically and thermodynamically induced.
Numerous studies have investigated the dynamic and thermodynamic contributions to precipitation changes in tropical regions, and most of them have agreed on the dominance of dynamic effects under global warming [20,42,47], which is in accordance with the findings of this study. Using a set of five RCMs over the northeast Asia and Korea, ref. [29] found that while ΔTH contributes to the increased precipitation over the central part of the Korean peninsula by increasing the moisture convergence, ΔDY contributes instead to reducing the rate of precipitation by inducing moisture divergence. The present paper shows that ΔDY contributes by reducing mean precipitation in the Congo Basin in dry seasons (DJF and JJA). The two terms co-contribute to an overall increased rainfall in wet seasons (MAM and SON), with the share of ΔTH slightly higher than that of ΔDY, thus suggesting the strongest contribution of radiative forcing to precipitation changes. Although their analyses were focused only over a single pressure level (850 hPa), ref. [20] likewise showed that RCMs projecting a decreased rainfall over the Guinea Gulf simulated a weakening ΔDY in spring and early summer; both ΔDY and ΔTH co-contributed to wetting in spring. The plausibility of the above-highlighted drying and wetting processes in the Congo Basin is sustained by previous findings by ref. [55]; these findings showed that decreased precipitation over the basin in drier seasons is associated with a weakening large-scale moisture convergence (dynamical causality). Also, they reported a strengthening moisture convergence in wetter seasons, although dominated by regional processes, and they support the idea of a possible influence of soil moisture, which strongly modulates precipitation through the recycling process (thermodynamic causality).
While in the present-day climate, RCA4-v4 runs are wetter than those of RCA4-v1, in the future, the situation reverses, depending on the boundary conditions; in fact, the reversal happens for RCA4-v4 in all seasons when driven by MIROC5, but only in some when driven by EC-EARTH. This highlights the influence of the large-scale forcing prescribed by the driving GCMs. In addition, we note that the changes in future precipitation could be explained, on the one hand, by the intensification of the existing, underlying physical processes described above. On the other hand, they might be related to changes in the nature and origin of these processes, or even by the appearance of new processes (induced by enhanced warming), as also noted in [11].
Our work highlights the necessity of understanding how the increasing GHG concentration influences and, potentially, modifies the mechanisms driving the regional climate system, and how climate model formulations should take this aspect into account. Moreover, by estimating separately the dynamic and thermodynamic contributions to total changes in the moisture budget, we hope to foster the understanding of the impacts of large-scale versus local/regional physical mechanisms underpinning future changes as well as assess their plausibility. This may be helpful to policymakers and other stakeholders in the preparation of effective adaptation plans and mitigation strategies.

Author Contributions

A.T.T.: Conceptualization; formal analysis; investigation; methodology; software; validation; writing—original draft; writing—review and editing. A.D.: Methodology; project administration; resources; supervision; validation; writing—original draft; writing—review and editing. T.W.: Methodology; project administration; resources; supervision; validation; writing—original draft; writing—review and editing. D.A.V.: Methodology; project administration; resources; supervision; validation; writing—original draft; writing—review and editing. All authors have read and agreed to the published version of the manuscript.

Funding

This research received no external funding.

Institutional Review Board Statement

Not applicable.

Informed Consent Statement

Not applicable.

Data Availability Statement

The model simulations were performed at the Rossby Centre, Swedish Meteorological and Hydrological Institute (SMHI), Norrköping, Sweden. RCA4-v1 is available via the Earth System Grid Federation (ESGF) website (https://esgf-data.dkrz.de/search/cordex-dkrz/). “URL (accessed on 3 June 2019)”. RCA4-v4 is available upon request. The ERA-Interim reanalysis datasets are publicly available from the Copernicus Climate Change Service (C3S) Climate Data Store (CDS) at [44]. The GPCC observational data set is available at https://opendata.dwd.de/climate_environment/GPCC/full_data_monthly_v2020/05/ (accessed on 3 June 2019).

Acknowledgments

The authors acknowledge the Rossby Centre, Swedish Meteorological and Hydrological Institute (SMHI), Norrköping, Sweden, where the RCA4 simulations were performed. The authors acknowledge all data providers for making their data freely available. The authors acknowledge the World Climate Research Programme’s Working Groups on Regional Climate and Coupled Modelling, respectively, the coordinating bodies of CORDEX and CMIP. We also express our gratitude to the three anonymous reviewers for their constructive remarks, which enhanced the quality of the manuscript.

Conflicts of Interest

The authors declare no conflict of interest.

References

  1. Sørland, S.L.; Schär, C.; Luethi, D.; Kjellström, E. Bias patterns and climate change signals in GCM-RCM model chains. Environ. Res. Lett. 2018, 13, 074017. [Google Scholar] [CrossRef]
  2. Wu, M.; Nikulin, G.; Kjellström, E.; Belušić, D.; Jones, C.; Lindstedt, D. The impact of regional climate model formulation and resolution on simulated precipitation in Africa. Earth Syst. Dyn. 2020, 11, 377–394. [Google Scholar] [CrossRef]
  3. Somot, S.; Sevault, F.; Déqué, M.; Crépon, M. 21st century climate change scenario for the Mediterranean using a coupled atmosphere–ocean regional climate model. Glob. Planet. Change 2008, 63, 112–126. [Google Scholar] [CrossRef]
  4. Sein, D.V.; Mikolajewicz, U.; Gröger, M.; Fast, I.; Cabos, W.; Pinto, J.G.; Hagemann, S.; Semmler, T.; Izquierdo, A.; Jacob, D. Regionally coupled atmosphere-ocean-sea ice-marine biogeochemistry model ROM: Description and validation. J. Adv. Model. Earth Syst. 2015, 7, 268–304. [Google Scholar] [CrossRef]
  5. Zou, L.; Zhou, T. A regional ocean–atmosphere coupled model developed for CORDEX East Asia: Assessment of Asian summer monsoon simulation. Clim. Dyn. 2016, 47, 3627–3640. [Google Scholar] [CrossRef]
  6. Zou, L.; Zhou, T. Future summer precipitation changes over CORDEX-East Asia domain downscaled by a regional ocean-atmosphere coupled model: A comparison to the stand-alone RCM. J. Geophys. Res. Atmos. 2017, 121, 2691–2704. [Google Scholar] [CrossRef]
  7. Boé, J.; Somot, S.; Corre, L.; Nabat, P. Large discrepancies in summer climate change over Europe as projected by global and regional climate models: Causes and consequences. Clim. Dyn. 2020, 54, 2981–3002. [Google Scholar] [CrossRef]
  8. Gutiérrez, C.; Somot, S.; Nabat, P.; Mallet, M.; Corre, L.; van Meijgaard, E.; Perpiñán, O.; Gaertner, M. Future evolution of surface solar radiation and photovoltaic potential in Europe: Investigating the role of aerosols. Environ. Res. Lett. 2020, 15, 034035. [Google Scholar] [CrossRef]
  9. Schwingshackl, C.; Davin, E.L.; Hirschi, M.; Sørland, S.L.; Wartenburger, R.; I Seneviratne, S. Regional climate model projections underestimate future warming due to missing plant physiological CO2 response. Environ. Res. Lett. 2019, 14, 114019. [Google Scholar] [CrossRef]
  10. Xie, B.; Fung, J.C.H. A comparison of momentum mixing models for the planetary boundary layer. J. Geophys. Res. Atmos. 2014, 119, 2079–2091. [Google Scholar] [CrossRef]
  11. Doblas-Reyes, F.J.; Sörensson, A.A.; Almazroui, M.; Dosio, A.; Gutowski, W.J.; Haarsma, R.; Hamdi, R.; Hewitson, B.; Kwon, W.-T.; Lamptey, B.L.; et al. Linking Global to Regional Climate Change. In Climate Change 2021: The Physical Science Basis; Contribution of Working Group I to the Sixth Assessment Report of the Intergovernmental Panel on Climate Change; Intergovernmental Panel on Climate Change: Geneva, Switzerland, 2021. [Google Scholar] [CrossRef]
  12. Rowell, D.P.; Senior, C.A.; Vellinga, M.; Graham, R.J. Can climate projection uncertainty be constrained over Africa using metrics of contemporary performance? Clim. Change 2015, 134, 621–633. [Google Scholar] [CrossRef]
  13. James, R.; Washington, R.; Abiodun, B.; Kay, G.; Mutemi, J.; Pokam, W.; Hart, N.; Artan, G.; Senior, C. Evaluating Climate Models with an African Lens. Bull. Am. Meteorol. Soc. 2018, 99, 313–336. [Google Scholar] [CrossRef]
  14. Creese, A.; Washington, R.; Jones, R. Climate change in the Congo Basin: Processes related to wetting in the December–February dry season. Clim. Dyn. 2019, 53, 3583–3602. [Google Scholar] [CrossRef]
  15. Creese, A.; Washington, R.; Munday, C. The Plausibility of September–November Congo Basin Rainfall Change in Coupled Climate Models. J. Geophys. Res. Atmos. 2019, 124, 5822–5846. [Google Scholar] [CrossRef]
  16. Tamoffo, A.T.; Moufouma-Okia, W.; Dosio, A.; James, R.; Pokam, W.M.; Vondou, D.A.; Fotso-Nguemo, T.C.; Guenang, G.M.; Kamsu-Tamo, P.H.; Nikulin, G.; et al. Process-oriented assessment of RCA4 regional climate model projections over the Congo Basin under 1.5 °C and 2 °C global warming levels: Influence of regional moisture fluxes. Clim. Dyn. 2019, 53, 1911–1935. [Google Scholar] [CrossRef]
  17. Tamoffo, A.T.; Nikulin, G.; Vondou, D.A.; Dosio, A.; Nouayou, R.; Wu, M.; Igri, P.M. Process-based assessment of the impact of reduced turbulent mixing on Congo Basin precipitation in the RCA4 Regional Climate Model. Clim. Dyn. 2021, 56, 1951–1965. [Google Scholar] [CrossRef]
  18. Taylor, K.E.; Stouffer, R.J.; Meehl, G.A. An overview of CMIP5 and the experiment design. Bull. Amer. Meteor. Soc. 2012, 93, 485–498. [Google Scholar] [CrossRef]
  19. Taylor, K.E.; Stouffer, R.J.; Meehl, G.A. On the range of future Sahel precipitation projections and the selection of a sub-sample of CMIP5 models for impact studies. Clim. Dyn. 2016, 48, 2751–2770. [Google Scholar] [CrossRef]
  20. Dosio, A.; Turner, A.G.; Tamoffo, A.T.; Sylla, M.B.; Lennard, C.; Jones, R.G.; Terray, L.; Nikulin, G.; Hewitson, B. A tale of two futures: Contrasting scenarios of future precipitation for West Africa from an ensemble of Regional Climate Models. Environ. Res. Lett. 2020, 15, 064007. [Google Scholar] [CrossRef]
  21. Pokam, W.M.; Bain, C.L.; Chadwick, R.S.; Graham, R.; Sonwa, D.J.; Kamga, F.M. Identification of processes driving low-level westerlies in west equatorial Africa. J. Clim. 2014, 27, 4245–4262. [Google Scholar] [CrossRef]
  22. Creese, A.; Washington, R. Using qflux to constrain modeled Congo Basin rainfall in the CMIP5 ensemble. J. Geophys. Res. Atmos. 2016, 121, 13415–13442. [Google Scholar] [CrossRef]
  23. Dyer, E.L.; Jones, D.B.; Nusbaumer, J.; Li, H.; Collins, O.; Vettoretti, G.; Noone, D. Congo basin precipitation: Assessing seasonality, regional interactions, and sources of moisture. J. Geophys. Res. Atmos. 2017, 122, 6882–6898. [Google Scholar] [CrossRef]
  24. Washington, R.; James, R.; Pearce, H.; Pokam, W.M.; Moufouma-Okia, W. Congo basin rainfall climatology: Can we believe the climate models? Philos. Trans. R. Soc. Lond. B Biol. Sci. 2013, 368, 20120296. [Google Scholar] [CrossRef] [PubMed]
  25. Van der Ent, R.J.; Savenije, H.H.; Schaefli, B.; Steele-Dunne, S.C. Origin and fate of atmospheric moisture over continents. Water Resour. Res. 2010, 46. [Google Scholar] [CrossRef]
  26. Van der Ent, R.J.; Savenije, H.H.G. Oceanic sources of continental precipitation and the correlation with sea surface temperature. Water Resour. Res. 2013, 49, 3993–4004. [Google Scholar] [CrossRef]
  27. Pokam, W.M.; Djiotang, L.A.T.; Mkankam, F.K. Atmospheric water vapor transport and recycling in equatorial central africa through ncep/ncar reanalysis data. Clim. Dyn. 2012, 38, 1715–1729. [Google Scholar] [CrossRef]
  28. Munday, C.; Washington, R.; Hart, N. African Low-Level Jets and Their Importance for Water Vapor Transport and Rainfall. Geophys. Res. Lett. 2021, 48, e2020GL090999. [Google Scholar] [CrossRef]
  29. Lee, D.; Min, S.-K.; Jin, J.; Lee, J.-W.; Cha, D.-H.; Suh, M.-S.; Ahn, J.-B.; Hong, S.-Y.; Kang, H.-S.; Joh, M. Thermodynamic and dynamic contributions to future changes in summer precipitation over Northeast Asia and Korea: A multi-RCM study. Clim. Dyn. 2017, 49, 4121–4139. [Google Scholar] [CrossRef]
  30. Longandjo, G.-N.T.; Rouault, M. On the structure of the regional-scale circulation over central africa: Seasonal evolution, variability, and mechanisms. J. Clim. 2020, 33, 145–162. [Google Scholar] [CrossRef]
  31. Strandberg, G.; Bärring, L.; Hansson, U.; Jansson, C.; Jones, C.; Kjellström, E.; Kupiainen, M.; Nikulin, G.; Samuelsson, P.; Ullerstig, A. CORDEX Scenarios for Europe from the Rossby Centre Regional Climate Model; RCATechnical Report 116; Climate Research-Rossby Centre: Norrköping, Sweden, 2015. [Google Scholar]
  32. Giorgi, F.; Jones, C.; Asrar, G.R. Addressing climate information needs at the regional level: The CORDEX framework. WMO Bull. 2009, 58, 175–183. Available online: https://public.wmo.int/en/bulletin/addressing-climate-information-needs-regional-level-cordex-framework (accessed on 11 September 2023).
  33. Van Vuuren, D.P.; Edmonds, J.; Kainuma, M.; Riahi, K.; Thomson, A.; Hibbard, K.; Hurtt, G.C.; Kram, T.; Krey, V.; Lamarque, J.-F.; et al. The representative concentration pathways: An overview. Clim. Change 2011, 109, 5. [Google Scholar] [CrossRef]
  34. Dosio, A.; Lennard, C.; Spinoni, J. Projections of indices of daily temperature and precipitation based on bias-adjusted CORDEX-Africa regional climate model simulations. Clim. Change 2022, 170, 13. [Google Scholar] [CrossRef]
  35. Wu, M.; Schurgers, G.; Rummukainen, M.; Smith, B.; Samuelsson, P.; Jansson, C.; Siltberg, J.; May, W. Vegetation–climate feedback modulates rainfall patterns in Africa under future climate change. Earth Syst. Dyn. 2016, 7, 627–647. [Google Scholar] [CrossRef]
  36. Tamoffo, A.T.; Dosio, A.; Vondou, D.A.; Sonkoué, D. Process-Based Analysis of the Added Value of Dynamical Downscaling Over Central Africa. Geophys. Res. Lett. 2020, 47, e2020GL089702. [Google Scholar] [CrossRef]
  37. Hazeleger, W.; Severijns, C.; Semmler, T.; Ştefănescu, S.; Yang, S.; Wang, X.; Wyser, K.; Dutra, E.; Baldasano, J.M.; Bintanja, R.; et al. EC-Earth. Bull. Am. Meteorol. Soc. 2010, 91, 1357–1364. [Google Scholar] [CrossRef]
  38. Watanabe, S.; Hajima, T.; Sudo, K.; Nagashima, T.; Takemura, T.; Okajima, H.; Nozawa, T.; Kawase, H.; Abe, M.; Yokohata, T.; et al. Miroc-esm 2010: Model description and basic results of cmip5-20c3m experiments. Geosci. Model Dev. 2011, 4, 1063–1128. [Google Scholar] [CrossRef]
  39. Seager, R.; Naik, N.; Vecchi, G.A. Thermodynamic and Dynamic Mechanisms for Large-Scale Changes in the Hydrological Cycle in Response to Global Warming. J. Clim. 2010, 23, 4651–4668. [Google Scholar] [CrossRef]
  40. Endo, H.; Kitoh, A. Thermodynamic and dynamic effects on regional monsoon rainfall changes in a warmer climate. Geophys. Res. Lett. 2014, 41, 1704–1711. [Google Scholar] [CrossRef]
  41. Seneviratne, S.I.; Viterbo, P.; Lüthi, D.; Schär, C. Inferring Changes in Terrestrial Water Storage Using ERA-40 Reanalysis Data: The Mississippi River Basin. J. Clim. 2004, 17, 2039–2057. [Google Scholar] [CrossRef]
  42. Giannini, A.; Lyon, B.; Seager, R.; Vigaud, N. Dynamical and thermodynamic elements of modeled climate change at the East African margin of convection. Geophys. Res. Lett. 2018, 45, 992–1000. [Google Scholar] [CrossRef]
  43. Udo, S.; Stephanie, H.; Peter, F.; Elke, R.; Markus, Z. GPCC Full Data Monthly Product Version 2022 at 0.25°: Monthly Land-Surface Precipitation from Rain-Gauges Built on GTS-Based and Historical Data; Global Precipitation Climatology Centre: Offenbach, Germany, 2022. [CrossRef]
  44. Dee, D.P.; Uppala, S.M.; Simmons, A.J.; Berrisford, P.; Poli, P.; Kobayashi, S.; Andrae, U.; Balmaseda, M.A.; Balsamo, G.; Bauer, P.; et al. The ERA-Interim reanalysis: Configuration and performance of the data assimilation system. Q. J. R. Meteorol. Soc. 2011, 137, 553–597. [Google Scholar] [CrossRef]
  45. Dezfuli, A.K.; Zaitchik, B.F.; Gnanadesikan, A. Regional Atmospheric Circulation and Rainfall Variability in South Equatorial Africa. J. Clim. 2015, 28, 809–818. [Google Scholar] [CrossRef]
  46. Akinsanola, A.A.; Zhou, W. Dynamic and thermodynamic factors controlling increasing summer monsoon rainfall over the West African Sahel. Clim. Dyn. 2018, 52, 4501–4514. [Google Scholar] [CrossRef]
  47. Han, Z.; Su, T.; Zhang, Q.; Wen, Q.; Feng, G. Thermodynamic and dynamic effect of increased moisture sources over the Tropical Indian Ocean in recent decades. Clim. Dyn. 2019, 53, 7081–7096. [Google Scholar] [CrossRef]
  48. Sørland, S.L.; Brogli, R.; Pothapakula, P.K.; Russo, E.; Van de Walle, J.; Ahrens, B.; Anders, I.; Bucchignani, E.; Davin, E.L.; Demory, M.-E.; et al. COSMO-CLM regional climate simulations in the Coordinated Regional Climate Downscaling Experiment (CORDEX) framework: A review. Geosci. Model Dev. 2021, 14, 5125–5154. [Google Scholar] [CrossRef]
  49. Collins, W.; Colman, R.; Haywood, J.; Manning, M.R.; Mote, P. The Physical Science behind Climate Change. Sci. Am. 2007, 297, 64–73. [Google Scholar] [CrossRef] [PubMed]
  50. Dosio, A.; Panitz, H.-J.; Schubert-Frisius, M.; Lüthi, D. Dynamical downscaling of CMIP5 global circulation models over CORDEX-Africa with COSMO-CLM: Evaluation over the present climate and analysis of the added value. Clim. Dyn. 2015, 44, 2637–2661. [Google Scholar] [CrossRef]
  51. Held, I.M.; Soden, B.J. Robust responses of the hydrological cycle to global warming. J. Clim. 2006, 19, 5686–5699. [Google Scholar] [CrossRef]
  52. Vecchi, G.A.; Soden, B.J. Effect of remote sea surface temperature change on tropical cyclone potential intensity. Nature 2007, 450, 1066–1070. [Google Scholar] [CrossRef]
  53. Xie, S.-P.; Deser, C.; Vecchi, G.A.; Ma, J.; Teng, H.; Wittenberg, A.T. Global warming pattern formation: Sea surface temperature and rainfall. J. Clim. 2010, 23, 966–986. [Google Scholar] [CrossRef]
  54. Huang, P.; Xie, S.-P.; Hu, K.; Huang, G.; Huang, R. Patterns of the seasonal response of tropical rainfall to global warming. Nat. Geosci. 2013, 6, 357–361. [Google Scholar] [CrossRef]
  55. Cook, K.H.; Liu, Y.; Vizy, E.K. Congo Basin drying associated with poleward shifts of African thermal lows. Clim. Dyn. 2020, 54, 863–883. [Google Scholar] [CrossRef]
Figure 1. (a) Future (2071–2100) minus historical (1976–2005) mean seasonal cycle rainfall (shaded; in mm/day) in RCA4-v1 (rows 1 and 2) and RCA4-v4 (rows 3 and 4). The contours indicate the position of the rainband (i.e., precipitation amounts larger than 3 mm/day) from GPCC-v8 (black contour, shown in every panel for reference). (b) Long-term mean seasonal changes in the difference between RCA4-v4 and RCA4-v1 rainfall (rows 1 and 2). Stippling indicates 95% significance level using t-test. The red box denotes the Congo Basin. Names of datasets are shown to the left of the panel.
Atmosphere 14 01808 g001
Figure 2. (a) Future (2071–2100) minus historical (1976–2005) mean intra-seasonal variability in the vertical profile of moisture convergence (in 10−8 kg m−2s−1) from RCA4-v1 (rows 1 and 2) and RCA4-v4 (rows 3 and 4). Superimposed contours (moisture larger than 10 × 10−8 kg m−2s−1) indicate the climatology of corresponding components from ERA-Interim (black contours), and are shown in every panel for reference. Dashed contours (negative values) are moisture divergence, and solid contours (positive values) moisture convergence. (b) Long-term mean changes in the difference between RCA4-v4 and RCA4-v1 moisture (rows 1 and 2). Stippling indicates 95% significance level using t-test. Names of datasets are shown to the left of the panel.
Atmosphere 14 01808 g002
Figure 3. Future (2071–2100) minus historical (1976–2005) mean seasonal differences between evaporation (E) and precipitation (P), hereinafter termed ΔEmP, in mm/day, in RCA4-v1 (rows 1 and 2) and RCA4-v4 (rows 3 and 4). Stippling indicates 95% significance level using t-test. The black box denotes the Congo Basin. Names of datasets are shown to the left of the panel.
Atmosphere 14 01808 g003
Figure 4. (a) Change (2071–2100 vs. 1976–2005) in seasonal mean dynamic term (ΔDY) of the moisture budget (in 10−8 Kg m−2s−1) in RCA4-v1 (rows 1 and 2) and RCA4-v4 (rows 3 and 4). (b) Long-term mean seasonal changes in the difference between RCA4-v4 and RCA4-v1 ΔDY (rows 1 and 2). Vectors are the dynamical change in moisture transport, computed as the vertical integral (1000–300 hPa) of climatological specific humidity (q) multiplying the change in horizontal components of wind (u, v). The contours indicate the position of the rainband (i.e., precipitation larger than 3 mm/day) from GPCC-v8 (black contour, shown in every panel). The red box denotes the Congo Basin. Names of datasets are shown to the left of the panel.
Atmosphere 14 01808 g004
Figure 5. (a) Change (2071–2100 vs. 1976–2005) in seasonal mean thermodynamic term (ΔTH) of the moisture budget (in 10−8 kg m−2s−1) in RCA4-v1 (rows 1 and 2) and RCA4-v4 (rows 3 and 4). (b) Long-term mean seasonal changes in the difference between RCA4-v4 and RCA4-v1 ΔTH (rows 1 and 2). Vectors are the thermodynamic change in moisture transport, computed as the vertical integral (1000–300 hPa) of the change in specific humidity (q), multiplying the climatological horizontal components of wind (u, v). The contours indicate the position of the rainband (i.e., precipitation larger than 3 mm/day) from GPCC-v8 (black contour, shown in every panel). The red box denotes the Congo Basin. Names of datasets are shown to the left of the panel.
Atmosphere 14 01808 g005
Figure 6. Mean seasonal percentage of the contribution of each moisture budget’s term (a) ΔDY and (b) ΔTH to the total moisture-budget change ΔDY + ΔTH).
Atmosphere 14 01808 g006
Table 1. Details of the two CMIP5 used to force RCA4 (v1&v4) versions.
GCMs NamesInstitutionRCA4 Run’s Name (0.44°)Turbulent MixingDates UsedReference
EC-EARTHEuropean community Earth—System Model ConsortiumRCA4-EC-EARTH-v1CORDEX version
reduced
1976–2005
2071–2100
[37]
RCA4-EC-EARTH-v4
MIROC5Atmosphere and Ocean Research Institute (University of Tokyo)RCA4-MIROC5-v1CORDEX version
reduced
1976–2005
2071–2100
[38]
RCA4-MIROC5-v4
Disclaimer/Publisher’s Note: The statements, opinions and data contained in all publications are solely those of the individual author(s) and contributor(s) and not of MDPI and/or the editor(s). MDPI and/or the editor(s) disclaim responsibility for any injury to people or property resulting from any ideas, methods, instructions or products referred to in the content.

