
The Characteristics and Impact Factors of Sulfate and Nitrate in Urban PM2.5 over Typical Cities of Hangzhou Bay Area, China
Abstract
:1. Introduction
2. Materials and Methods
2.1. Study Sites and Field Sampling
2.2. Ion Analysis
2.3. Concentrations of SO2, NO2, O3, and PM2.5 and Meteorological Data
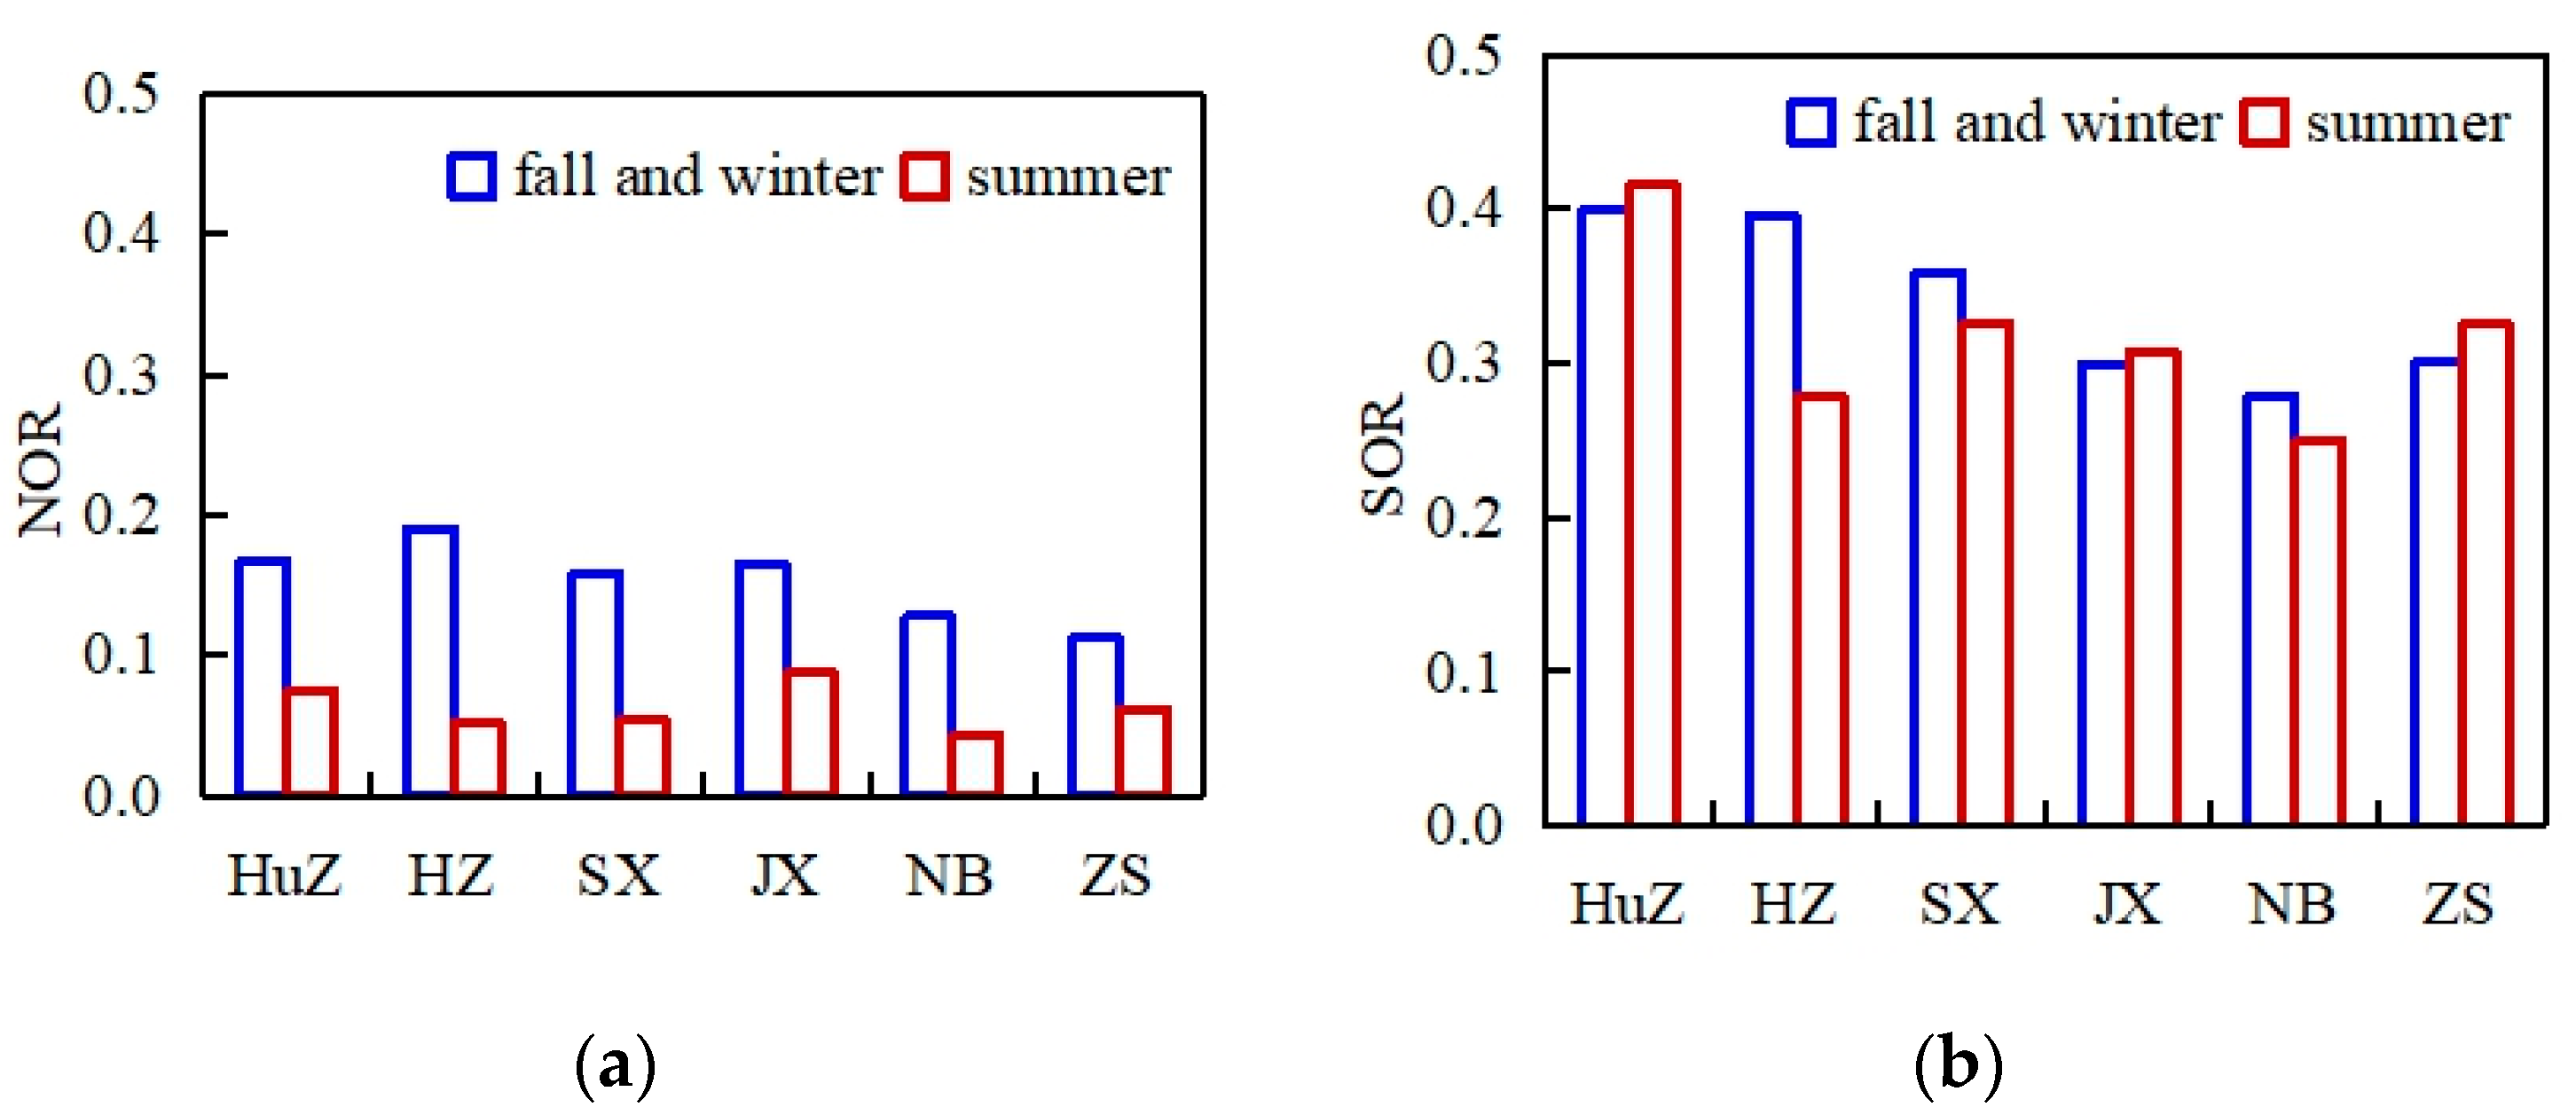
2.4. Calculation of NOR and SOR
2.5. Statistical Analysis
2.6. Backward Trajectory and Potential Source Regions of SO42− and NO3−
3. Results and Discussion
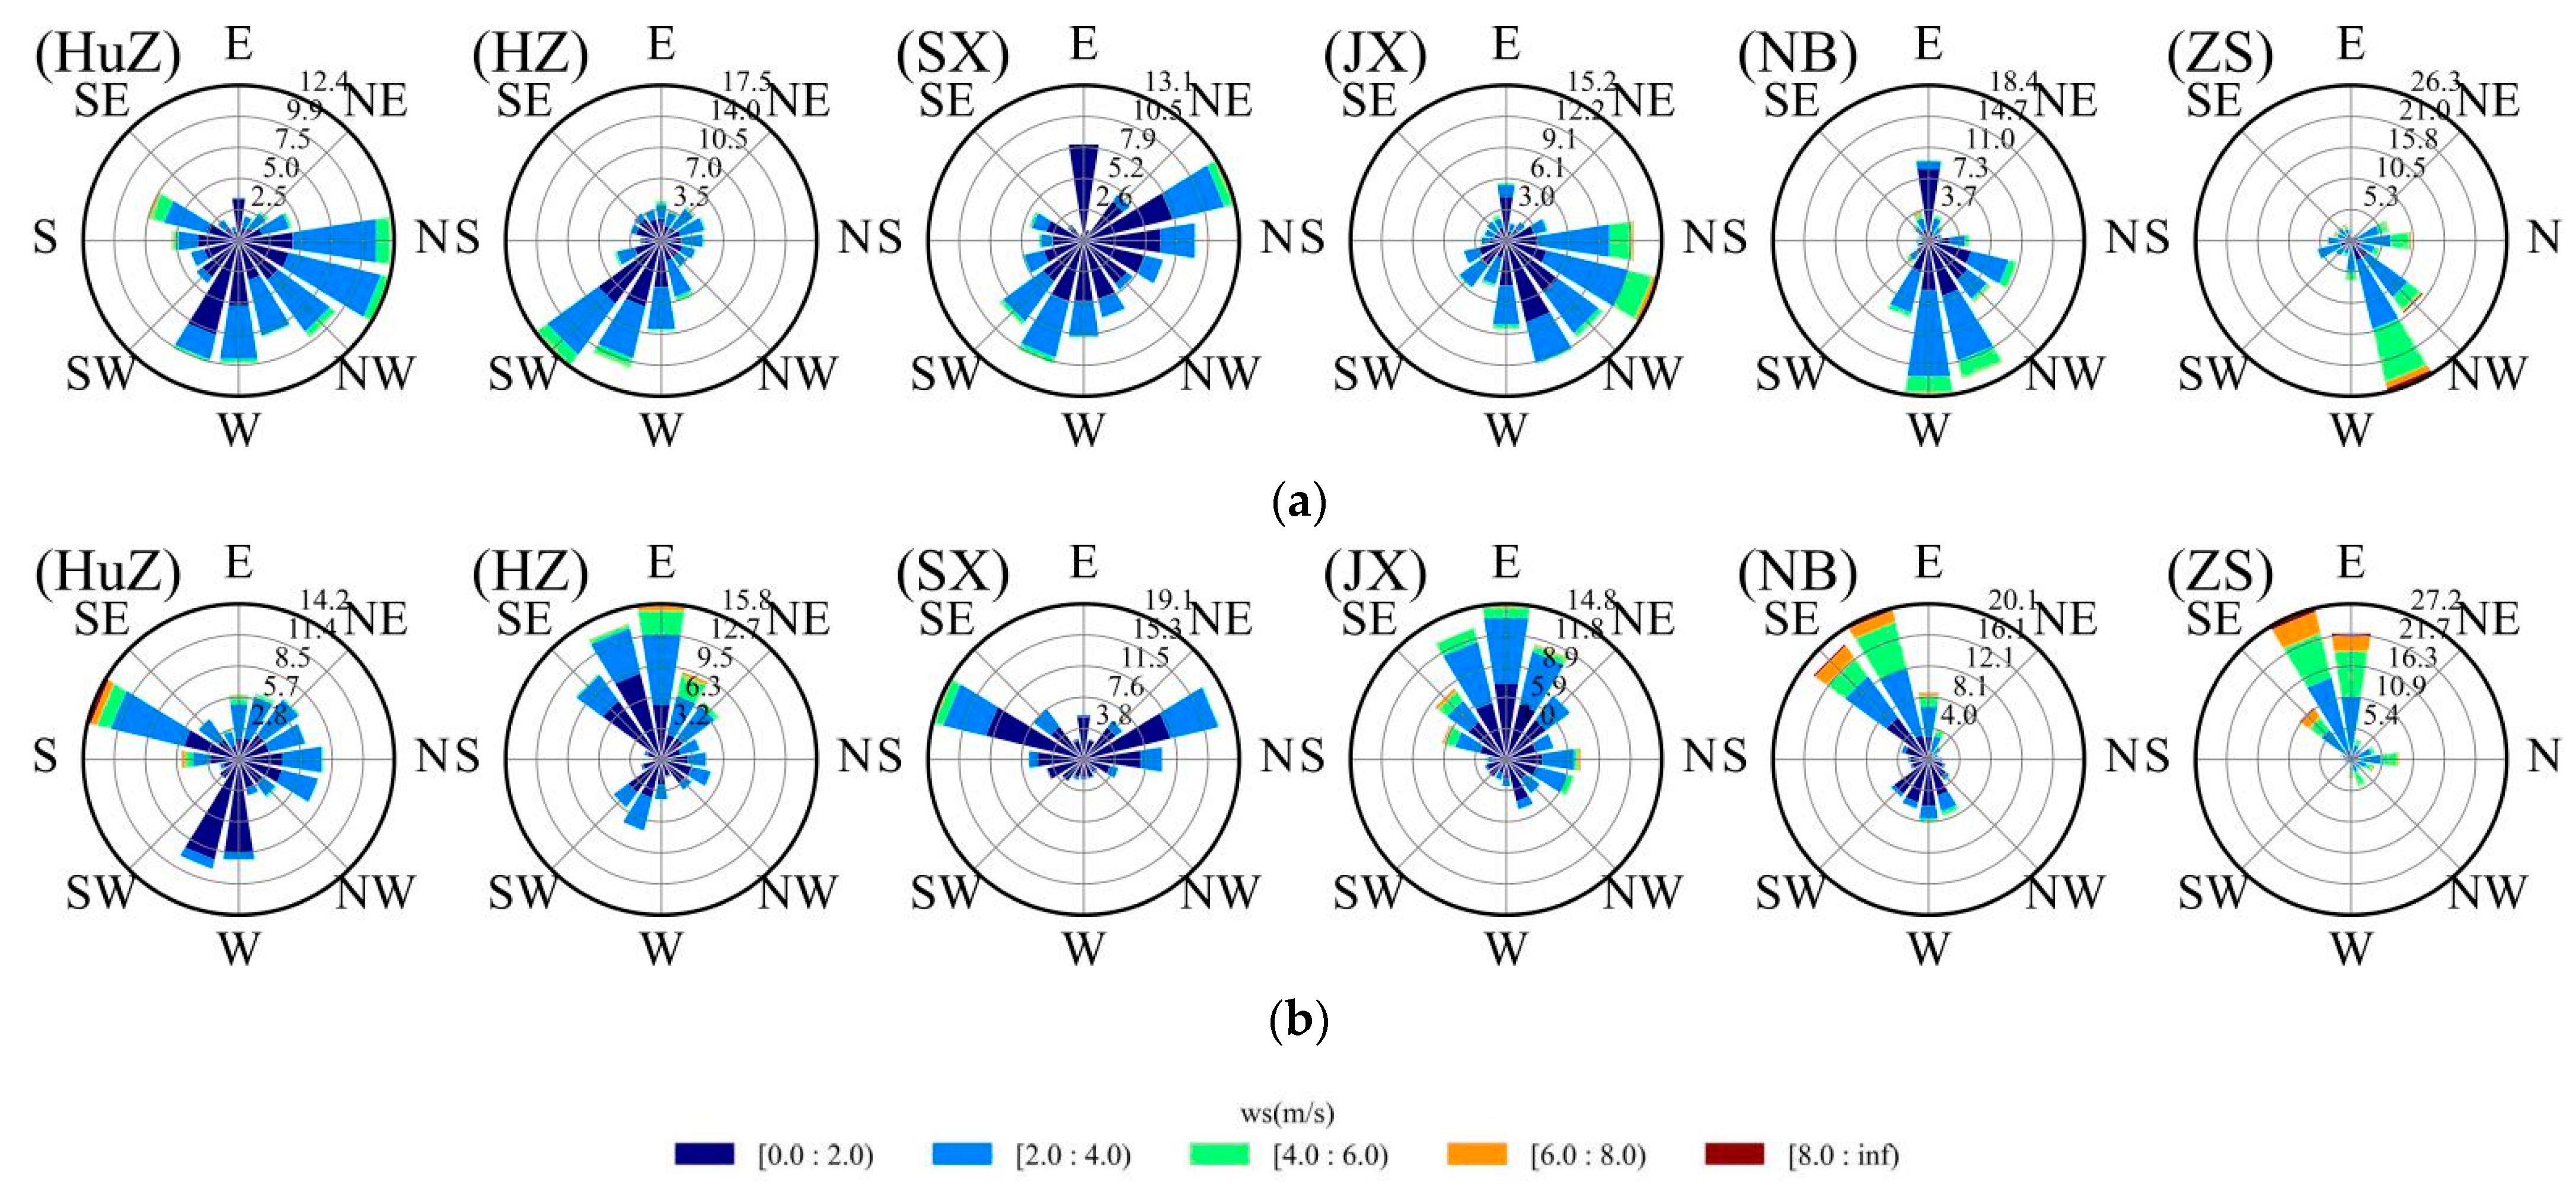
3.1. Overview of Meteorological Conditions during the Sampling Periods
3.2. Temporal and Spatial Variations in NO3− and SO42− in PM2.5
3.2.1. PM2.5 Concentration
3.2.2. Concentrations of SO42− and NO3− in PM2.5
3.3. Ratio of NO3− to SO42− in PM2.5
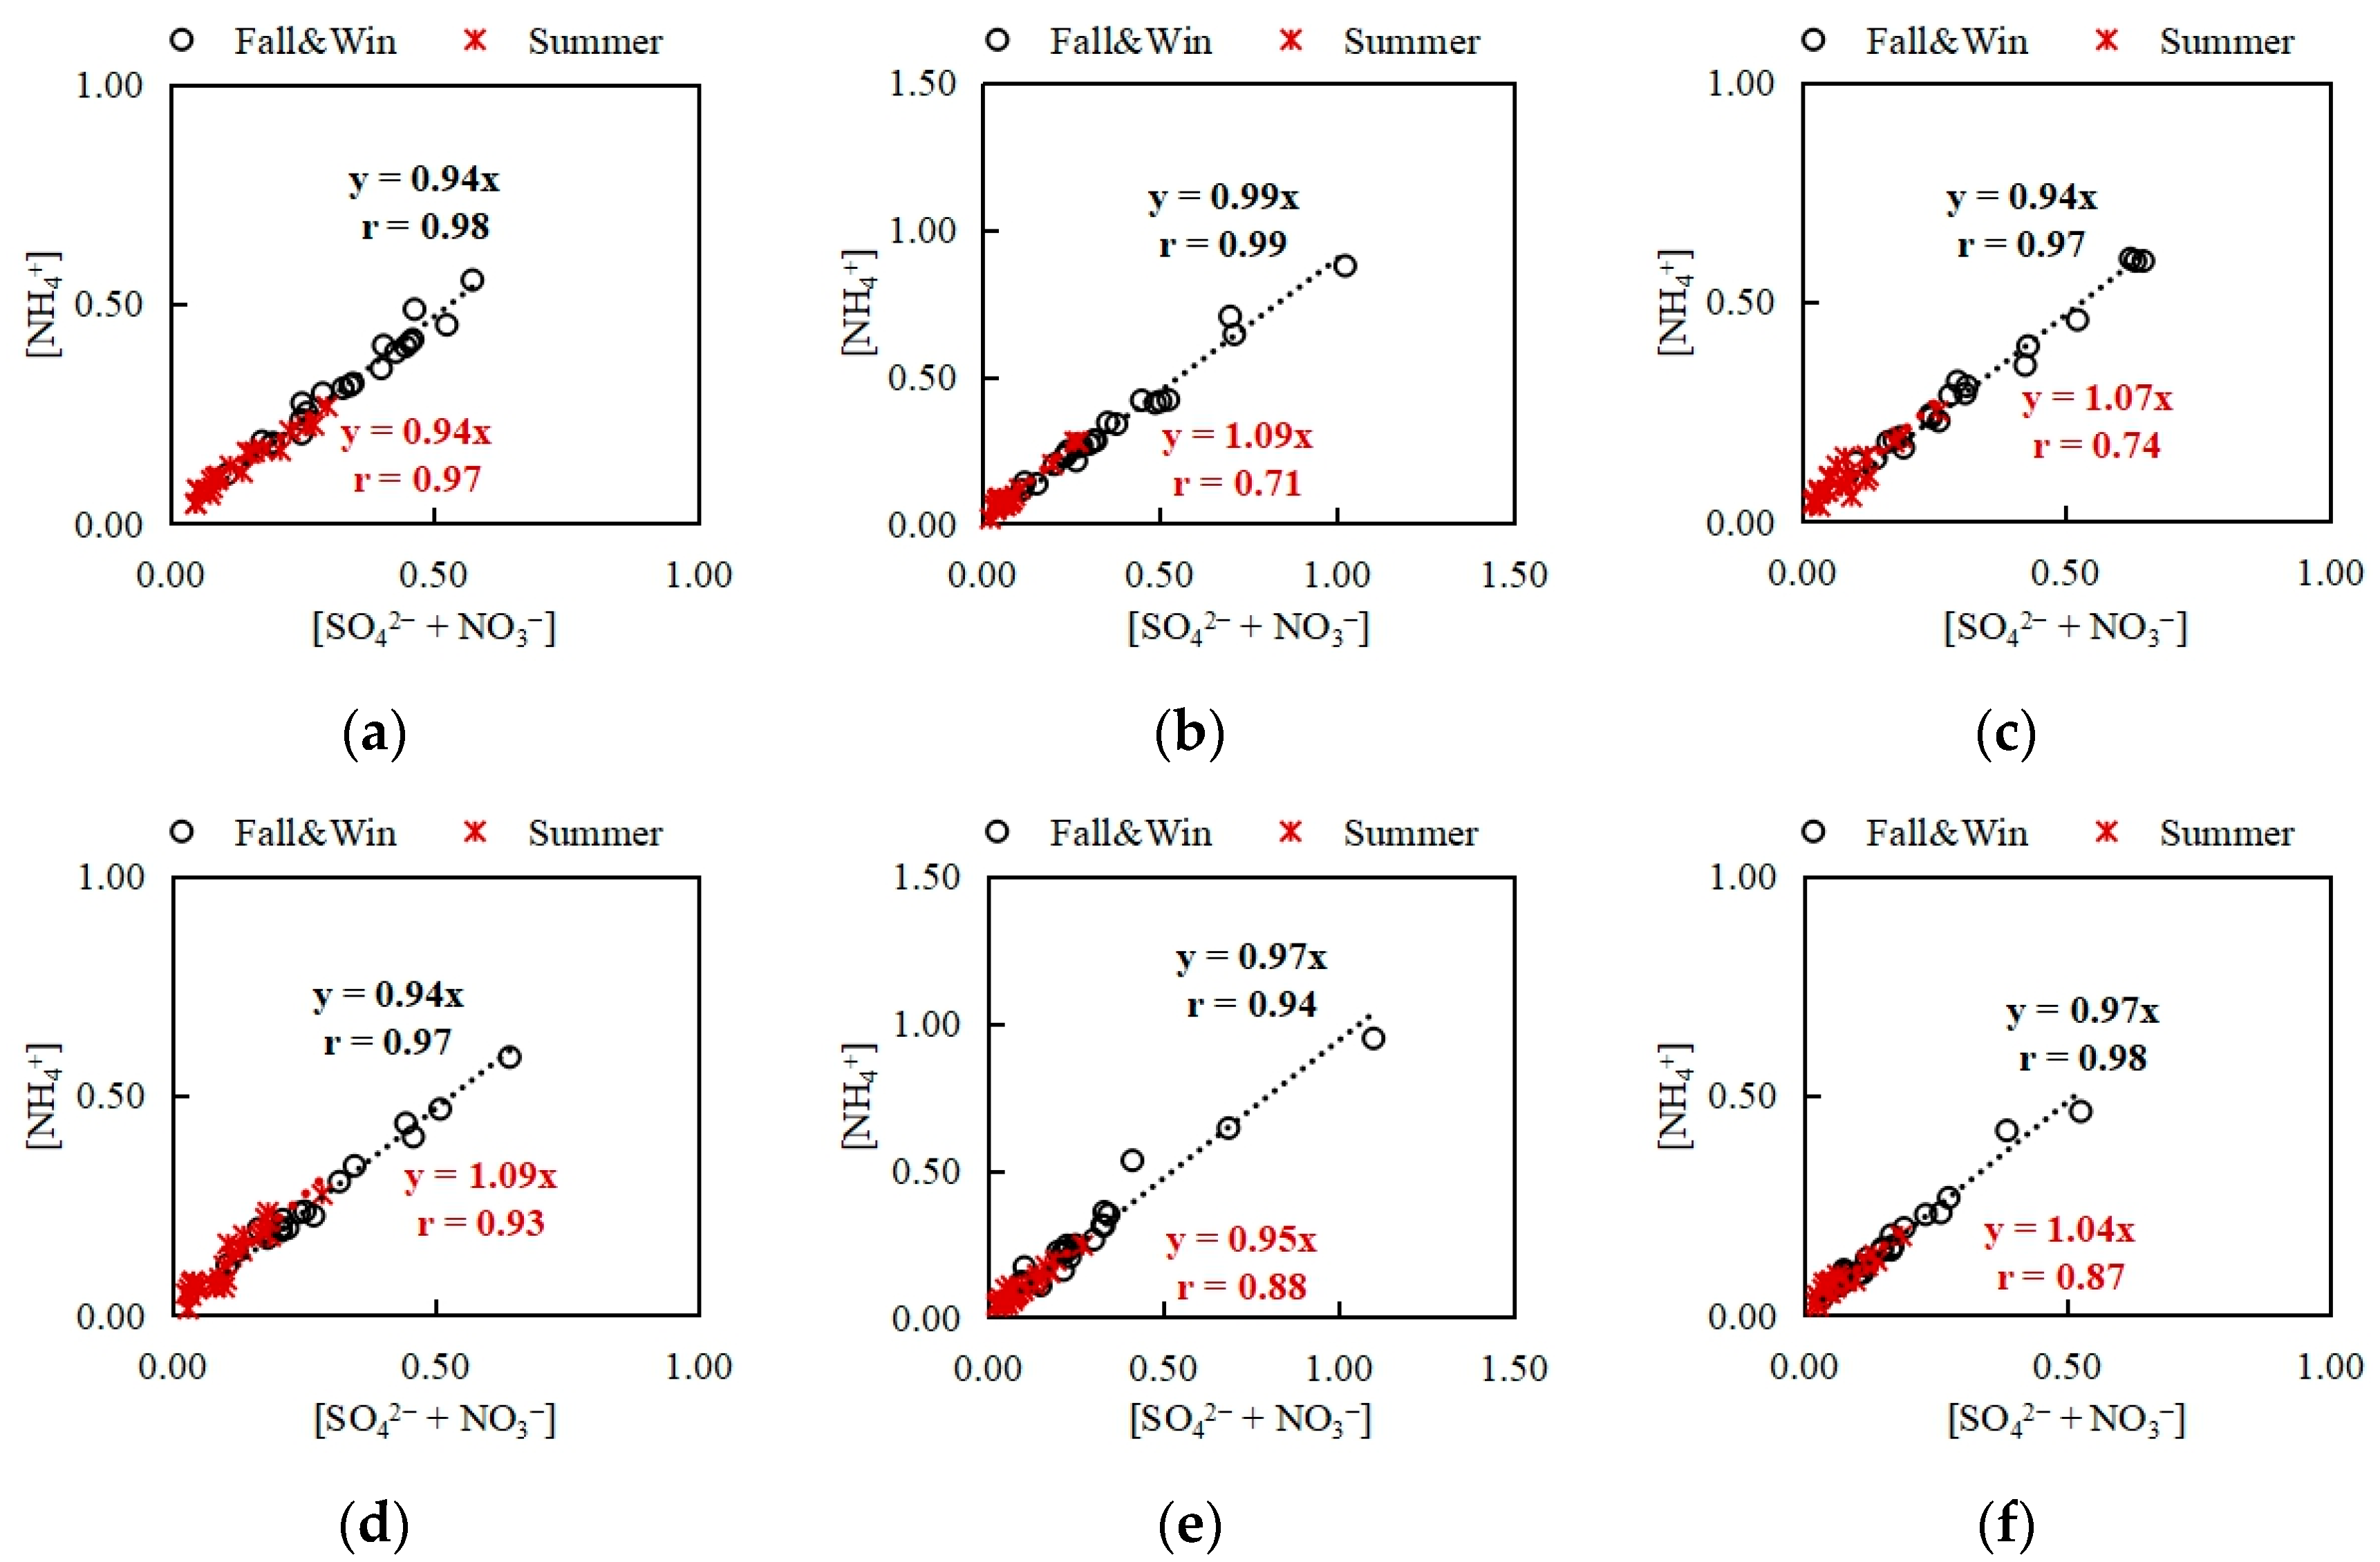
3.4. Correlation between SO42−, NO3−, and NH4+ in PM2.5
3.5. Influence Factors on the Formation of SO42− and NO3−
3.5.1. Impact of Precursors on the Formation of SO42− and NO3−
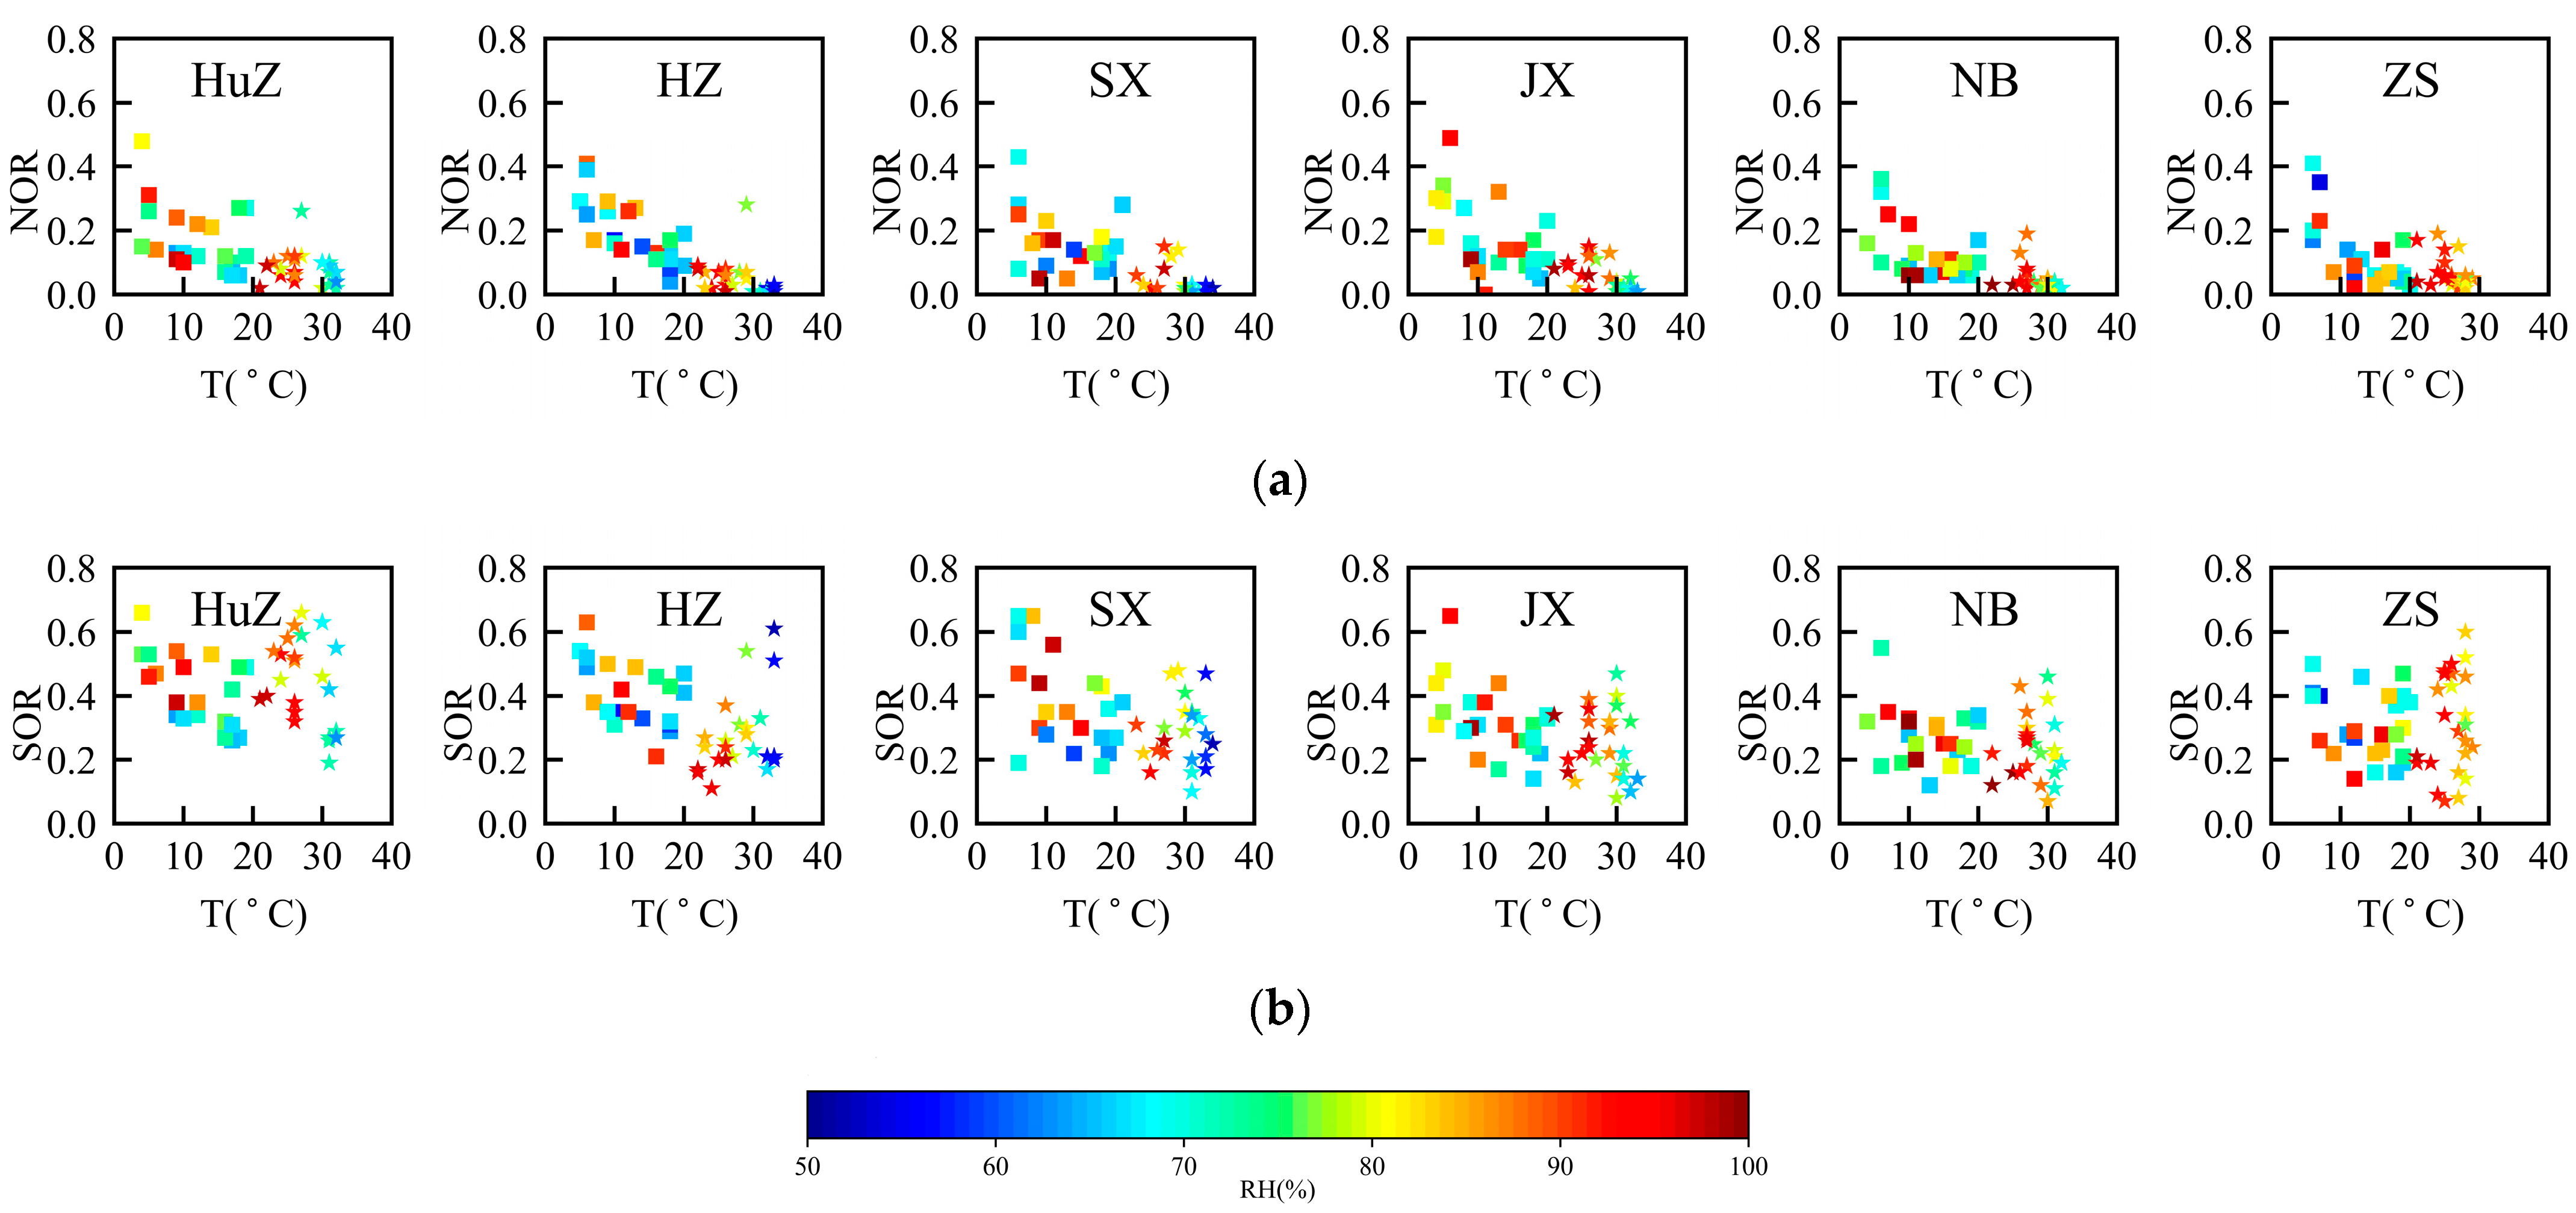
3.5.2. Impact of Meteorological Factors on the Formation of SO42− and NO3−
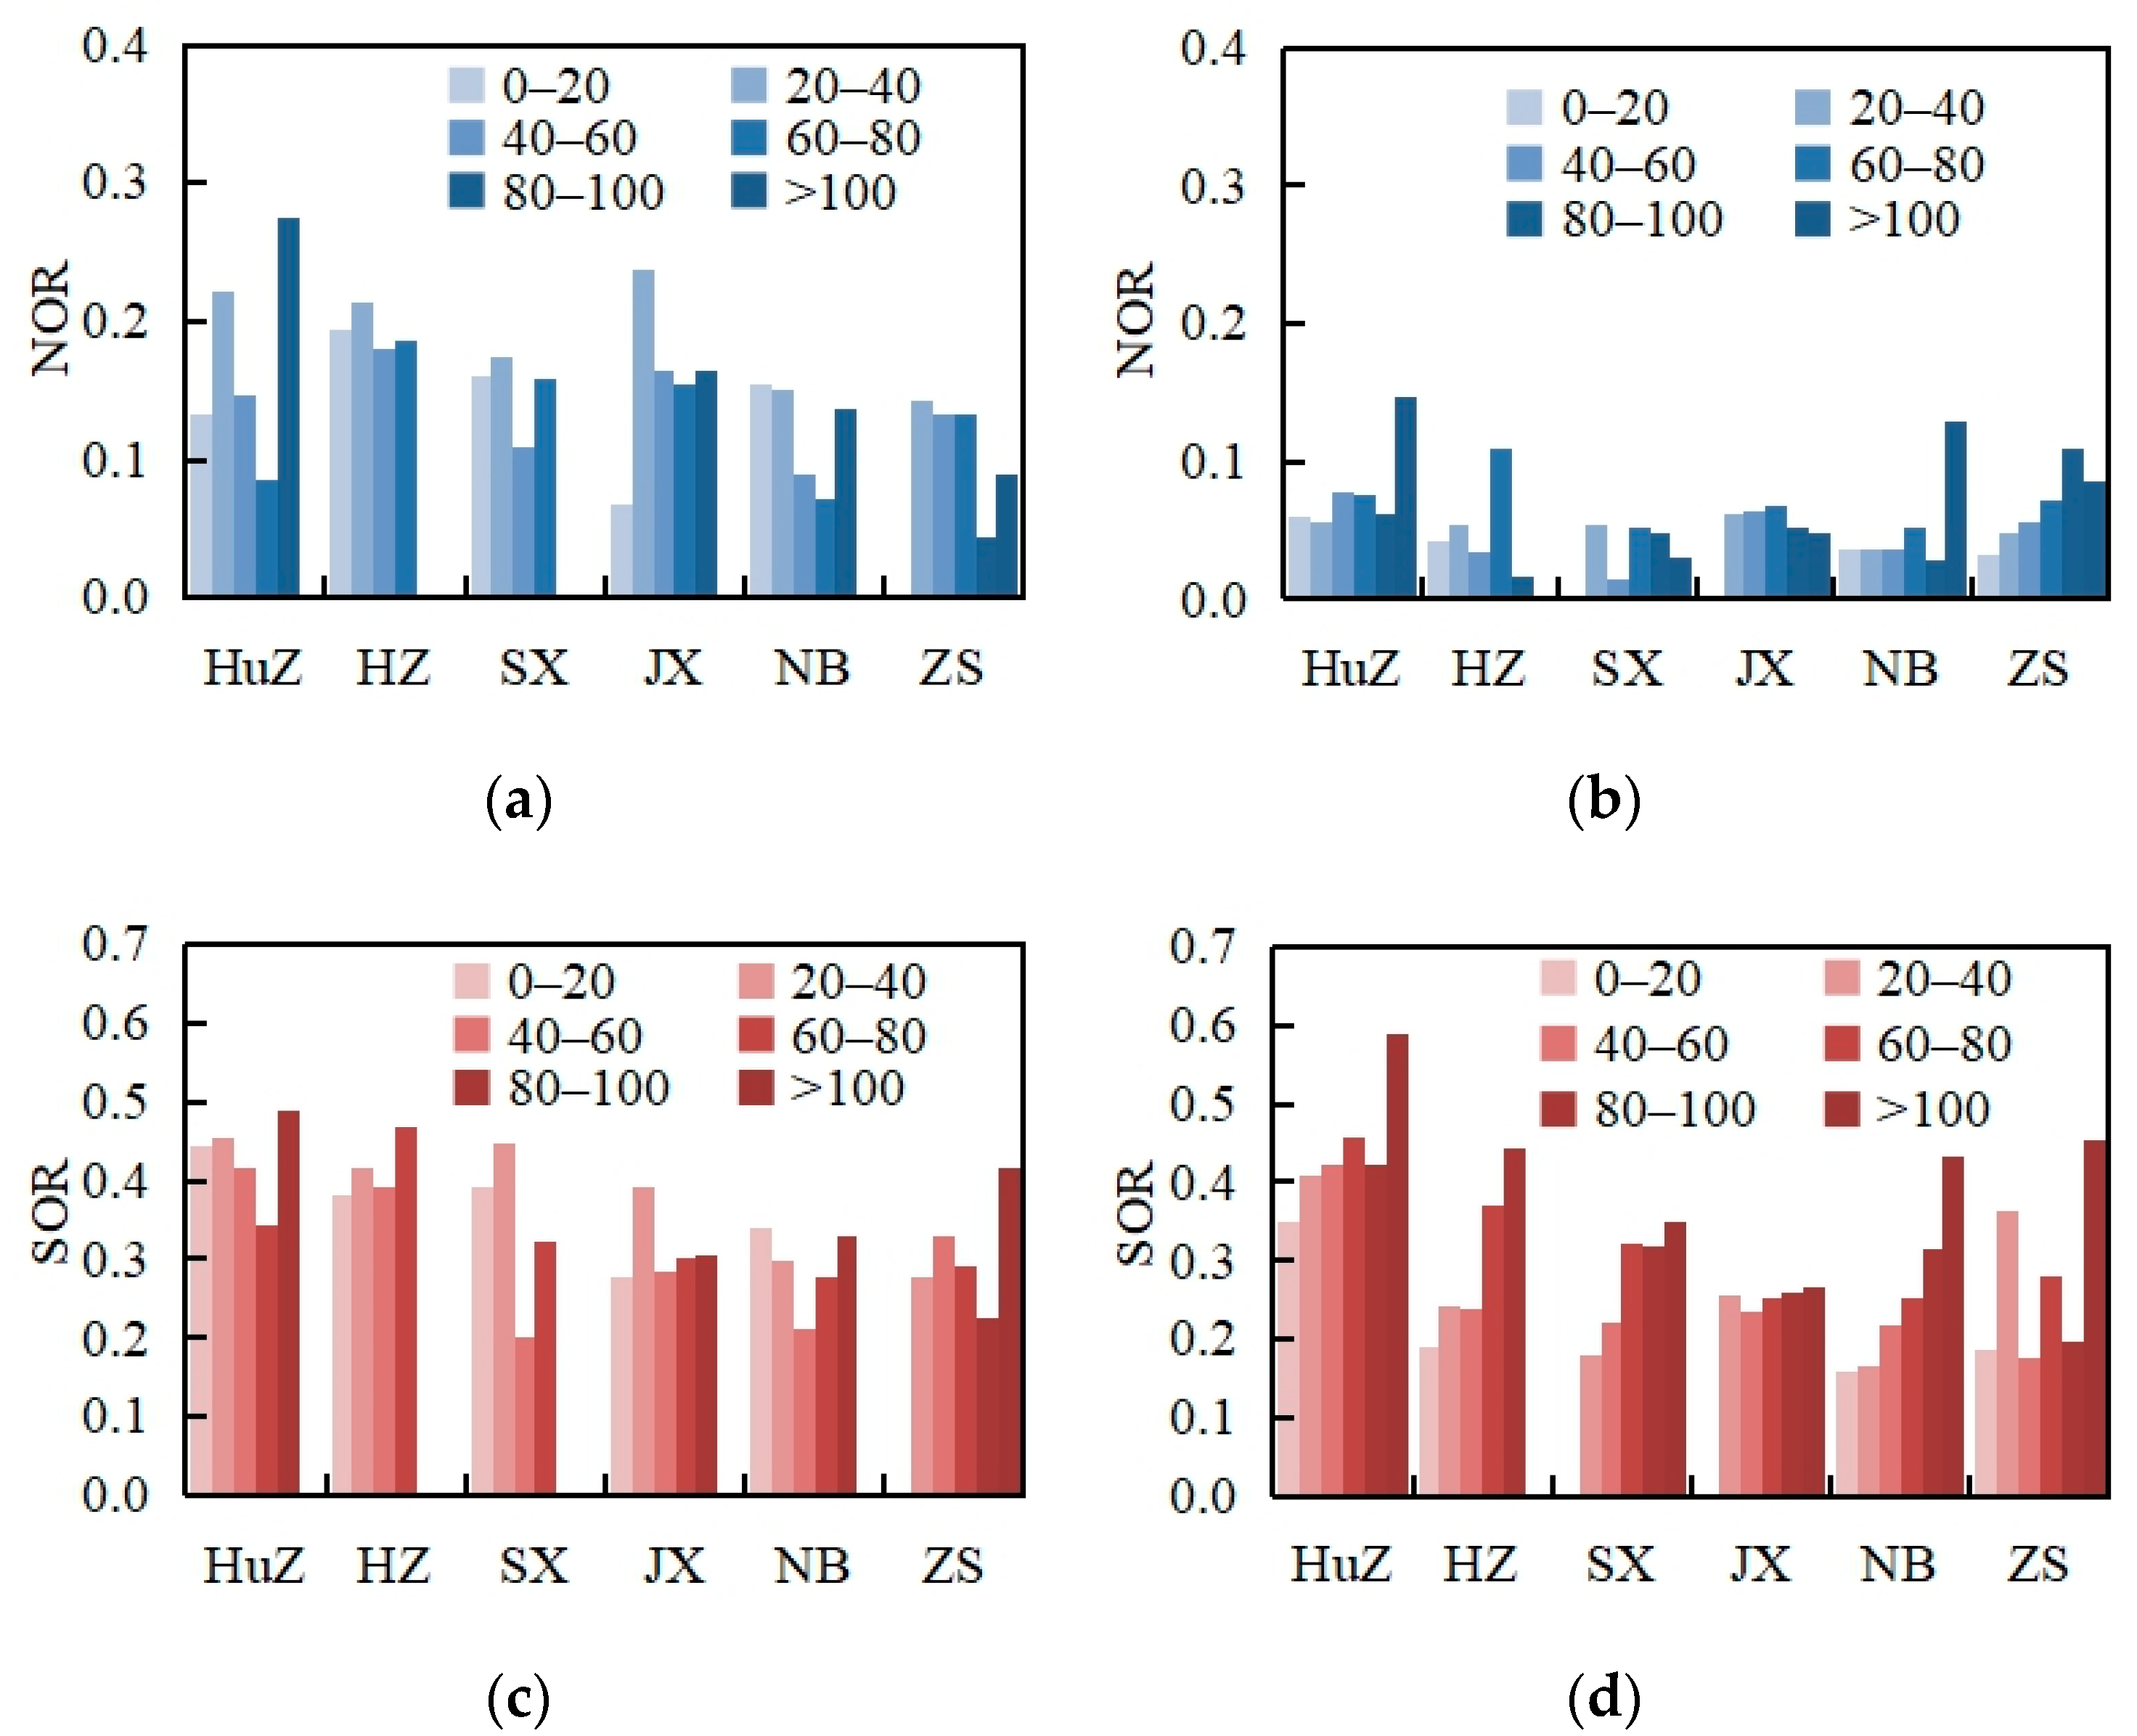
3.5.3. Impact of Atmospheric Oxidation on the Formation of SO42− and NO3−
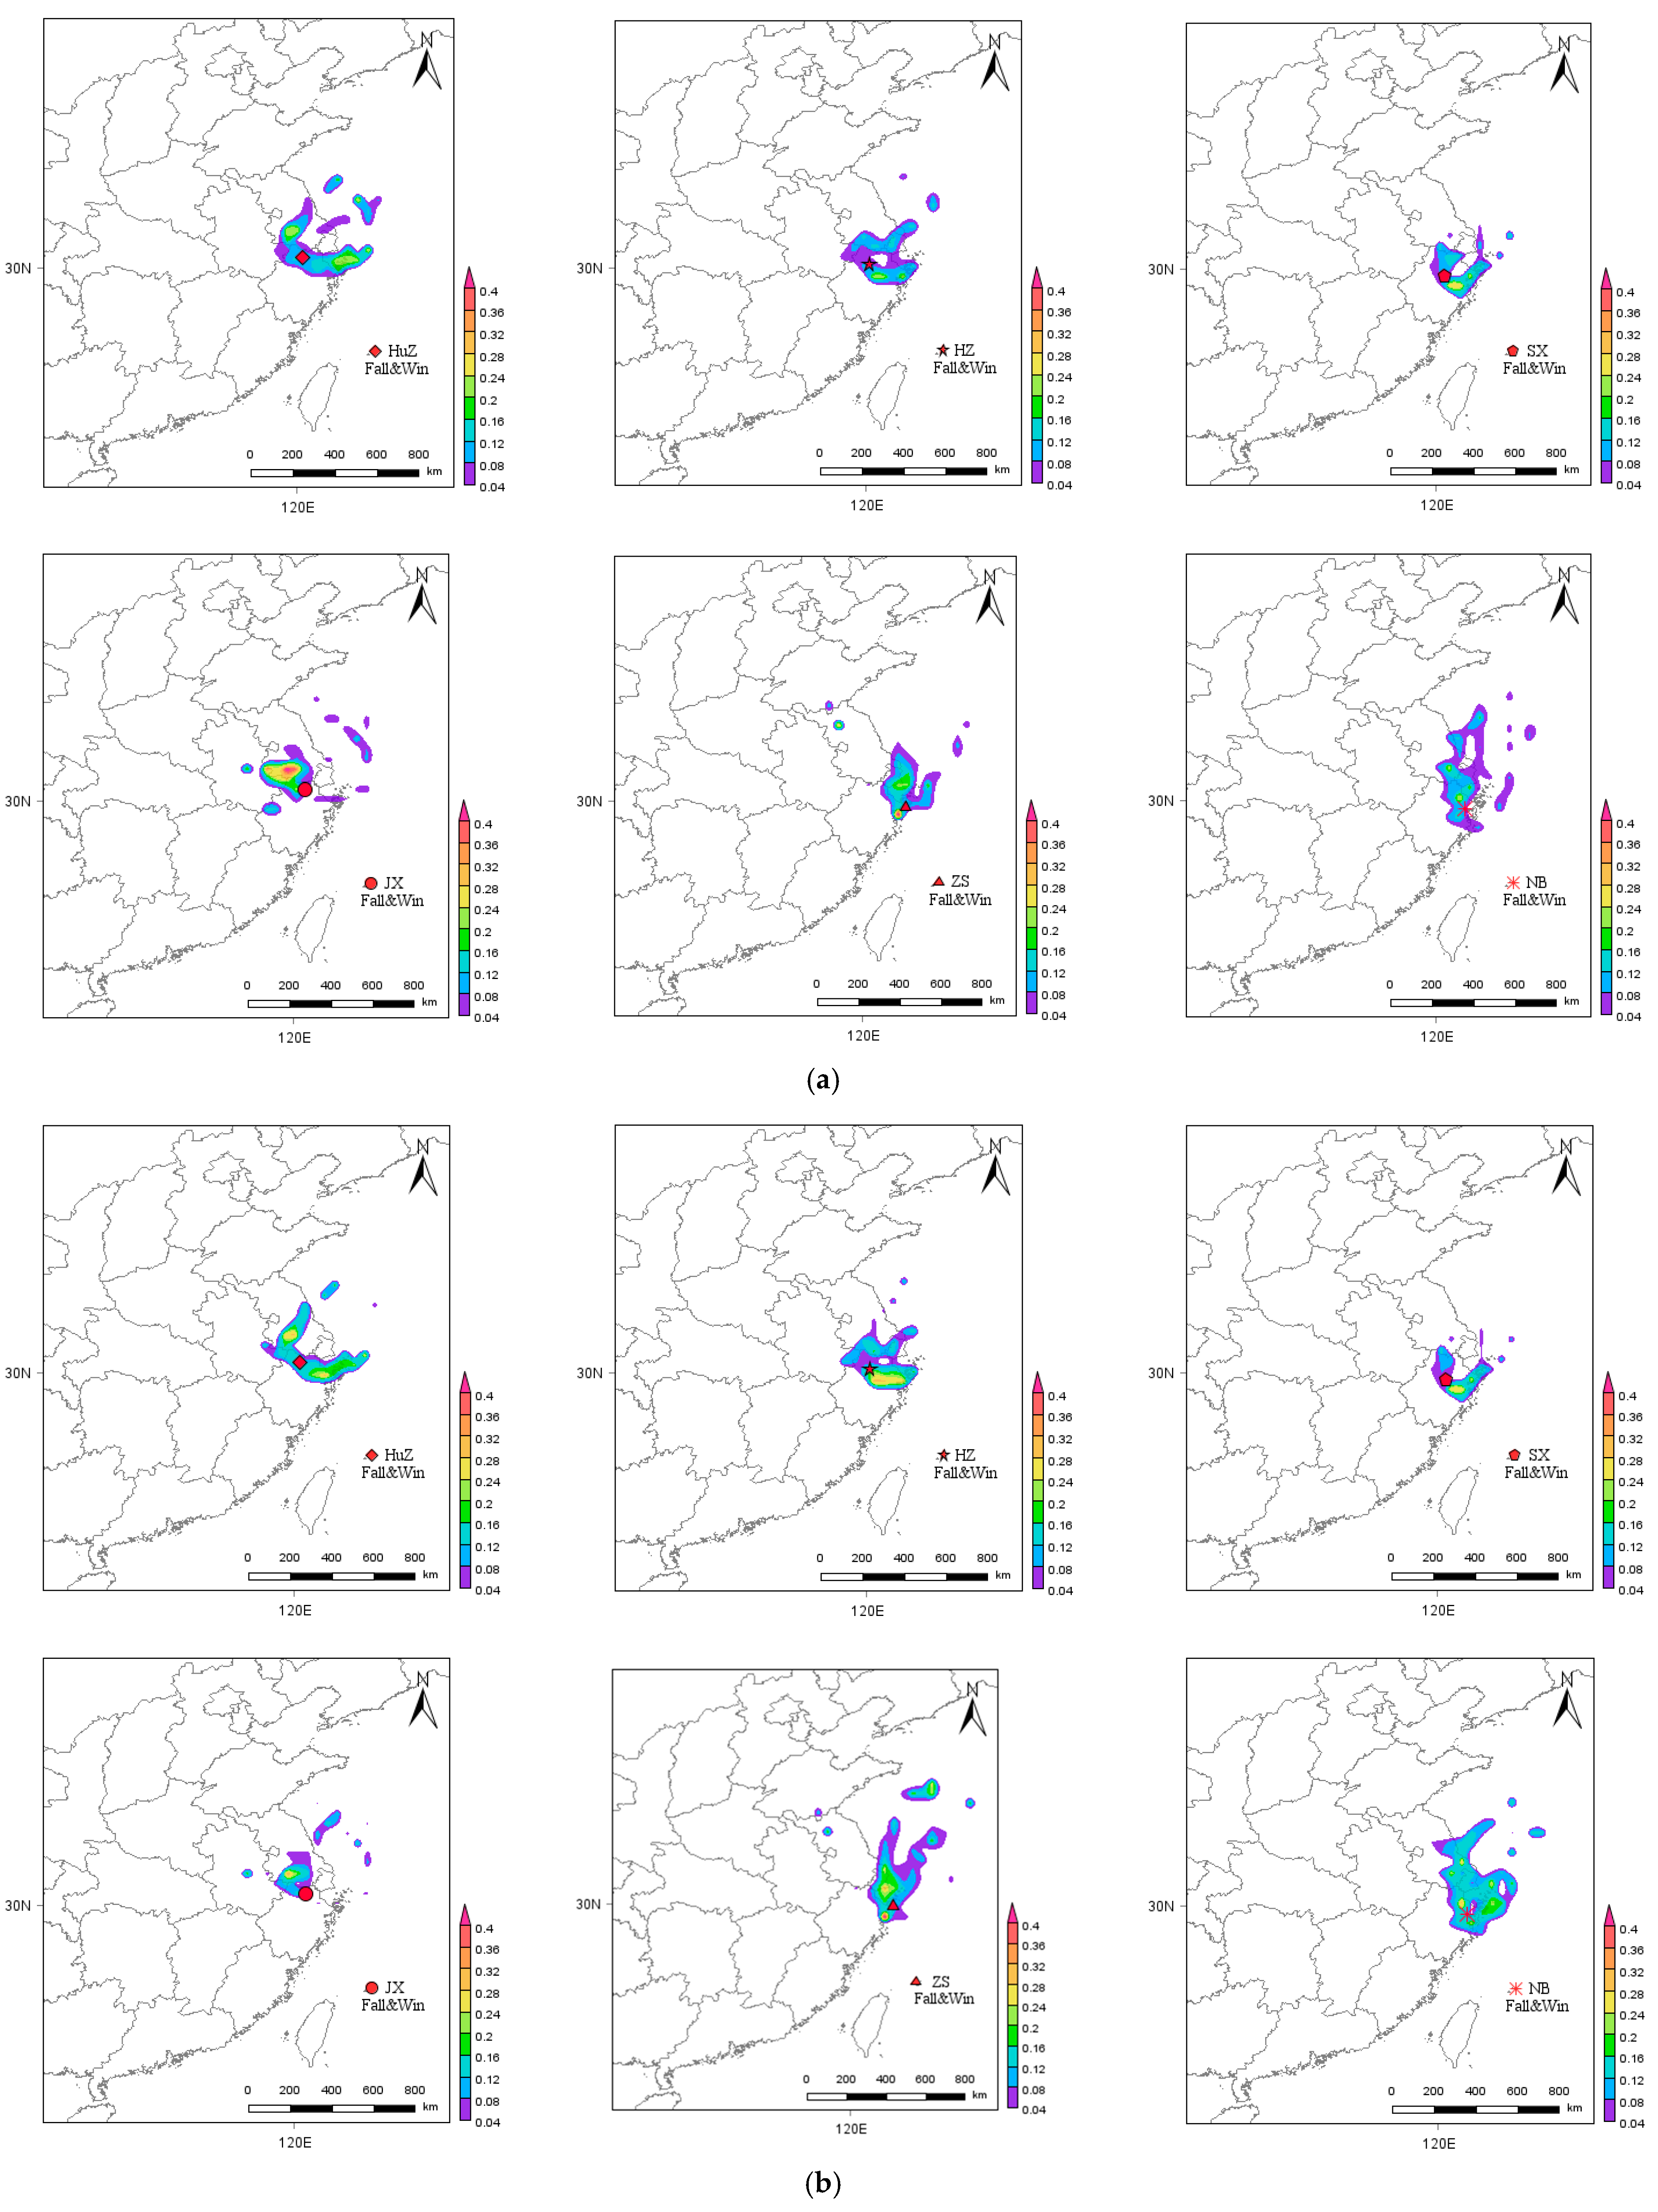
3.6. Impact of Regional Transport
4. Conclusions
Author Contributions
Funding
Institutional Review Board Statement
Informed Consent Statement
Data Availability Statement
Conflicts of Interest
Abbreviations
| HuZ | Huzhou |
| HZ | Hangzhou |
| SX | Shaoxing |
| JX | Jiaxing |
| NB | Ningbo |
| ZS | Zhoushan |
| AOC | Atmospheric Oxidation Capacity |
| ADC | Atmospheric Diffusion Capacity |
| AGL | Above Ground Level |
| PPM | Primary Particulate Matter |
| SOR | Sulfur Oxidation Rate |
| NOR | Nitrogen Oxidation Rate |
| PSCF | Potential Source Contribution Function |
| WPSCF | High-weighted Potential Source Contribution Function |
| NAAQS | National Ambient Air Quality Standards |
References
- Cohen, A.J.; Brauer, M.; Burnett, R.; Anderson, H.R.; Frostad, J.; Estep, K.; Balakrishnan, K.; Brunekreef, B.; Dandona, L.; Dandona, R.; et al. Estimates and 25-year trends of the global burden of disease attributable to ambient air pollution: An analysis of data from the Global Burden of Diseases Study 2015. Lancet 2017, 389, 1907–1918. [Google Scholar] [CrossRef]
- Hang, Y.; Meng, X.; Li, T.T.; Wang, T.J.; Cao, J.J.; Fu, Q.Y.; Dey, S.; Li, S.; Huang, K.; Liang, F.; et al. Assessment of long-term particulate nitrate air pollution and its health risk in China. iScience 2022, 25, 104899. [Google Scholar] [CrossRef] [PubMed]
- Chen, C.; Dubovik, O.; Schuster, G.L.; Chin, M.; Henze, D.K.; Lapyonok, T.; Li, Z.Q.; Derimian, Y.; Zhang, Y. Multi-angular polarimetric remote sensing to pinpoint global aerosol absorption and direct radiative forcing. Nat. Commun. 2022, 13, 7459. [Google Scholar] [CrossRef] [PubMed]
- Shang, D.; Peng, J.; Guo, S.; Wu, Z.; Hu, M. Secondary aerosol formation in winter haze over the Beijing-Tianjin-Hebei Region, China. Front. Environ. Sci. Eng. 2021, 15, 1–3. [Google Scholar] [CrossRef]
- Xie, Y.J.; Lu, H.B.; Yi, A.J.; Zhang, Z.Y.; Zheng, N.J.; Fang, X.Z.; Xiao, H. Characterization and source analysis of water-soluble ions in PM2.5 at a background site in Central China. Atmos. Res. 2020, 239, 104881. [Google Scholar] [CrossRef]
- Geng, G.N.; Xiao, Q.Y.; Zheng, Y.X.; Tong, D.; Zhang, Y.X.; Zhang, X.Y.; Zhang, Q.; He, K.B.; Liu, Y. Impact of China’s Air pollution Prevention and Control Action Plan on PM2.5 chemical composition over eastern China. Sci. China Earth Sci. 2019, 62, 1872–1884. (In Chinese) [Google Scholar] [CrossRef]
- Ding, A.J.; Huang, X.; Nie, W.; Chi, X.G.; Xu, Z.; Zheng, L.F.; Xu, Z.N.; Xie, Y.N.; Qi, X.M.; Shen, Y.C.; et al. Significant reduction of PM2.5 in eastern China due to regional-scale emission control: Evidences from the SORPES station, 2011–2018. Atmos. Chem. Phys. 2019, 19, 11791–11801. [Google Scholar] [CrossRef]
- Seinfeld, J.H.; Pandis, S.N. Atmospheric Chemistry and Physics: From Air Pollution to Climate Change, 2nd ed.; John Wiley & Sons, Inc.: New York, NY, USA, 2006. [Google Scholar]
- Adams, P.J.; Seinfeld, J.H.; Koch, D.; Mickley, L.; Jacob, D. General circulation model assessment of direct radiative forcing by the sulfate-nitrate-ammonium-water inorganic aerosol system. J. Geophys. Res. Atmos. 2001, 106, 1097–1111. [Google Scholar] [CrossRef]
- Yan, F.H.; Chen, W.H.; Jia, S.G.; Zhong, B.Q.; Yang, L.M.; Mao, J.Y.; Chang, M.; Shao, M.; Yuan, B.; Situ, S.P.; et al. Stabilization for the secondary species contribution to PM2.5 in the Pearl River Delta (PRD) over the past decade, China: A meta-analysis. Atmos. Environ. 2020, 242, 117817. [Google Scholar] [CrossRef]
- Wang, J.Q.; Gao, J.; Che, F.; Wang, Y.L.; Lin, P.C.; Zhang, Y.C. Decade-long trends in chemical component properties of PM2.5 in Beijing, China (2011–2020). Sci. Total Environ. 2022, 832, 154664. [Google Scholar] [CrossRef]
- Lei, L.; Zhou, W.; Chen, C.; He, Y.; Li, Z.J.; Sun, J.X.; Tang, X.; Fu, P.Q.; Wang, Z.F.; Sun, Y.L. Long-term characterization of aerosol chemistry in cold season from 2013 to 2020 in Beijing, China. Environ. Pollut. 2021, 268, 115952. [Google Scholar] [CrossRef]
- Wang, Y.S.; Li, W.J.; Gao, W.L.; Liu, Z.R.; Tian, S.L.; Shen, R.R.; Ji, D.S.; Wang, S.A.; Wang, L.L.; Tang, G.; et al. Trends in particulate matter and its chemical compositions in China from 2013–2017. Sci. China Earth Sci. 2019, 62, 1857–1871. [Google Scholar] [CrossRef]
- Zhou, M.; Nie, W.; Qiao, L.P.; Huang, D.D.; Zhu, S.H.; Lou, S.R.; Wang, H.L.; Wang, Q.; Tao, S.K.; Sun, P.; et al. Elevated Formation of Particulate Nitrate from N2O5 Hydrolysis in the Yangtze River Delta Region From 2011 to 2019. Geophys. Res. Lett. 2022, 49, e2021GL097393. [Google Scholar] [CrossRef]
- Jiang, J.H.; Peng, X.; Zhu, B.; Huang, X.F.; He, L.Y. Long-term variational characteristics of the chemical composition of PM2.5 in Shenzhen. Environ. Sci. 2021, 41, 574–579. (In Chinese) [Google Scholar]
- Zhao, Y.; Zhang, Y.L.; Sun, R.X. The mass-independent oxygen isotopic composition in sulfate aerosol —A useful tool to identify sulfate formation: A review. Atmos. Res. 2021, 253, 105447. [Google Scholar] [CrossRef]
- Xie, X.D.; Hu, J.L.; Qin, M.M.; Guo, S.; Hu, M.; Wang, H.L.; Lou, S.; Li, J.; Sun, J.; Li, X.; et al. Modeling particulate nitrate in China: Current findings and future directions. Environ. Int. 2022, 166, 107369. [Google Scholar] [CrossRef]
- Liu, T.Y.; Clegg, S.L.; Abbatt, J.P.D. Fast oxidation of sulfur dioxide by hydrogen peroxide in deliquesced aerosol particles. Proc. Natl. Acad. Sci. USA 2020, 117, 1354–1359. [Google Scholar] [CrossRef]
- Wang, J.F.; Li, J.Y.; Ye, J.H.; Zhao, J.; Wu, Y.Z.; Hu, J.L.; Liu, D.; Nie, D.; Shen, F.; Huang, X.; et al. Fast sulfate formation from oxidation of SO2 by NO2 and HONO observed in Beijing haze. Nat. Commun. 2020, 11, 2844. [Google Scholar] [CrossRef] [PubMed]
- Liu, T.Y.; Abbatt, J.P.D. Oxidation of sulfur dioxide by nitrogen dioxide accelerated at the interface of deliquesced aerosol particles. Nat. Chem. 2021, 13, 1173–1177. [Google Scholar] [CrossRef] [PubMed]
- Wang, W.G.; Liu, M.Y.; Wang, T.T.; Song, Y.; Zhou, L.; Cao, J.J.; Hu, J.; Tang, G.; Chen, Z.; Li, Z.; et al. Sulfate formation is dominated by manganese-catalyzed oxidation of SO2 on aerosol surfaces during haze events. Nat. Commun. 2021, 12, 1993. [Google Scholar] [CrossRef] [PubMed]
- Zhai, S.X.; Jacob, D.J.; Wang, X.; Liu, Z.R.; Wen, T.X.; Shah, V.; Li, K.; Moch, J.M.; Bates, K.H.; Song, S.; et al. Control of particulate nitrate air pollution in China. Nat. Geosci. 2021, 14, 389–395. [Google Scholar] [CrossRef]
- Fu, X.; Wang, T.; Gao, J.; Wang, P.; Liu, Y.M.; Wang, S.X.; Zhao, B.; Xue, L. Persistent Heavy Winter Nitrate Pollution Driven by Increased Photochemical Oxidants in Northern China. Environ. Sci. Technol. 2020, 54, 3881–3889. [Google Scholar] [CrossRef]
- Li, S.Z.; Zhang, F.; Jin, X.A.; Sun, Y.L.; Wu, H.; Xie, C.H.; Chen, L.; Liu, J.; Wu, T.; Jiang, S.; et al. Characterizing the ratio of nitrate to sulfate in ambient fine particles of urban Beijing during 2018–2019. Atmos. Environ. 2020, 237, 117662. [Google Scholar] [CrossRef]
- HJ664-2013. Technical Regulation for Selection of Ambient Air Quality Monitoring Stations (on Trial). Available online: https://www.chinesestandard.net/PDF/English.aspx/HJ664-2013 (accessed on 17 October 2023).
- Zhang, Y.H. Spatial-Temporal Characteristics of PM2.5 Regional Pollution in Yangtze River Delta Region. Res. Environ. Sci. 2022, 35, 1–10. (In Chinese) [Google Scholar]
- China National Environmental Monitoring Center. Technical Specification for Quality Assurance and Quality Control for Manual Monitoring of Atmospheric Particulate Matter Components, 1st ed.; Official Letter from the China National Environmental Monitoring Center [2019] No. 425; China National Environmental Monitoring Center: Beijing, China, 2019. [Google Scholar]
- HJ799-2016. Ambient Air-Determination of the Water Soluble Anions (F−, Cl−, Br−, NO2−, NO3−, PO43−, SO32−, SO42−) from Atmospheric Particles-Ion Chromatography. Available online: https://english.mee.gov.cn/Resources/standards/Air_Environment/air_method/201605/t20160530_352373.shtml (accessed on 17 October 2023).
- HJ800-2016. Ambient Air-Determination of the Water Soluble Cations (Li+, Na+, NH4+, K+, Ca2+, Mg2+) from Atmospheric Particles-Ion Chromatography. Available online: https://english.mee.gov.cn/Resources/standards/Air_Environment/air_method/201605/t20160530_352374.shtml (accessed on 17 October 2023).
- Lin, J.J. Characterization of water-soluble ion species in urban ambient particles. Environ. Int. 2002, 28, 55–61. [Google Scholar] [CrossRef] [PubMed]
- Song, C.H.; Kim, C.M.; Lee, Y.J.; Carmichael, G.R.; Lee, B.K.; Lee, D.S. An evaluation of reaction probabilities of sulfate and nitrate precursors onto East Asian dust particles. J. Geophys. Res. Atmos. 2007, 112. [Google Scholar] [CrossRef]
- Sirois, A.; Bottenheim, J.W. Use of backward trajectories to interpret the 5-year record of pan and O3 ambient air concentrations at Kejimkujik National Park, Nova Scotia. J. Geophys. Res. Atmos. 1995, 100, 2867–2881. [Google Scholar] [CrossRef]
- Wang, Y.Q.; Zhang, X.Y.; Draxler, R.R. TrajStat: GIS-based software that uses various trajectory statistical analysis methods to identify potential sources from long-term air pollution measurement data. Environ. Model. Softw. 2009, 24, 938–939. [Google Scholar] [CrossRef]
- An, J.Y.; Huang, Y.W.; Huang, C.; Wang, X.; Yan, R.S.; Wang, Q.; Wang, H.L.; Jing, S.G.; Zhang, Y.; Liu, Y.M.; et al. Emission inventory of air pollutants and chemical speciation for specific anthropogenic sources based on local measurements in the Yangtze River Delta region, China. Atmos. Chem. Phys. 2021, 21, 2003–2025. [Google Scholar] [CrossRef]
- Feng, S.Z.; Jiang, F.; Wang, H.M.; Shen, Y.; Zheng, Y.H.; Zhang, L.Y.; Lou, C.X.; Ju, W.M. Anthropogenic emissions estimated using surface observations and their impacts on PM2.5 source apportionment over the Yangtze River Delta, China. Sci. Total Environ. 2022, 828, 154522. [Google Scholar] [CrossRef]
- Kennish, M.J. Practical Handbook of Marine Science; CPC Press: Boca Raton, FL, USA, 1994. [Google Scholar]
- Arimoto, R.; Duce, R.A.; Savoie, D.L.; Prospero, J.M.; Talbot, R.; Cullen, J.D.; Tomza, U.; Lewis, N.F.; Ray, B.J. Relationships among aerosol constituents from Asia and the North Pacific during PEM-West A. J. Geophys. Res. Atmos. 1996, 101, 2011–2023. [Google Scholar] [CrossRef]
- Yao, X.H.; Chan, C.K.; Fang, M.; Cadle, S.; Chan, T.; Mulawa, P.; He, K.B.; Ye, B.M. The water-soluble ionic composition of PM2.5 in Shanghai and Beijing, China. Atmos. Environ. 2002, 36, 4223–4234. [Google Scholar] [CrossRef]
- Ningbo Municipal Statistics Bureau. Industry, Energy Consumption and Electricity. Ningbo Statistical Yearbook; China Statistics Press: Beijing, China, 2020; pp. 164–218.
- Jiaxing Municipal Statistics Bureau. Urban Construction, Environment, Energy and Resources Utilization. Jiaxing Statistical Yearbook; China Statistics Press: Beijing, China, 2020; p. 212.
- Shaoxing Municipal Statistics Bureau. Industry. Shaoxing Statistical Yearbook; China Statistics Press: Beijing, China, 2020; p. 176.
- Hangzhou Municipal Statistics Bureau. Industry and Energy. Hangzhou Statistical Yearbook; China Statistics Press: Beijing, China, 2020; p. 211.
- Huzhou Municipal Statistics Bureau. Industry, Energy and Water. Huzhou Statistical Yearbook; China Statistics Press: Beijing, China, 2020; p. 115.
- Zhoushan Municipal Statistics Bureau. Industry and Energy. Zhoushan Statistical Yearbook; China Statistics Press: Beijing, China, 2020; p. 130.
- Hangzhou Municipal Statistics Bureau. Transportation, Post and Telecommunications. Hangzhou Statistical Yearbook; China Statistics Press: Beijing, China, 2020.
- Ningbo Municipal Statistics Bureau. Port, Transportation, Post and Telecommunications. Ningbo Statistical Yearbook; China Statistics Press: Beijing, China, 2020; pp. 262–275.
- Shaoxing Municipal Statistics Bureau. Transportation, Post and Telecommunications and Electricity. Shaoxing Statistical Yearbook; China Statistics Press: Beijing, China, 2020; p. 194.
- Jiaxing Municipal Statistics Bureau. Transport, Post and Telecommunication Sevices. Jiaxing Statistical Yearbook; China Statistics Press: Beijing, China, 2020; pp. 400–403.
- Huzhou Municipal Statistics Bureau. Transportation, Post and Telecommunications. Huzhou Statistical Yearbook; China Statistics Press: Beijing, China, 2020; p. 129.
- Zhoushan Municipal Statistics Bureau. Transportation, Post and Telecommunications. Zhoushan Statistical Yearbook; China Statistics Press: Beijing, China, 2020; p. 147.
- Su, J.; Zhao, P.S.; Ding, J.; Du, X.; Dou, Y.J. Insights into measurements of water-soluble ions in PM2.5 and their gaseous precursors in Beijing. J. Environ. Sci. 2021, 102, 123–137. [Google Scholar] [CrossRef] [PubMed]
- Xu, W.; Zhao, Y.H.; Wen, Z.; Chang, Y.H.; Pan, Y.P.; Sun, Y.L.; Ma, X.; Sha, Z.P.; Li, Z.Y.; Kang, J.H.; et al. Increasing importance of ammonia emission abatement in PM2.5 pollution control. Sci. Bull. 2022, 67, 1745–1749. [Google Scholar] [CrossRef]
- Gu, B.J.; Zhang, L.; Van Dingenen, R.; Vieno, M.; Van Grinsven, H.J.M.; Zhang, X.M.; Zhang, S.H.; Chen, Y.F.; Wang, S.T.; Ren, C.C.; et al. Abating ammonia is more cost-effective than nitrogen oxides for mitigating PM2.5 air pollution. Science 2021, 374, 758–762. [Google Scholar] [CrossRef] [PubMed]
- Baek, B.H.; Aneja, V.P. Measurement and analysis of the relationship between ammonia, acid gases, and fine particles in eastern North Carolina. J. Air. Waste Manag. 2004, 54, 623–633. [Google Scholar] [CrossRef]
- Ye, X.N.; Tao, Y.; Liu, Y.X.; Wang, R.Y.; Li, Q.; Yang, X.; Chen, J.M. Size-fractionated water-soluble ions during autumn and winter: Insights into volatile ammonium formation mechanisms in Shanghai, a megacity of China. Atmos. Environ. 2019, 2, 100011. [Google Scholar] [CrossRef]
- Zhang, Z.; Qiao, L.P.; Zhou, M.; Zhu, S.H.; Guo, H.Q.; Wang, H.L.; Lou, S.R.; Tao, S.K.; Chen, C.H. Audit Indicators and Suggested Ranges for Data Validation of Chemical Components in Ambient PM2.5: A Case Study of the Yangtze River Delta. Environ. Sci. 2023, 41, 4786–4802. (In Chinese) [Google Scholar]
- Wei, J.; Li, Z.Q.; Wang, J.; Li, C.; Gupta, P.; Cribb, M. Ground-level gaseous pollutants (NO2, SO2, and CO) in China: Daily seamless mapping and spatiotemporal variations. Atmos. Chem. Phys. 2023, 23, 1511–1532. [Google Scholar] [CrossRef]
- Song, C.B.; Liu, B.W.; Cheng, K.; Cole, M.A.; Dai, Q.L.; Elliott, R.J.R.; Shi, Z.B. Attribution of Air Quality Benefits to Clean Winter Heating Polices in China: Combining Machine Learning with Causal Inference. Environ. Sci. Technol. 2023, 57, 17707–17717. [Google Scholar]
- Shan, Y.L.; Peng, Y.; Chu, B.W.; Shan, W.P.; Xu, G.Y.; Chen, J.J.; Yu, Y.B.; Li, J.H.; He, H. Control Status and Emission Reduction Strategies of Nitrogen Oxides in Key Industries in China. Res. Environ. Sci. 2023, 36, 431–438. (In Chinese) [Google Scholar]


| Sites | Longitude | Latitude | Observation Stations and Surrounding Environment | Terrain Features and Climate Characteristics |
|---|---|---|---|---|
| HuZ | 120°05′17.40″ | 30°53′24.86″ | On the roof of the Science and Technology Museum of Huzhou, ~16 m above ground level (AGL) and surrounded by commercial, traffic, and residential activities. | Inland city, affected by the East Asian monsoon, with northwesterly winds prevailing in winter and southeasterly winds prevailing in summer |
| HZ | 120°11′54.91″ | 30°11′15.05″ | On the roof of a building at Huapu Park, ~15 m AGL and surrounded by commercial, traffic, and residential activities. | Inland city, with urban area surrounded by hills except on the northeast side and affected by the East Asian monsoon, with northwesterly winds prevailing in winter and southeasterly winds prevailing in summer |
| SX | 120°33′17.18″ | 29°59′40.12″ | On the roof of an office building in central urban area, ~20 m AGL and surrounded by commercial, traffic, and residential activities. | Inland city, with urban area surrounded by hills except on the northeast side and affected by the East Asian monsoon, with northwesterly winds prevailing in winter and southeasterly winds prevailing in summer |
| JX | 120°47′21.91″ | 30°45′04.87″ | On the roof of an office building in central urban area, ~14 m AGL and surrounded by commercial, traffic, and residential activities. | Coastal city, affected by the East Asian monsoon, with northerly winds prevailing in winter and southeasterly winds prevailing in summer |
| NB | 121°31′42.52″ | 29°51′53.94″ | On the roof of an office building in central urban area, ~16 m AGL and surrounded by commercial, traffic, and residential activities. | Coastal city, affected by the East Asian monsoon with northerly winds prevailing in winter and southeasterly winds prevailing in summer |
| ZS | 122°12′33.64″ | 29°58′36.45″ | On the roof of an office building in central urban area, ~20 m AGL and surrounded by commercial, traffic, and residential activities. | Island city, affected by the East Asian monsoon, with northerly winds prevailing in winter and southerly winds prevailing in summer |
| Season | Sites | PM2.5 (μg/m3) | SO2 (μg/m3) | NO2 (μg/m3) | O3 (μg/m3) | NO3− (μg/m3) | SO42− (μg/m3) | NH4+ (μg/m3) | NO3−/SO42− | WS (m/s) | RH (%) | T (°C) |
|---|---|---|---|---|---|---|---|---|---|---|---|---|
| autumn and winter | HuZ | 37 | 7 | 50 | 42 | 13.94 | 7.58 | 6.38 | 1.85 | 2.0 | 77 | 11 |
| HZ | 47 | 6 | 42 | 27 | 14.36 | 6.65 | 6.10 | 2.17 | 2.1 | 74 | 12 | |
| SX | 41 | 8 | 51 | 33 | 14.06 | 6.95 | 6.33 | 2.04 | 1.3 | 76 | 12 | |
| JX | 40 | 9 | 51 | 43 | 15.64 | 6.84 | 6.54 | 2.27 | 2.1 | 79 | 12 | |
| NB | 30 | 10 | 49 | 40 | 9.97 | 6.44 | 5.10 | 1.54 | 2.4 | 79 | 12 | |
| ZS | 18 | 7 | 22 | 68 | 3.93 | 4.86 | 2.95 | 0.81 | 3.7 | 76 | 14 | |
| summer | HuZ | 17 | 3 | 22 | 67 | 2.64 | 4.14 | 2.29 | 0.64 | 2.0 | 81 | 28 |
| HZ | 16 | 4 | 16 | 46 | 1.23 | 3.06 | 1.81 | 0.40 | 2.0 | 78 | 28 | |
| SX | 20 | 4 | 24 | 65 | 1.41 | 2.97 | 1.83 | 0.47 | 1.6 | 77 | 29 | |
| JX | 20 | 6 | 25 | 68 | 2.45 | 3.24 | 2.15 | 0.76 | 2.1 | 84 | 28 | |
| NB | 15 | 6 | 23 | 58 | 1.70 | 3.36 | 1.75 | 0.51 | 2.0 | 85 | 28 | |
| ZS | 12 | 3 | 16 | 64 | 1.48 | 2.22 | 1.41 | 0.66 | 3.0 | 88 | 26 |
| Species | Sites | HuZ | HZ | SX | JX | NB |
|---|---|---|---|---|---|---|
| NO3− in autumn and winter | HZ | 0.87 ** | ||||
| SX | 0.62 ** | 0.63 ** | ||||
| JX | 0.66 ** | 0.54 ** | 0.2 | |||
| NB | 0.69 ** | 0.84 ** | 0.59 ** | 0.52 * | ||
| ZS | 0.62 ** | 0.51* | 0.39 | 0.64 ** | 0.54 * | |
| SO42− in autumn and winter | HZ | 0.82 ** | ||||
| SX | 0.74 ** | 0.86 ** | ||||
| JX | 0.50 * | 0.52 ** | 0.50 ** | |||
| NB | 0.67 ** | 0.59 ** | 0.62 ** | 0.52 ** | ||
| ZS | 0.58 ** | 0.63 ** | 0.45 ** | 0.47 * | 0.74 ** | |
| NO3− in summer | HZ | 0.44 * | ||||
| SX | 0.58 ** | 0.52* | ||||
| JX | 0.49 ** | 0.39 | 0.48 * | |||
| NB | 0.4 * | 0.27 | 0.57 ** | 0.51 ** | ||
| ZS | 0.21 | −0.06 | 0.53 ** | 0.29 | 0.52 ** | |
| SO42− in summer | HZ | 0.46 * | ||||
| SX | 0.49 ** | 0.45 * | ||||
| JX | 0.45 * | 0.44 * | 0.56 ** | |||
| NB | 0.53 ** | 0.64 ** | 0.72 ** | 0.5 ** | ||
| ZS | 0.56 ** | 0.29 | 0.34 | 0.26 | 0.46 * |
Disclaimer/Publisher’s Note: The statements, opinions and data contained in all publications are solely those of the individual author(s) and contributor(s) and not of MDPI and/or the editor(s). MDPI and/or the editor(s) disclaim responsibility for any injury to people or property resulting from any ideas, methods, instructions or products referred to in the content. |
© 2023 by the authors. Licensee MDPI, Basel, Switzerland. This article is an open access article distributed under the terms and conditions of the Creative Commons Attribution (CC BY) license (https://creativecommons.org/licenses/by/4.0/).
Share and Cite
Wang, Q.; Ding, H.; Yu, F.; Chao, N.; Li, Y.; Jiang, Q.; Huang, Y.; Duan, L.; Ji, Z.; Zhou, R.; et al. The Characteristics and Impact Factors of Sulfate and Nitrate in Urban PM2.5 over Typical Cities of Hangzhou Bay Area, China. Atmosphere 2023, 14, 1799. https://doi.org/10.3390/atmos14121799
Wang Q, Ding H, Yu F, Chao N, Li Y, Jiang Q, Huang Y, Duan L, Ji Z, Zhou R, et al. The Characteristics and Impact Factors of Sulfate and Nitrate in Urban PM2.5 over Typical Cities of Hangzhou Bay Area, China. Atmosphere. 2023; 14(12):1799. https://doi.org/10.3390/atmos14121799
Chicago/Turabian StyleWang, Qiongzhen, Hao Ding, Fuwei Yu, Na Chao, Ying Li, Qiqing Jiang, Yue Huang, Lian Duan, Zhengquan Ji, Rong Zhou, and et al. 2023. "The Characteristics and Impact Factors of Sulfate and Nitrate in Urban PM2.5 over Typical Cities of Hangzhou Bay Area, China" Atmosphere 14, no. 12: 1799. https://doi.org/10.3390/atmos14121799
APA StyleWang, Q., Ding, H., Yu, F., Chao, N., Li, Y., Jiang, Q., Huang, Y., Duan, L., Ji, Z., Zhou, R., Yang, Z., Zheng, K., & Miao, X. (2023). The Characteristics and Impact Factors of Sulfate and Nitrate in Urban PM2.5 over Typical Cities of Hangzhou Bay Area, China. Atmosphere, 14(12), 1799. https://doi.org/10.3390/atmos14121799