Article

Analysis of the Trend Characteristics of Air Pollutants in the Fenwei Plain Based on the KZ Filter

1
College of Geography and Environmental Sciences, Northwest Normal University, Lanzhou 730070, China
2
The Key Laboratory of Resource Environment and Sustainable Development of Oasis, Lanzhou 730070, China
3
Faculty of Atmospheric Remote Sensing, Shaanxi Normal University, Xi’an 710062, China
*
Author to whom correspondence should be addressed.
Atmosphere 2023, 14(12), 1785; https://doi.org/10.3390/atmos14121785
Submission received: 29 October 2023 / Revised: 17 November 2023 / Accepted: 29 November 2023 / Published: 3 December 2023
(This article belongs to the Section Air Quality)

Abstract

:
In order to improve air quality, China has implemented a series of the most stringent control measures ever in recent years. Quantitatively analyzing the contribution of emissions to the trend change in air pollutants is an essential scientific basis for verifying the effectiveness of air pollution control. We based our study on the air quality online monitoring data and meteorological element data of 11 cities in the Fenwei Plain from 2018 to 2022. We quantitatively investigated the changing patterns of NO2, O3, PM10, and PM2.5 and their influencing factors in the major cities of the Fenwei Plain by using the KZ filtering and MLR modeling analysis methods. The results show the following: (1) The long-term fractions of NO2, PM10, and PM2.5 in the Fenwei Plain decreased by 10.5, 33.1, and 17.1 μg·m−3, with decreases of 25.8%, 29%, and 28.8%, respectively, from 2018 to 2022. The long-term fractions of O3 showed the characteristics of decreasing and then increasing, with 2020 as the dividing line. (2) The short-term components of NO2, PM10, and PM2.5 contributed the most to the total variance, with the proportion of short-term components ranging from 34.7% to 69.8%, 53% to 73%, and 43% to 58%, respectively. The seasonal components of O3 contributed the most to the total variance, with the proportion of short-term components ranging from 54% to 70.7%. (3) Most cities in the Fenwei Plain had unfavorable meteorological conditions with regard to NO2, PM10, and PM2.5 in 2018–2020 and favorable meteorological conditions in terms of NO2, PM10, and PM2.5 in 2020–2022. O3 showed different characteristics from the other three pollutants. Most cities in the Fenwei Plain had meteorological conditions in 2018–2019 that were unfavorable for improving O3 levels. In 2019–2021, meteorological conditions were favorable for improving O3 levels, while in 2021–2022, meteorological conditions were unfavorable for improving O3 levels.

1. Introduction

Air pollution is caused by a combination of enormous emissions of various pollutants and meteorological conditions, with emissions being the leading cause of pollution [1]. Methods for distinguishing the contribution of meteorological conditions and abatement measures to changes in pollutant concentrations can generally be categorized into two approaches. One is based on source-emission inventories and atmospheric chemical transport models, and the other is based on the statistical analysis of observed data. In recent years, many scholars have found that emission reduction is the dominant factor in ameliorating particulate matter pollution in the atmosphere, based on atmospheric chemistry transport modeling and pollution-source emission inventory data [2,3]. One of the advantages of using atmospheric chemistry models to assess the contribution of emissions to atmospheric particulate pollution is the ability to characterize the spatial distribution and quantify the direct response of total air pollutant emissions to changes in air quality [4]. Methods for atmospheric chemical transport modeling are limited by the model performance, emission inventory uncertainties and lags, imperfect chemical mechanisms, and strong nonlinearity of the model [5]. These factors can introduce some uncertainty into the model results.
In recent years, many scholars have begun experimenting with methods based on mathematical statistics, which have the advantage of not requiring emission inventories as inputs or detailed information on the sources and formation mechanisms of pollutants [6]. When utilizing statistical analyses, statistical models of the changes in pollutant concentrations and the emissions from meteorological factors and sources are generally developed. Then, the contributions of meteorological conditions and emission factors to changes in pollutant concentrations are quantified according to these statistical models [7]. Zhai used multiple linear regression (MLR) modeling to quantify the effects of changes in meteorological conditions on PM2.5 trends in China during 2013–2018 [8]. Some scholars have explored the relationship between pollutant concentration trends and anthropogenic emissions and meteorological conditions in typical urban areas in China by combining Kolmogorov–Zurbenko (KZ) filtering and MLR modeling [9,10]. However, most of these studies have focused on the period before the 2020 epidemic, and there needs to be more understanding of the impact of emission reduction measures on air pollution in recent years. Moreover, previous studies have focused on particulate matter, and studies on other air pollutants such as O3 and NO2 are scarce.
The Fenwei Plain has become one of the most polluted areas in China due to its own basin topography and industrial structure [11]. The Ministry of Ecology and Environment proposed a Three-Year Action Plan to win the battle to defend blue skies in 2018. It included the Fenwei Plain as a critical monitoring area, but the exceedance of atmospheric pollutant concentrations still occurred. Since the outbreak of the COVID-19 epidemic, the socioeconomic life of the cities in the Fenwei Plain has been seriously affected, and the characteristics of atmospheric pollutants have shown new changes [12]. The Fenwei Plain is in a critical economic and strategic position in China, and an excellent ecological environment is crucial for the region’s development. In this paper, we based our study on the air quality online monitoring data and meteorological element data of 11 cities in the Fenwei Plain from 2018 to 2022. We quantitatively investigated the changing patterns of NO2, O3, PM10, and PM2.5 in significant cities of the Fenwei Plain, as well as their influencing factors (including anthropogenic discharge and meteorological condition elements), using KZ filtering and multiple linear regression. This will provide scientific evidence for understanding near-surface particulate matter pollution management in this region.

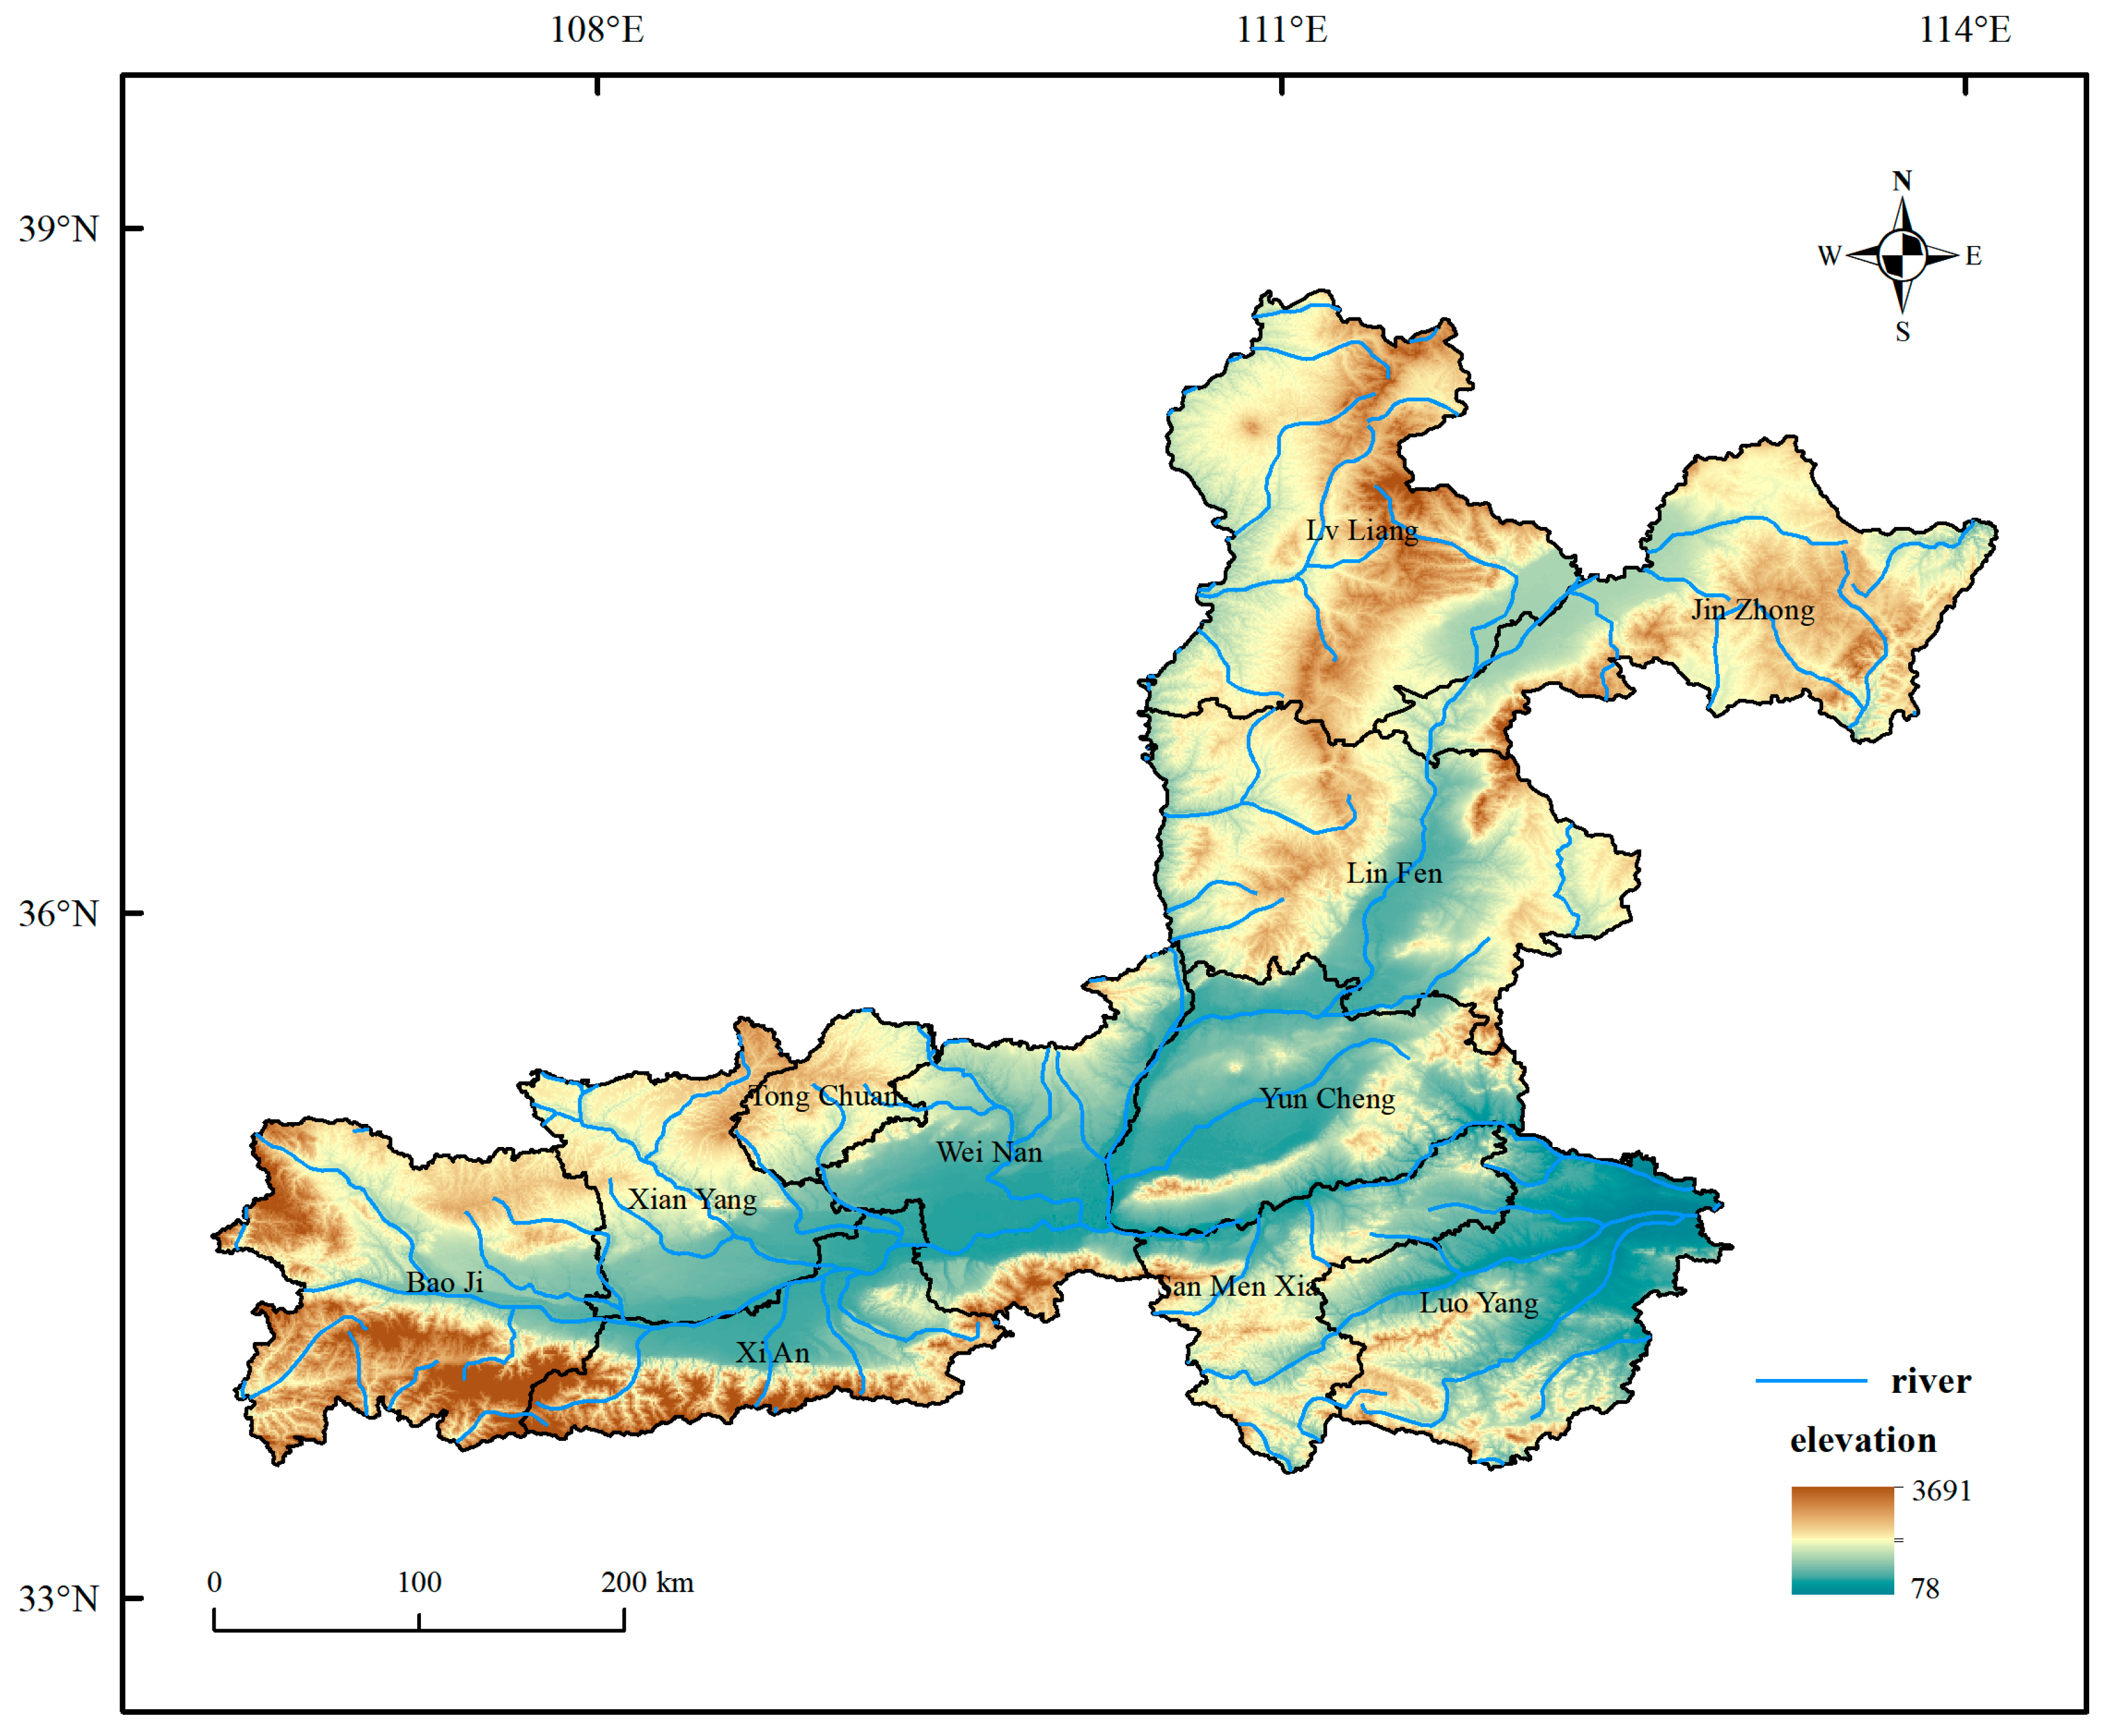
2. Overview of the Study Area

Fenwei Plain (Figure 1) is the general name for the Fen River Plain, Wei River Plain, and their terraces in the Yellow River Basin, including Lvliang (LL), Jinzhong (JZ), Linfen (LF), Yuncheng (YC), Baoji (BJ), Tongchuan (TC), Xianyang (XY), Weinan (WN), Sanmenxia (SMX), Luoyang (LY), and Xi’an (XA); a total of 11 cities. The topographic relief of the Fenwei Plain is generally low in the center and high in the surrounding area, consistent with the altitude distribution [13]. The Fenwei Plain is a vital energy and heavy-industry base in China, accounting for one-fifth of the national raw coal production and about one-tenth of the national coal consumption. It is also one of the critical regions for air pollution prevention and control in China.

3. Data Sources

The air pollutant concentration data are the hour-by-hour observations of NO2, O3, PM10, and PM2.5 concentrations in 11 cities. The data period is 1 January 2018–31 December 2022. There is more than one measurement point for each air pollutant. The measurements were taken as often as once an hour. They were averaged by some algorithm to obtain the hour-by-hour concentration data for each city and posted on the China General Environmental Monitoring Station (http://www.cnemc.cn/, accessed on 4 July 2023). There are 24 pieces of data for each day. For analysis purposes, we performed different operations for different metrics. The daily evaluation indexes for NO2, PM10, and PM2.5 are the mean concentration values of 24 h. The daily evaluation index for O3 is the daily maximum 8 h sliding average (O3MAD8).
Our research uses the ground meteorological data from the rp5 world historical weather data site (https://rp5.ru/docs/about/cn, accessed on 4 July 2023). Regarding the meteorological data, there is only one measurement point per city, which comes from a monitoring point closest to the city center. The frequency of measurements is once every three hours. These are 2:00, 5:00, 8:00, 11:00, 14:00, 17:00, and 20:00 daily. Many studies have used daily average meteorological data to analyze the effects of pollutants. For a five-year study scale, daily mean concentrations are a good representation of the effects of meteorological conditions on pollutants. Based on previous studies [14], we selected four meteorological indexes: air temperature, air pressure, wind speed, and relative humidity. The meteorological elements used in the study are the daily average temperature, daily average pressure, daily average relative humidity, and daily average wind speed of the city.

4. Research Methods

4.1. Kolmogorov–Zurbenko Filter

KZ filtering is a method based on time-series analysis. The original series can be better decomposed into short-term, seasonal, and long-term component series by setting different parameters. In KZ filtering, the original air pollutant time series can be represented by Equation (1) [15]:
X ( t ) = E ( t ) + S ( t ) + W ( t )
X(t) is the original time series. E(t), S(t), and W(t) are the long-term component, seasonal component, and short-term component, in that order. The long-term component is mainly influenced by factors such as the long-term trend of pollutant emissions and climate change [16]. The seasonal component arises from seasonal changes in meteorological conditions and energy consumption patterns [17]. The short-time alterations are residuals, mainly affected by the role of small-scale weather regimes and short-time alterations in external emissions [18]. KZ filtering belongs to low-pass filtering, generated by repeated iterations of the moving averages. The kza program package in the R software mainly implements the KZ filtering method:
Y i = 1 m j = k k X i + k
Y i is the filtered time series, and the computed Y i becomes the input for the second iteration and the iterated p times. X i is the original data. The sliding window length m = 2 k + 1. The parameter i is the interval of the time series, and j is the sliding window variable. kZ(m,p) means that the sliding window is m and has been iterated p times. Adjusting the window length, m, and the number of iterations, p, can control the filtering on different time scales. To filter periods of less than N days, the following criterion is applied to determine the filter’s effective width [19]:
m × p 1 2 N
The parameters m and p are the KZ filtering factors, which can realize different filtering function scales. Equation (3) indicates that high-frequency filters with wavelengths less than N can be filtered out. It has been shown that the sum of long-term and seasonal components of meteorological and air quality data can be extracted using KZ(15,5) filtering, defined as X b a s e l i n e ( t ) . X b a s e l i n e ( t ) is the baseline component that reflects the relatively stable trend of the original data [20,21]. The long-term trend of the data can be obtained by selecting a larger window, and the long-term pollutant component E(t) can be obtained by utilizing KZ(365,3) filtering [22,23]. The seasonal component S(t) is the difference between the baseline component X b a s e l i n e ( t ) and the long-term component E(t). The short-term component W(t) is the difference between the original series X(t) and the baseline component X b a s e l i n e ( t ) , as shown in Equations (4)–(7), where X b ( t ) = X b a s e l i n e ( t ) :
X b a s e l i n e ( t ) = E ( t ) + S ( t ) = K Z ( 15 , 5 )
E ( t ) = K Z ( 365 , 3 )
S ( t ) = X b ( t ) E ( t ) = K Z ( 15 , 5 ) K Z ( 365 , 3 )
W ( t ) = X ( t ) X b ( t ) = X ( t ) K Z ( 15 , 5 )

4.2. Multiple Linear Regression

Two main factors affect the fluctuation of the long-term pollutant components around the mean value: changes in pollutant emissions and changes in meteorological conditions. The effects of meteorological conditions can be more effectively eliminated by modeling the short-term component of the pollutant time series, W(t), and the baseline component, X b a s e l i n e ( t ) , with meteorological factors as independent variables [24,25]. The regression model is shown below:
W ( t ) = α 0 + α i ω i ( t ) + ε ω ( t )
X b ( t ) = b 0 + b j x j ( t ) + ε b ( t )
ε ( t ) = ε ω ( t ) + ε b ( t )
Equations (8) and (9) show the multiple regression models between short-term and baseline air pollutants and meteorological factors. W(t) and Xb(t) are the air pollutants’ short-term and baseline components. ωi(t) and xi(t) are the different short-term and baseline components of the i-th meteorological factor. Parameters a0 and b0 are the fitting parameters. εW(t) and εb(t) are the regression residuals of the short-term and baseline components. ε(t) denotes the total residual, which represents the change in the pollutant concentration influenced only by the emission after removing the effect of meteorological conditions. The multiple linear regression was mainly realized by the SPSS27.0 software. The SPSS27.0 software platform provides advanced statistical analysis, many machine-learning algorithms, and text analysis with open-source scalability, which can be integrated with big data and seamlessly deployed into applications.
Next, a KZ(365,3) filter was used on ε(t) to obtain εE(t). After removing the effect of meteorological variations, the reconstructed time series of air pollutants Eadj(t) is calculated as the sum of the mean of E(t) and εE(t), which can be referred to as meteorological adjustment since it is only affected by emissions and has no meteorological effect:
E a d j ( t ) = E ( t ) ¯ + ε E ( t )
The relative contribution of meteorological conditions to pollutants after KZ filtration can be calculated as:
P c o n t r i b = K o r g K K o r g × 100 %
where Pcontrib is the relative contribution of meteorological conditions to pollutant changes, Korg is the slope of the change in the original pollutant time series, and K is the slope of the change in the meteorologically adjusted pollutant time series.

5. Results and Discussion

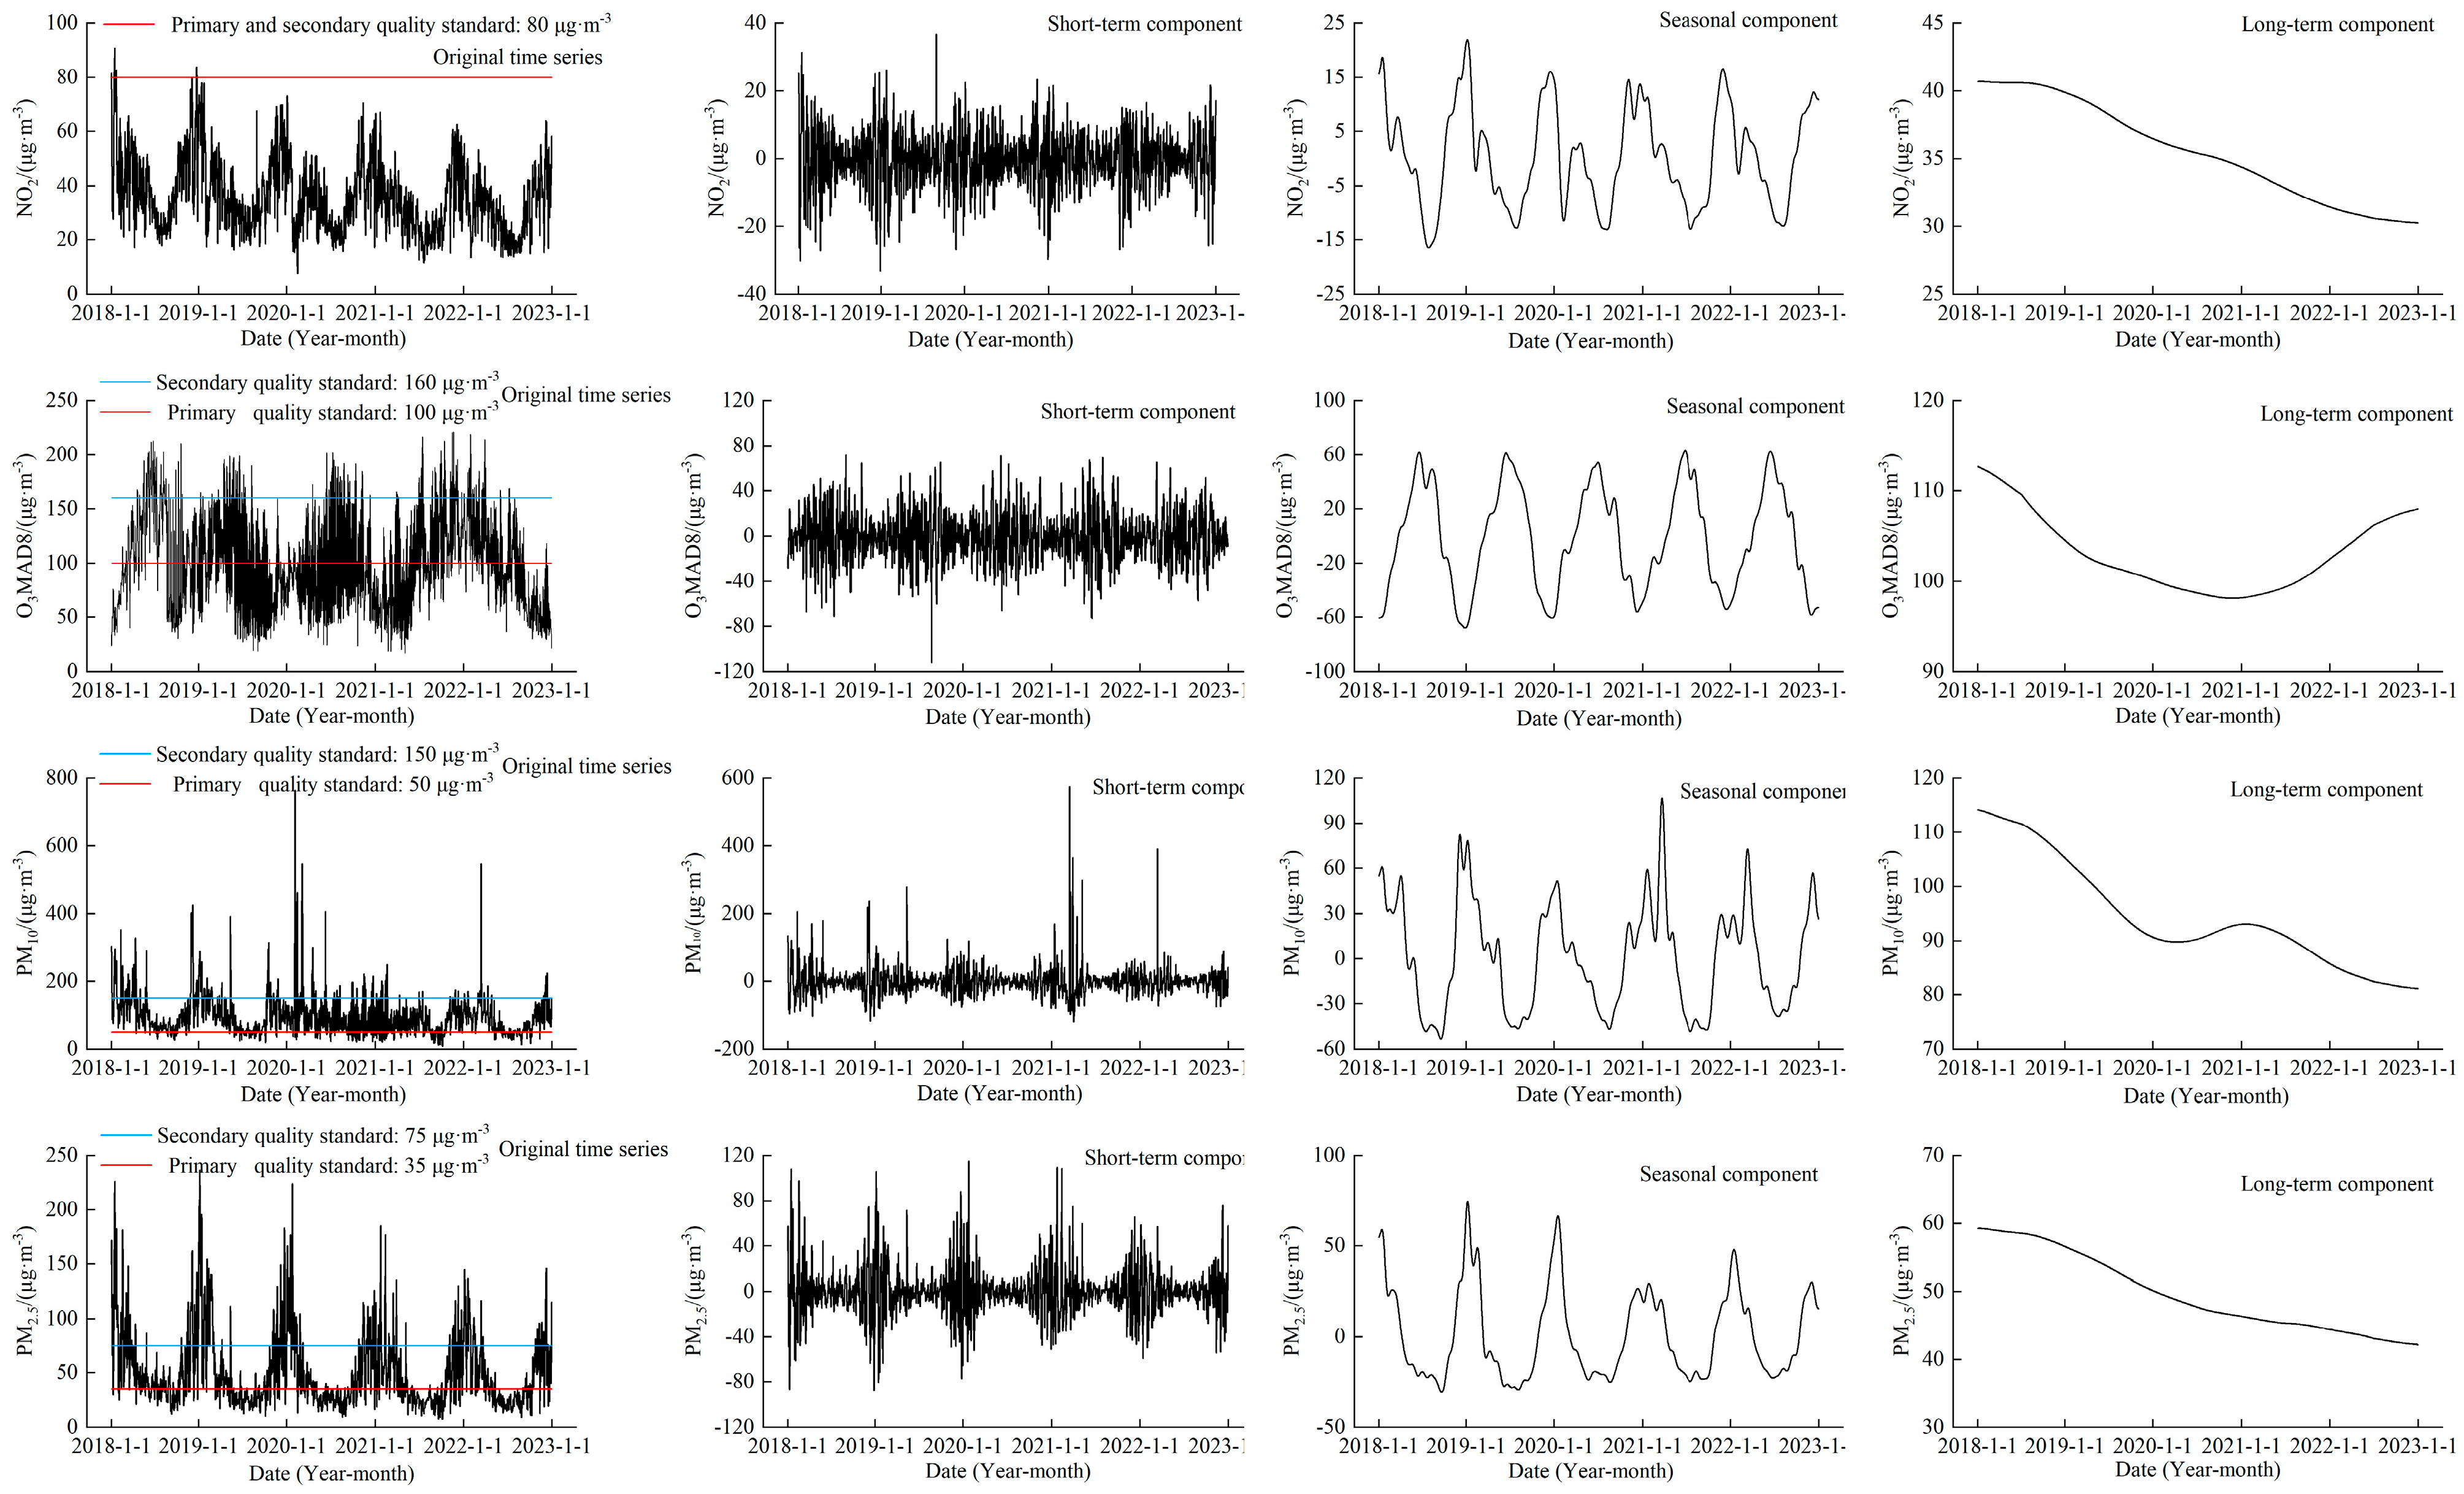
5.1. Trend Changes in the Original Series, Short-Term Components, Long-Term Components, and Seasonal Components

Ambient air quality is the standard for implementing the “People’s Republic of China Environmental Protection Law” and “People’s Republic of China Law on Prevention and Control of Air Pollution” to protect and improve the living environment, the ecological environment, and human health standards. Ambient air functional zones are divided into two categories: Type I zones are nature reserves, scenic spots, and other areas requiring special protection; Type II zones are residential areas, mixed commercial and transportation residential areas, cultural areas, industrial areas, and rural areas. The primary quality standard applies to Type I areas, and the secondary quality standard applies to Type II areas. Since the scope of the study is the entire city, only the days exceeding the national secondary quality standard were analyzed.
Figure 2 shows the trends of the original series, short-term components, seasonal components, and long-term components of NO2, O3, PM10, and PM2.5 in the Fenwei Plain from 2018 to 2022. From the original series and the exceeding days, there were only 9 days when the daily average NO2 concentration in the Fenwei Plain exceeded the standard (80 μg·m−3), and all of these were in 2018. It can also be seen that the peak of daily average NO2 concentration has been significantly reduced. It shows that with the implementation of the Three-Year Action Plan, the NO2 pollution in the Fenwei Plain has been well managed and shows a continuous downward trend. The days when the O3MAD8 exceeded the national secondary quality standard (160 μg·m−3) in each of the years from 2018 to 2022 were 58, 45, 31, 45, and 37 d, respectively. From 2018 to 2020, most of the exceeding months were concentrated between April and August, and from 2021 to 2022, most of the exceeding months were concentrated between May and September. Thus, it can be considered that the O3 control and pollution period in the Fenwei Plain is from April to September. O3 levels rebounded in 2021–2022, presumably due to the declining NO2. It shows that simply reducing the concentration of NO2 may not have the effect of reducing the concentration of O3. As can be seen from Figure 2, the number of exceedance days of particulate matter is still severe, with the annual number of days in which the daily average concentration of PM10 exceeded the national secondary quality standard (150 μg·m−3) between 2018 and 2022 being 72, 62, 30, 41, 30 d, respectively. The annual number of days in which PM2.5 exceeded the national secondary quality standard (75 μg·m−3) for the same period was 84, 80, 72, 54, 63 d, respectively. It indicates that the exceedance of particulate matter is still a problem that needs to be emphasized in the Fenwei Plain.
The long-term components of three air pollutants, but not O3, showed a decreasing trend. The long-term components of NO2, PM10, and PM2.5 decreased by 10.5, 33.1, and 17.1 μg·m−3, respectively. The decrease rate was 25.8%, 29%, and 28.8%, respectively. In contrast, O3 levels were shown to decrease and then increase, with 2020 as the dividing line. The long-term components decreased from 112.7 μg·m−3 to 98.1 μg·m−3 and then increased continuously to level off at 108 μg·m−3. PM10 fluctuated slightly in 2021, which might be related to the frequent sand and dust activities in 2021 [26]. In terms of the short-term component, this exhibited significant amplitude, with large fluctuations especially at higher concentrations of the individual pollutants. The drastic changes in the short-term component can be seen as caused by short-term changes in the weather, since the local emission sources do not show significant changes in the short term. Among them, the effect of the dust storm in March 2021 is extremely obvious in the short-term component of PM10. The seasonal components of all four air pollutants show significant cyclical variations. Such a cyclical fluctuation in the seasonal fractions is mainly due to a heating period in winter in the north, with low boundary-layer heights and static weather, as well as frequent dusty weather in spring, which contribute to the accumulation of pollutants. In summer, frequent precipitation, high temperatures, strong air convection, and high boundary-layer thickness contribute to the diffusion and deposition of pollutants [27].

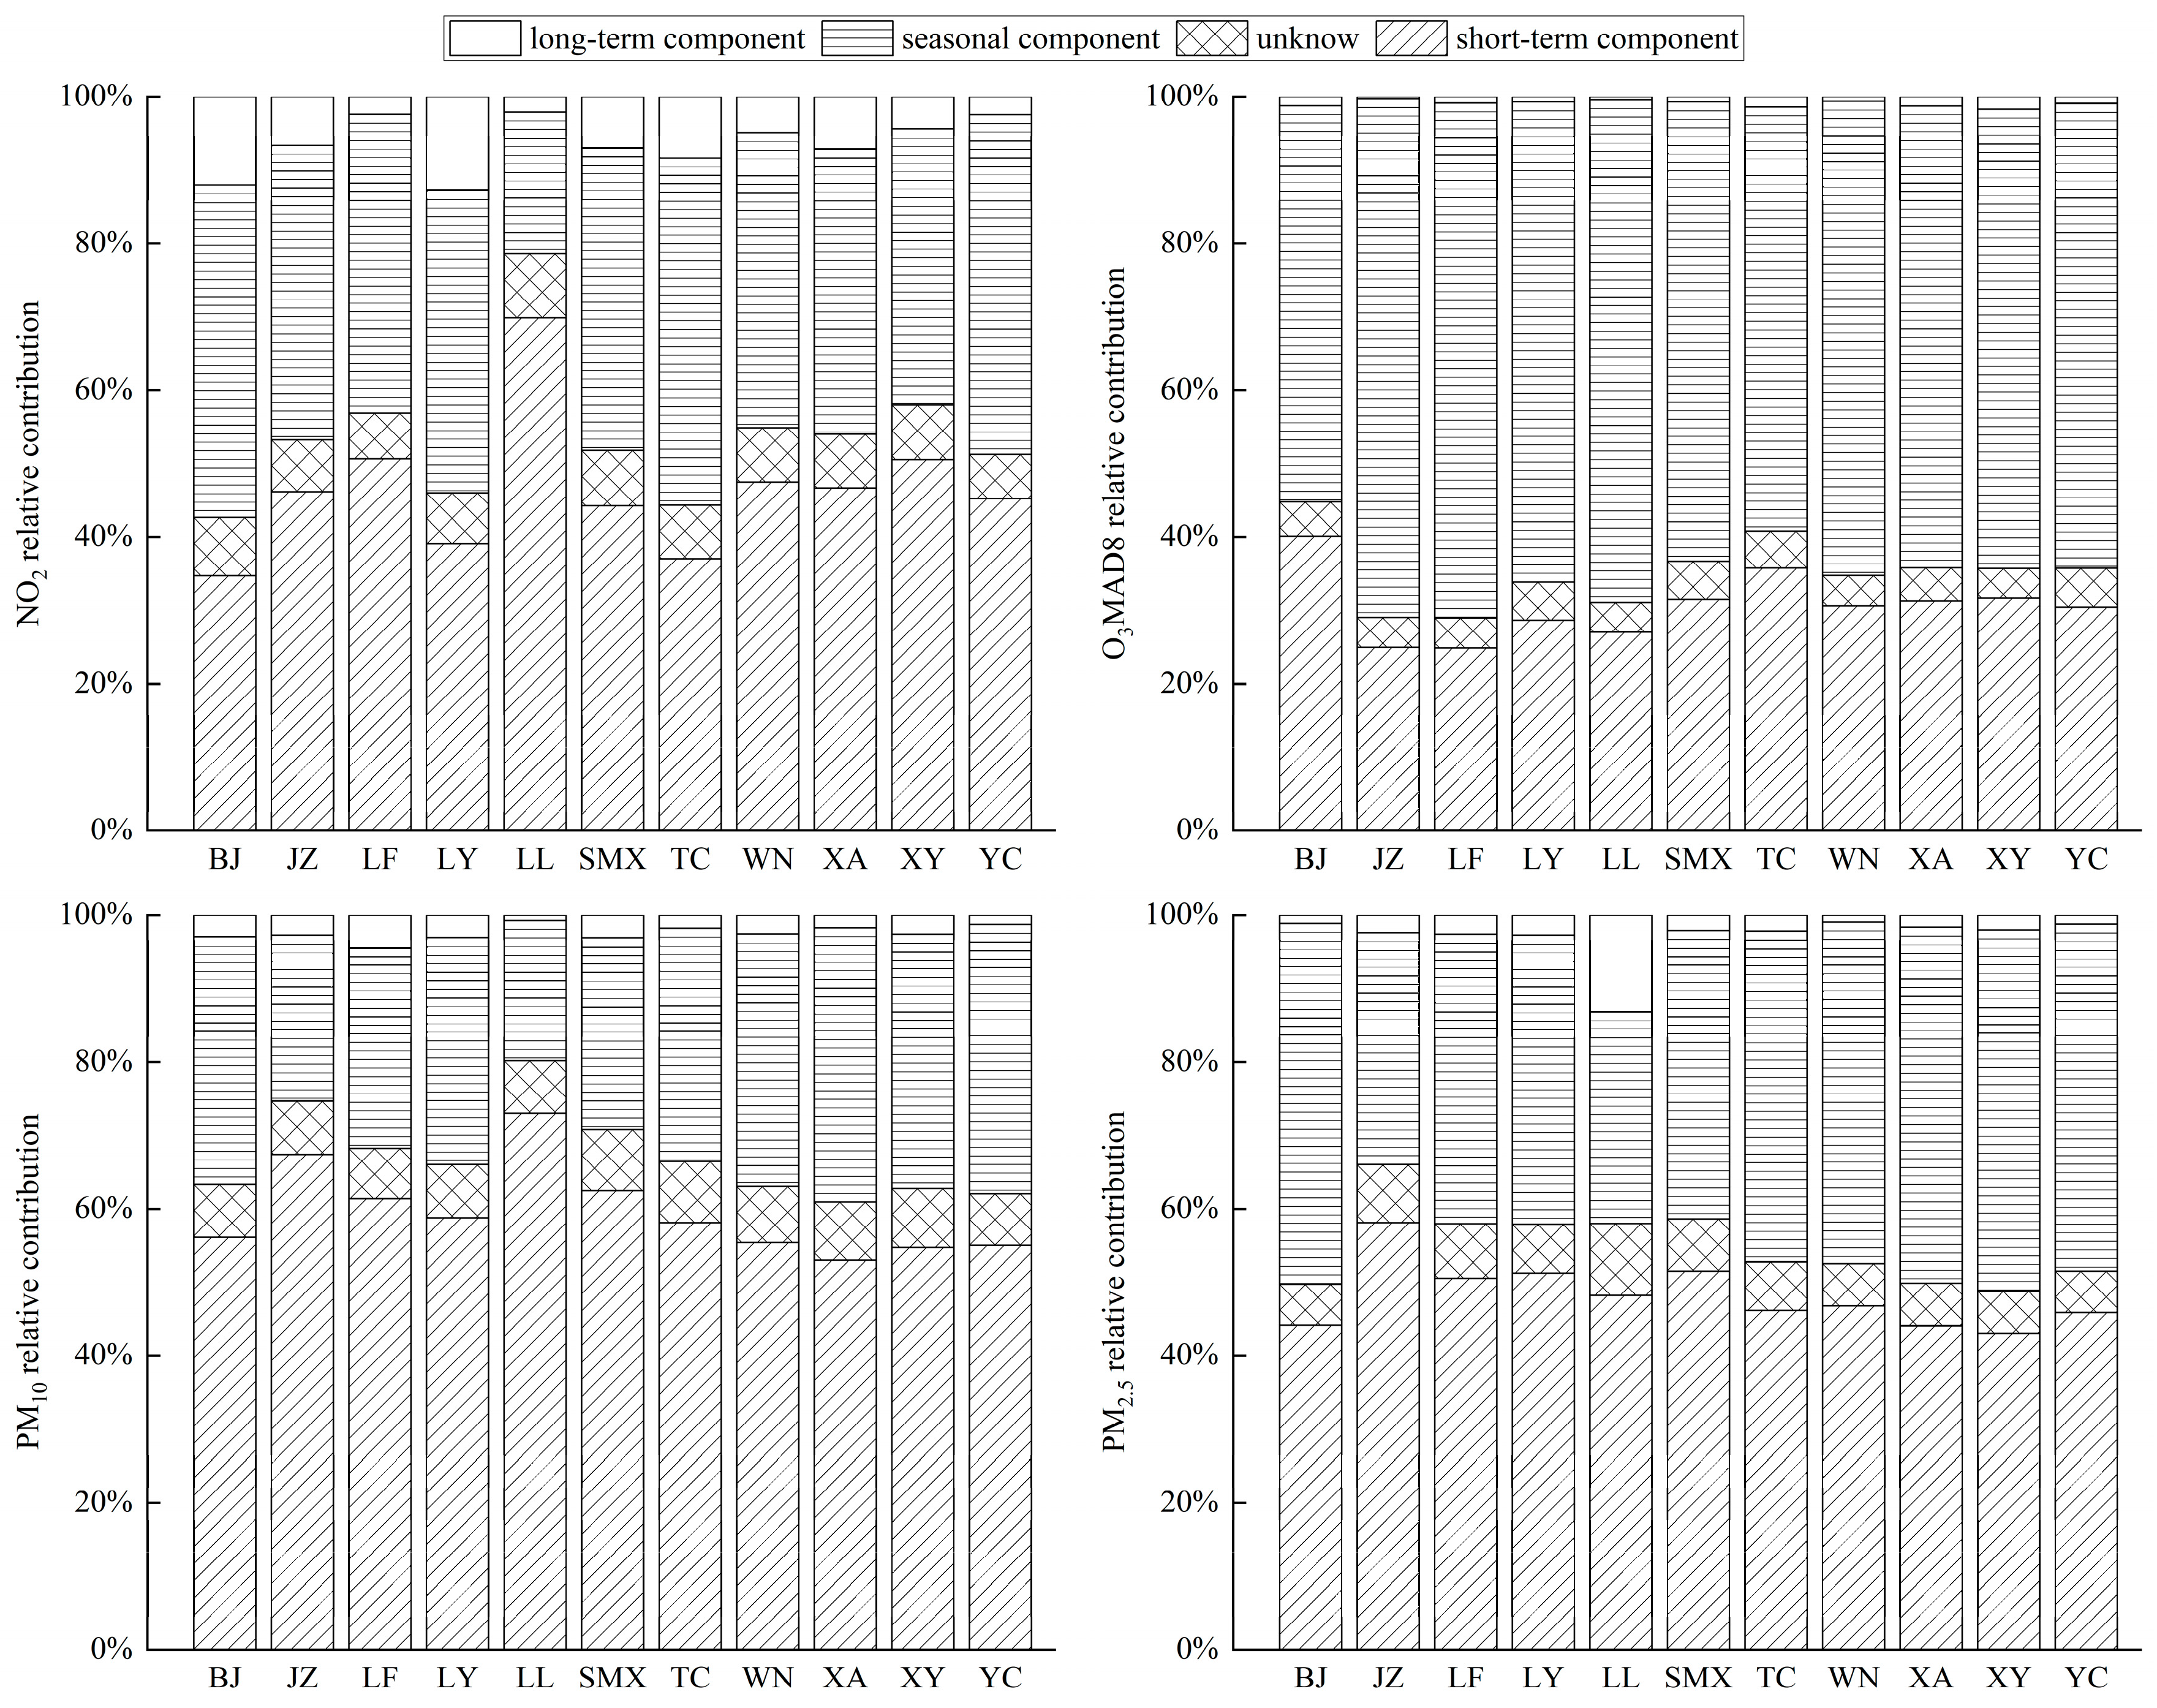
5.2. Relative Contribution of Long-Term, Short-Term, Seasonal, and Unknown Components of the Pollutants

In order to analyze the contribution of each component to the original time series of pollutant concentrations, the relative contributions of the short-term, seasonal, and long-term components to the total variance were calculated. The relationship between the three theoretical short-term, seasonal, and long-term components should be independent, and the sum of the short-term, seasonal, and long-term components is equal to the variance of the original time series [28]. The degree of contribution of the above components to the variance of each city in the Fenwei Plain is shown in Figure 3. It can be seen that the sum of the long-term, seasonal, and short-term components of the four pollutants in different cities in the Fenwei Plain contributes to the total variance in the range of 90.25–95.98%. The larger the total variance is, the stronger the independence among the three components is, indicating that the KZ filter has a better serial decomposition ability with regard to the four pollutants in different cities of the Fenwei Plain.
The short-term component of NO2 contributed the most to the total variance, reaching 34.7–69.8%, followed by the seasonal component, reaching 19.3–47.3%, and the long-term component contributed the least to the total variance of the original time series, ranging from 2.1% to 12.8%. The short-term component had the most considerable contribution in Lvliang, which was significantly higher than in other cities, indicating that NO2 in Lvliang was more susceptible to short-term meteorological conditions. The dominant wind direction near the ground in Lvliang City is northeast, accounting for 33.9% of the wind frequency, and the second dominant wind direction is southwest, accounting for 12.9% of the wind frequency. These two wind directions are the same as the direction of the Lvliang Sanchuan River valley, with the northeast wind corresponding to the Beichuan River and the southwest wind corresponding to the main stream of the Sanchuan River [29]. This may be why Lvliang is the city that is the most vulnerable to short-term changes. The O3 seasonal component contributes the most to the total variance, with 54–70.7%, followed by the short-term component, with 24.8–40%, and the long-term component contributes the least to the total variance of the original time series, with 0.27–1.74%. The seasonal component is larger than the short-term component for all cities in the Fenwei Plain, suggesting that O3 is mainly related to seasonal variations in meteorological conditions and energy consumption patterns. The most considerable contribution of the seasonal component of O3 to the total variance is related to its genesis, as solar irradiation can primarily affect the concentration of O3 itself [30]. At the same time, the stratospheric–tropospheric exchange triggered by tropopause folding is an essential source of the tropospheric O3 increase in spring [31]. Therefore, the seasonal variation in O3 is more prominent. The short-term component of PM10 contributes the most to the total variance, with 53–73%, followed by the seasonal component, with 19.1–37.3%, and the long-term component contributes the least to the total variance of the original time series, with 0.75–4.4%. The short-term component is larger than the seasonal component for all cities in the Fenwei Plain, which is the opposite to that of O3, indicating that PM10 is mainly related to short-term weather changes and short-term fluctuations of local emissions. Among them, Lvliang is the most susceptible city to short-term variations, and Xi’an is the most susceptible city to seasonal variations. In Xi’an, temperature and humidity are the vital meteorological factors causing O3 exceedance. High temperature and low humidity are favorable to O3 generation, and it is easy for a high concentration of O3 to occur when the temperature is higher than 30 °C and the relative humidity is lower than 60% [32]. This may be why Xi’an is the most vulnerable city to seasonal changes. The short-term component of PM2.5 contributes the most to the total variance, with 43–58%, followed by the seasonal component, with 28.9–49.2%, and the long-term component contributes the least to the total variance of the original time series, with 0.95–13.1%. PM2.5 is similar to PM10. PM2.5 is relatively more susceptible to socioeconomic conditions and policies and less susceptible to short-term meteorological factors.
Overall, the seasonal and short-term components strongly influenced the changes in the original time series of the four air pollutants in the Fenwei Plain. It suggests that the changes in air pollutant concentrations are caused by seasonal and short-term fluctuations in pollutant precursor emissions and meteorological conditions [33]. In contrast, the long-term changes in pollutant emissions and meteorological conditions are not the leading causes of the fluctuations in air pollutants in the Fenwei Plain. Therefore, to study the long-term trend changes in pollutants, it is necessary to separate the long-term components from the original time series [34].

5.3. Trend of NO2 Concentration Change, Meteorological Effect, and Anthropogenic Discharge Contribution

Figure 4 shows the long-term components of the original concentrations in 11 cities in the Fenwei Plain from 2018 to 2022. The 11 graphs on the left show the trend changes in the actual long-term fractions of each pollutant by city, and the 11 graphs on the right show the trend changes in the long-term fractions of each pollutant adjusted for meteorology to exclude the meteorological factor and, thus, affected only by emissions. Combining this with the results of the long-term components in Figure 2, it can be seen that the long-term components of NO2 in the 11 cities of the Fenwei Plain keep the same trend before and after the adjustment, and all show a decreasing trend. In order to visualize the effect of meteorological conditions on NO2 concentration during the study period, we examined the difference between the long-term components and the meteorologically adjusted long-term components to obtain the effect of meteorological conditions on the long-term components. A positive difference indicates that the long-term component due to the pollution source is smaller than the long-term component of the combined effect of the pollution source and meteorology, indicating that the meteorological conditions are not conducive to improving pollution. Conversely, a negative difference indicates that the long-term component due to the source of pollution is larger than the long-term component of the combined effect of the source of pollution and meteorology, suggesting that the meteorological conditions are favorable to improving pollution. Most of the cities in the Fenwei Plain had unfavorable meteorological conditions for NO2 improvement in 2018–2020 and favorable meteorological conditions for NO2 improvement in 2020–2022, with Xianyang City showing the most prominent performance. Regarding the fluctuating magnitude of meteorological impacts, Linfen, Yuncheng, Xianyang, and Sanmenxia had more significant meteorological impacts. Similar conclusions emerged from Chen in a study of particulate matter in the Yangtze River Delta, i.e., with 2020 as the dividing line, meteorological conditions were favorable and then unfavorable for improving particulate matter. The specific reasons for this pattern need to be further investigated [10].
Table 1 shows the ratios of long-term component changes in the NO2 concentration and the specific contribution ratios of emission reduction and meteorological conditions to the trend changes in concentration for the 11 cities in the Fenwei Plain. All 11 cities in the Fenwei Plain showed a decreasing trend from 2018 to 2022, but each city’s degree of decrease was different. Among them, Luoyang City had the most significant decreasing ratio of 37.0%, and Lvliang City had the smallest decreasing ratio of 10.7%. The overall trend was higher in the eastern Fenwei Plain than in the western Fenwei Plain and higher in the southern Fenwei Plain than in the northern Fenwei Plain. In another study, Zhang pointed out that the Guanzhong region and northern Shaanxi are more polluted, while southern Shaanxi and southern Shaanxi are less polluted, and the cities are more polluted than the suburban counties [35]. This is consistent with our finding that pollution is higher in the north than in the south, and the reason for this trend may be related to the local energy structure and policies. Since the release of the “Ten Atmospheric Rules,” the Fenwei Plain has implemented strict air pollution control measures, such as controlling coal consumption, adjusting the industrial structure, reducing vehicle fuels, and phasing out small coal-fired boilers. These actively implemented clean-air policies have significantly improved the air quality [36]. The effect of meteorological conditions and the implementation of air pollution control measures varied among the cities in the Fenwei Plain, with the contribution of emission sources to the long-term component changes ranging from 66.4% to 105.2%. Among them, the meteorological conditions in Lvliang and Jinzhong cities had an unfavorable effect on NO2. Among the other nine cities, Xianyang City had the most significant proportion of meteorological conditions with 33.6%, and Luoyang City had the most significant contribution to the proportion of emission reduction measures with 96.59%. The dominant factor in the year-by-year improvement in NO2 levels in the Fenwei Plain from 2018 to 2022 is anthropogenic emission reduction, in which the role of meteorological conditions has less influence.

5.4. Trend of O3 Concentration Change, Meteorological Effect, and Anthropogenic Discharge Contribution

The long-term trend of the O3 concentration before and after meteorological adjustment is shown in Figure 5. It can be seen that the long-term components of all cities in the Fenwei Plain generally decreased after removing the influence of meteorological factors, indicating that meteorological conditions are unfavorable to the improvement of O3. All cities in the Fenwei Plain showed the same characteristics, i.e., the meteorological conditions were unfavorable to the improvement in O3 levels in 2018–2019, favorable to the improvement of O3 levels in 2019–2021, and unfavorable to the improvement of O3 levels in 2021–2022. Regarding the fluctuation in the magnitude of meteorological impacts, the meteorological impacts were more considerable in nine cities, with the exception of Sanmenxia and Luoyang. The more significant unfavorable effects of meteorological impacts in all cities since 2022 may be related to the frequent and extreme high-temperature weather in the last two years. The O3 concentrations were related to the precursor emission sources and their location relationships, geographic features, and meteorological conditions. Scholars have investigated the effects of meteorological parameters such as solar radiation, temperature, relative humidity, wind speed, and direction on O3 concentrations, and the effects of other meteorological parameters varied depending on the location. In contrast, solar radiation and temperature were recognized as the primary influence parameters of O3 [37].
Table 2 shows the ratios of long-term component changes in O3 concentrations in 11 cities in the Fenwei Plain and the specific contribution ratios of emission reduction and meteorological conditions to the trend changes in concentrations. It can be seen that, except for Weinan, all other cities showed a decreasing trend in O3 concentration in 2018–2022. Linfen showed the most significant decrease of 11.6%. Xi’an had the most minor decrease of 0.47%. The effect of meteorological conditions and the implementation of air pollution control measures varied among the cities in the Fenwei Plain. Meteorological conditions in Sanmenxia, Luoyang, Xianyang, and Tongchuan unfavorably affected O3. The anthropogenic emissions in Jinzhong, Weinan, and Xi’an unfavorably affected O3. Among the other four cities, Baoji had the most significant percentage of contribution from meteorological conditions with 51.7%, and Linfen had the most significant contribution from emission reduction measures with 96.7%. O3 is a secondary pollutant. Its concentration changes depending on the precursor emissions, with the system of the atmospheric environment of the integrated impact, spatial and temporal characteristics, and impact factors making things more complex [38]. Therefore, different measures should be taken to reduce O3 emissions in different cities.

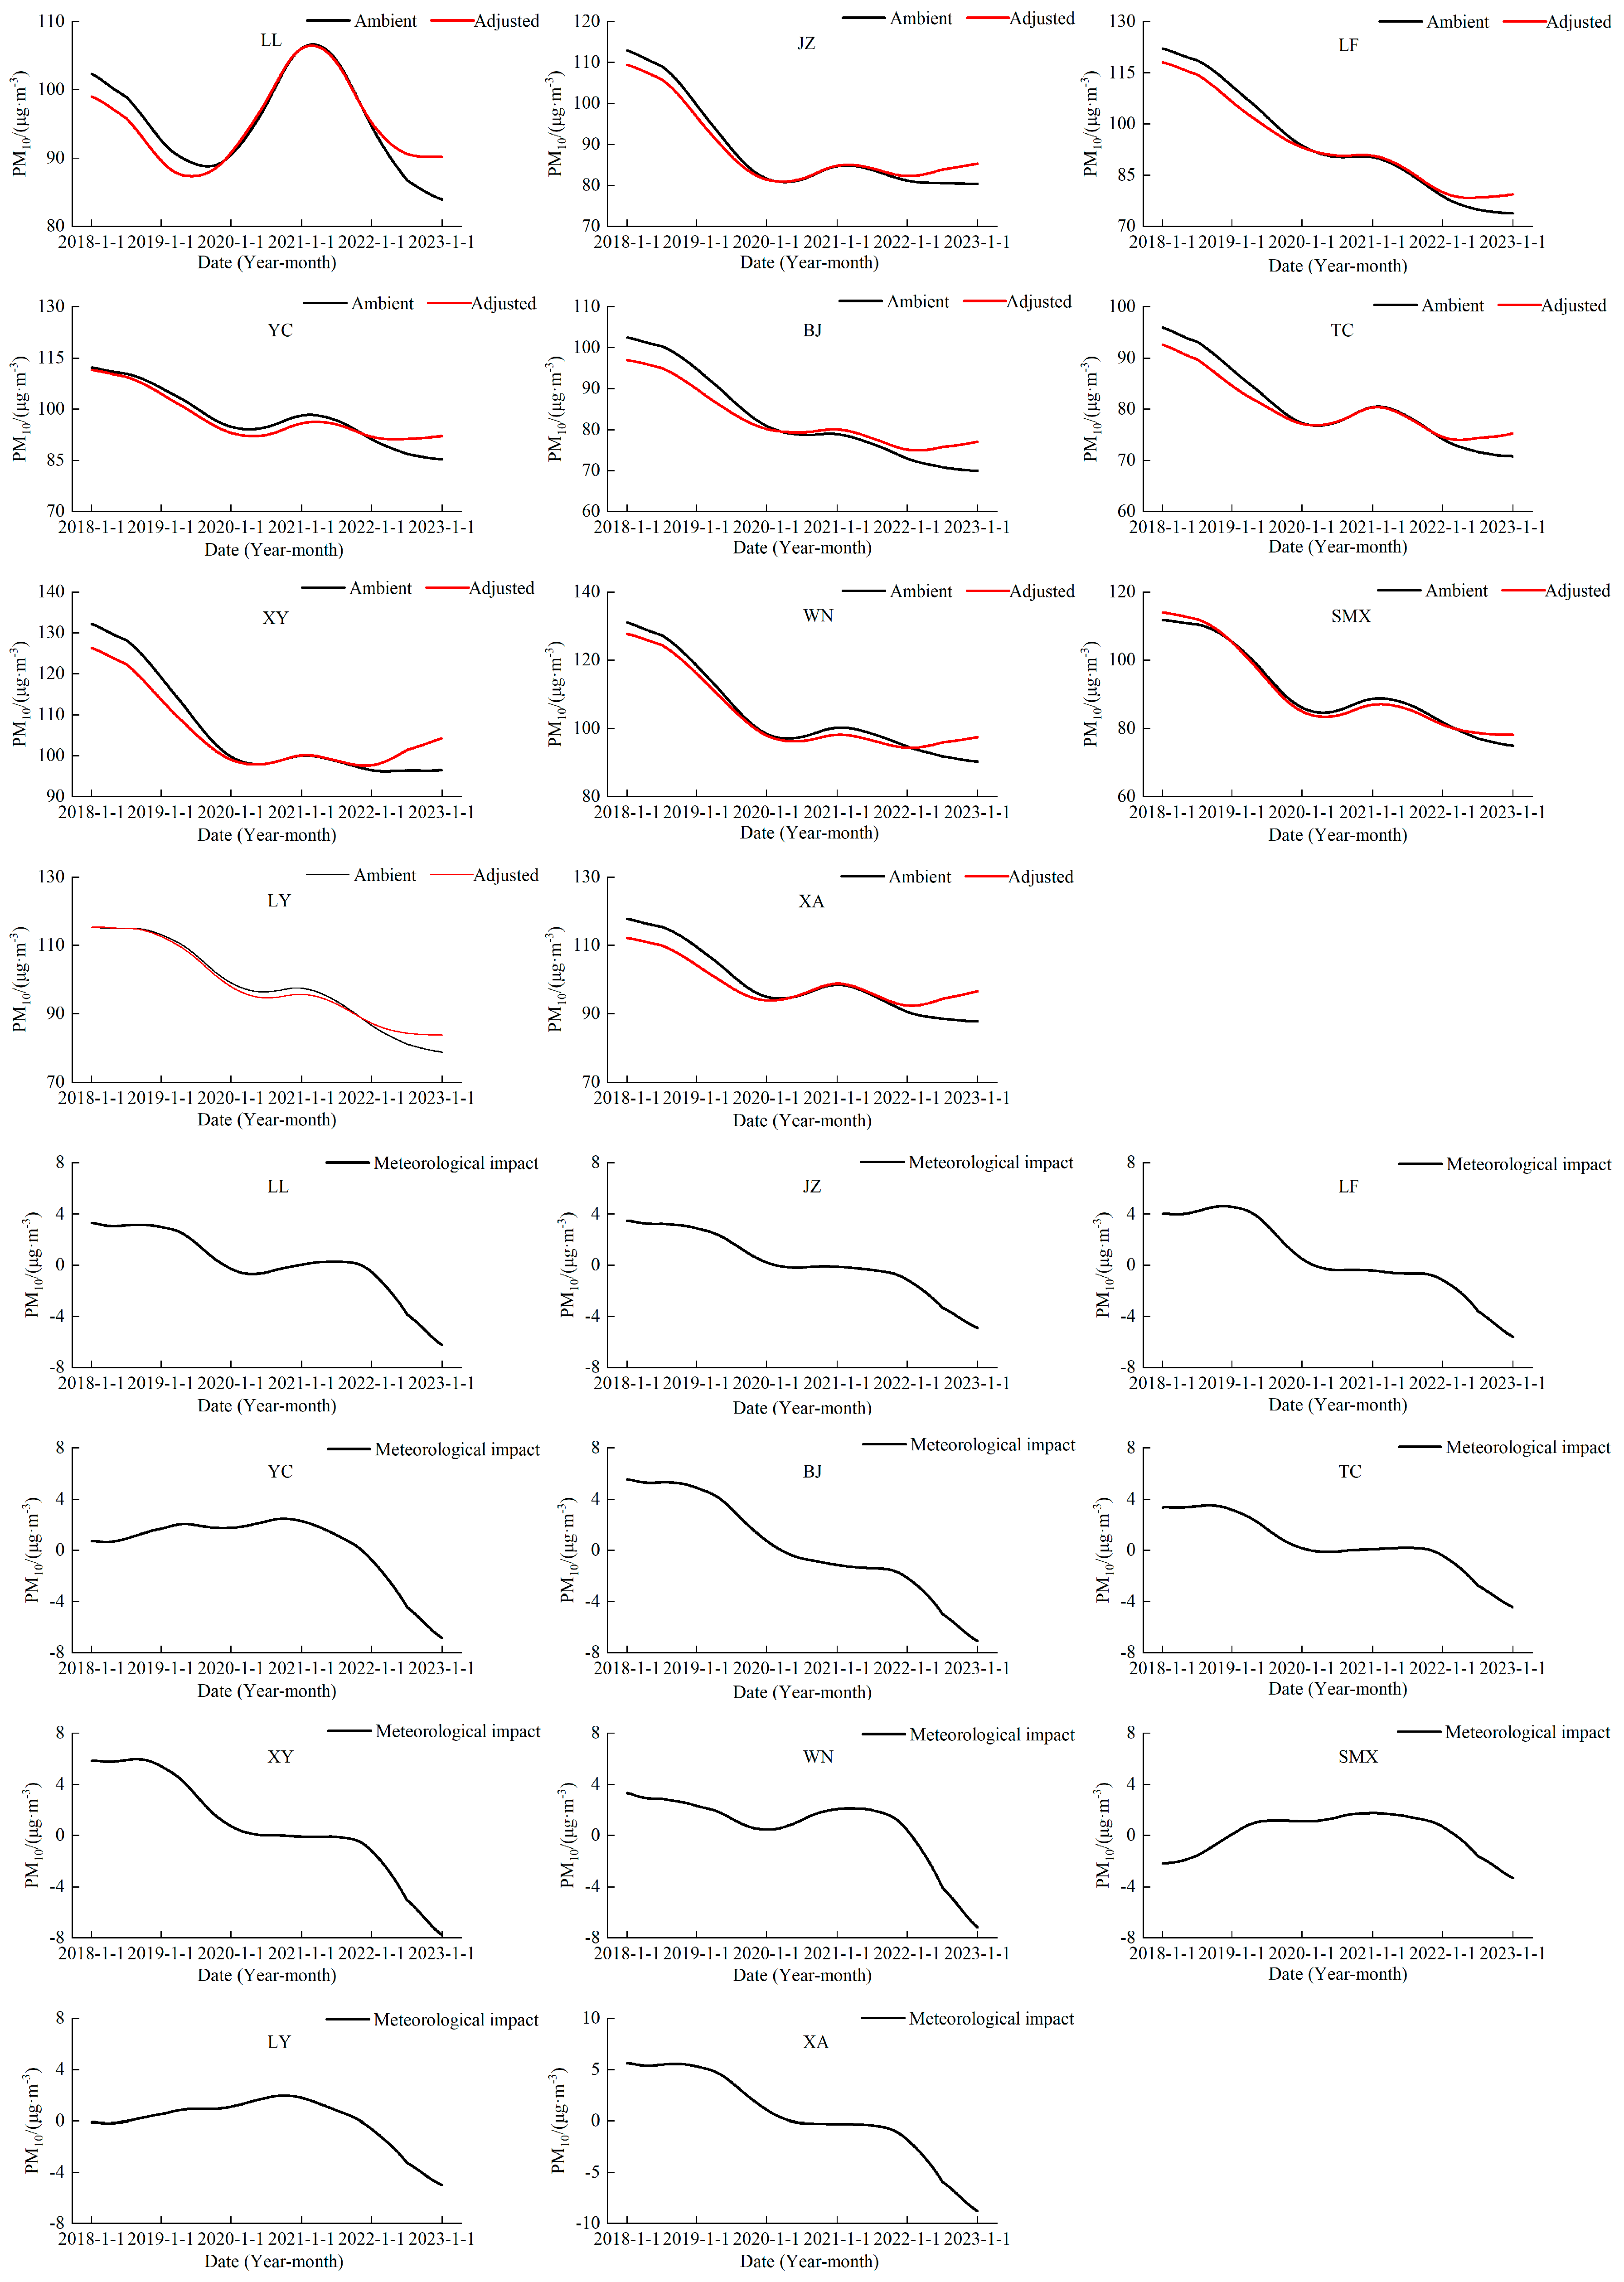
5.5. Trend of PM10 Concentration Change, Meteorological Effect, and Anthropogenic Discharge Contribution

Figure 6 demonstrates the difference between the emission-only and regulated long-term fractions of PM10 for the 11 cities in the Fenwei Plain after adjusting for meteorological conditions from 2018 to 2022. Figure 6 shows that the long-term fractions of each city in the Fenwei Plain generally increased after removing the influence of meteorological factors, indicating that meteorological conditions are favorable to improving PM10. Except for Sanmenxia, Luoyang, and Yuncheng, the effects of meteorological factors on PM10 showed a two-stage decreasing pattern, i.e., the meteorological conditions were unfavorable to PM10 improvement in 2018–2020, the role of meteorological conditions was almost zero in 2020–2021, and the meteorological conditions were favorable to PM10 improvement in 2021–2022.
Table 3 shows the ratios of long-term component changes in PM10 concentrations in 11 cities in the Fenwei Plain and the specific contribution ratios of emission reductions and meteorological conditions to the changes in concentration trends. Compared with 2018, PM10 pollution in all 11 cities in the Fenwei Plain significantly improved in 2022. The Linfen PM10 decreased the most, by 39.58%, and Lvliang PM10 decreased the least, by 17.96%. Pollution-source emission reduction measures are still the main factors for improving PM10 pollution in the Fenwei Plain; except for Lvliang and Xi’an, the proportion of local emission reduction is more than 60% in the rest of the cities. Sanmenxia, Luoyang, and Linfen in the eastern part of the Fenwei Plain accounted for 96.93%, 86.62%, and 80.11%, respectively.

5.6. Trend of PM2.5 Concentration Change, Meteorological Effect, and Anthropogenic Discharge Contribution

Figure 7 demonstrates the difference between the emission-only and moderated long-term fractions of PM2.5 for the 11 cities in the Fenwei Plain after adjusting for meteorological conditions from 2018 to 2022. From Figure 7, it can be seen that the long-term fractions of each city in the Fenwei Plain generally increased after removing the influence of meteorological factors, indicating that meteorological conditions are favorable to improving PM2.5. It can be seen that Lvliang and Jinzhong are less affected by meteorological effects. In terms of the time of the influence of meteorological conditions, most cities in the Fenwei Plain, except Yuncheng and Sanmenxia, showed that meteorological conditions were unfavorable to the improvement of PM2.5 in 2018–2020, and meteorological conditions were favorable to the improvement of PM2.5 in 2021–2022.
Table 4 shows the ratios of long-term component changes in PM2.5 concentrations and the specific contribution ratios of emission reduction and meteorological conditions to concentration trends for the 11 cities in the Fenwei Plain. Compared with 2018, PM2.5 pollution in all 11 cities in the Fenwei Plain improved significantly in 2022. Among them, the Lvliang PM2.5 decreased by the most considerable amount, by 55.86%, and Weinan PM2.5 decreased by the smallest amount, by 18.09%. In Weinan, Baoji, Xianyang, Xi’an, and other cities in the western Fenwei Plain, meteorological factors play a significant role in PM2.5 emission reduction, accounting for more than half of the overall emission reduction factors. However, emission reduction measures of pollution sources are still the main factors for improving PM2.5 pollution in the Fenwei Plain, where the meteorological conditions in Jinzhong, Yuncheng, and Sanmenxia negatively affected PM2.5 emission reduction. Local emission reduction in Lvliang, Yuncheng, and Luoyang played a significant role in PM2.5 emission reduction, accounting for more than 80% of the total.

6. Conclusions

(1) The long-term fractions of NO2, PM10, and PM2.5 in the Fenwei Plain decreased by 10.5, 33.1, and 17.1 μg·m−3 from 2018 to 2022, with decreases of 25.8%, 29%, and 28.8%, respectively. Among them, PM10 showed the most apparent decreasing trend. The long-term fraction of O3 showed a decreasing and then increasing trend, with 2020 as the dividing line, with the long-term fraction decreasing from 112.7 μg·m−3 to 98.1 μg·m−3 and then increasing to 108 μg·m−3 and leveling off.
(2) The short-term components of NO2, PM10, and PM2.5 contributed the most to the total variance, with the short-term components accounting for 34.7–69.8%, 53–73%, and 43–58%, respectively. The seasonal components of O3 contributed the most to the total variance, with 54–70.7%. This indicates that small-scale weather systems and short-term changes in external emissions mainly influence NO2, PM10, and PM2.5. Changes in O3 concentration is mainly related to seasonal changes in meteorological conditions and energy consumption patterns.
(3) Most cities in the Fenwei Plain had unfavorable meteorological conditions for NO2, PM10, and PM2.5 in 2018–2020 and favorable meteorological conditions for NO2, PM10, and PM2.5 in 2020–2022. Regarding the magnitude of meteorological effects, PM10 > PM2.5 > NO2. O3 showed different characteristics from the other three pollutants, with most cities in the Fenwei Plain experiencing unfavorable meteorological conditions for the improvement of O3 in 2018–2019, favorable meteorological conditions for the improvement of O3 in 2019–2021, and unfavorable meteorological conditions for the improvement of O3 in 2021–2022.
(4) In the long-term component changes in NO2 concentration, Luoyang city had the most significant decrease ratio of 37.0%, and Lvliang city had the smallest decrease ratio of 10.7%. Among them, the meteorological conditions in Lvliang and Jinzhong cities adversely affected NO2 concentrations. Among the other nine cities, Xianyang City had the most significant contribution ratio of 33.6% from meteorological conditions, and Luoyang City had the most significant contribution ratio of 96.59% from abatement measures.
(5) Long-term fractional changes in O3 concentrations. Except for Weinan, all the other cities showed a decreasing trend for O3 in 2018–2022, with Linfen having the most significant decrease of 11.6%. Xi’an had the most minor decrease of 0.47%. Meteorological conditions in Sanmenxia, Luoyang, Xianyang, and Tongchuan adversely affected O3 concentrations. Anthropogenic emissions in Jinzhong, Weinan, and Xi’an adversely affected O3 concentrations. Among the other four cities, Baoji had the most significant percentage of contribution from meteorological conditions with 51.7%, and Linfen had the most significant contribution from emission reduction measures with 96.7%.
(6) The long-term component change in PM10 concentration was 39.58% in Linfen and 17.96% in Lvliang. Pollution-source abatement measures are still the main factor for improving PM10 pollution in the Fenwei Plain, except for Lvliang and Xi’an, where the local abatement accounted for more than 60% of the rest of the cities. Among them, Sanmenxia, Luoyang, Linfen, and other cities in the eastern Fenwei Plain had a high proportion of local emission reduction of 96.93%, 86.62%, and 80.11%, respectively.
(7) The long-term component change in PM2.5 concentration in Lvliang decreased by the most considerable amount, 55.86%, and the decrease in PM2.5 in Weinan was the smallest amount, 18.09%. In Weinan, Baoji, Xianyang, Xi’an, and other cities in the western Fenwei Plain, meteorological factors played a prominent role in PM2.5 emission reduction, accounting for more than half of the overall emission reduction factors. However, emission reduction measures toward pollution sources are still the main factors for improving PM2.5 pollution in the Fenwei Plain, where meteorological conditions in Jinzhong, Yuncheng, and Sanmenxia negatively affected PM2.5 emission reduction. Local emission reduction in Lvliang, Yuncheng, and Luoyang played a significant role in PM2.5 emission reduction, accounting for more than 80% of the total.

Author Contributions

X.X.: Writing and conceptualization. T.J.: Resources and project administration. B.L.: visualization. C.H.: visualization. J.Z.: software. S.L.: software. X.N.: software. All authors have read and agreed to the published version of the manuscript.

Funding

This work was supported by the Natural Science Foundation of Gansu Province (CN) (17YF1FA120) at the Key Laboratory of Resource Environment and Sustainable Development of Oasis, Gansu Province, and the Gansu Province Environmental Science and Engineering Experimental (PracticalTraining) Demonstration Teaching Centre (202018).

Institutional Review Board Statement

Not applicable.

Informed Consent Statement

Not applicable.

Data Availability Statement

The data presented in this study are available in Section 3 “Data Sources”. The code used in this study are available on request from the corresponding author. The data are not publicly available due to privacy.

Acknowledgments

The authors thank the reviewers for their helpful comments, which helped to improve our manuscript.

Conflicts of Interest

The authors declare no conflict of interest.

References

  1. Sheng, L.; Miao, Y.; Xu, Q.; Yang, W. Dialogue with Huang Shunxiang: Approaching China’s air pollution prevention and control. Chin. Sci. Bull. 2018, 63, 1515–1518. Available online: https://kns.cnki.net/kcms2/article/abstract?v=tYqgYjzYKsDOWn-yhEDEYQJrQuG8xNM3sm_KCttgKtSmDGuTaSJvq1_M_JtEx43-wlkBdspgD90yIY9MwOlO7eTvUn-qncQWhShOpI7DowOTbWrjMMvIiuIuv3fYRFXvUxfpXZaKS0Wp0gb6amzdtA==&uniplatform=NZKPT&language=CHS (accessed on 28 October 2023).
  2. Zheng, B.; Tong, D.; Li, M.; Liu, F.; Hong, C.; Geng, G.; Li, H.; Li, X.; Peng, L.; Qi, J.; et al. Trends in China’s anthropogenic emissions since 2010 as the consequence of Clean Air Actions. Atmos. Chem. Phys. 2018, 18, 14095–14111. [Google Scholar] [CrossRef]
  3. Chen, Z.; Xie, X.; Cai, J.; Chen, D.; Gao, B.; He, B.; Cheng, N.; Xu, B. Understanding meteorological influences on PM2.5 concentrations across China: A temporal and spatial perspective. Atmos. Chem. Phys. 2018, 18, 5343–5358. [Google Scholar] [CrossRef]
  4. Zhong, Q.; Ma, J.; Shen, G.; Shen, H.; Zhu, X.; Yun, X.; Meng, W.; Cheng, H.; Liu, J.; Li, B.; et al. Distinguishing emission-associated ambient air PM2.5 concentrations and meteorological factor-induced fluctuations. Environ. Sci. Technol. 2018, 52, 10416–10425. [Google Scholar] [CrossRef] [PubMed]
  5. Cheng, J.; Su, J.; Cui, T.; Li, X.; Dong, X.; Sun, F.; Yang, Y.; Tong, D.; Zheng, Y.; Li, Y.; et al. Dominant role of emission reduction in PM2.5 Air Quality Improvement in Beijing during 2013–2017: A model-based decomposition analysis. Atmos. Chem. Phys. 2019, 19, 6125–6146. [Google Scholar] [CrossRef]
  6. Ding, A.; Huang, X.; Nie, W.; Chi, X.; Xu, Z.; Zheng, L.; Xu, Z.; Xie, Y.; Qi, X.; Shen, Y.; et al. Significant reduction of PM2.5 in eastern China due to regional-scale emission control: Evidence from SORPES in 2011–2018. Atmos. Chem. Phys. 2019, 19, 11791–11801. [Google Scholar] [CrossRef]
  7. Zhan, Q.; Zhang, Y.; Chen, H.; Zhang, K.; Ge, X. Trend Analysis of Atmospheric Particulate Matter over the Beijing-Tianjin-Hebei Region During 2015–2021 Using the KZ Filtering Approach. J. Ecol. Rural Environ. 2023, 39, 1133–1143. Available online: https://kns.cnki.net/kcms2/article/abstract?v=3uoqIhG8C44YLTlOAiTRKu87-SJxoEJu6LL9TJzd50k4bCTS-hFwN6YJ_IaCQ7jyu73Jzo922-l8p_fjrVytQIQNCmeFsPWz&uniplatform=NZKPT (accessed on 28 October 2023).
  8. Zhai, S.; Jacob, D.J.; Wang, X.; Shen, L.; Li, K.; Zhang, Y.; Gui, K.; Zhao, T.; Liao, H. Fine particulate matter (PM2.5) trends in China, 2013–2018: Separating contributions from Anthropogenic Emissions and Meteorology. Atmos. Chem. Phys. 2019, 19, 11031–11041. [Google Scholar] [CrossRef]
  9. Fang, C.; Qiu, J.; Li, J.; Wang, J. Analysis of the meteorological impact on PM2.5 pollution in Changchun based on KZ filter and WRF-CMAQ. Atmos. Environ. 2021, 271, 118924. [Google Scholar] [CrossRef]
  10. Chen, H.; Zhang, Y.; Zhan, Q.; Zhang, K.; Gai, X. Characterization of atmospheric particulate matter trends in the Yangtze River Delta from 2015 to 2021 based on KZ filtering approach analysis. Acta Sci. Circumstantiae 2023, 43, 102–110. Available online: https://kns.cnki.net/kcms2/article/abstract?v=3uoqIhG8C44YLTlOAiTRKibYlV5Vjs7ioT0BO4yQ4m_mOgeS2ml3UECALXHTRoFZr3ZmDdQ7cJIRBjrl6duOPIDxqeDeNEPb&uniplatform=NZKPT (accessed on 28 October 2023).
  11. Xu, D.; Wang, J.; Yuan, Z.; Huang, J.; Zhao, K.; Zhao, Y. Temporal-spatial variations, source apportionment, and formation mechanisms of PM2.5 pollution over Fenwei Plain, China. Acta Sci. Circumstantiae 2021, 41, 1184–1198. Available online: https://kns.cnki.net/kcms2/article/abstract?v=3uoqIhG8C44YLTlOAiTRKibYlV5Vjs7iy_Rpms2pqwbFRRUtoUImHaNWtKoGg2tLlEWTxBQb-ge-m5ixrSS1fyXySrn91A6y&uniplatform=NZKPT (accessed on 28 October 2023).
  12. Cao, J.J.; Cui, L. Current status, characteristics and causes of particulate air pollution in the Fenwei Plain, China: A Review. J. Geophys. Res. Atmos. 2021, 126, e2020jd034472. [Google Scholar] [CrossRef]
  13. Huang, X.-G.; Zhao, J.-B.; Sun, C.-J.; Tang, H.-L.; Liang, X.-Q. Orographic Influences on the Spatial Distribution of PM2.5 on the Fen-Wei Plain. Huan Jing ke Xue Huanjing Kexue 2021, 42, 4582–4592. Available online: https://kns.cnki.net/kcms2/article/abstract?v=3uoqIhG8C44YLTlOAiTRKibYlV5Vjs7iy_Rpms2pqwbFRRUtoUImHcoCqFf3jhsIZ1pcBvI219TUFgylbz_spqPFP_UD6GSS&uniplatform=NZKPT (accessed on 28 October 2023). [CrossRef] [PubMed]
  14. Zhao, Y.; Yang, T.; Wang, Z.; He, L.; Wu, L.; Cui, Y. Effectiveness of Air Pollution Control Efforts in Beijing–Tianjin–Hebei Region during 2013–2018 Based on the Kolmogorov–Zurbenko Filter. Clim. Environ. Res. 2020, 25, 499–509. Available online: https://kns.cnki.net/kcms2/article/abstract?v=3uoqIhG8C44YLTlOAiTRKibYlV5Vjs7i8oRR1PAr7RxjuAJk4dHXogtAEVH7LBKt5I_vt-tAQ0qU6fgtWMQqQPUjHL213qlL&uniplatform=NZKPT (accessed on 28 October 2023).
  15. Rao, S.T.; Zurbenko, I.G. Detecting and tracking changes in Ozone Air Quality. Air Waste 1994, 44, 1089–1092. [Google Scholar] [CrossRef]
  16. Kumari, S.; Jayaraman, G.; Ghosh, C. Analysis of long-term ozone trend over Delhi and its meteorological adjustment. Int. J. Environ. Sci. Technol. 2013, 10, 1325–1336. [Google Scholar] [CrossRef]
  17. Seo, J.; Youn, D.; Kim, J.Y.; Lee, H. Extensive spatiotemporal analyses of surface ozone and related meteorological variables in South Korea for the period 1999–2010. Atmos. Chem. Phys. 2014, 14, 6395–6415. [Google Scholar] [CrossRef]
  18. Seo, J.; Park, D.-S.R.; Kim, J.Y.; Youn, D.; Bin Lim, Y.; Kim, Y. Effects of meteorology and emissions on Urban Air Quality: A quantitative statistical approach to long-term records (1999–2016) in Seoul, South Korea. Atmos. Chem. Phys. 2018, 18, 16121–16137. [Google Scholar] [CrossRef]
  19. Milanchus, M.L.; Rao, S.T.; Zurbenko, I.G. Evaluating the effectiveness of ozone management efforts in the presence of meteorological variability. J. Air Waste Manag. Assoc. 1998, 48, 201–215. [Google Scholar] [CrossRef]
  20. Rao, S.T.; Zurbenko, I.G.; Neagu, R.; Porter, P.S.; Ku, J.Y.; Henry, R.F. Space and time scales in ambient ozone data. Bull. Am. Meteorol. Soc. 1997, 78, 2153–2166. [Google Scholar] [CrossRef]
  21. Sá, E.; Tchepel, O.; Carvalho, A.; Borrego, C. Meteorological driven changes on air quality over Portugal: A KZ filter application. Atmospheric Pollut. Res. 2015, 6, 979–989. [Google Scholar] [CrossRef]
  22. Tsakiri, K.G.; Zurbenko, I.G. Prediction of ozone concentrations using atmospheric variables. Air Qual. Atmosphere Health 2010, 4, 111–120. [Google Scholar] [CrossRef]
  23. Wang, T.; Xue, L.; Brimblecombe, P.; Lam, Y.F.; Li, L.; Zhang, L. Ozone pollution in China: A review of concentrations, meteorological influences, chemical precursors, and effects. Sci. Total. Environ. 2017, 575, 1582–1596. [Google Scholar] [CrossRef]
  24. Flaum, J.B.; Rao, S.T.; Zurbenko, I.G. Moderating the influence of meteorological conditions on ambient ozone concentrations. J. Air Waste Manag. Assoc. 1996, 46, 35–46. [Google Scholar] [CrossRef] [PubMed]
  25. Wise, E.K.; Comrie, A.C. Extending the kolmogorov–zurbenko filter: Application to ozone, particulate matter, and meteorological trends. J. Air Waste Manag. Assoc. 2005, 55, 1208–1216. [Google Scholar] [CrossRef] [PubMed]
  26. Ye, Q.; Zheng, X.; Zhao, S. Monitoring and transport path analysis of an intense dust weather process in2021. Natl. Remote Sens. Bull. 2023, 27, 1821–1833. Available online: https://kns.cnki.net/kcms2/article/abstract?v=3uoqIhG8C44YLTlOAiTRKu87-SJxoEJu6LL9TJzd50nPGuu_o6kNAei8vnHrsslRZySnAUsrjKOP8dcHo267Q-5P7dDYCC4E&uniplatform=NZKPT (accessed on 28 October 2023).
  27. Zhang, Y.-L.; Cao, F. Fine particulate matter (PM2.5) in China at a city level. Sci. Rep. 2015, 5, 14884. [Google Scholar] [CrossRef]
  28. Bai, H.; Shi, H.; Gao, Q.; Li, X.C.; Di, R.Q.; Wu, Y.H. Re-Ordination of Air Pollution Indices of Some Typical Cities in Beijing-Tianjin-Hebei Region Based on Meteoro-logical Adjustment. J. Ecol. Rural Environ. 2015, 31, 44–49. Available online: https://kns.cnki.net/kcms2/article/abstract?v=3uoqIhG8C44YLTlOAiTRKibYlV5Vjs7ir5D84hng_y4D11vwp0rrtT5bDLA779dDLkhHgb6Uspa6OuUs2FenvSUxwcAz_WoS&uniplatform=NZKPT (accessed on 28 October 2023).
  29. Gao, J.; Zhu, B.; Wang, D.; Wang, F. The variation of air pollutants and the impact of long-range transport in the northern suburb of Nanjing. Acta Sci. Circumstantiae 2012, 32, 1149–1159. Available online: https://kns.cnki.net/kcms2/article/abstract?v=3uoqIhG8C44YLTlOAiTRKgchrJ08w1e7fm4X_1ttJAm1zXj_NJIsHgaGt3b36IMyy_jNKhuk0GTn_gZo9WHmkH30o0DZgOyC&uniplatform=NZKPT (accessed on 28 October 2023).
  30. Gao, X.; Pei, K.; Wang, S.; Yan, S.; Wang, Y.; Jiang, Y. Analysis on the potential source and transmission channel of particulate matter in Lüliang City, Fenwei Plain. China Environ. Sci. 2022, 42, 2988–2999. Available online: https://kns.cnki.net/kcms2/article/abstract?v=Pk5Eu7LuuI54IZ4mcuXrTjO2GLh16g4I-zCCOtvhuayLtlrftZSh927C4e2k3Jqy-in_Y75VuKNvcvqFQyPAR4sryhPY0NaqJoVK0R7CiZR-kb0o3KnTy_LTy2raArk3msET2sacetxRoUyzGybIig==&uniplatform=NZKPT&language=CHS (accessed on 28 October 2023).
  31. Monks, P.S. A review of the observations and origins of the Spring Ozone Maximum. Atmos. Environ. 2000, 34, 3545–3561. [Google Scholar] [CrossRef]
  32. Hu, L.; Cheng, L.; Wang, Q.; Hu, S.; Lin, Y. Analysis of ozone concentration characteristics and key meteorological factors in Xi’an. J. Arid. Land Resour. Environ. 2021, 35, 102–109. Available online: https://kns.cnki.net/kcms2/article/abstract?v=Jk1LZv7y6P1fmgJ3wRLdh0SN6FlRIj03pgBwdXsvxUHtWsoWTJr8TmZ_0uRakLMibdlDb8AOH3PRR9wiSI5Ma3pwC-k3zn1egCxXtEikIsstkuk87nd9H0iYoOogmqTHgcDlvF5n0fywG0fXUiNZBg==&uniplatform=NZKPT&language=CHS (accessed on 28 October 2023).
  33. Zheng, H.; Kong, S.; Zheng, M.; Yan, Y.; Yao, L.; Zheng, S.; Yan, Q.; Wu, J.; Cheng, Y.; Chen, N.; et al. A 5.5-year observations of Black Carbon Aerosol at a megacity in central China: Levels, sources, and variation trends. Atmos. Environ. 2020, 232, 117581. [Google Scholar] [CrossRef]
  34. Ma, Z.; Xu, J.; Quan, W.; Zhang, Z.; Lin, W.; Xu, X. Significant increase of surface ozone at a rural site, north of Eastern China. Atmos. Chem. Phys. 2016, 16, 3969–3977. [Google Scholar] [CrossRef]
  35. Zhang, J.; Guo, Y.; Xiao, S.; Du, T.; Zheng, H.; Liu, H.; Wang, L.; He, Y. The temporal and spatial characteristics of ambient air guality in Shaanxi. J. Desert Res. 2023, 43, 36–46. Available online: https://kns.cnki.net/kcms2/article/abstract?v=Jk1LZv7y6P0ugAFWUxopSUkWZi81dhHXHNv6qK4eN8OZn_oni1H1PXeeVZMyzo8rEI0_5auDfaLE-OLnvWAdBoebDChfSIvzgsyZwWYUBPnTemXj8PE9q2GZ76n2uGmq7kldAK5ER3Huev_KfW_aRQ==&uniplatform=NZKPT&language=CHS (accessed on 28 October 2023).
  36. Cai, S.; Wang, Y.; Zhao, B.; Wang, S.; Chang, X.; Hao, J. The impact of the “Air Pollution Prevention and Control Action Plan” on PM2.5 concentrations in Jing-jin-ji region during 2012–2020. Sci. Total Environ. 2017, 580, 197–209. [Google Scholar] [CrossRef] [PubMed]
  37. Yu, Y.; Meng, X.; Wang, Z.; Zhou, W.; Yu, H.X. Driving Factors of the Significant Increase in Surface Ozone in the BeijingTianjin-Hebei Region, China, During 2013–2018. Environ. Sci. 2020, 41, 106–114. Available online: https://kns.cnki.net/kcms2/article/abstract?v=3uoqIhG8C44YLTlOAiTRKibYlV5Vjs7i8oRR1PAr7RxjuAJk4dHXot2dUe_qs-OAgXq5p_cFNrNkFyc1-JaYxQ8fwD_6nlrn&uniplatform=NZKPT (accessed on 28 October 2023).
  38. Qin, R.; Zhang, J.; Wang, Y.; Mao, J.; Zhang, H.; Sun, Y.; Chen, L.; Gao, S. Study on different time scales of PM2.5 and O3 concentrations in Hebei Province based on KZ filter. Acta Sci. Circumstantiae 2019, 39, 821–831. Available online: https://kns.cnki.net/kcms2/article/abstract?v=3uoqIhG8C44YLTlOAiTRKibYlV5Vjs7iLik5jEcCI09uHa3oBxtWoBWpHMNPzZR6HOwAoubvlizFTqnG2zJfGKpFUj8JbSzu&uniplatform=NZKPT (accessed on 28 October 2023).
Figure 1. Elevation map of the study area.
Atmosphere 14 01785 g001
Figure 2. Trends in the original series, short-term components, seasonal components, and long-term components of NO2, O3, PM10, and PM2.5 in the Fenwei Plain.
Atmosphere 14 01785 g002
Figure 3. Short-term, seasonal, long-term, and unknown contributions of NO2, O3, PM10, and PM2.5 in the Fenwei Plain.
Atmosphere 14 01785 g003
Figure 4. The long-term component of the original NO2 concentration in the Fenwei Plain and the long-term component of this concentration after meteorological adjustment.
Atmosphere 14 01785 g004
Figure 5. The long-term component of the original O3 concentration in the Fenwei Plain and the long-term component of this concentration after meteorological adjustment.
Atmosphere 14 01785 g005
Figure 6. The long-term component of the original PM10 concentration in the Fenwei Plain and the long-term component of this concentration after meteorological adjustment.
Atmosphere 14 01785 g006
Figure 7. The long-term component of the original PM2.5 concentration in the Fenwei Plain and the long-term component of this concentration after meteorological adjustment.
Atmosphere 14 01785 g007
Table 1. Estimated relative impact of emission reduction and meteorological variations on NO2 reduction in the Fenwei Plain from 2018 to 2022.
CityNO2 in 2018NO2 in 2022NO2 Decrease RateAdjusted NO2 in 2018Adjusted NO2 in 2022Adjusted NO2 Decrease RateRelative Impact of Meteorological Variations (%)Relative Impact of Emission Reduction (%)Long-Term Decline Rate of NO2 Concentration
LL43.4338.794.6443.4638.584.88−5.15%105.15%10.68%
JZ41.3931.789.6142.3032.1910.11−5.23%105.23%23.22%
LF38.2631.576.7038.5332.216.325.65%94.35%17.51%
YC28.4420.587.8629.4722.147.326.83%93.17%27.64%
BJ38.9327.4711.4638.5728.3110.2510.54%89.46%29.44%
TC33.8925.318.5833.5627.196.3725.72%74.28%25.32%
XY47.3935.4711.9245.9638.047.9233.56%66.44%25.15%
WN46.9535.0811.8846.8936.1210.779.34%90.66%25.30%
SMX36.4124.0712.3436.4525.8710.5714.29%85.71%33.89%
LY40.0825.2414.8440.7326.4014.333.41%96.59%37.03%
XA52.4037.2715.1352.2339.2213.0213.99%86.01%28.87%
Table 2. Estimated relative impact of emission reduction and meteorological variations on O3 reduction in the Fenwei Plain from 2018 to 2022.
CityO3 in 2018O3 in 2022O3 Decrease RateAdjusted O3 in 2018Adjusted O3 in 2022Adjusted O3 Decrease RateRelative Impact of Meteorological Variations (%)Relative Impact of Emission Reduction (%)Long-Term Decline Rate of O3 Concentration
LL101.92 92.78 9.14 98.30 90.22 8.08 11.57%88.43%8.97%
JZ115.69 113.72 1.97 110.24 111.61 −1.37 169.49%−69.49%1.70%
LF128.90 113.96 14.94 123.77 109.32 14.45 3.29%96.71%11.59%
YC128.29 117.69 10.61 122.37 113.97 8.40 20.78%79.22%8.27%
BJ99.42 98.11 1.32 94.92 94.29 0.64 51.66%48.34%1.33%
TC114.51 107.46 7.05 109.75 102.28 7.47 −5.93%105.93%6.16%
XY113.31 107.23 6.07 107.99 100.27 7.72 −27.09%127.09%5.36%
WN104.02 107.87 −3.85 102.66 102.30 0.36 109.36%−9.36%−3.70%
SMX113.26 111.30 1.96 113.36 105.22 8.13 −314.22%414.22%1.73%
LY115.49 113.44 2.05 114.86 107.81 7.05 −243.54%343.54%1.78%
XA104.91 104.42 0.49 99.19 99.20 −0.01 102.81%−2.81%0.47%
Table 3. Estimated relative impact of emission reduction and meteorological variations on PM10 reduction in the Fenwei Plain from 2018 to 2022.
CityPM10 in 2018PM10 in 2022PM10 Decrease RateAdjusted PM10 in 2018Adjusted PM10 in 2022Adjusted PM10 Decrease RateRelative Impact of Meteorological Variations (%)Relative Impact of Emission Reduction (%)Long-Term Decline Rate of PM10 Concentration
LL102.34 83.96 18.38 99.04 90.19 8.85 51.84%48.16%17.96%
JZ112.94 80.41 32.53 109.46 85.30 24.16 25.75%74.25%28.80%
LF122.10 73.78 48.33 118.09 79.37 38.72 19.89%80.11%39.58%
YC112.18 85.30 26.88 111.47 92.13 19.33 28.08%71.92%23.96%
BJ102.51 69.97 32.55 96.97 77.04 19.93 38.77%61.23%31.75%
TC95.95 70.80 25.15 92.60 75.23 17.37 30.94%69.06%26.21%
XY132.19 96.52 35.67 126.35 104.27 22.08 38.09%61.91%26.98%
WN131.06 90.29 40.77 127.74 97.45 30.29 25.70%74.30%31.11%
SMX111.77 74.93 36.84 113.96 78.25 35.71 3.07%96.93%32.96%
LY115.27 78.74 36.53 115.37 83.73 31.64 13.38%86.62%31.69%
XA117.77 87.80 29.97 112.17 96.58 15.59 47.98%52.02%25.45%
Table 4. Estimated relative impact of emission reduction and meteorological variations on PM2.5 reduction in the Fenwei Plain from 2018 to 2022.
CityPM2.5 in 2018PM2.5 in 2022PM2.5 Decrease RateAdjusted PM2.5 in 2018Adjusted PM2.5 in 2022Adjusted PM2.5 Decrease RateRelative Impact of Meteorological Variations (%)Relative Impact of Emission Reduction (%)Long-Term Decline Rate of PM2.5 Concentration
LL52.58 23.21 29.37 51.43 24.98 26.45 9.92%90.08%55.86%
JZ54.41 42.11 12.30 54.99 42.07 12.92 −5.05%105.05%22.61%
LF70.37 45.31 25.07 69.55 48.27 21.27 15.12%84.88%35.63%
YC61.33 47.24 14.09 64.74 50.28 14.46 −2.66%102.66%22.97%
BJ52.80 41.23 11.56 50.79 46.80 3.98 65.56%34.44%21.89%
TC49.64 34.95 14.69 49.33 39.82 9.51 35.22%64.78%29.59%
XY68.99 50.17 18.82 67.00 59.07 7.93 57.85%42.15%27.28%
WN59.65 48.86 10.79 57.98 54.18 3.80 64.75%35.25%18.09%
SMX59.06 42.18 16.88 61.46 43.95 17.51 −3.77%103.77%28.58%
LY61.35 42.82 18.52 61.19 45.59 15.59 15.83%84.17%30.19%
XA61.62 45.72 15.90 60.20 52.42 7.78 51.08%48.92%25.80%
Disclaimer/Publisher’s Note: The statements, opinions and data contained in all publications are solely those of the individual author(s) and contributor(s) and not of MDPI and/or the editor(s). MDPI and/or the editor(s) disclaim responsibility for any injury to people or property resulting from any ideas, methods, instructions or products referred to in the content.

