Brief Report

Surface Layer Turbulence at the Maidanak Observatory

1
Ulugh Beg Astronomical Institute of the Uzbekistan Academy of Sciences, Astronomy Str. 33, Tashkent 100052, Uzbekistan
2
Department of Astronomy and Astrophysics, Physics Faculty, National University of Uzbekistan, University Str. 4, Tashkent 100174, Uzbekistan
3
European Southern Observatory, Karl-Schwarzschild-Str. 2, 85748 Garching bei München, Germany
*
Author to whom correspondence should be addressed.
Atmosphere 2023, 14(12), 1779; https://doi.org/10.3390/atmos14121779
Submission received: 8 September 2023 / Revised: 22 November 2023 / Accepted: 29 November 2023 / Published: 1 December 2023
(This article belongs to the Special Issue The Impacts of Climate on Astronomical Observations)

Abstract

:
Results of night-time surface layer turbulence measurements using ESO LuSci at the Maidanak observatory are presented. Turbulence in the surface layer was evaluated at the Maidanak observatory using LuSci during the period of 2021–2022. The overall median DIMM-seeing was 0.74 arcseconds during this period. It was determined that the seeing in the surface layer up to 256 m equals 0.44 arcseconds. This corresponds to 42% of the contribution to the integral seeing in the entire atmosphere. A telescope installed at 6 m above the ground will be affected by 33% of the integral turbulence and about 79% of the surface layer one. Taking into account that the free atmosphere contributes around 30%, we conclude that around 30% of the overall seeing is contributed by the boundary layer above the Maidanak observatory.

1. Introduction

The Maidanak Observatory (66°56′ E, 38°41′ N) is located in the southeast of Uzbekistan, on the spurs of the Pamir-Alai mountain systems at an altitude of 2650 m above sea level. Mount Maidanak was chosen as an excellent site for a future observatory during long-term astroclimatic expeditions carried out in the high mountainous regions of Central Asia in the late 60s of the last century [1].
At the moment, the Maidanak Observatory has seven telescopes, and their location scheme is shown in Figure 1.
To this day, many atmospheric parameters have been studied at the Maidanak Observatory. Temperature, humidity, their distribution by season, atmospheric extinction, and sky background have been measured by different authors [2,3,4]. According to recent measurements, the amount of clear time is equal to 60% [5]. The average value of the wind speed in the surface layer at night is 3.6 m/s, and the night-time temperature varies between –5 °C in winter and +15 °C in summer. The average wind speed at the level of 200 mB is 27 m/s [6].
Knowledge about atmospheric turbulence is important for the effective functioning of astronomical observatories. As starlight travels through the Earth’s atmosphere, atmospheric turbulence causes variations in the star’s appearance. The optical turbulence of the atmosphere is characterized by astronomical seeing measured in arcseconds. The theory of locally homogeneous and isotropic turbulence was founded in 1941 by Kolmogorov [7,8] and Obukhov [9]. Further development of the theory of turbulence is presented in the book by Monin and Yaglom [10,11]. In the middle of the 1970s, Tatarsky outlined the theory of wave propagation in a medium with random inhomogeneities of the refractive index and also analyzed experimental data on the propagation of radio waves, light, and sound in the atmosphere [12]. Fried further established that the most significant part of the wavefront distortion caused by atmospheric turbulence is the random tilt of the plane wavefront. He outlined a method for calculating the effect of wavefront distortion on optical systems [13]. The theory of atmospheric turbulence measurements was developed by Roddier [14]. This theory was implemented for seeing measurements as the Differential Image Motion Monitor (DIMM) created at ESO [15].
Based on these theories and recommendations, the astronomical seeing was measured in two periods at the Maidanak Observatory. One of the ESO DIMM instruments, previously used for seeing measurements at Chilean observatories, was utilized at the Maidanak Observatory from 1996 to 2003 [16].
The second period of seeing observations began in August 2018 [17,18]. Measurements were made using a modified version of DIMM on the same 6 m-high platform. The energy spectra of atmospheric turbulence for the C n 2 parameter were also studied in 2021 [19].
The Earth’s atmosphere can be divided into three layers in terms of turbulent optical properties [20]: surface layer, boundary layer, and free atmosphere. Since telescopes in observatories are installed in the surface layer, knowing the amplitude of turbulence in the surface layer is important. Surface layer turbulence has the greatest impact on astronomical observations and limits the performance of adaptive optics. Therefore, it is important to estimate the value of turbulence in the surface layer of the atmosphere and its contribution to the entire atmosphere.
The first attempt of surface layer optical turbulence measurements at Maidanak was made during July and September 1991. For C T 2 measurements in the ground layer, four differential fast-response micro-thermometers were used with probes attached to the meteorological mast at altitudes h = 2, 10, 33, and 50 m. The acoustically calibrated sodar LATAN-1 was used for C T 2 measurements in the boundary layer at altitudes h from 36 up to about 500 m above the summit (with a vertical step of 17 m) [21]. Based on this research and the comparison of two instruments, Ehgamberdiev et al. [16] found that the first 1.9–3.4 m layer contributes about 20% to the total seeing, and the 3.4–6 m layer contribution is 10%.
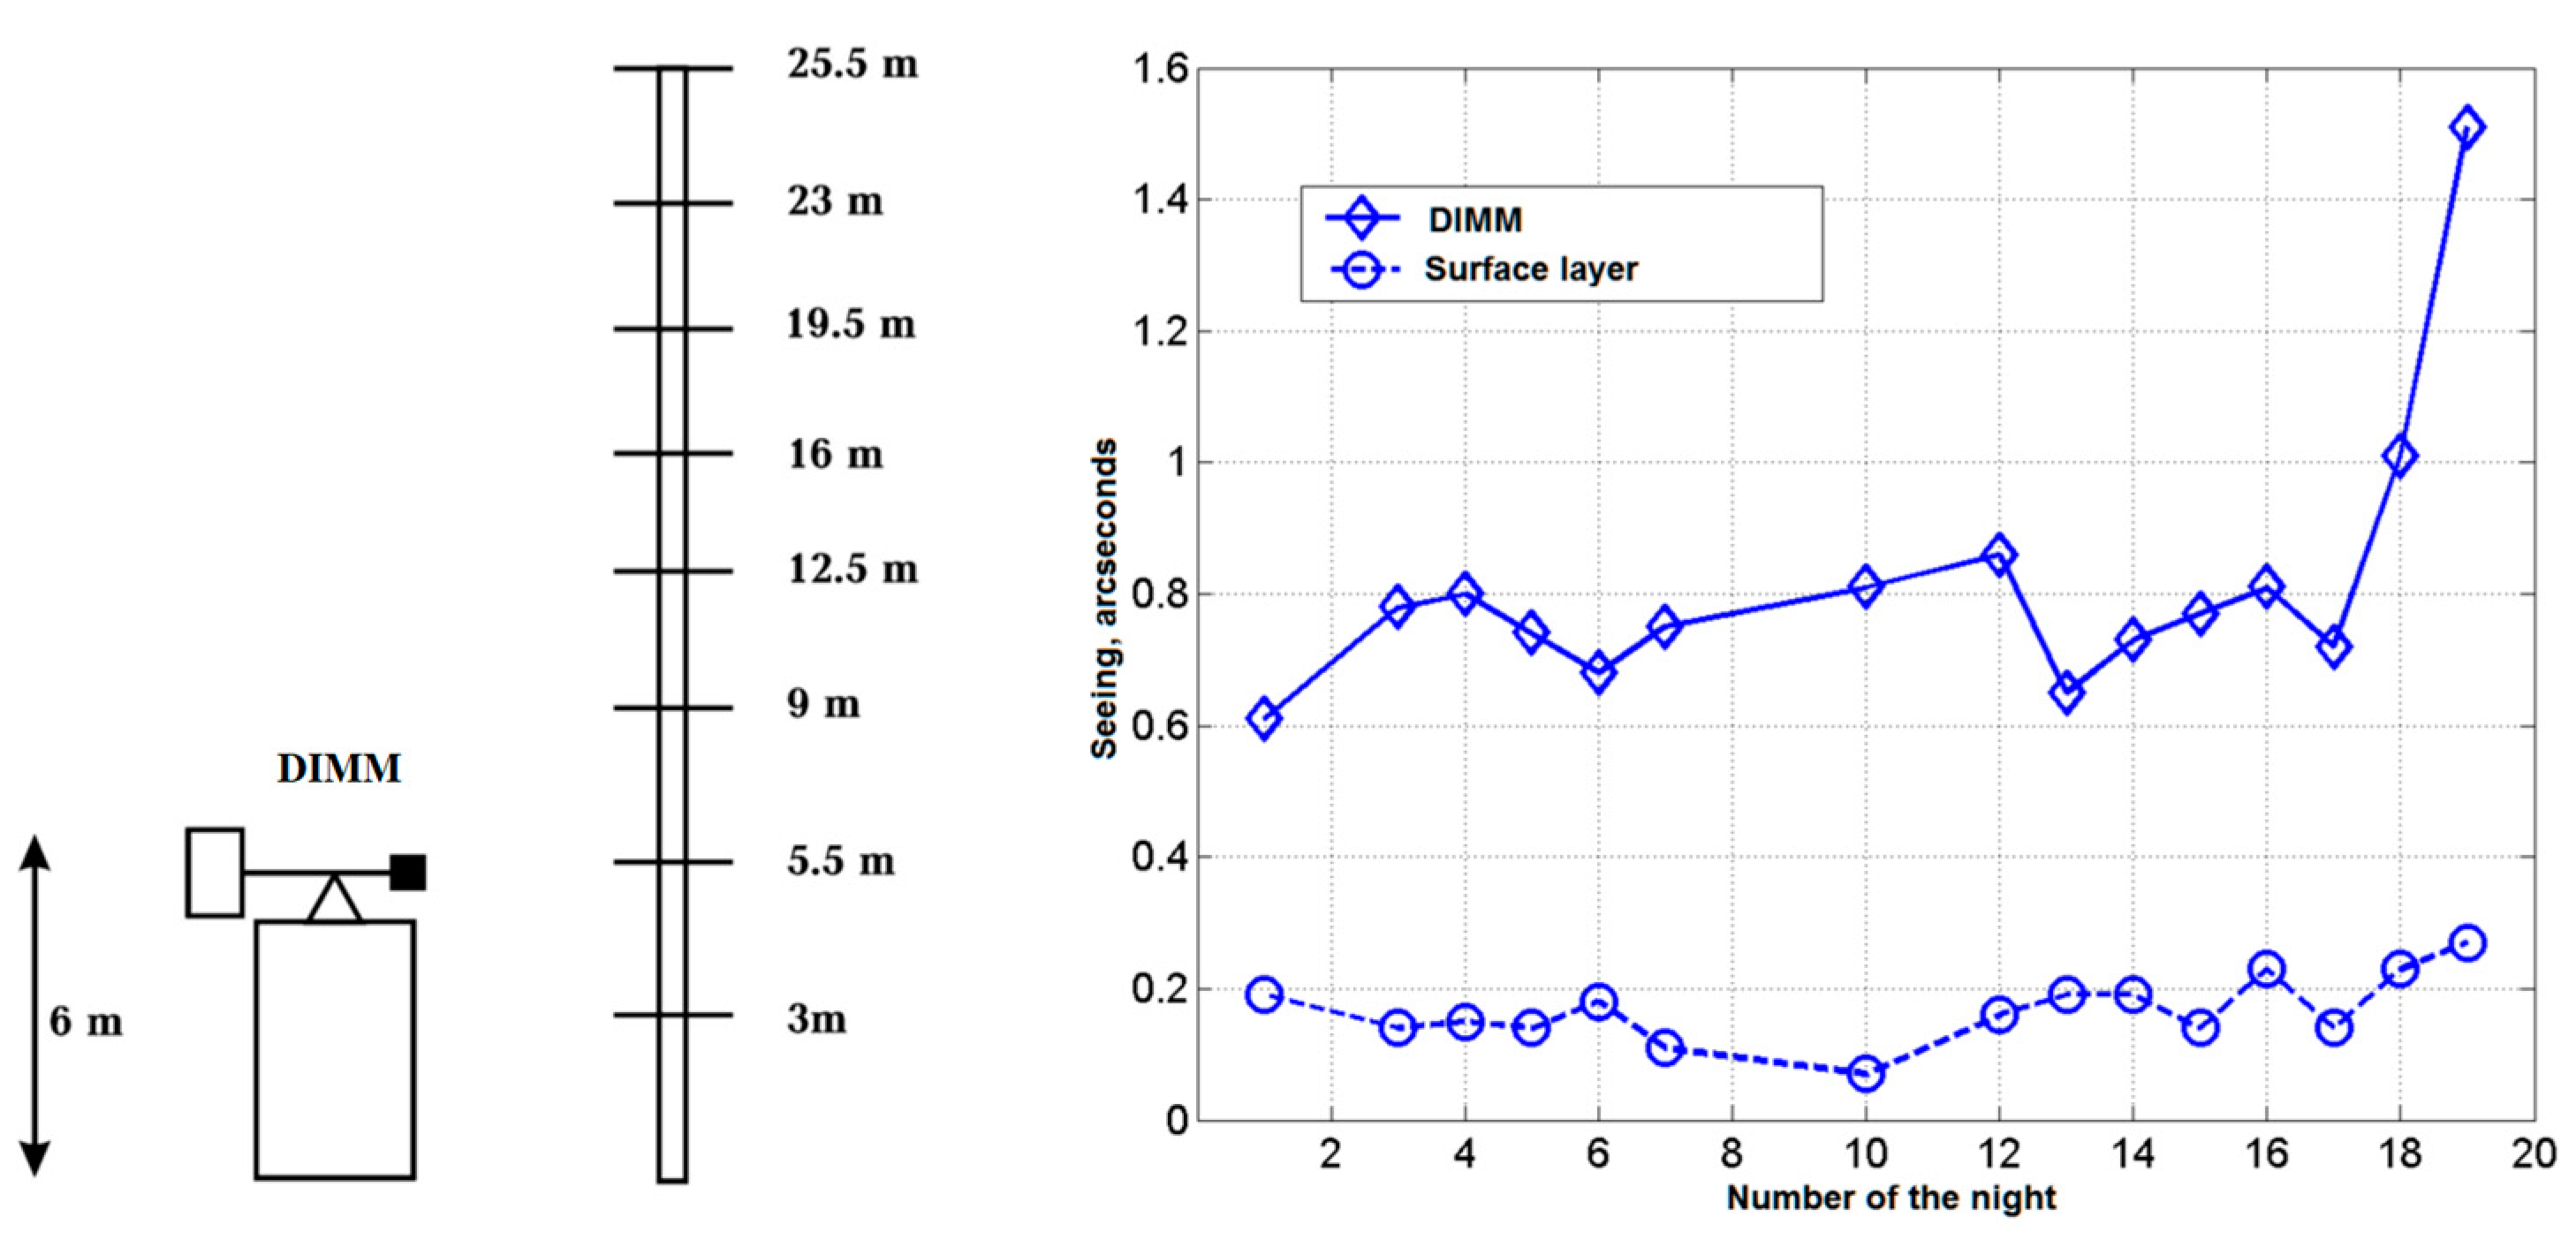
Optical turbulence in the surface layer was previously measured at Maidanak in July and August 2002 using micro-temperature sensors created at the University of Nice [22]. Highly sensitive temperature sensors were mounted on eight levels ranging in height from 3.0 to 25.5 m. They measured the structure constant of the temperature field, C T 2 , which transformed into the structure constant of the refractive index, C n 2 . Total atmospheric seeing was measured simultaneously by DIMM at the level of the lowermost temperature sensor. A comparison showed that the contribution of the layer in-between 5.5 ÷ 25.5 m to the total seeing was about 8% (Figure 2, graph in the right side).
In 2006, the contribution of the upper atmospheric layers to the overall seeing was measured using the multi-aperture scintillation sensor (MASS) [23]. Based on the comparison with ESO-DIMM turbulence measurements, it was determined that the turbulence inside the boundary layer, up to an altitude of 500 m [24] above the surface, accounted for around 65% of the total turbulence. Specifically, the ground layer, spanning the initial 200–300 m above the ground, contributed approximately 50% of the overall turbulence. The authors found in this study that the free atmosphere accounts for less than 30% in power. Tokovinin and Travouillon (2006) reported a similar contribution from the boundary layer at Cerro Pachon [24].
In this research, we describe the results of optical turbulence measurements in the surface layer of the Maidanak Observatory carried out during 2021–2022, using a lunar scintillometer. The study was triggered by a 4 m optical telescope site survey project [25].

2. Method

The initial solar scintillometer was developed by Beckers et al. [26] in 1997, utilizing the observed strong relationship between sunlight scintillation and daytime seeing [27]. An array of scintillometers was used to measure the C n 2 (h) profile with height, evaluating daytime atmospheric seeing by taking measurements of the scintillation of sunlight. It was suggested that a similar technique could be used for nighttime observations using the Moon.
In the later work of J. Beckers [28], he described a Solar Differential Image Motion Monitor (S-DIMM) which was used together with an array of detectors for solar scintillation measurements (Shabar). By integrating the results from the S-DIMM instrument with scintillation measurements, the author was able to determine the proportions of atmospheric seeing attributed to the free atmosphere and the ground layer.
Using a similar device for nighttime measurements, Hickson and Lanzetta (2004) proposed a lunar scintillometer [29]. After that, A. Tokovinin and others developed the CTIO Lunar scintillometer (LuSci) [30,31,32].
In order to measure optical parameters at Paranal, observations were made for 10 nights in December 2007 using LuSci and five independent instruments [33]. In 2012, the SL–SLODAR prototype was tested together with LuSci, while LuSci has been used for observations at Paranal since 2008 [34,35]. Until 2011, LuSci was periodically transported from Paranal to Armazones for data acquisition. LuSci was then modified for remote control from Paranal to Armazones [36]. In addition, Indian scientists also built their own LuSci device and carried out measurements [37].
In Maidanak, turbulence in the surface layer is measured using the European Southern Observatory lunar scintillometer (ESO LuSci). LuSci consists of a linear array of six photodiodes at different distances from each other, making fast measurements of fluctuations of moonlight. Each photodiode transmits the measured values to a computer digitally via a junction box. Comparing the values of each photodiode with the values of other photodiodes allows us to determine the turbulence at different heights above the ground. LuSci measures the turbulence on the surface layer as values of C n 2 at heights of 4, 16, 64, and 256 m.
Moon phase is very important for LuSci. The LuSci instrument observes nights from the first quarter phase to the last quarter phase. In this case, the Moon phase should be 40% or more. This period occurs about 14 to 15 nights every month.
Seeing observations are also carried out using DIMM together with LuSci. During the LuSci observation period, observations are made with the second DIMM at a height of 6 m (Figure 3).

3. Results

The time period covered by LuSci observations is 2021–2022. In addition, simultaneous observations were conducted with DIMM. The total number of DIMM seeing measurements was 31,843, whereas the number of seeing measurements by LuSci was 4645.
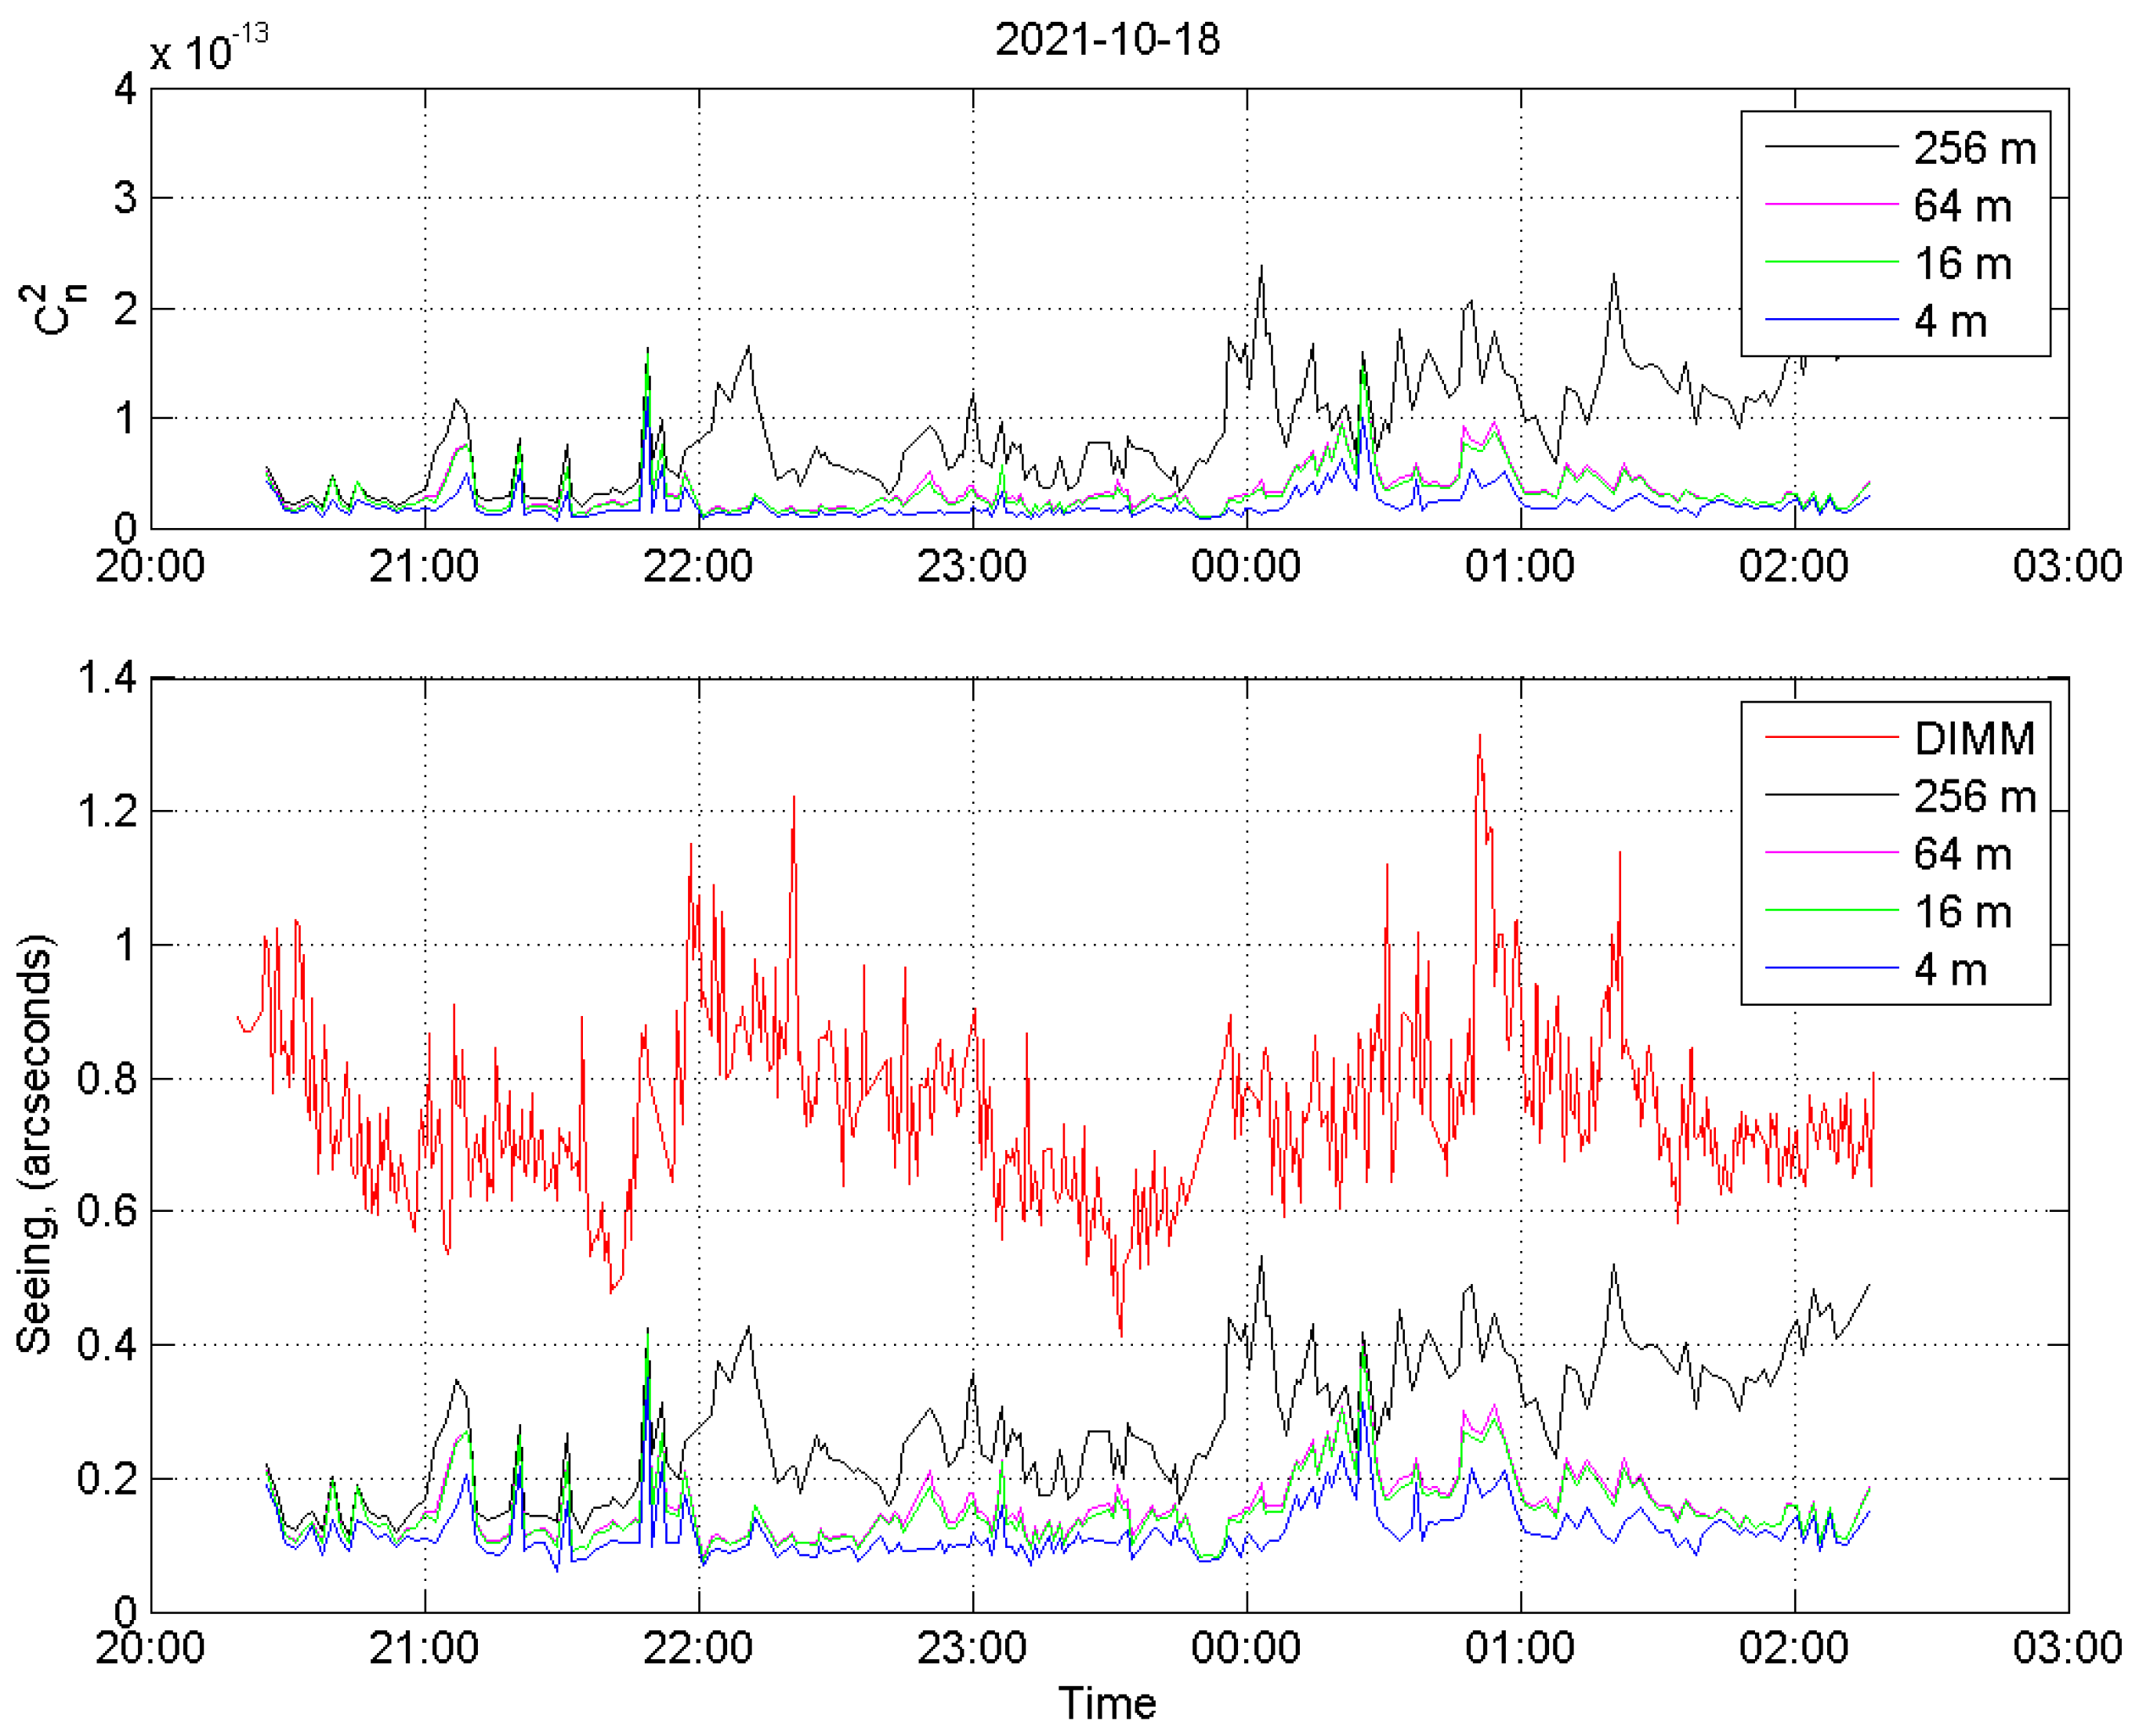
Figure 4 (bottom) shows the seeing values measured by LuSci and DIMM on 18 October 2021. In this figure, seeing at different heights are represented by different colors, with DIMM measurements shown in red. On this night, more than six hours of observation were carried out with both instruments. As one can see from the graph, there is a clear correlation between LuSci and DIMM measurements. Most of the time, when LuSci measurements increase, DIMM measurements increase, and when LuSci measurements decrease, DIMM measurements also decrease. On this night, it was determined that the seeing in the surface layer of the atmosphere was 0.50 arcseconds, and the seeing in the entire atmosphere was 0.73 arcseconds. It can be seen that the seeing in the surface layer of the atmosphere was 53% of the seeing in the whole atmosphere. The C n 2 parameter for this night is also shown at the top of Figure 4. The C n 2 parameter is strongly correlated, as are the seeing values in the surface layer corresponding to different heights.
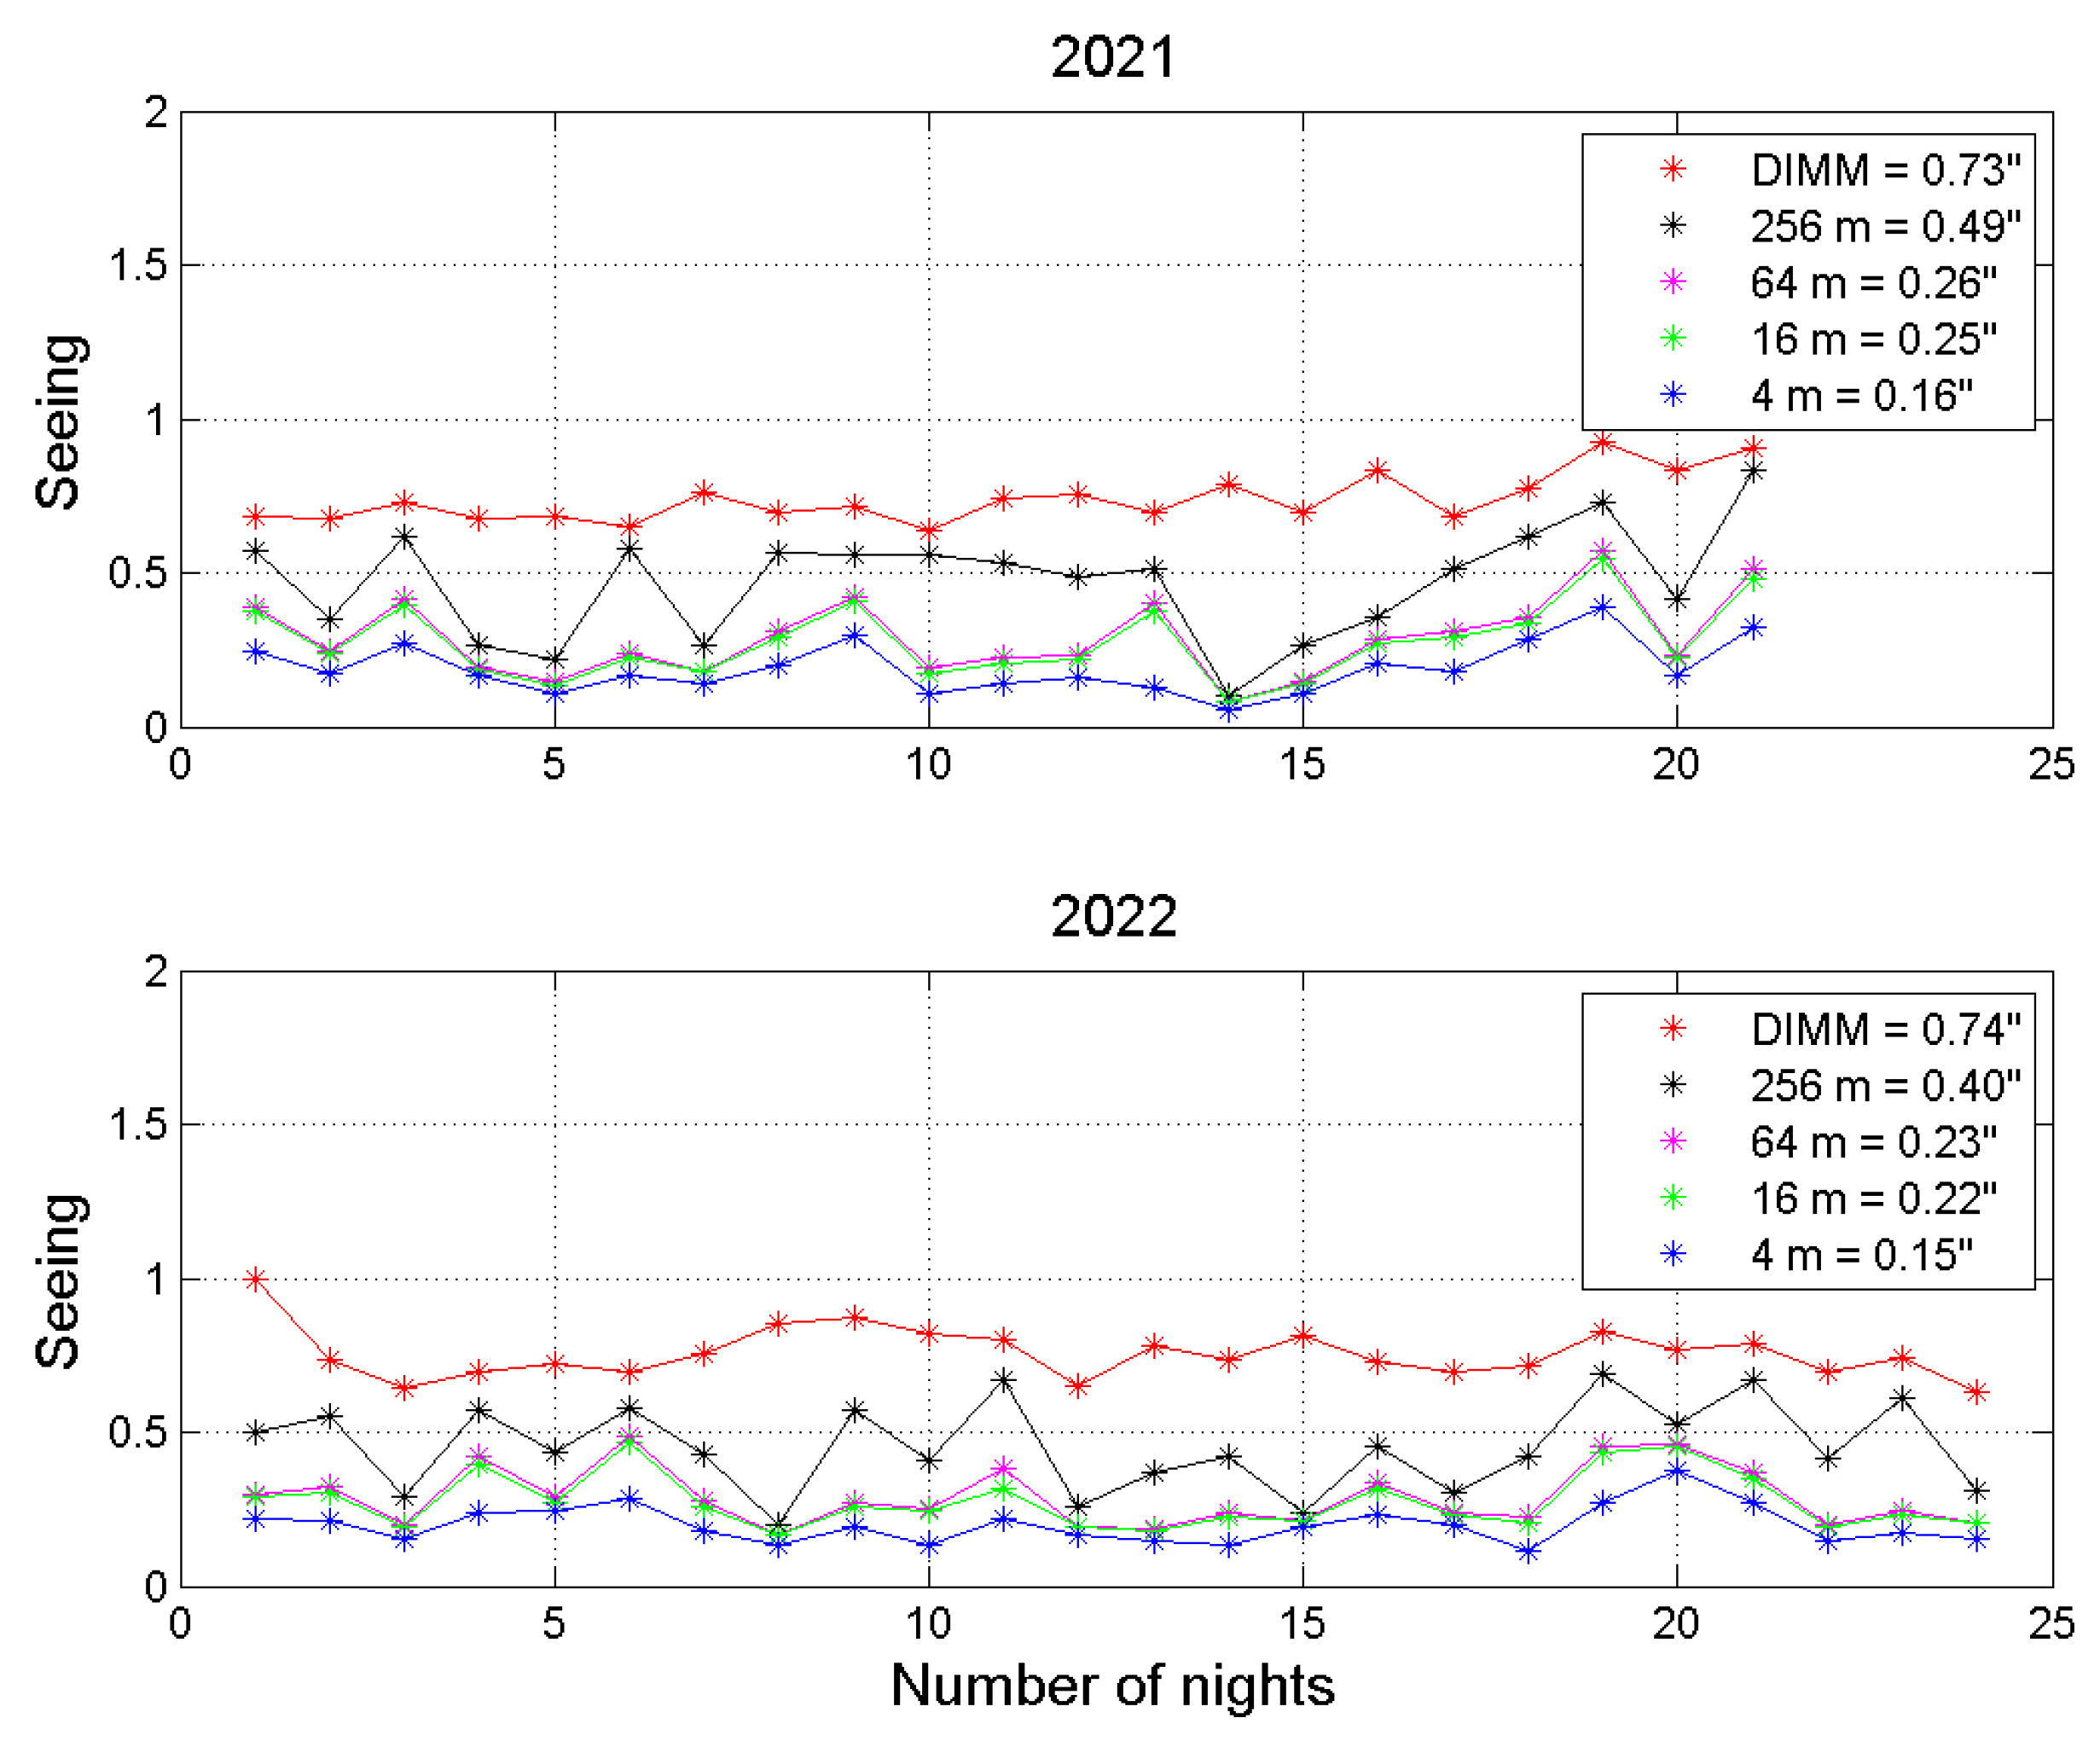
In 2021, a total of 21 nights of observations were made using LuSci. In 2022, 24 nights of observation were conducted and we also provided DIMM measurements for these nights. In 2021, observations were carried out with LuSci between August and December. In 2022, observations were carried out between April and October. Over the period 2021–2022, a total of 45 nights of surface layer seeing were measured using LuSci. The results of seeing measurements with LuSci and DIMM at the Maidanak Observatory in 2021–2022 are shown in Figure 5. Both results are presented in arcseconds units. The figure shows nightly median values of seeing measured at each height. DIMM measurements are shown in red, while LuSci values of seeing at different heights of 4 m (blue), 16 m (green), 64 m (purple), and 256 m (black) are presented. In 2021, the surface layer seeing measured at different heights was found to be 0.16 arcseconds at the first 4 m, 0.25 arcseconds at 16 m, 0.26 arcseconds at 64 m, and 0.49 arcseconds at 256 m. At the same time, DIMM seeing was found to be 0.73 arcseconds during this period. In 2022, the surface layer seeing of the atmosphere at different heights was 0.15 arcseconds at the first 4 m, 0.22 arcseconds at 16 m, 0.23 arcseconds at 64 m, and 0.40 arcseconds at 256 m, with DIMM seeing found to be 0.74 arcseconds. The median value of total surface layer seeing for the entire period (2021–2022) is 0.44 arcseconds, with an average seeing of 0.46 arcseconds (Table 1). The table also compares seeing at these altitudes to the seeing in the whole atmosphere and provides C n 2 values at these altitudes. All seeing measurements in DIMM and LuSci are for a wavelength of 500 nm.
During this period, the median value of the seeing measured by the DIMM is 0.74 arcseconds, with an average value of 0.76 arcseconds. It can be seen that the largest contribution to seeing in the entire atmosphere corresponds to the surface layer; that value is 42%. The remainder of seeing in other layers of the atmosphere is 58%. We compared these statistics with measurements from other observatories. For example, the contribution of surface layer optical turbulence to the integral seeing at the Paranal Observatory is 35–60%, while it is 60% at Mauna Kea, 63% at La Palma, and 11% at IAO. It can be seen that our measured values are close to those of leading observatories.

4. Discussion

We found a reasonable correlation between LuSci and DIMM-measured turbulence intensity. However, this correlation decreased on some nights (see Figure 5). On some nights, when the night-time median seeing measured by DIMM increases, the seeing measured by Lusci decreases. This reduction may be related to the boundary layer and the free atmosphere.
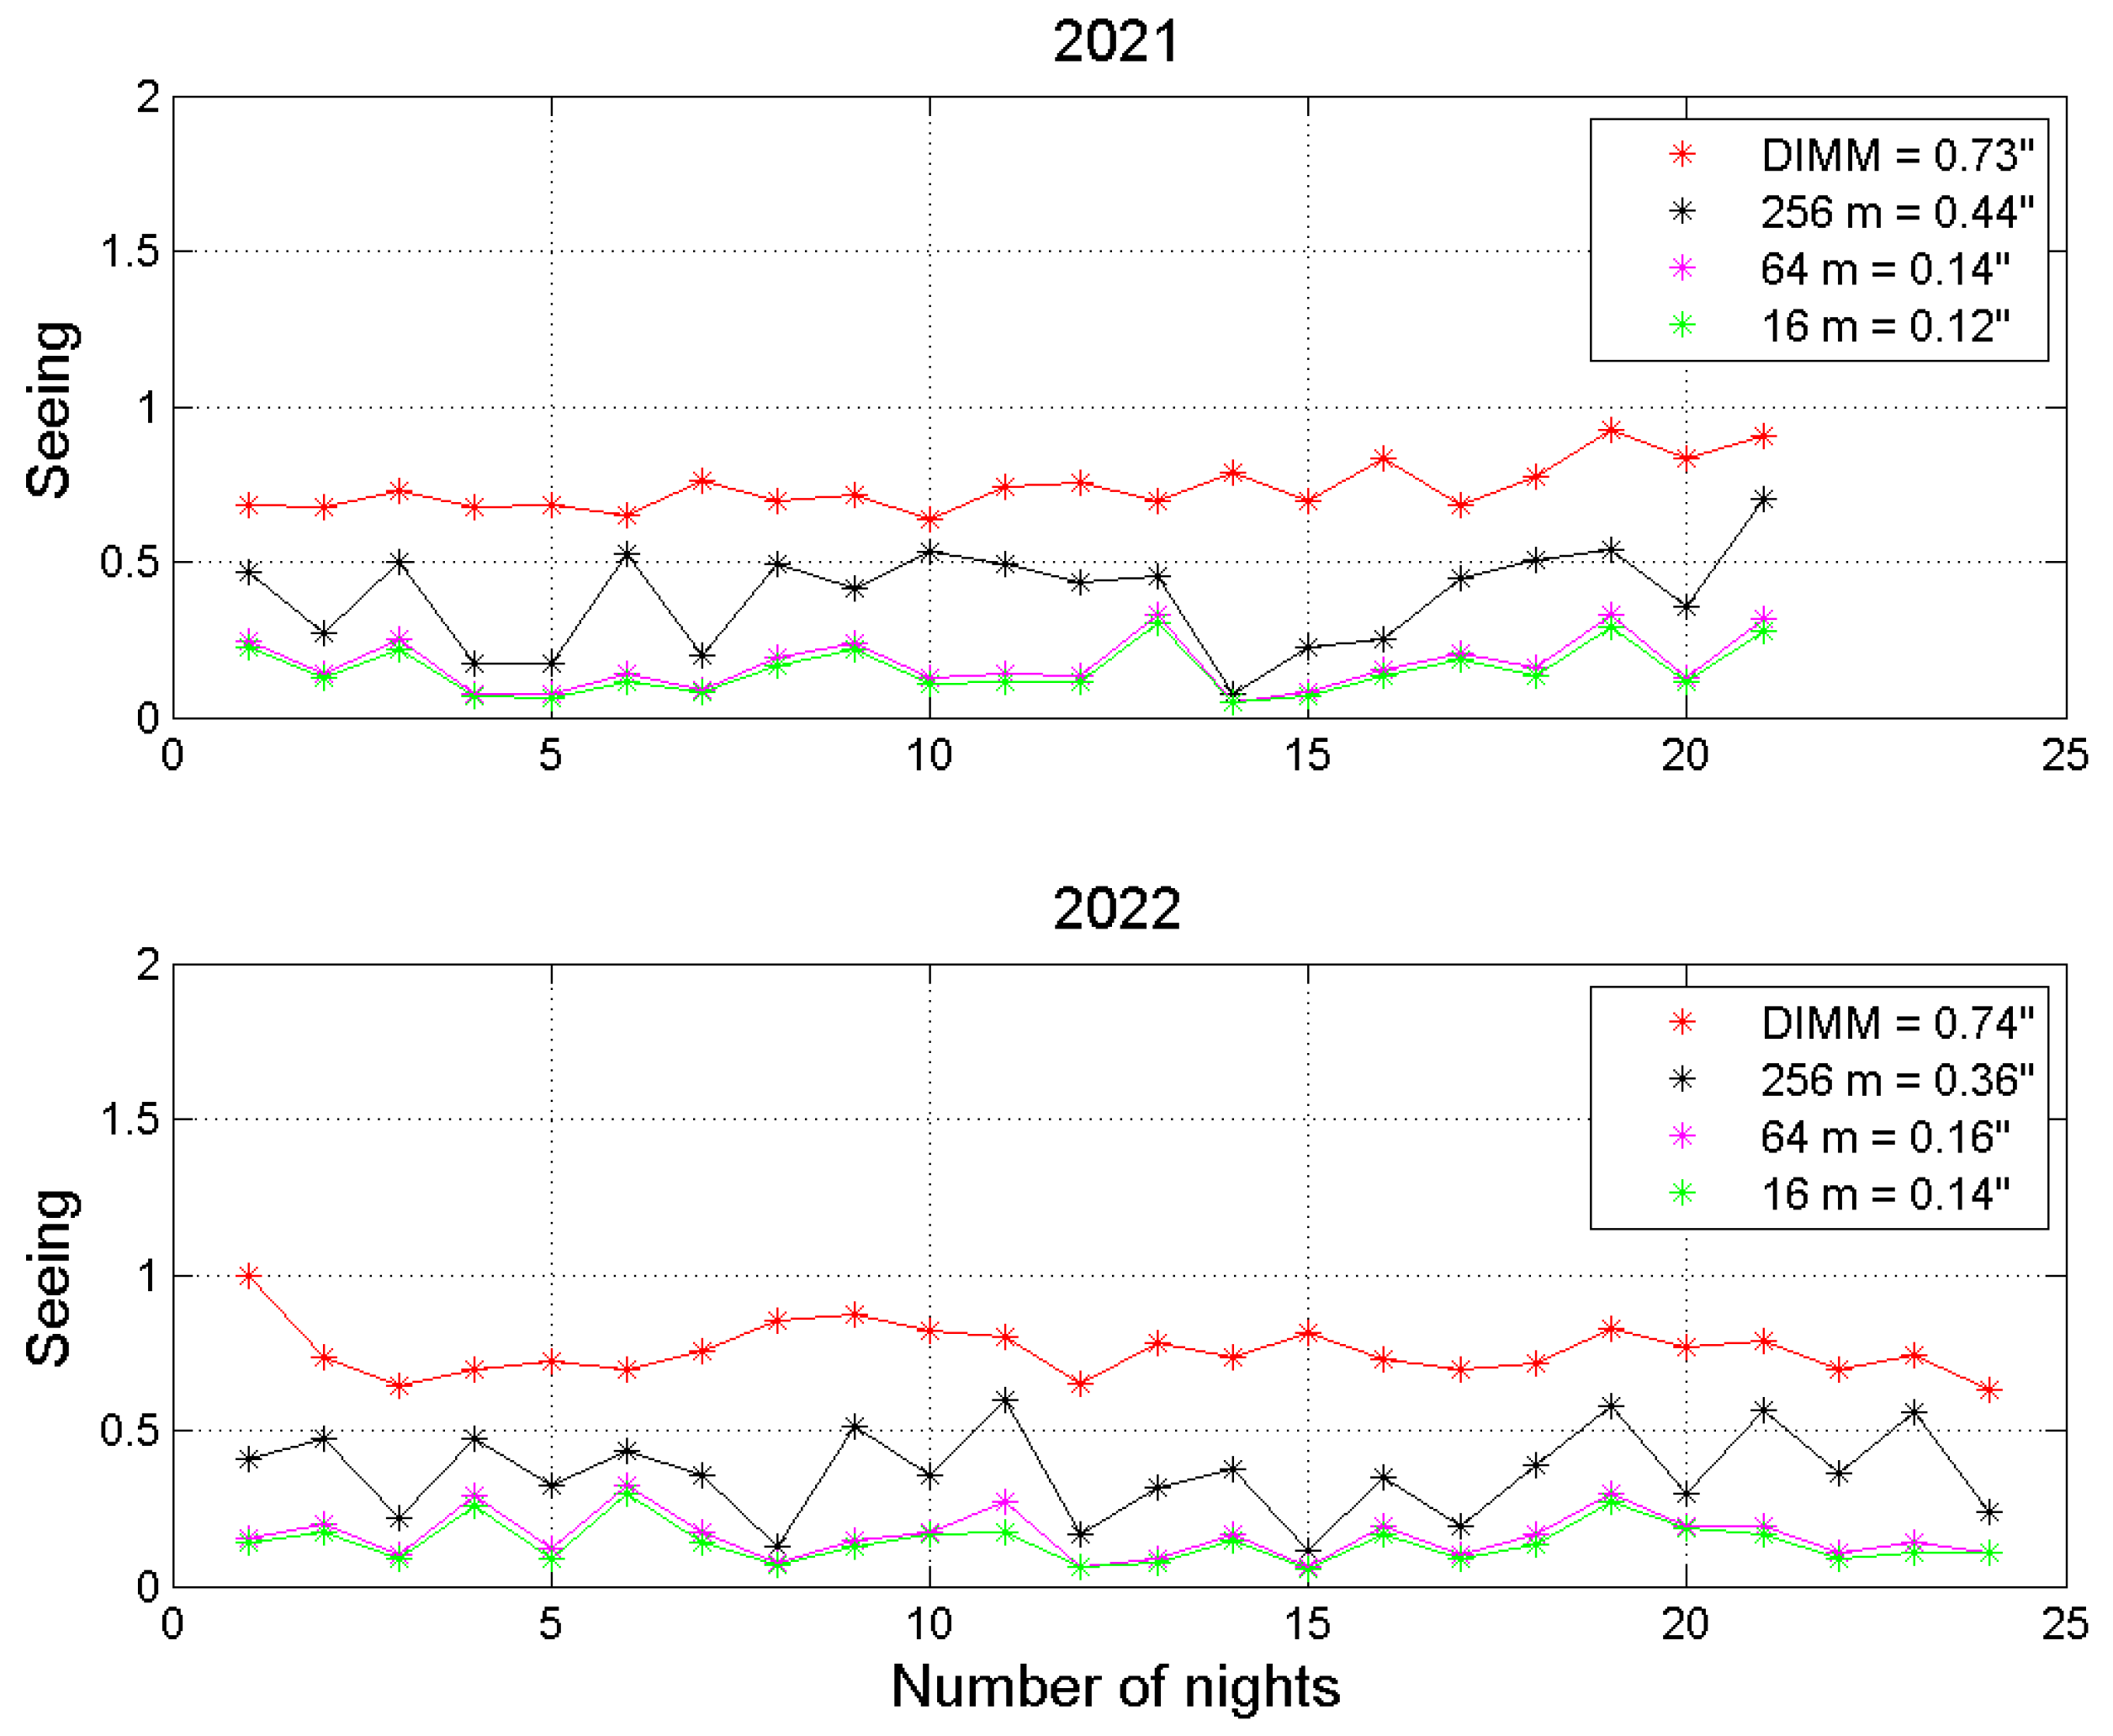
According to the results of previous studies [16], the first 6 m layer may contribute about 30% to the total seeing. That is why the recommended minimum height for a future telescope is at least 6 m from the ground. The height of the DIMM platform at the Maidanak Observatory is 6 m and it measures seeing from exactly 6 m to the upper boundary of the atmosphere. Using the seeing values measured by Lusci at 4 m and 16 m, we estimated turbulense intensity at 6 m through interpolation. We subtracted these values from the seeing values at each height, providing the median seeing for each night (Figure 6). As a result, we estimated the seeing values at 6 ÷ 16 m, 6 ÷ 64 m, and 6 ÷ 256 m heights for each night.
At the same time, we calculated these values for the entire observation period (Table 2). In this case, we took the seeing value at a height of 6 m as the zero-point. The resulting values are as follows: median values of seeing at heights of 6 ÷ 16 m, 6 ÷ 64 m, and 6 ÷ 256 m are 0.13 arcseconds, 0.15 arcseconds, and 0.38 arcseconds, respectively. These values were 5%, 7%, and 33% of the measured seeing (DIMM seeing) for the entire atmosphere. It can be seen that the seeing in the surface layer of the atmosphere above 6 m is 33% of the seeing in the whole atmosphere. If a new telescope is installed at the Maidanak Observatory with a minimum height of 6 m, the contribution of the surface layer of the atmosphere affecting the telescope will be 33%. If the telescope is installed at 16 m, this effect decreases by 5.5% to 27.5%.
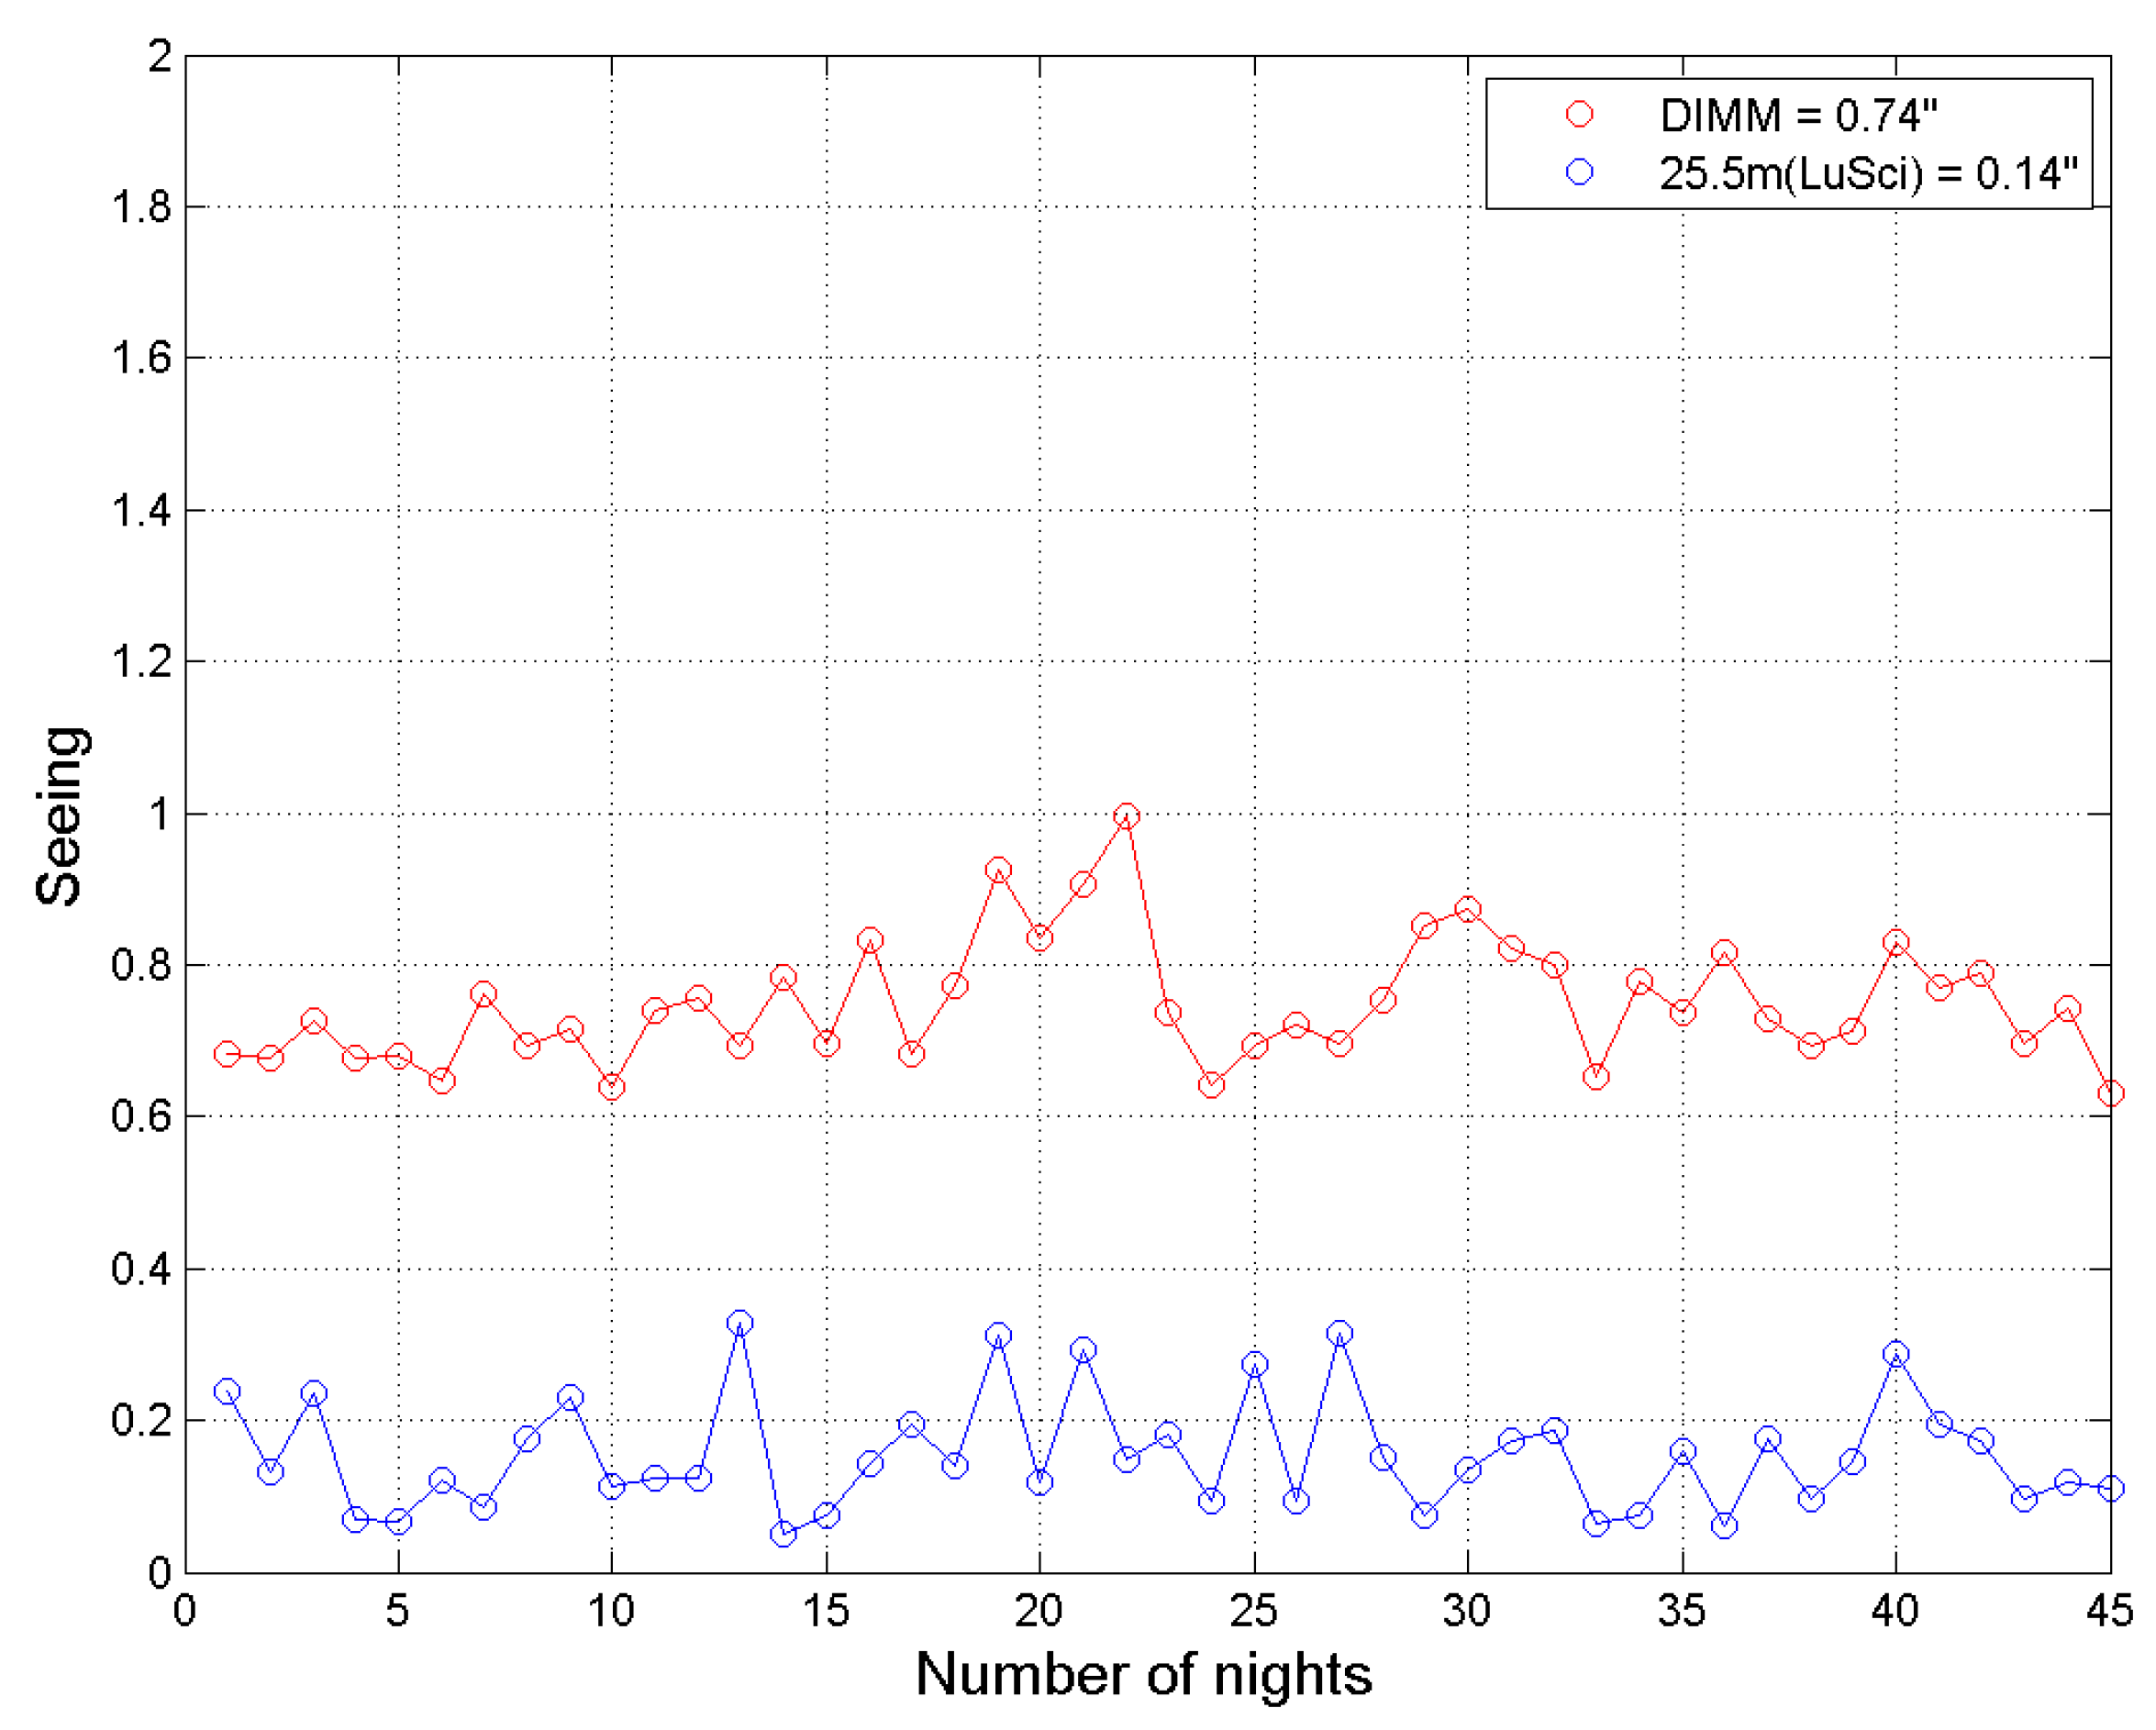
We also compared the results obtained using the new LuSci with those from 2002, using micro-temperature sensors. The micro-temperature sensors measured the surface layer seeing in the range of 5.5 ÷ 25.5 m (see Figure 2). Using LuSci-measured seeing values at 4 m, 16 m, and 64 m heights, we found the seeing at 5.5 m and 25.5 m heights using the interpolation method. From these values, we estimated seeing in the range of 5.5 ÷ 25.5 m (Figure 7).
We calculated the values of this seeing for each night and found that the median value of the seeing in the surface layer between these bands for the entire period is 0.14 arcseconds. The DIMM seeing for this period is 0.74 arcseconds. Hence, for heights of 5.5 ÷ 25.5 m, the seeing in the surface layer is 6% of the seeing in the whole atmosphere. If we compare this result with the one obtained in 2002 (8%), both values are very close to each other and agree well. It can be seen that the seeing in this surface layer was accurately estimated by the method of micro–temperature sensors in 2002.

5. Conclusions

Turbulence of the surface layer was evaluated for the first time at the Maidanak Observatory using LuSci. Observations were carried out in 2021–2022.
We have presented the values of seeing at different heights (4 m, 16 m, 64 m, and 256 m) in the surface layer. We also present our results from synchronous observations with DIMM during this period and estimate the contribution of the seeing in the surface layer to the whole atmosphere. We also calculated the seeing at heights of 5.5 m, 6 m, and 25.5 m and between these heights using the interpolation method, compared them with previous results.
A total of 45 nights of observations were conducted using LuSci during 2021–2022. During the nightly observations, we obtained 4645 values in LuSci. We compared these seeing measurements with DIMM measurements. As a result of this comparison, we found a clear correlation between both measurements.
During the entire observation period, the value of seeing in the surface layer was 0.44 arcseconds, while the seeing measurements on the DIMM was 0.74 arcseconds.
The surface layer’s seeing accounted for 42% of the total atmospheric seeing. Considering that the free atmosphere contributes around 30%, another 25–30% of the contribution to the overall seeing is made by a thin boundary layer above the Maidanak Observatory.
Using the interpolation method with LuSci values, we found seeing at 5.5 m and 25.5 m heights and estimated the surface layer turbulence in this range. Thus, the seeing of the surface layer at 5.5 ÷ 25.5 m was 6% of the seeing of the entire atmosphere. This aligns with the results of the surface layer seeing measured in 2002.
Using the interpolation method, we estimated the contribution of seeing for different layers starting from 6 m in the surface layer of the atmosphere. We estimated the contribution of the surface layer effect for future telescopes. According to the results, if the new telescope is installed at a height of 6 m, the effect of the surface layer can decrease up to 10%.

Author Contributions

Y.T. and M.S. compiled a mutual agreement between ESO and UBAI to deliver LuSci to Maidanak, tested the equipment, and checked the data processing algorithm. Y.T. and Y.R. organized and managed observations. A.A., S.E. and S.I. participated in observations, data processing, and article writing. M.S. participated in the writing of the article. All authors have read and agreed to the published version of the manuscript.

Funding

This research received no external funding.

Institutional Review Board Statement

Not applicable.

Informed Consent Statement

Not applicable.

Data Availability Statement

We will post the information on our website http://www.astrin.uz/ follow the link.

Acknowledgments

Y.T. thanks the Uzbekistan Agency of Innovative development and ESO for the support of his research stay in 2019 at ESO-Garching. We thank ESO for providing LuSci for measurements at Maidanak. Our special thanks to A. Hafizov and S.B. Tursunkulov for their help in initial LuSci measurements. We are grateful to R. Murtazin, O. Abdullayev, O. Yuldashev, and R. Xazratov for DIMM and LuSci observations.

Conflicts of Interest

The authors declare no conflict of interest.

References

  1. Shevchenko, V.S. Results of astroclimatic observations on Mount Maidanak (Astroclimatic, site, calibration and atmospheric optics conditions for large telescope observations on M. Maidanak). Astron. Zh. 1973, 50, 632–644. [Google Scholar]
  2. Kardopolov, V.I.; Filipev, G.K. About the transparency of the atmosphere and the background of the night sky on the city of Maidanak. Lett. Astron. J. 1979, 5, 106–109. [Google Scholar]
  3. Ilyasov, S.; Tillayev, Y. The atmospheric conditions of the Maidanak Observatory in Uzbekistan for ground-based observations. In Proceedings of the International Conference on Space Information Technology, Beijing, China, 26–27 November 2009; p. 76511N. [Google Scholar]
  4. Artamonov, B.P.; Bruevich, V.V.; Gusev, A.S.; Ezhkova, O.V.; Ibrahimov, M.A.; Ilyasov, S.P.; Potanin, S.A.; Tillaev, Y.A.; Ehgamberdiev, S.A. Seeing and atmospheric extinction at Mt. Maidanak observatory from observations with the 1.5-m AZT-22 telescope. Astron. Rep. 2010, 54, 1019–1031. [Google Scholar] [CrossRef]
  5. Tillayev, Y.; Azimov, A.; Ehgamberdiev, S.; Ilyasov, S. Astronomical Seeing and Meteorological Parameters at Maidanak Observatory. Atmosphere 2023, 14, 199. [Google Scholar] [CrossRef]
  6. Ilyasov, S.; Tillayev, Y.; Egamberdiev, S. On the high altitude wind speed above the Mount Maidanak. In Proceedings of the SPIE, 7th International Symposium on Atmospheric and Ocean Optics, Tomsk, Russia, 19–22 July 2000; Volume 4341, pp. 181–184. [Google Scholar]
  7. Kolmogorov, A.N. Local structure of turbulence in an incompressible fluid at very high Reynolds numbers. Proc. USSR Acad. Sci. 1941, 30, 299–303. [Google Scholar] [CrossRef]
  8. Kolmogorov, A.N. Energy spectrum of turbulent velocity pulsations at arbitrary values of fluid viscosity. Proc. USSR Acad. Sci. 1941, 32, 19–21. [Google Scholar]
  9. Obukhov, A.M. On the distribution of energy in the spectrum of a turbulent flow. Proc. USSR Acad. Sci. Geogr. Geophys. Ser. 1941, 32, 22–24. [Google Scholar]
  10. Monin, A.S.; Yaglom, A.M. Statistical Hydromechanics; Nauka Press: Moscow, Russia, 1965; Volume 1, 639p. [Google Scholar]
  11. Monin, A.S.; Yaglom, A.M. Statistical Hydromechanics; Nauka Press: Moscow, Russia, 1967; Volume 2, 720p. [Google Scholar]
  12. Tatarsky, V.I. Wave Propagation in a Turbulent Atmosphere; Nauka Press: Moscow, Russia, 1967; 583p. [Google Scholar]
  13. Fried, D.L. Statistics of a Geometric Representation of Wavefront Distortion. J. Opt. Soc. Am. 1965, 55, 1427–1431. [Google Scholar] [CrossRef]
  14. Roddier, F. The Effects of Atmospheric Turbulence in Optical Astronomy. Prog. Opt. 1981, 19, 281–376. [Google Scholar]
  15. Sarazin, M.; Roddier, F. The ESO differential image motion monitor. Astron Astrophys. 1990, 227, 294–300. [Google Scholar]
  16. Ehgamberdiev, S.A.; Baijumanov, A.K.; Ilyasov, S.P.; Sarazin, M.; Tillayev, Y.A.; Tokovinin, A.A.; Ziad, A. The astroclimate of Maidanak Observatory in Uzbekistan. Astron. Astrophys. Suppl. Ser. 2000, 145, 293–304. [Google Scholar] [CrossRef]
  17. Tillayev, Y.; Azimov, A.; Hafizov, A. Astronomical Seeing at Maidanak Observatory during the Year 2018. Galaxies 2021, 9, 38. [Google Scholar] [CrossRef]
  18. Azimov, A.M.; Tillayev, Y.A.; Ehgamberdiev, S.A.; Ilyasov, S.P. Astronomical seeing at Maidanak Observatory with differential image motion monitor. J. Astron. Telesc. Instrum. Syst. 2022, 8, 047002. [Google Scholar] [CrossRef]
  19. Shikhovtsev, A.Y.; Kovadlo, P.G.; Kopylov, E.A.; Ibrahimov, M.A.; Ehgamberdiev, S.A.; Tillayev, Y.A. Energy Spectra of Atmospheric Turbulence for Calculating Cn2 Parameter. I. Maidanak and Suffa Observatories in Uzbekistan. Atmosphere 2021, 12, 1614. [Google Scholar] [CrossRef]
  20. Stull, R.B. An Introduction to Boundary Layer Meteorology; Springer Science & Business Media: Berlin/Heidelberg, Germany, 1988. [Google Scholar]
  21. Gur’Yanov, A.E.; Kallistratova, M.A.; Kutyrev, A.S.; Petenko, I.V.; Shcheglov, P.V.; Tokovinin, A.A. The contribution of the lower atmospheric layers to the seeing some mountain observatories. Astron. Astrophys. 1992, 262, 273–281. [Google Scholar]
  22. Marks, R.; Vernin, J.; Azouit, M.; Briggs, J.; Burton, M.; Ashley, M.; Manigault, J. Antarctic site testing—Microthermal measurements of surface-layer seeing at the South Pole. Astron. Astrophys. Suppl. 1996, 118, 385–390. [Google Scholar] [CrossRef]
  23. Kornilov, V.; Ilyasov, S.; Vozyakova, O.; Tillaev, Y.; Safonov, B.; Ibragimov, M.; Shatsky, N.; Egamberdiev, S. Measurements of optical turbulence in the free atmosphere above Mount Maidanak in 2005–2007. Astron. Lett. 2009, 35, 547–554. [Google Scholar] [CrossRef]
  24. Tokovinin, A.; Travouillon, T. Model of optical turbulence profile at Cerro Pachón. Mon. Not. R. Astron. Soc. 2005, 365, 1235–1242. [Google Scholar] [CrossRef]
  25. Ehgamberdiev, S. Modern astronomy at the Maidanak observatory in Uzbekistan. Nat. Astron. 2018, 2, 349–351. [Google Scholar] [CrossRef]
  26. Beckers, J.M.; Leon, E.; Mason, J.; Wilkins, L. Solar Scintillometry: Calibration of Signals and Its Use for Seeing Measurements. Sol. Phys. 1997, 176, 23–36. [Google Scholar] [CrossRef]
  27. Seykora, E.J. Solar scintillation and the monitoring of solar seeing. Sol. Phys. 1993, 145, 389–397. [Google Scholar] [CrossRef]
  28. Beckers, J.M. A Seeing Monitor for Solar and Other Extended Object Observations. Exp. Astron. 2001, 12, 1–20. [Google Scholar] [CrossRef]
  29. Hickson, P.; Lanzetta, K. Measuring Atmospheric Turbulence with a Lunar Scintillometer Array. Publ. Astron. Soc. Pac. 2004, 116, 1143–1152. [Google Scholar] [CrossRef]
  30. Tokovinin, A. Turbulence profiles from the scintillation of Stars, Planets, and Moon. In Workshop on Astronomical Site Evaluation; Instituto de Astronomia, Universidad Nacional Autónoma de México: Ciudad de México, Mexico, 2007. [Google Scholar]
  31. Tokovinin, A.; Bustos, E.; Berdja, A. Near-ground turbulence profiles from lunar scintillometer. Mon. Not. R. Astron. Soc. 2010. [Google Scholar] [CrossRef]
  32. Rajagopal, J.; Tokovinin, A.; Bustos, E.; Sebag, J. LuSci: A lunar scintillometer to study ground layer turbulence. In Proceedings of the SPIE Astronomical Telescopes + Instrumentation, Marseille, France, 23–28 June 2008; pp. 545–553. [Google Scholar]
  33. Ali, W.D.; Ziad, A.; Berdja, A.; Maire, J.; Borgnino, J.; Sarazin, M.; Lombardi, G.; Navarrete, J.; Ramio, H.V.; Reyes, M.; et al. Multi-instrument measurement campaign at Paranal in 2007. Astron. Astrophys. 2010, 524, A73. [Google Scholar] [CrossRef]
  34. Lombardi, G.; Melnick, J.; Goñi, R.H.H.; Navarrete, J.; Sarazin, M.; Berdja, A.; Tokovinin, A.; Wilson, R.; Osborn, J.; Butterley, T.; et al. Surface layer characterization at Paranal Observatory. In Proceedings of the SPIE Astronomical Telescopes + Instrumentation, San Diego, CA, USA, 28 June 2010; pp. 1519–1531. [Google Scholar]
  35. Lombardi, G.; Sarazin, M.; Char, F.; Gonzales Avila, C.; Navarrete, J.; Tokovinin, A.; Wilson, R.; Buttlerey, T. Surface layer turbulence profiling with the SL-SLODAR and LuSci at ESO Paranal Observatory. In Proceedings of the Third AO4ELT Conference—Adaptive Optics for Extremely Large Telescopes, Florence, Italy, 26–31 May 2013. [Google Scholar] [CrossRef]
  36. González, C.; Lombardi, G.; Sarazin, M.; Char, F.; Bustos, E.; Navarrete, J. Remote controlling of a lunar scintillometer from Paranal to Armazones in the context of the E-ELT site monitoring. Bol. Asoc. Argent. Astron. Plata Argent. 2011, 54, 439–442. [Google Scholar]
  37. Surendran, A.; Parihar, P.S.; Banyal, R.K.; Kalyaan, A. Development of a Lunar Scintillometer as part of the national large optical telescope site survey. Exp. Astron. 2018, 45, 57–79. [Google Scholar] [CrossRef]
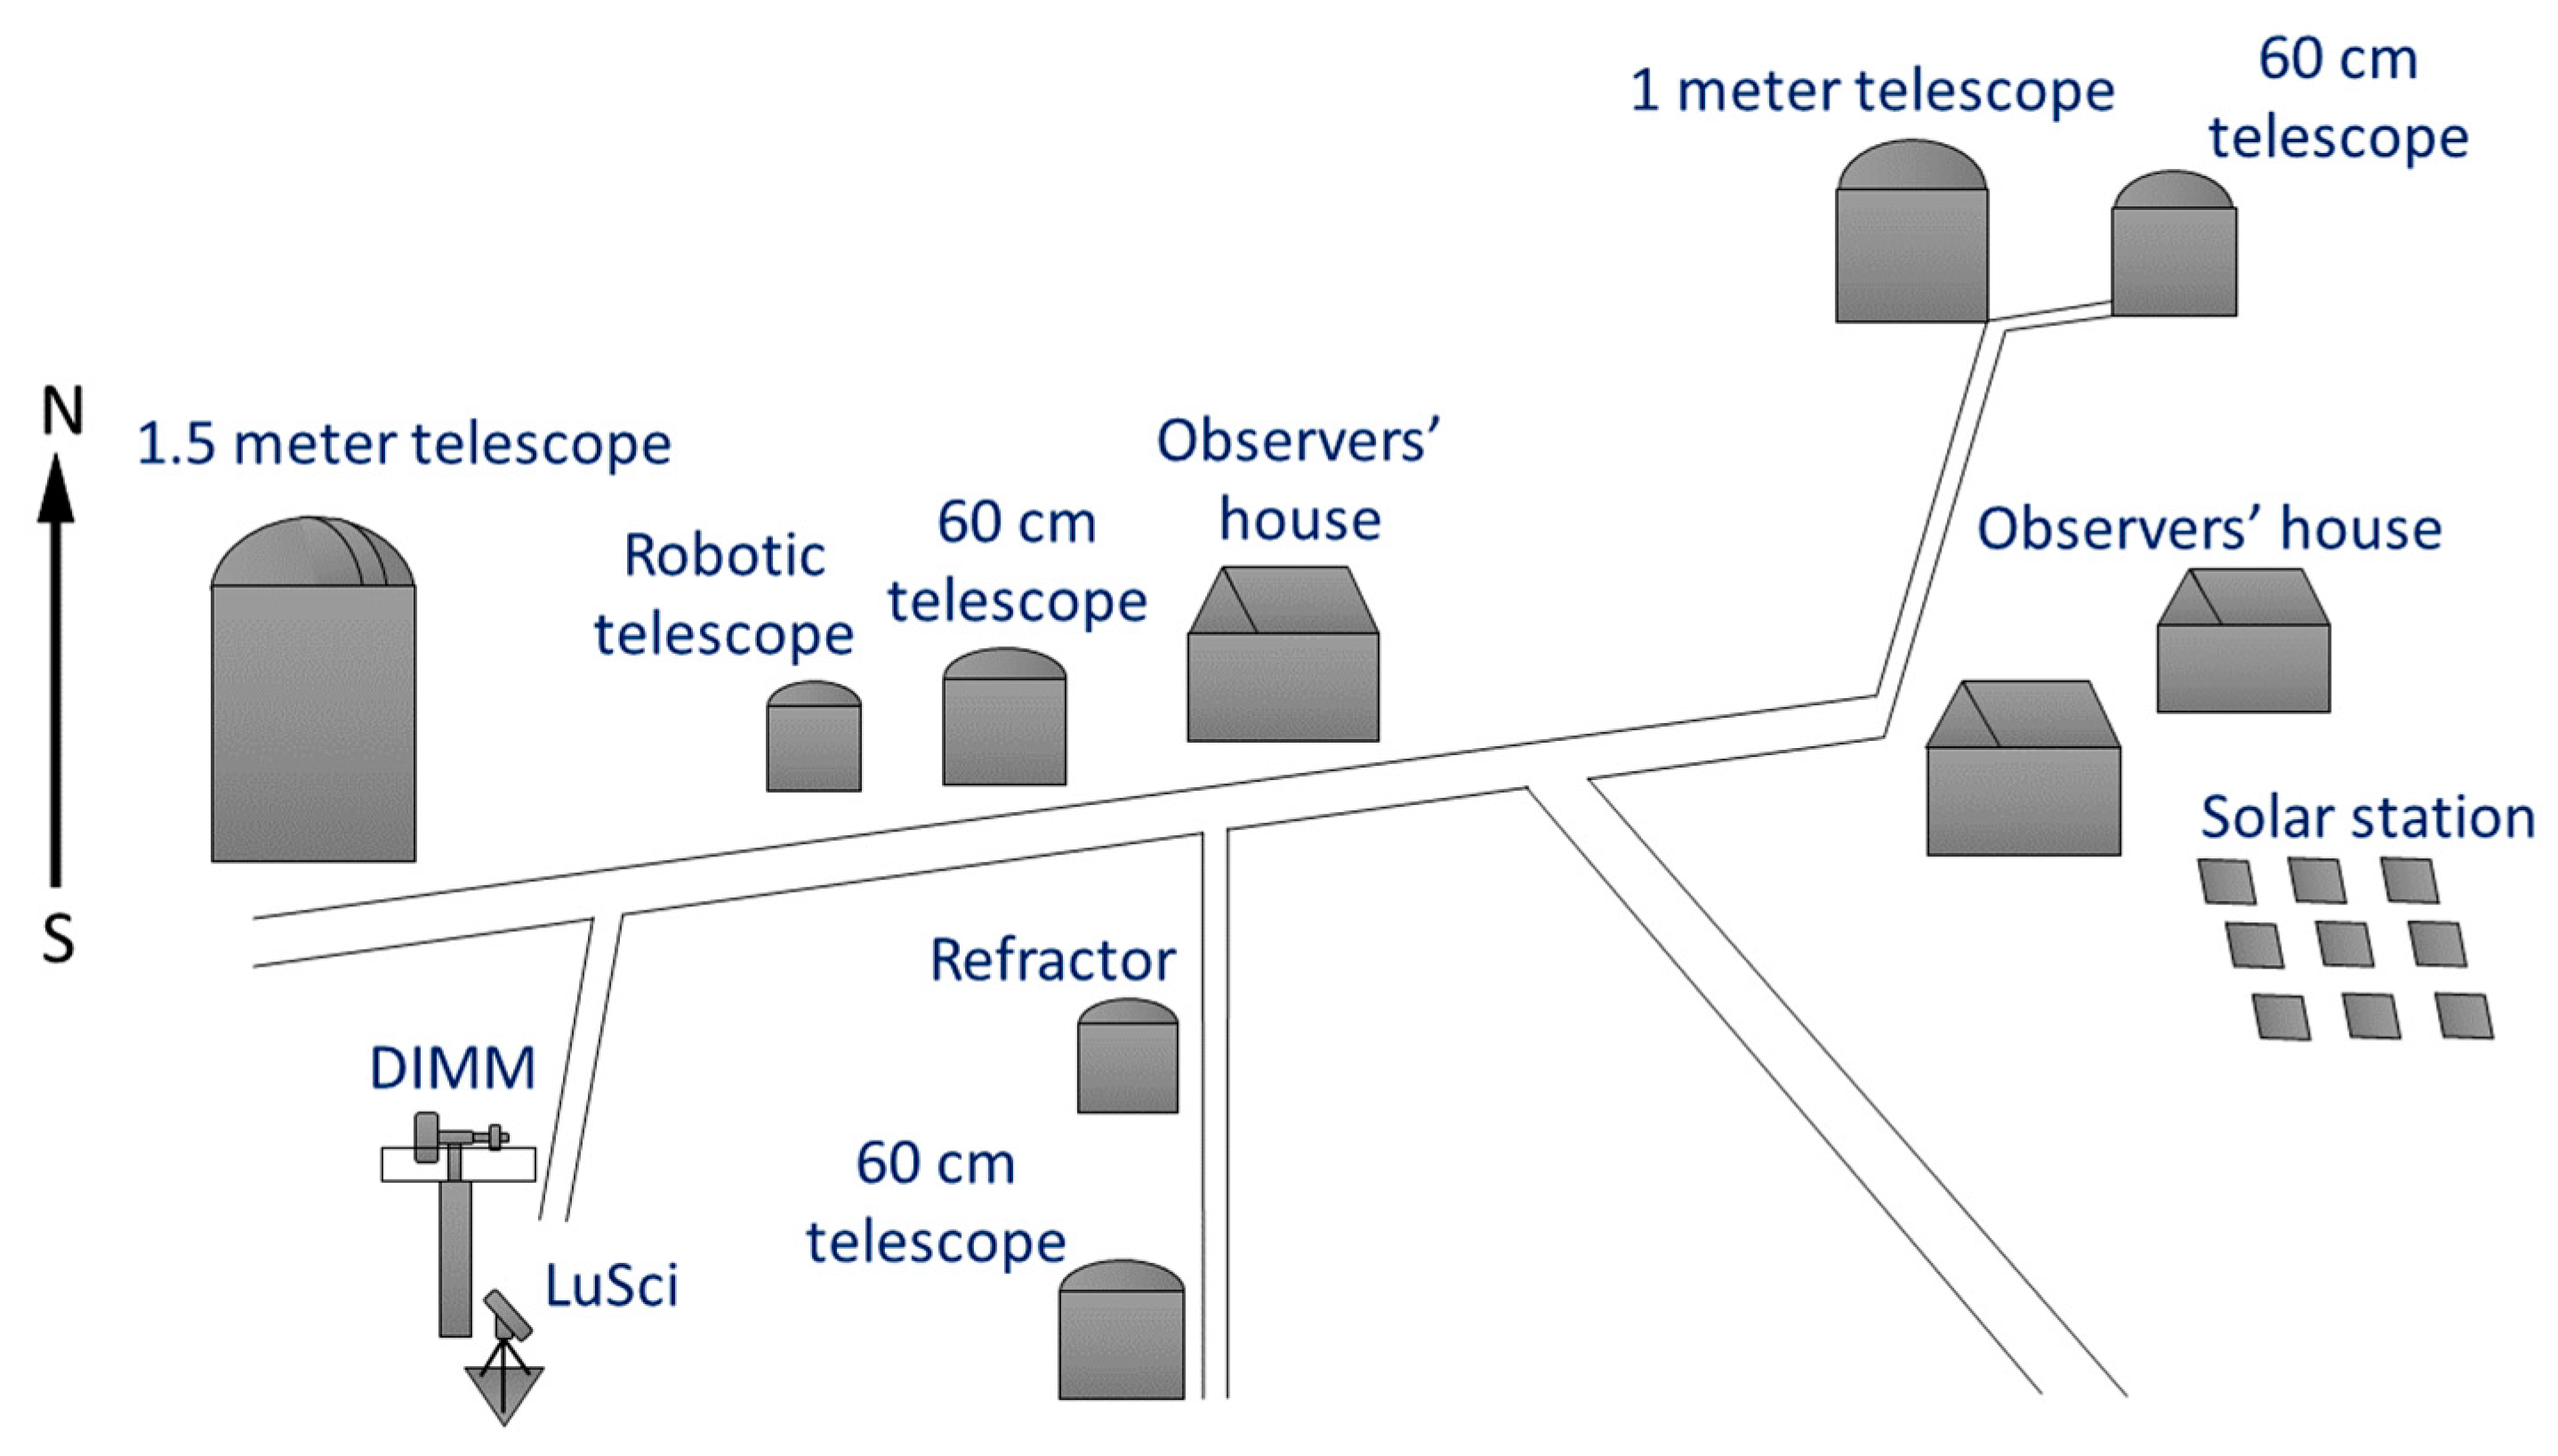
Figure 1. Layout of telescopes in the Maidanak Observatory.
Atmosphere 14 01779 g001
Figure 2. A sketch view of DIMM, meteorological mast (left), and nightly median seeing graph (right) showing the contribution of the 5.5 ÷ 25.5 m layer to the overall seeing.
Atmosphere 14 01779 g002
Figure 3. LuSci on the ground (left) and the 6 m platform with DIMM on it; LuSci is in the foreground (right).
Atmosphere 14 01779 g003
Figure 4. One−night surface layer C n 2 integral (upper graph) and seeing at different layers, including overall DIMM−seeing (bottom).
Atmosphere 14 01779 g004
Figure 5. Seeing measurements made by LuSci and DIMM at the Maidanak Observatory in 2021–2022.
Atmosphere 14 01779 g005
Figure 6. LuSci and DIMM seeing at different heights above 6 m in 2021–2022.
Atmosphere 14 01779 g006
Figure 7. Nightly median seeing in DIMM and 5.5 ÷ 25.5 m for 2021–2022.
Atmosphere 14 01779 g007
Table 1. Median seeing and average values of C n 2 at different heights in 2021–2022.
Altitude (m)Integrated Seeing C n 2 Integral, m1/3LuSci/DIMM (%)
LuSci
40.16″3.9021 × 10−148
160.23″7.2022 × 10−1414
640.25″7.6698 × 10−1416
2560.44″1.7309 × 10−1342
DIMM
0.74″4.1168 × 10−13100
Table 2. Median seeing and C n 2 at different heights above 6 m in 2021–2022.
Altitude (m)Integrated Seeing C n 2 Integral, m1/3LuSci/DIMM (%)
0 ÷ 6 0.19″4.3454 × 10−1410
6 ÷ 160.13″2.3608 × 10−145.5
6 ÷ 640.15″3.0787 × 10−147
6 ÷ 2560.38″1.3952 × 10−1333
DIMM
6 ÷ ∞0.74″4.1168 × 10−13100
Disclaimer/Publisher’s Note: The statements, opinions and data contained in all publications are solely those of the individual author(s) and contributor(s) and not of MDPI and/or the editor(s). MDPI and/or the editor(s) disclaim responsibility for any injury to people or property resulting from any ideas, methods, instructions or products referred to in the content.