Article

Santa Ana Winds: Multifractal Measures and Singularity Spectrum

by
Yeraldin Serpa-Usta
1,
Alvaro Alberto López-Lambraño
1,2,3,*,
Carlos Fuentes
4,
Dora-Luz Flores
1,
Mario González-Durán
5 and
Alvaro López-Ramos
6
1
Faculty of Engineering, Architecture and Design, Universidad Autónoma de Baja California, Ensenada 22860, Mexico
2
Hidrus S.A. de C.V., Ensenada 22760, Mexico
3
Grupo Hidrus S.A.S., Montería 230002, Colombia
4
Instituto Mexicano de Tecnología del Agua, Jiutepec 62550, Mexico
5
Faculty of Engineering Sciences and Technology, Universidad Autónoma de Baja California, Valle de las Palmas, Tijuana 21500, Mexico
6
GICA Group, Department of Civil Engineering, Universidad Pontificia Bolivariana Campus Montería, Montería 230002, Colombia
*
Author to whom correspondence should be addressed.
Atmosphere 2023, 14(12), 1751; https://doi.org/10.3390/atmos14121751
Submission received: 29 September 2023 / Revised: 4 November 2023 / Accepted: 22 November 2023 / Published: 28 November 2023
(This article belongs to the Section Meteorology)

Abstract

:
A multifractal analysis based on the time series of temperature, pressure, relative humidity, wind speed, and wind direction was performed for 16 weather stations located in the hydrographic basin of the Guadalupe River in Baja California, Mexico. Our analysis included a 38-year dataset from MERRA-2 database, we investigated the multifractal nature of daily time series data for climatic variables associated with the Santa Ana Winds. We employed the Multifractal Detrended Fluctuation Analysis (MFDFA) method to extract multifractal complexity parameters ( α 0 , α , and r ). This was adequate to evaluate the multifractality of the time series that represented the conditions of the phenomenon’s occurrence. From the estimation of the generalized Hurst exponent (hq), it was possible to characterize the time series of the meteorological variables in terms of the characteristics of persistence, anti-persistence, or randomness. Finally, the values corresponding to the parameters and characteristics of the multifractal spectrum or singularities can be used as quantitative and qualitative indicators to describe the dynamics of meteorological processes during the occurrence of the Santa Ana winds in the Guadalupe basin.

1. Introduction

The Santa Ana winds are a meteorological phenomenon that primarily affect the Southwestern region of the United States and the Northwestern region of Mexico during the fall and winter months [1]. They are a warm, dry, Föhn-type wind from the east or northeast that blows from the Sierra Nevada eastern desert to the coast of southern California [2]. In a recent work by the authors, fractal analysis was useful and adequate to evaluate the time series that represented the occurrence conditions of the Santa Ana winds as well as the series that represented the days on which this phenomenon does not occur. Thus, it was possible to characterize the time series of variables, such as temperature, precipitation, pressure, relative humidity, and wind speed, in terms of characteristics of persistence, anti-persistence, or randomness [3]. Every meteorological variable is controlled by a variety of physical processes and exhibits fluctuations on various spatial and temporal scales [4]; therefore, the multifractal theory serves as a robust framework to investigate non-linear processes that exhibit diverse intensity levels. In addition, multifractal behavior is connected to systems in which the underlying physics are governed by a random multiplicative process that involves a measurement and its geometric foundation according to a specified rule. Thus, the comprehensive analyses of this phenomenon facilitate the precise quantification of complex phenomena [5,6].
The multifractal analysis or approach offers distinct advantages by employing a broader spectrum of statistical moments ( q ) ; therefore, it offers a more profound understanding of the structural variability within the data. It fundamentally relies on the computation of two sets of parameters or functions associated with the time series of the variables i.e., the holder exponents ( α ) , which quantify regularity, and the multifractal spectrum, which quantifies multifractality of signal and measurement [7,8]. The multifractal spectrum associates each of the data sets from the identical regularity with the Hausdorff dimension of that data set, also known as the singularity spectrum [9].
In the reviewed literature, no work was found regarding the use of multifractal approaches to analyze the time series of the Santa Ana winds. To fill this gap, the Multifractal Detrended Fluctuation Analysis (MFDFA) method was used in the daily time series of the Santa Ana winds from 1980 to 2018. A determinant factor when choosing which method to apply was the number of available input parameters; the model would be more complex if it had a greater number of parameters. The chosen method in the present study is easy to apply and has been widely referenced in the recent literature [10,11,12,13,14,15,16,17,18,19,20,21,22,23,24,25,26].
In this paper, the multifractality properties and parameters of the time series of the Santa Ana winds in the hydrographic basin of the Guadalupe River in Baja California, Mexico were researched. The aim was to project and characterize the structural variability, occurrence, and self-similarity of the meteorological phenomenon.

2. Study Area

The research site encompasses the Guadalupe River basin, situated in the northern region of Baja California. This basin spans between latitudes 31°50′ N and 32°16′ N, and longitudes 116°54′ W and 115°52′ W. Characterized by a semi-arid environment, it boasts a Mediterranean climate with an annual mean temperature of around 16 °C and receives an average annual precipitation of approximately 254.6 mm. The area encompasses a total landmass of 2390 km2, which is further divided into three distinct sub-basins: Ojos Negros, situated in the upstream region; Valle de Guadalupe, located in the central part; and the downstream La Misión sub-basin, which ultimately drains into the Pacific Ocean (Figure 1) [3].
The climatological stations that had influence within the basin were estimated as mentioned in [3]. Table 1 shows the weather stations used in the different analyses that were carried out.
For this case study, the database The Modern-Era Retrospective analysis for Research and Applications, Version 2 (MERRA-2) was used. The analysis period was between 1980 and 2018.
The variables analyzed were temperature, relative humidity, pressure, wind direction, and wind speed.

3. Materials and Methods

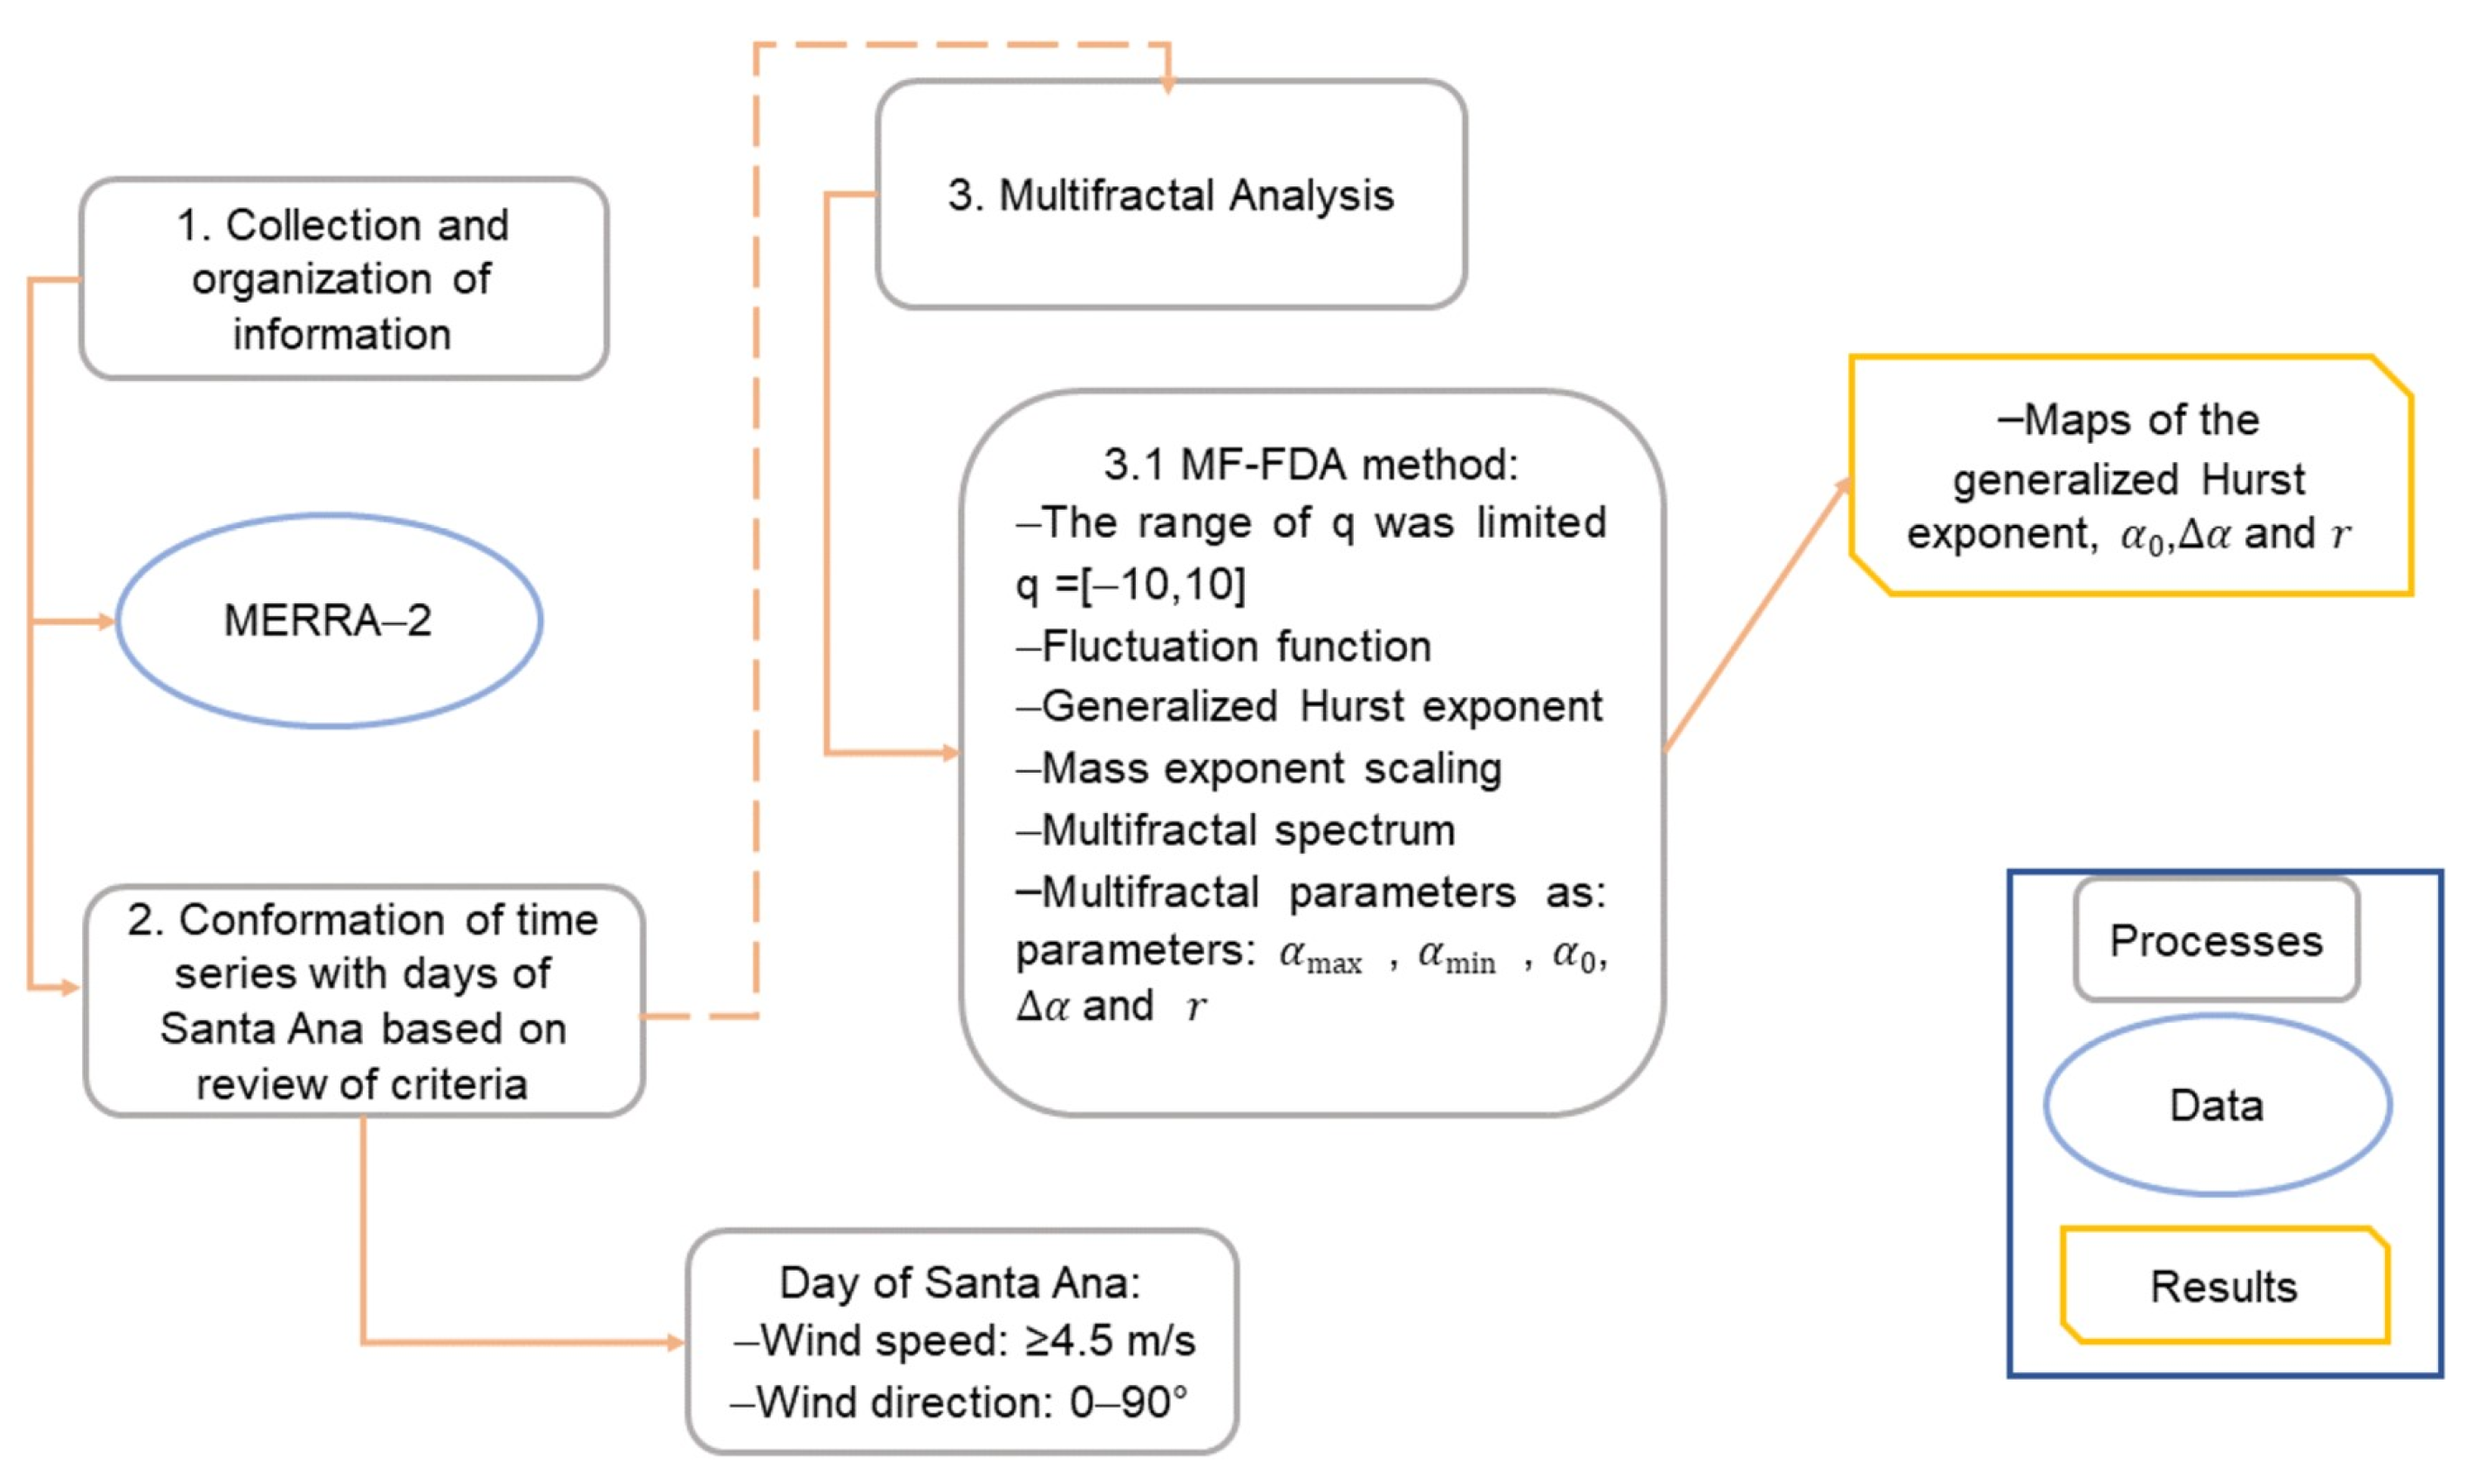
Figure 2 shows the structure of methodology used for the proposed analysis.

3.1. Santa Ana Time Series

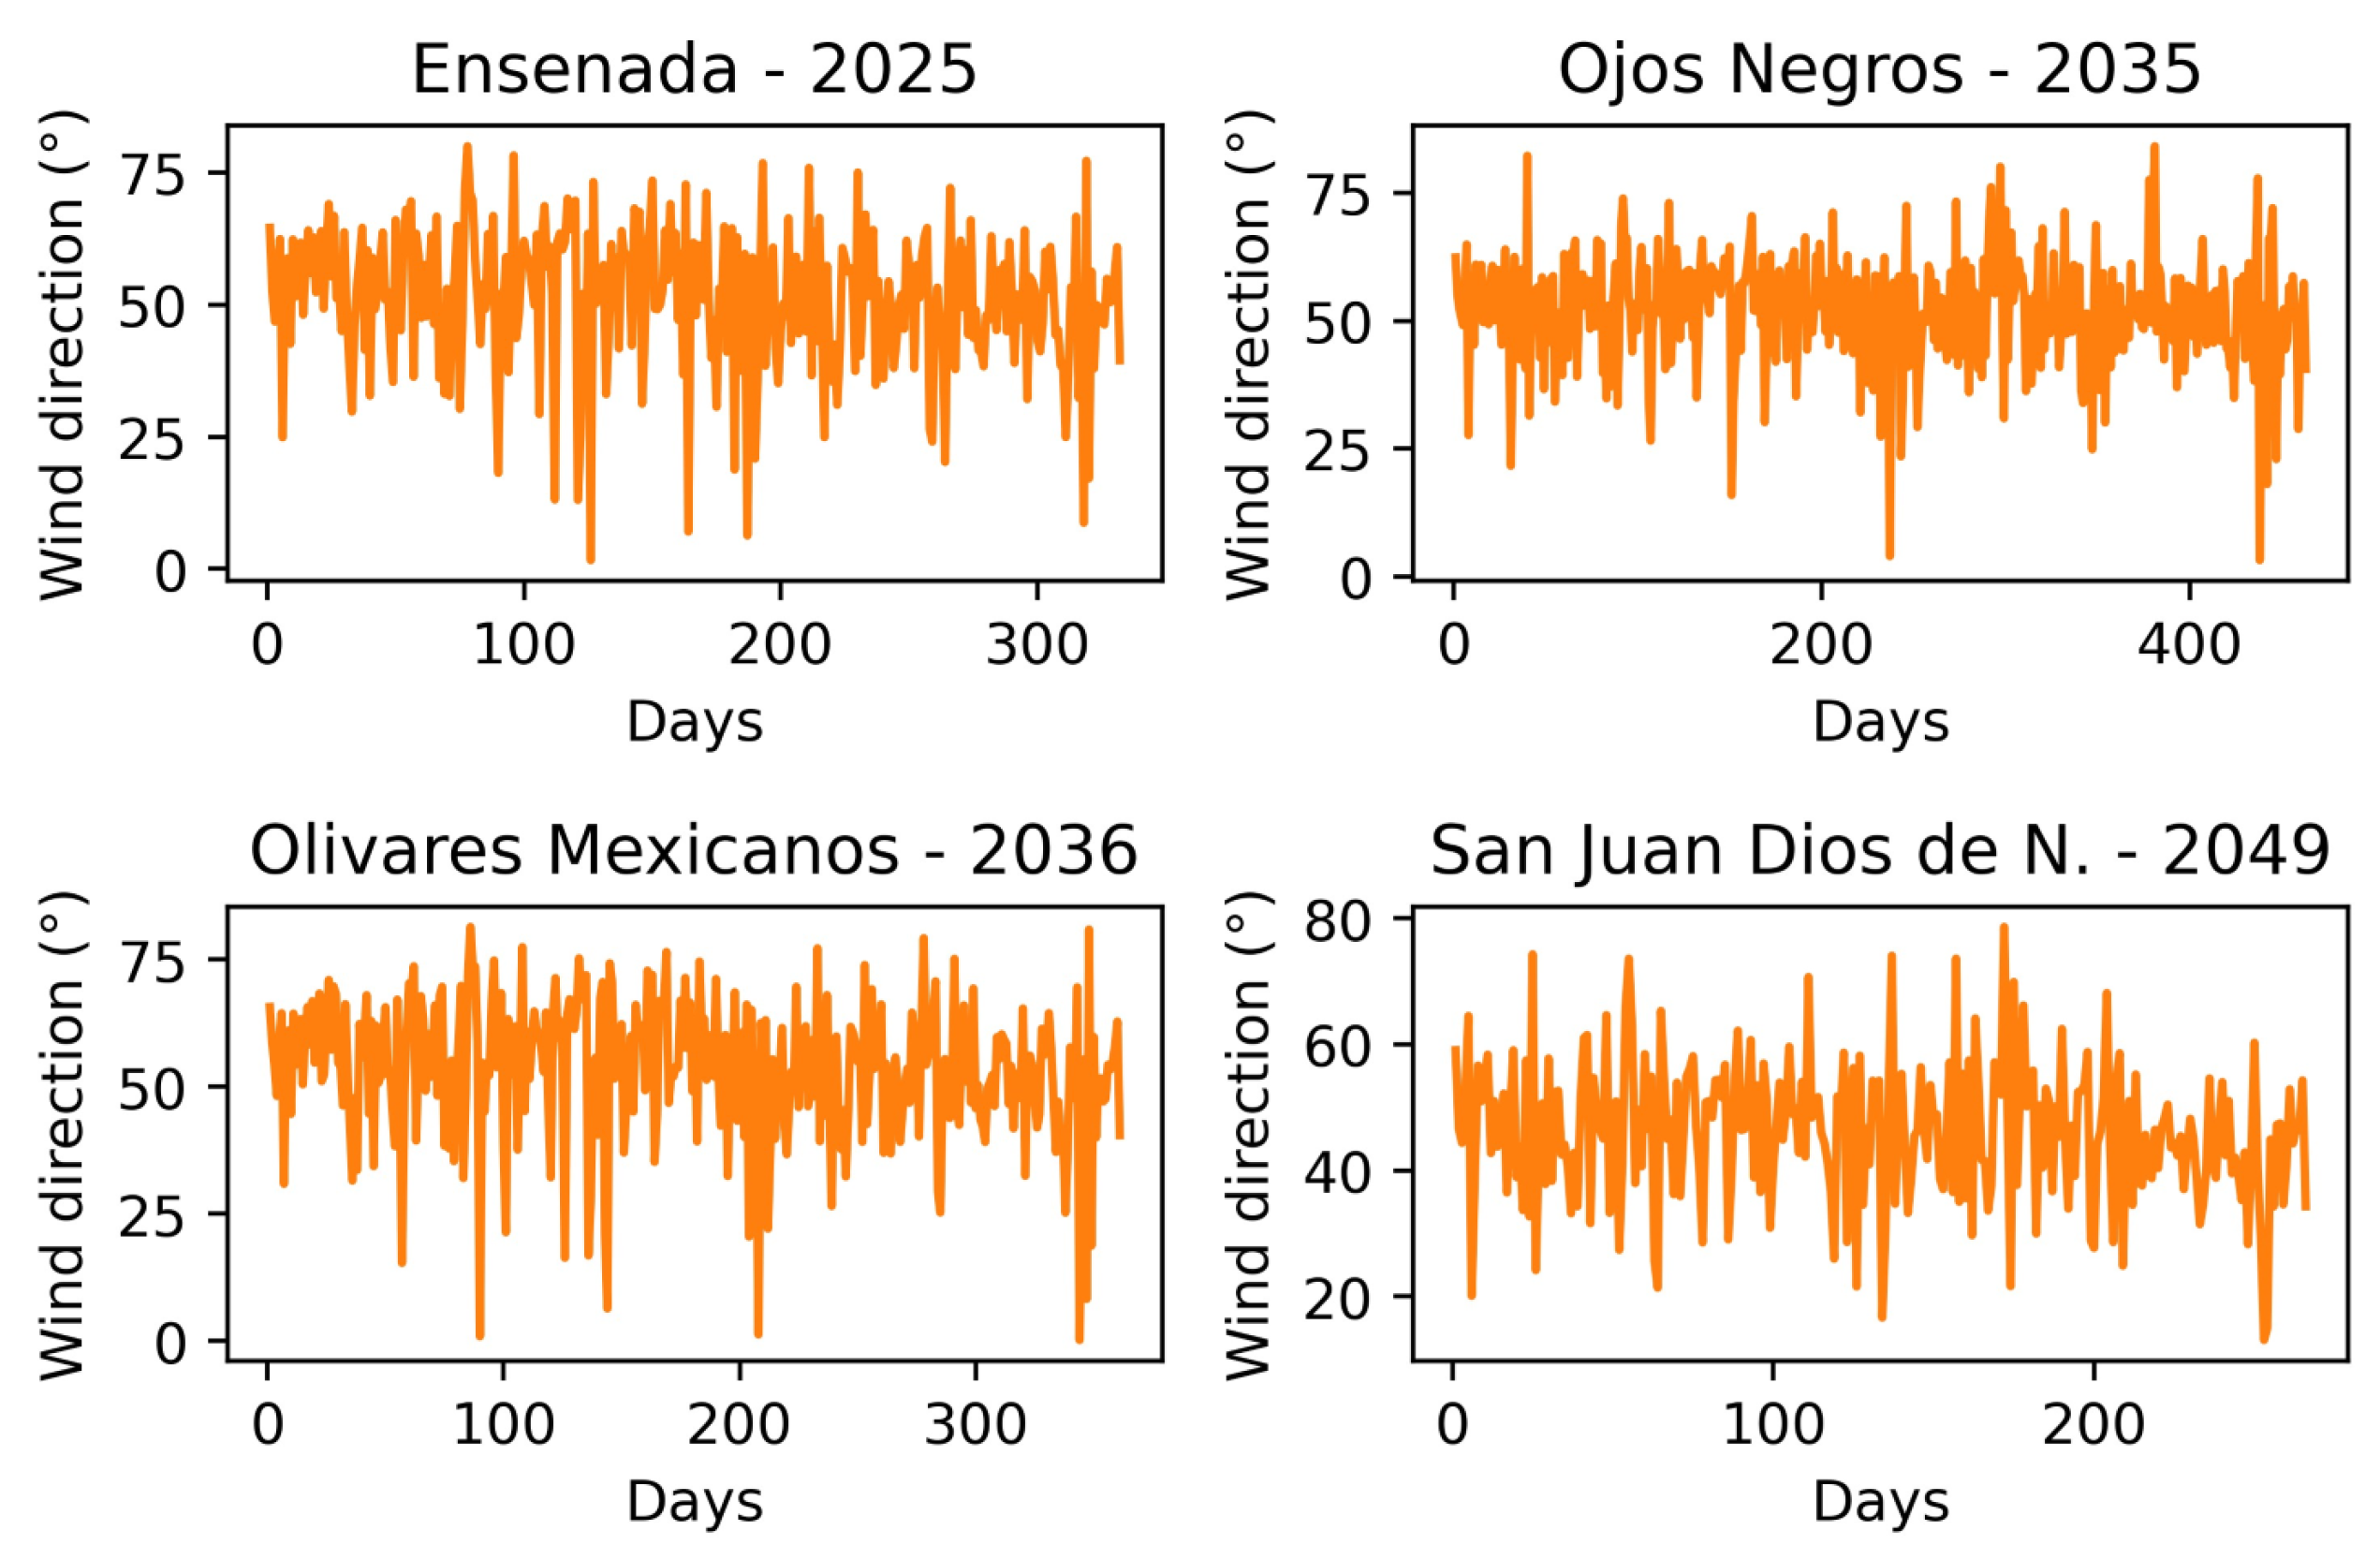
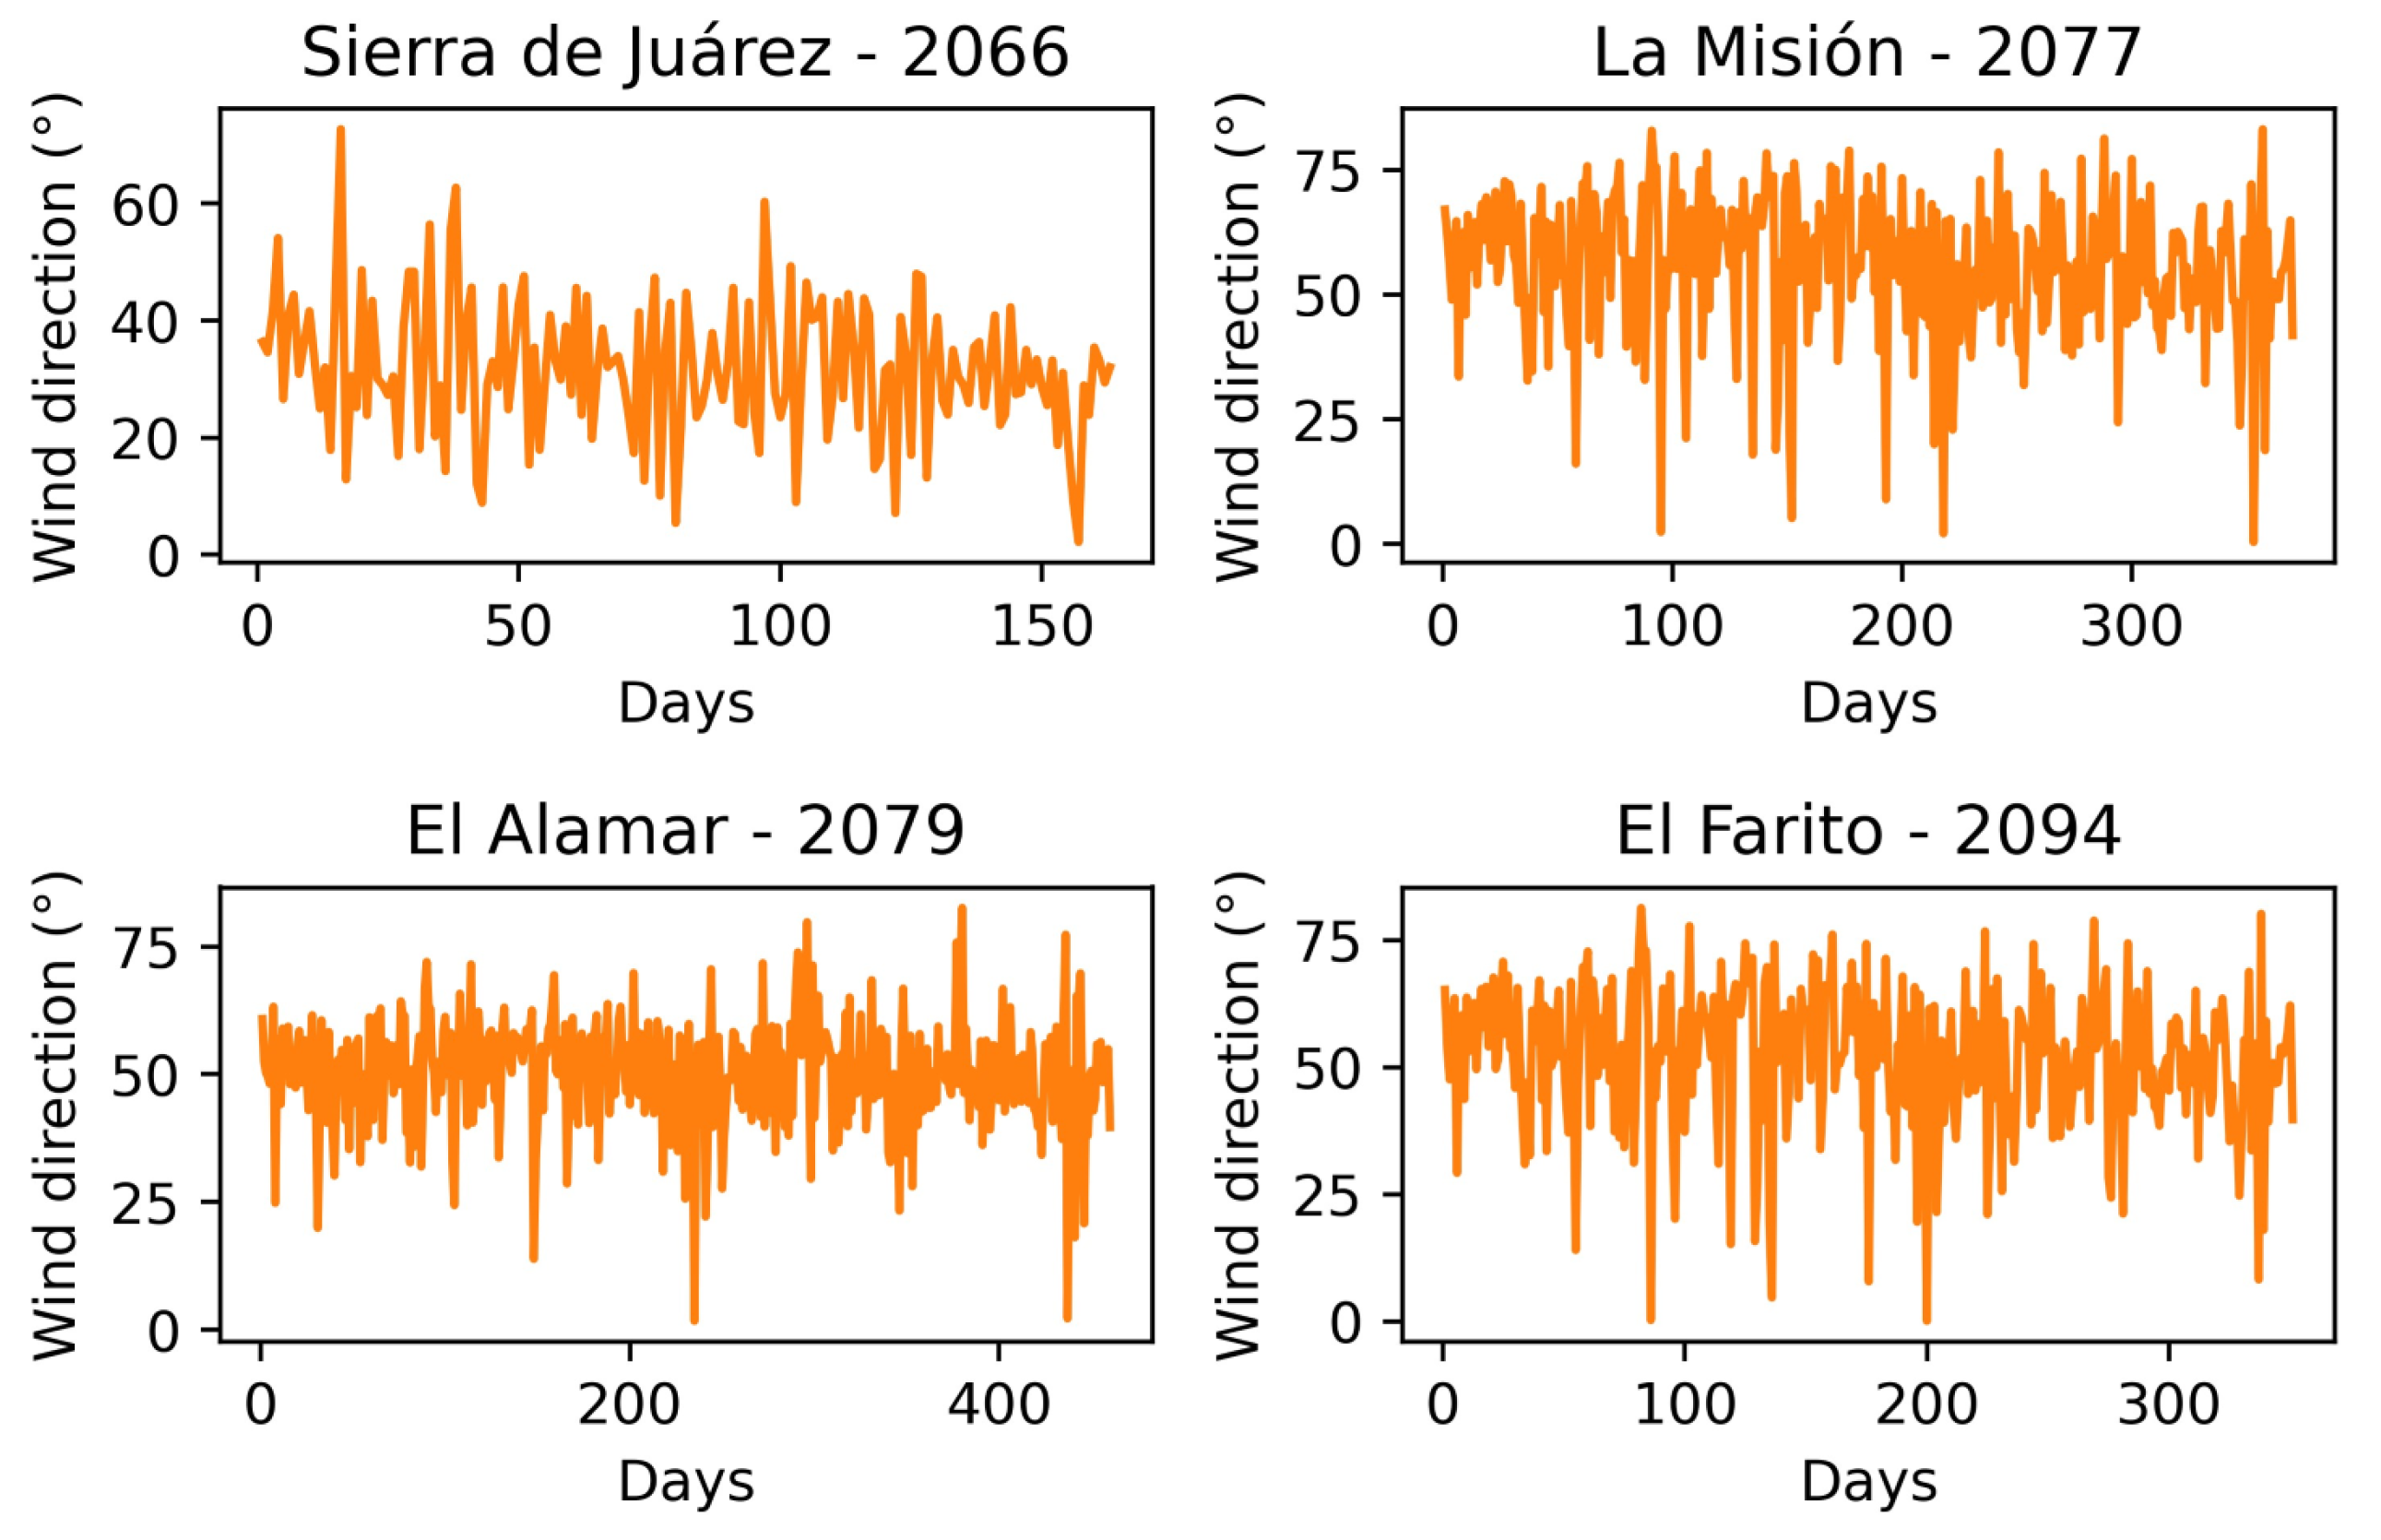
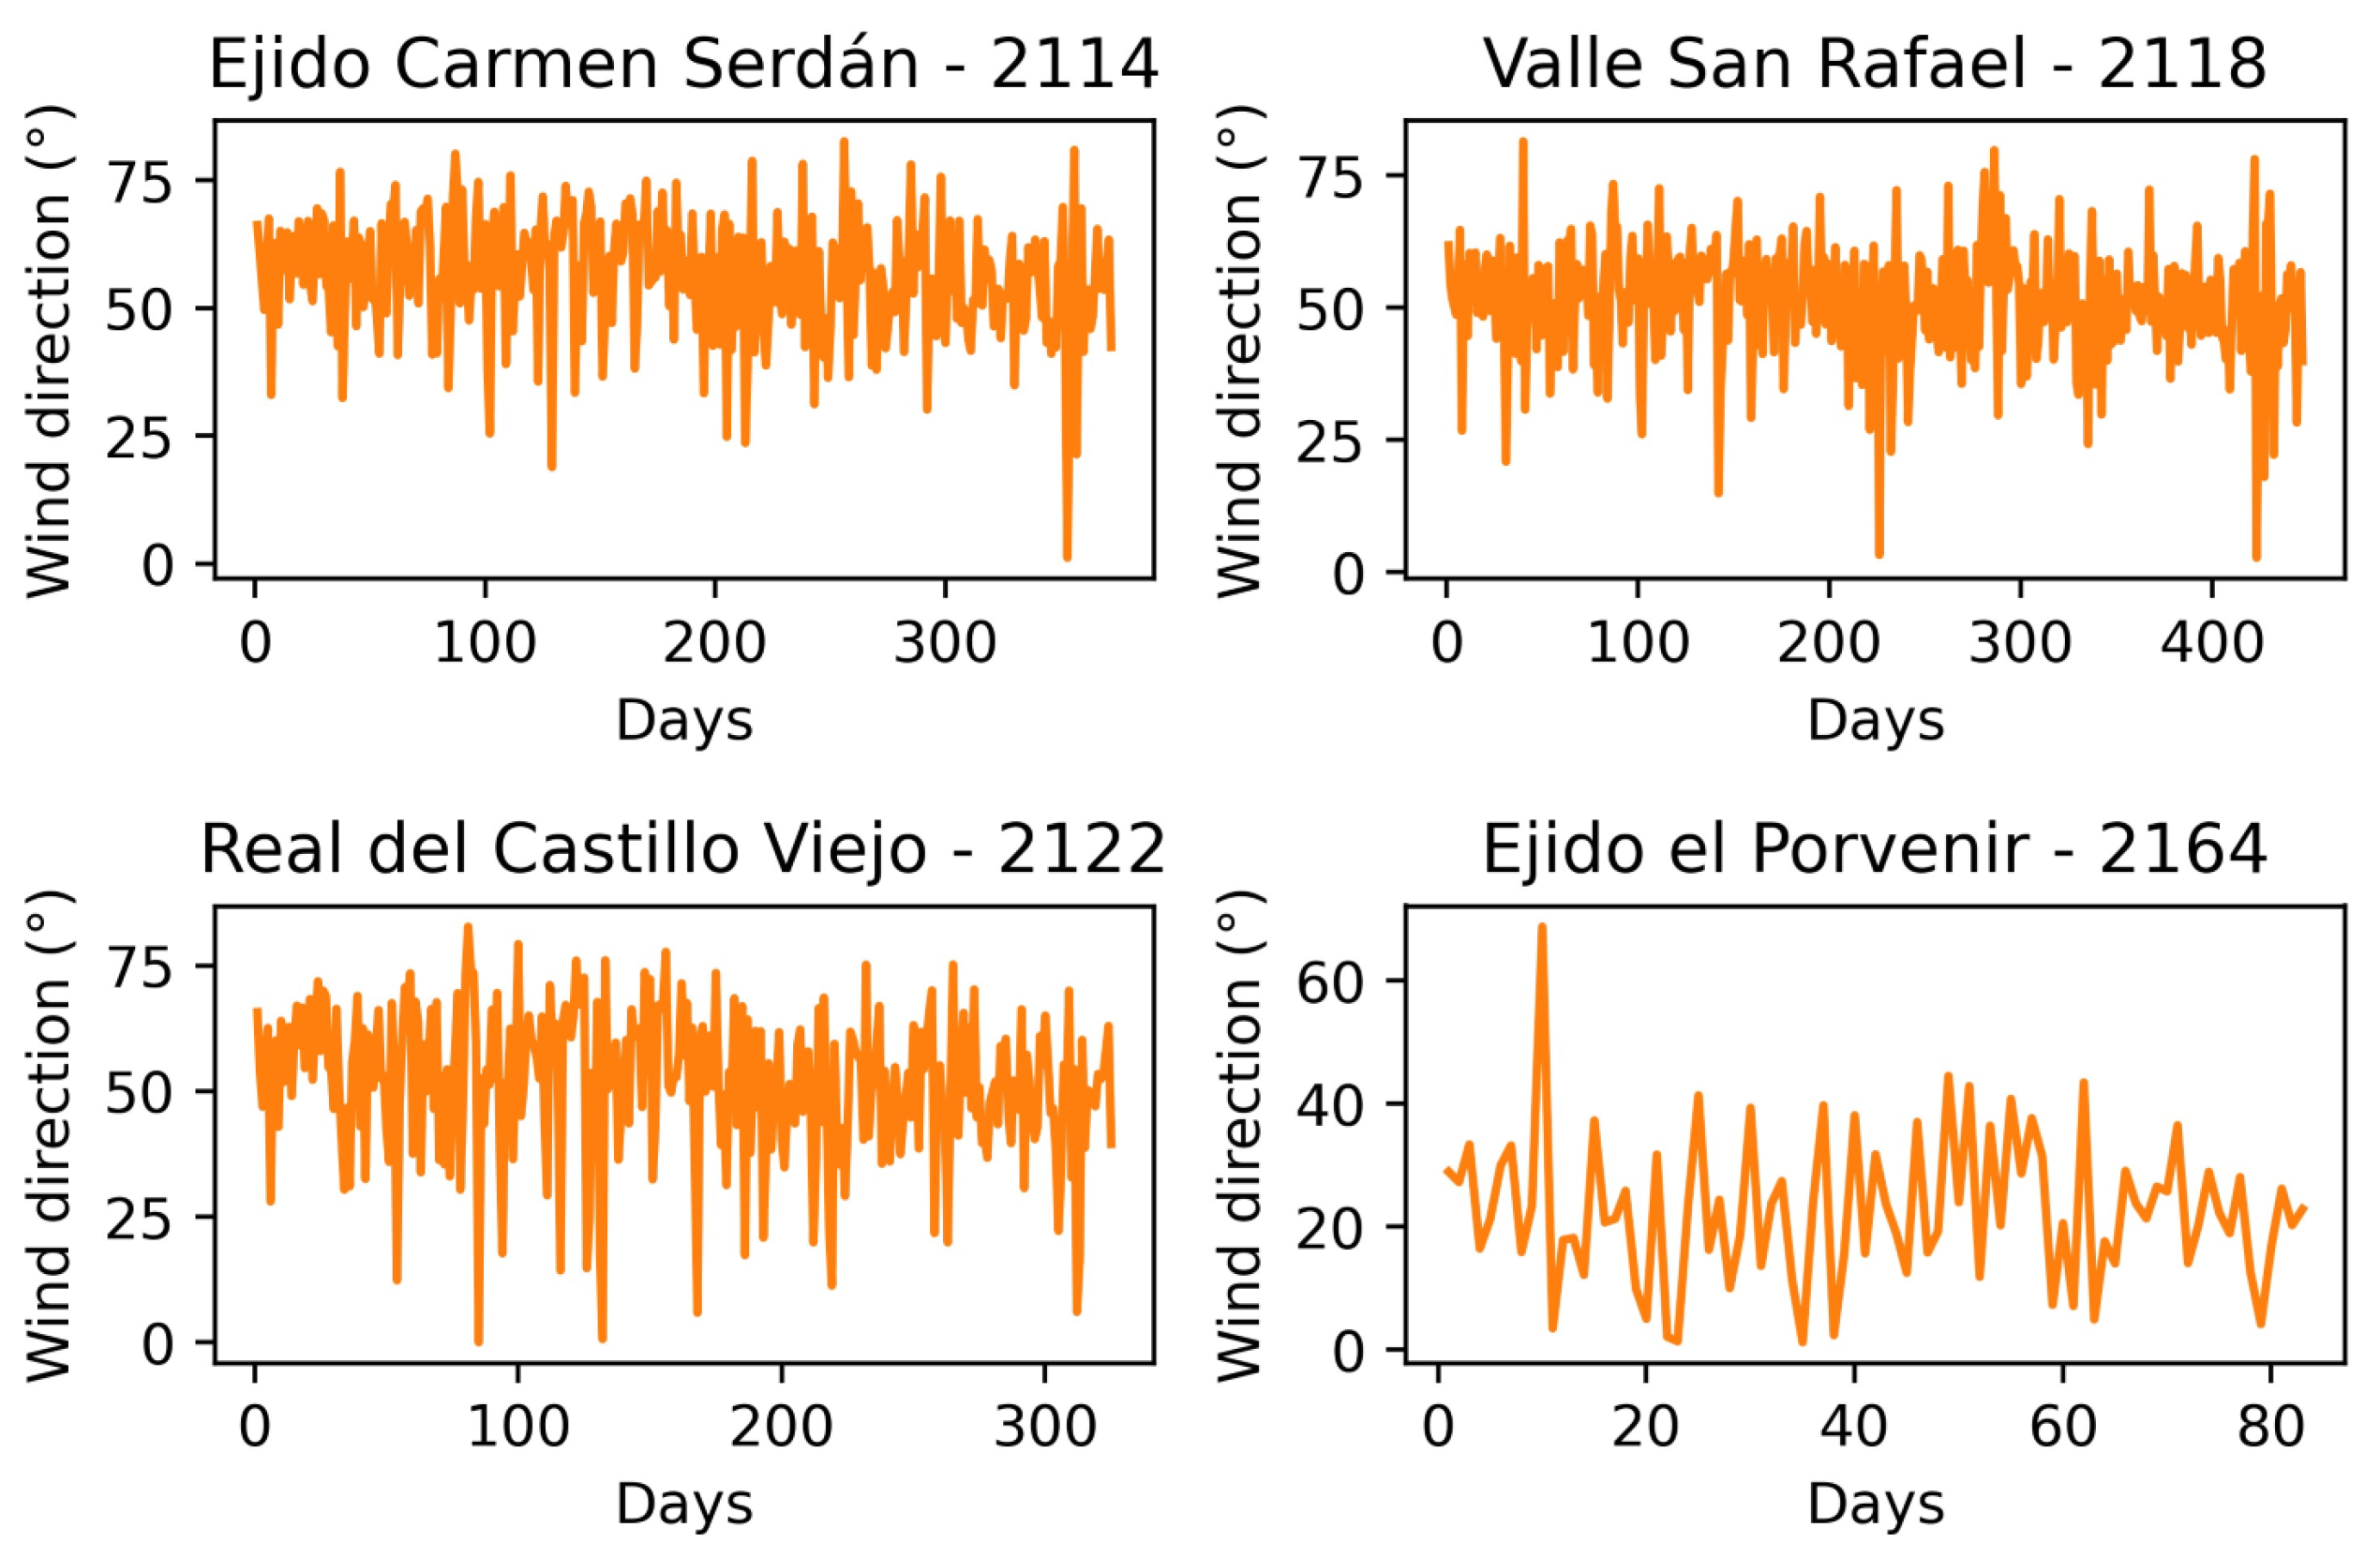
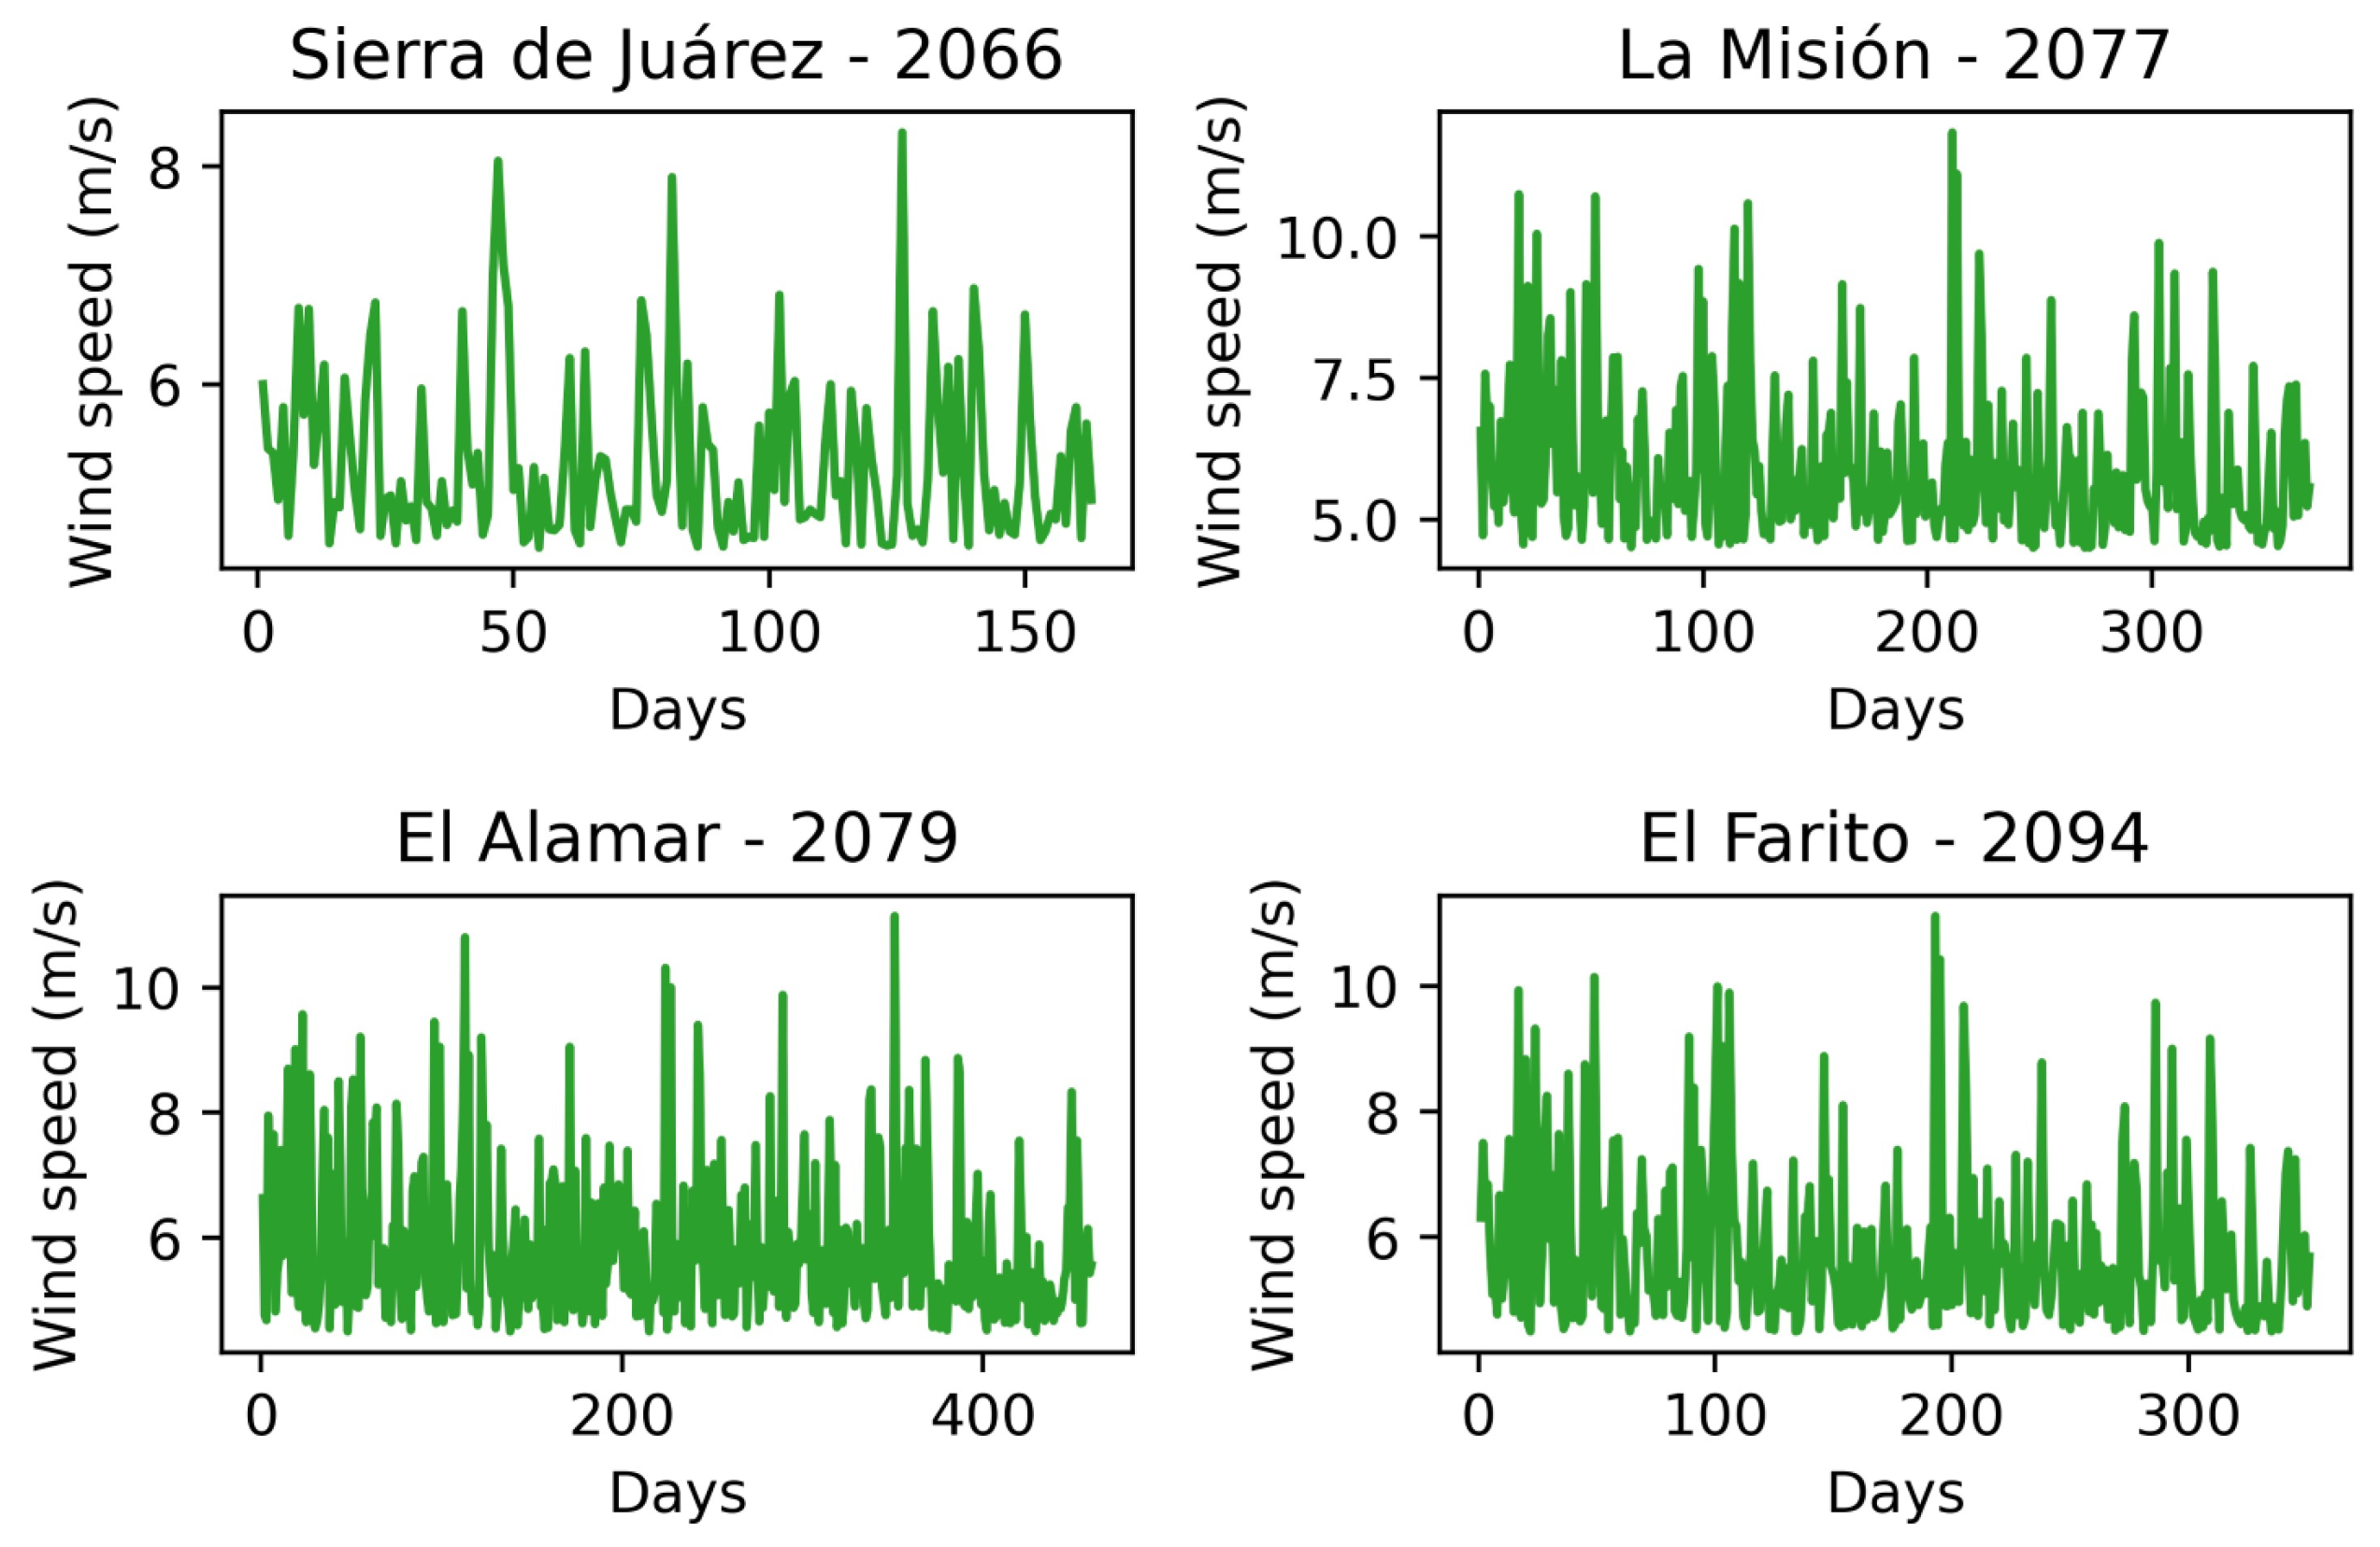
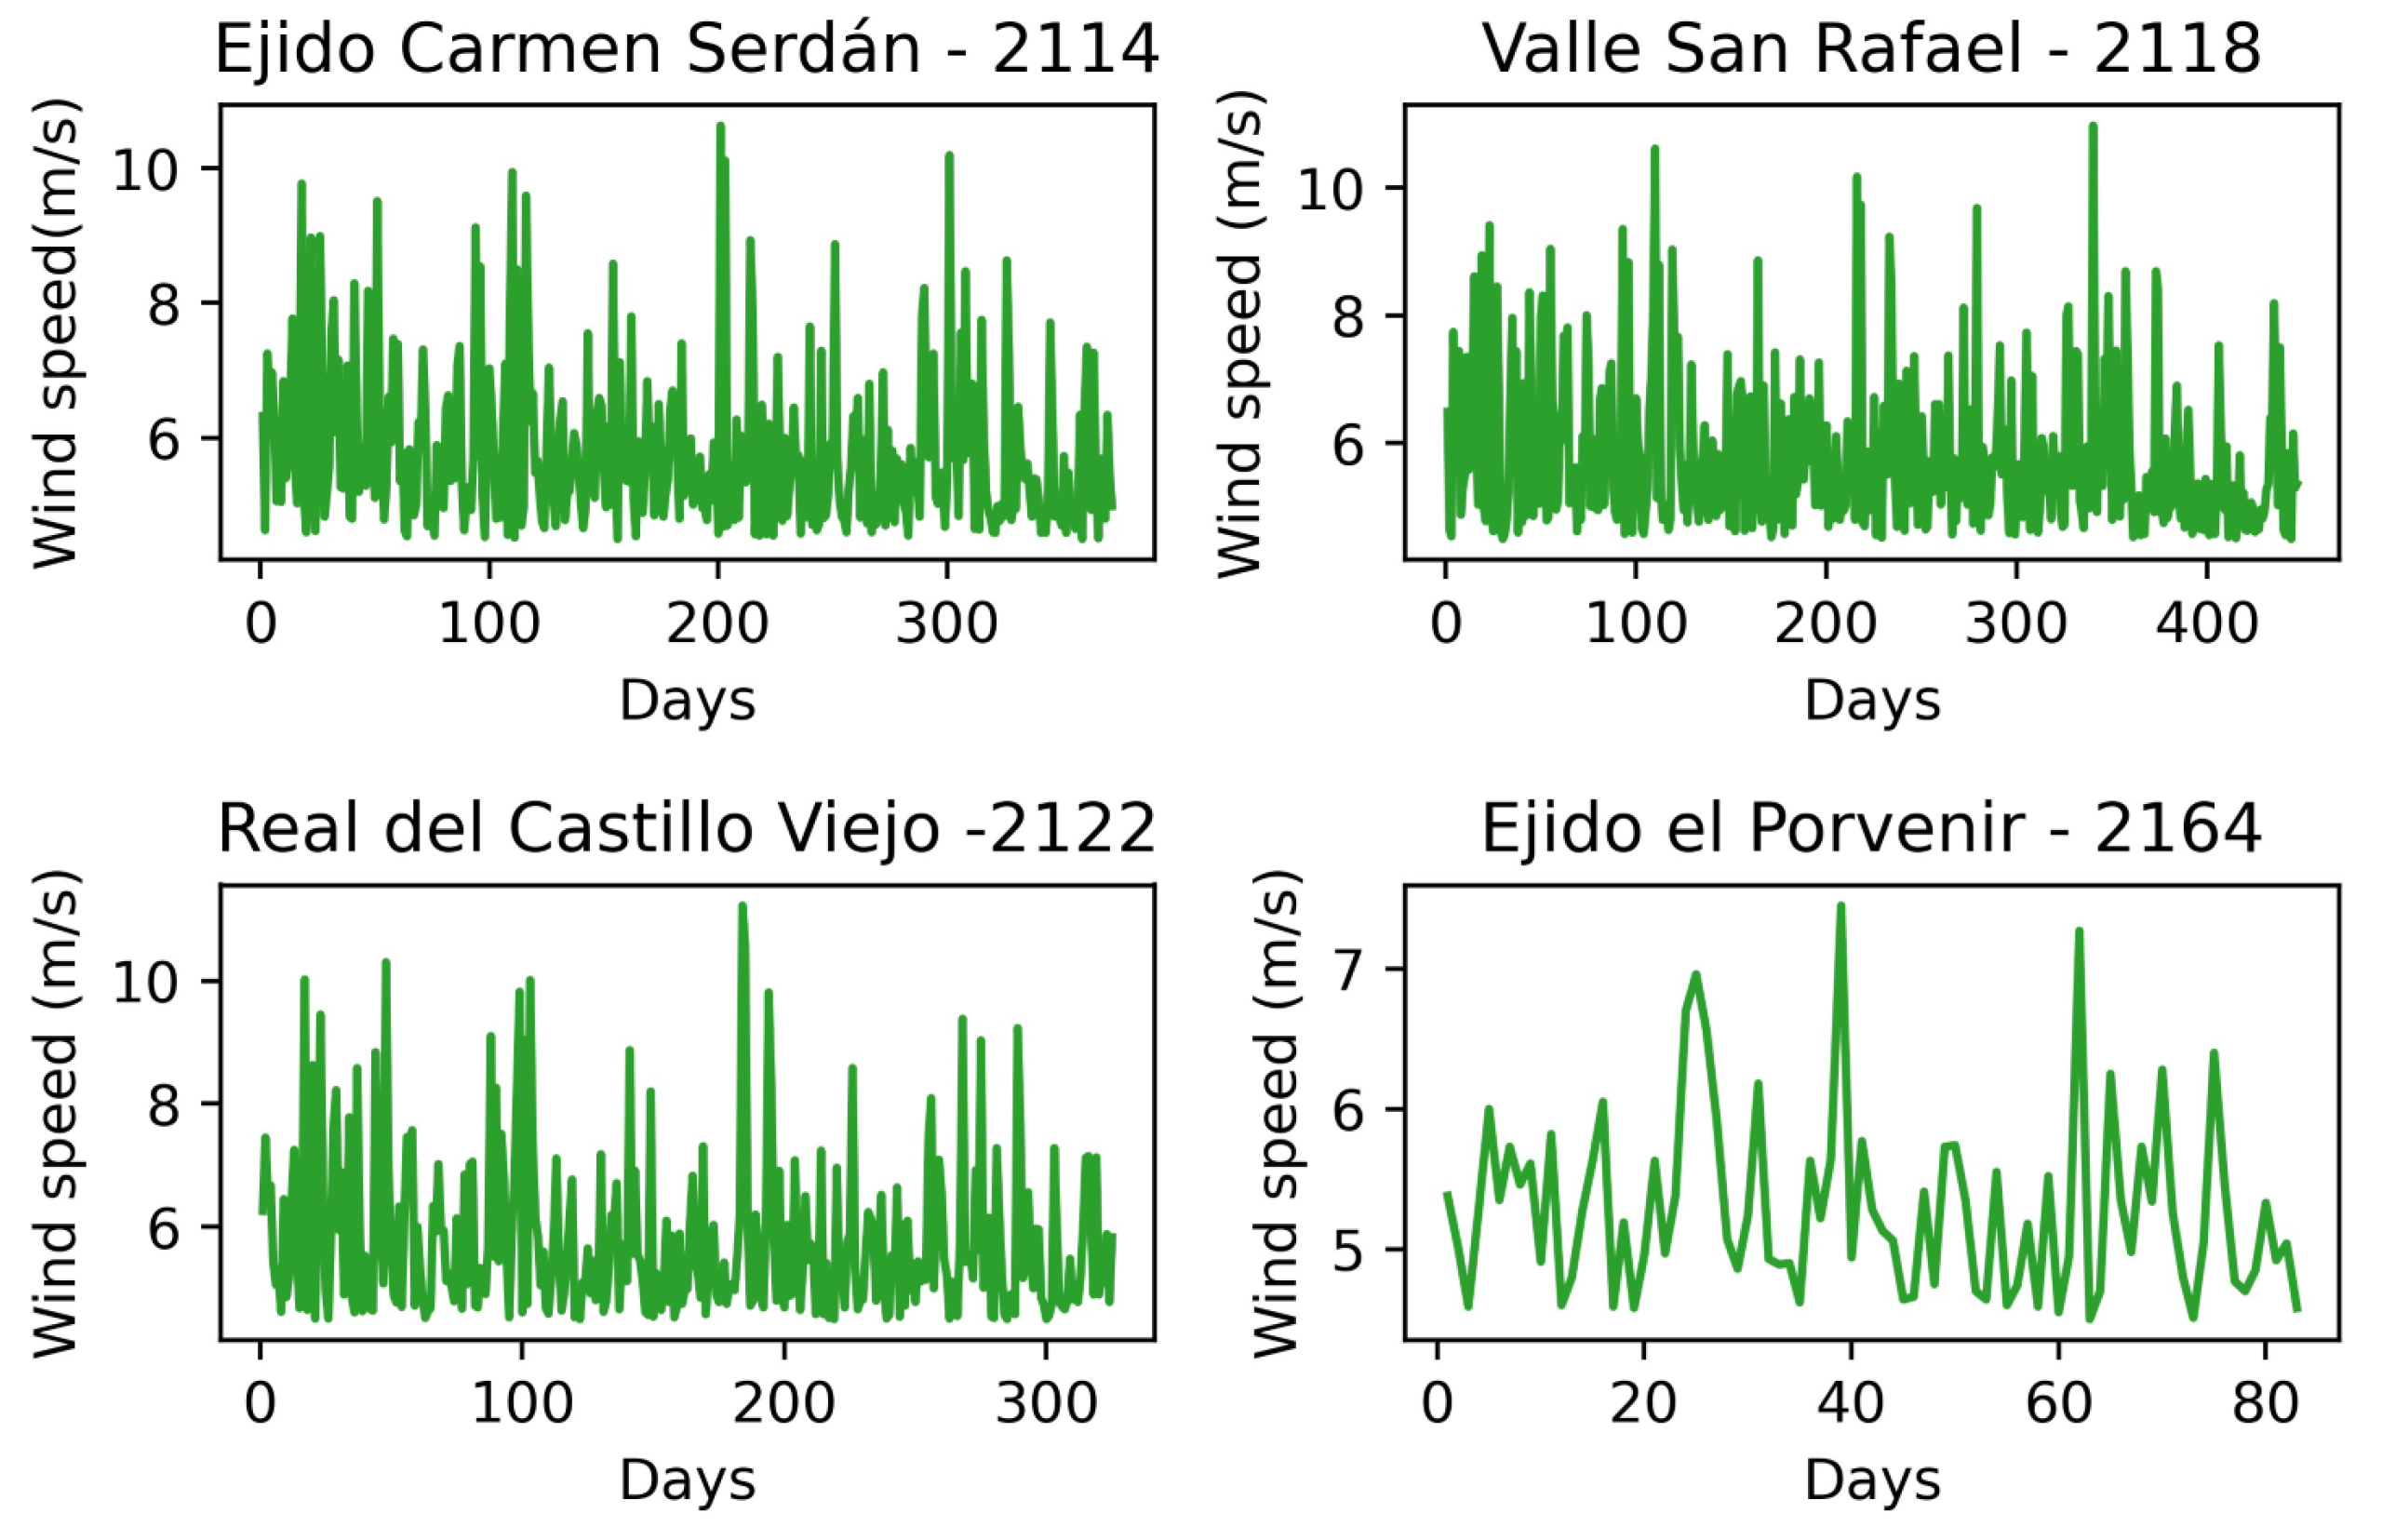
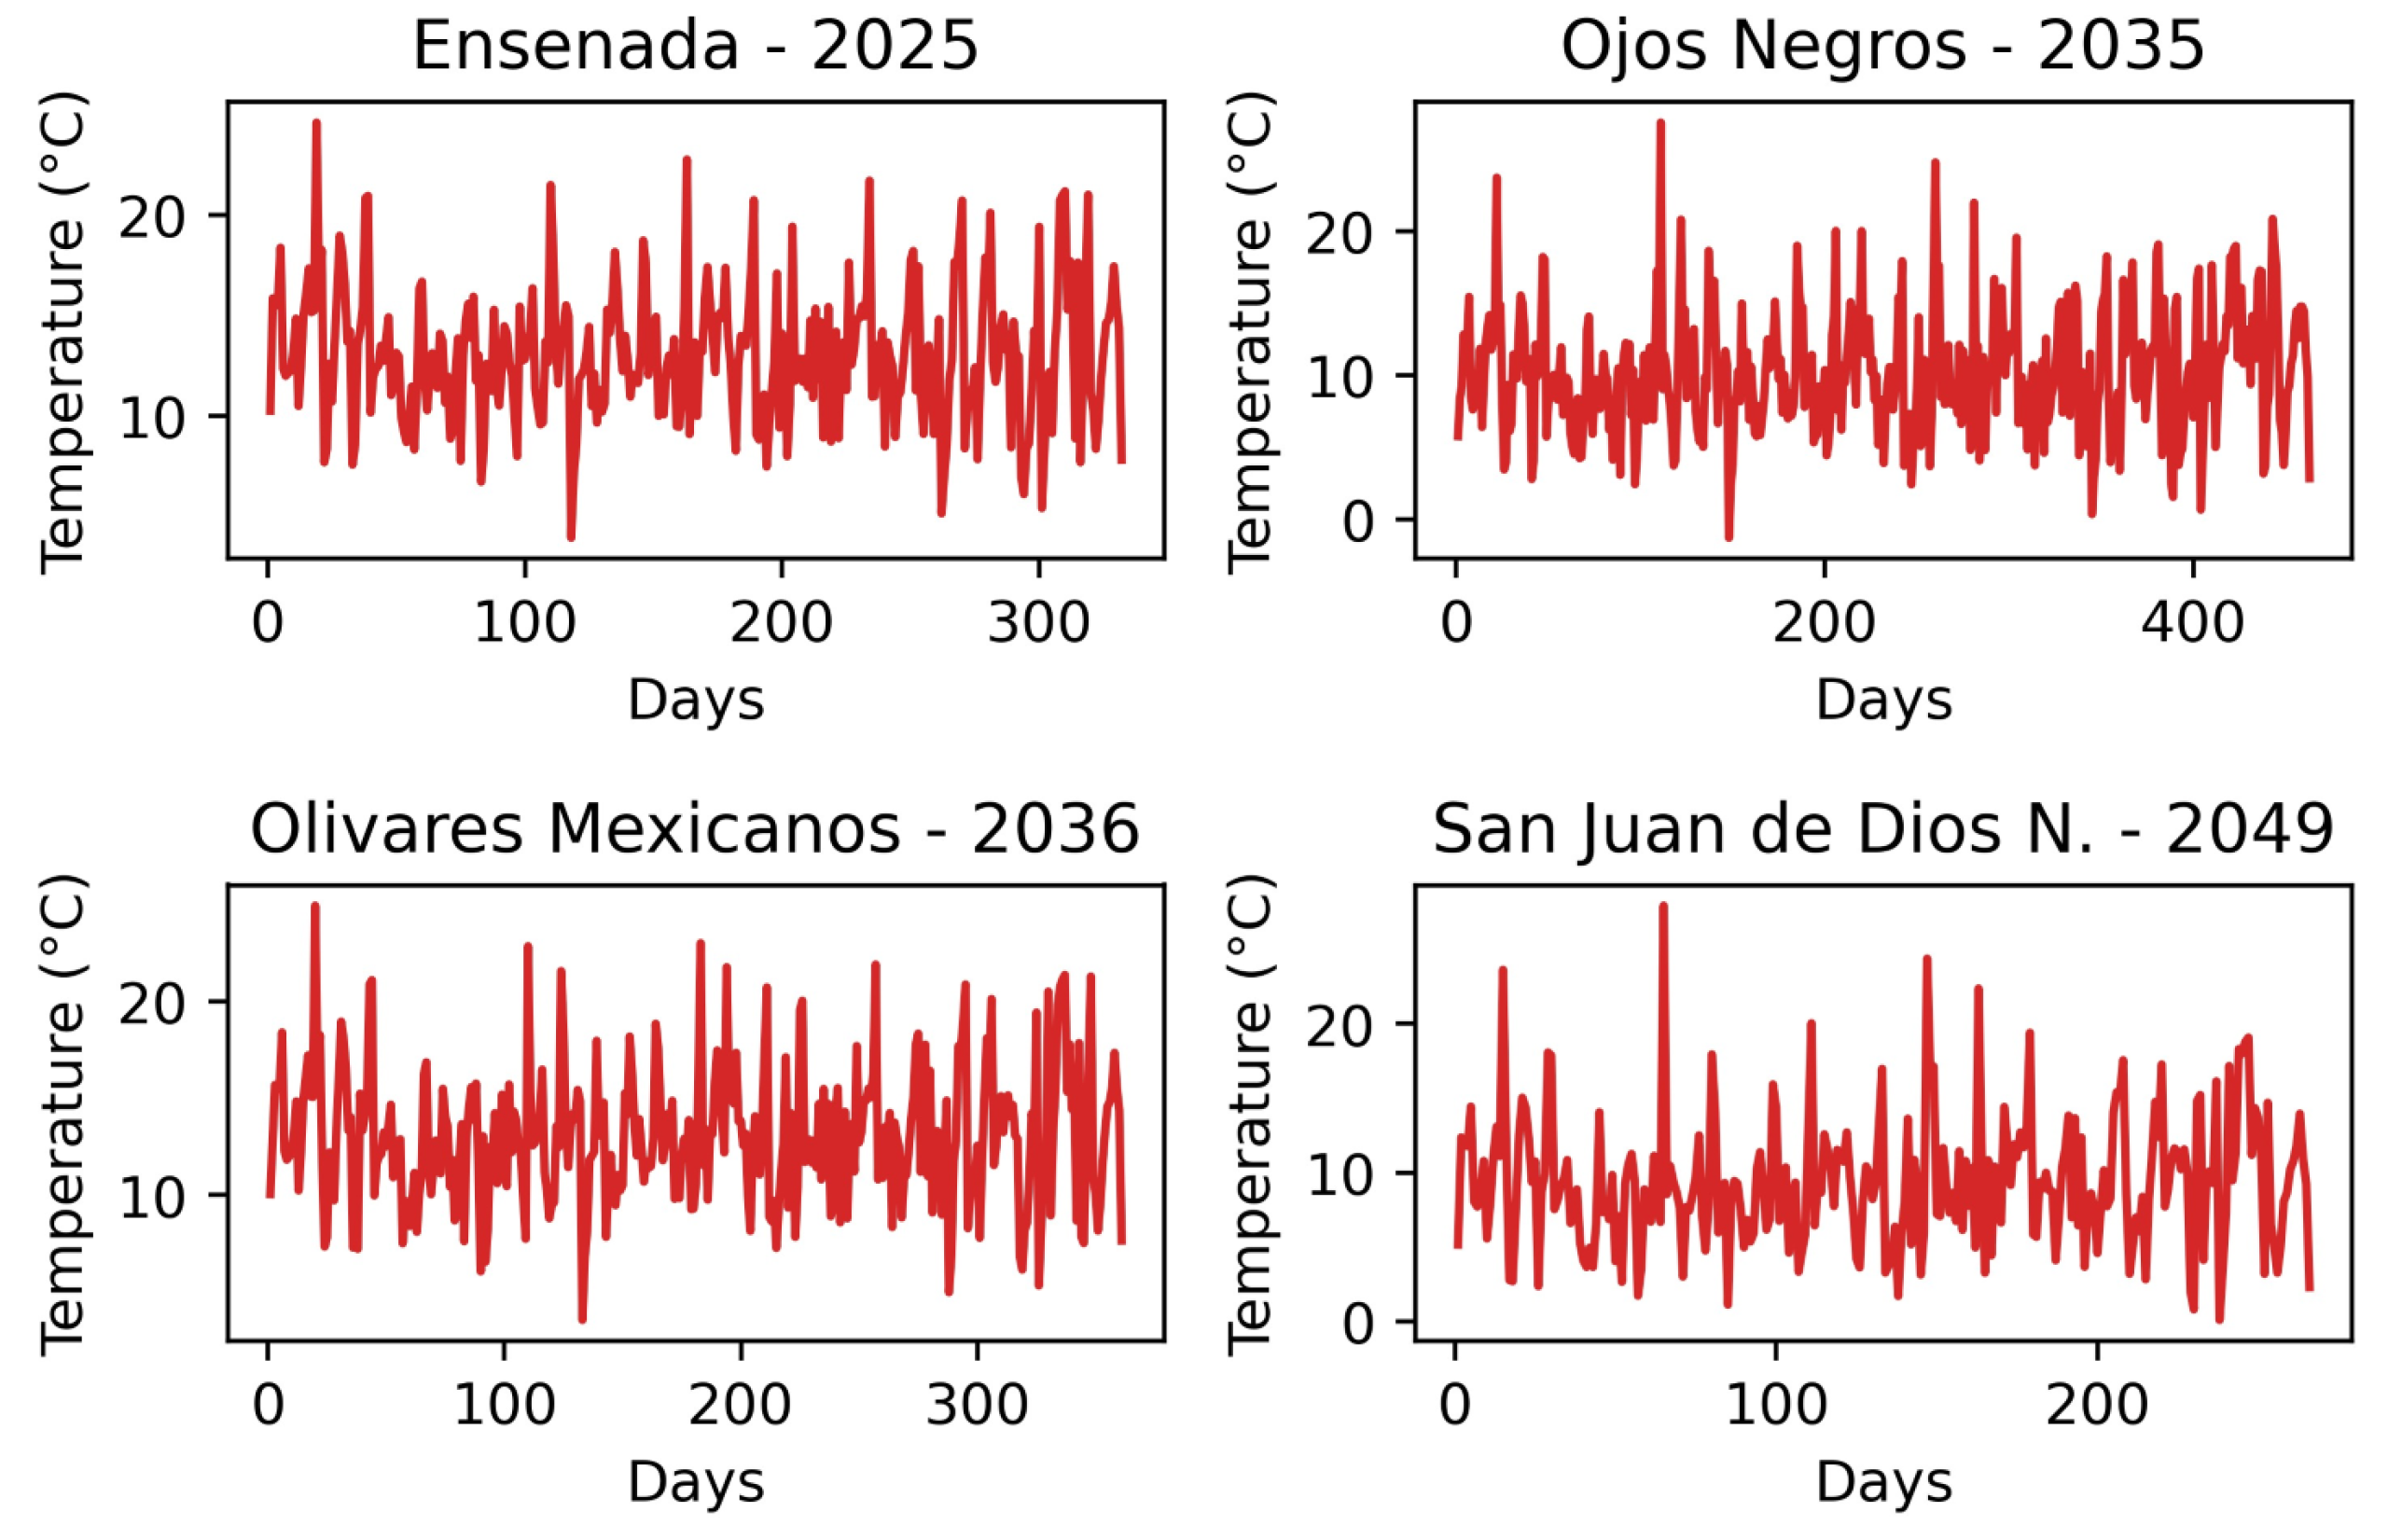
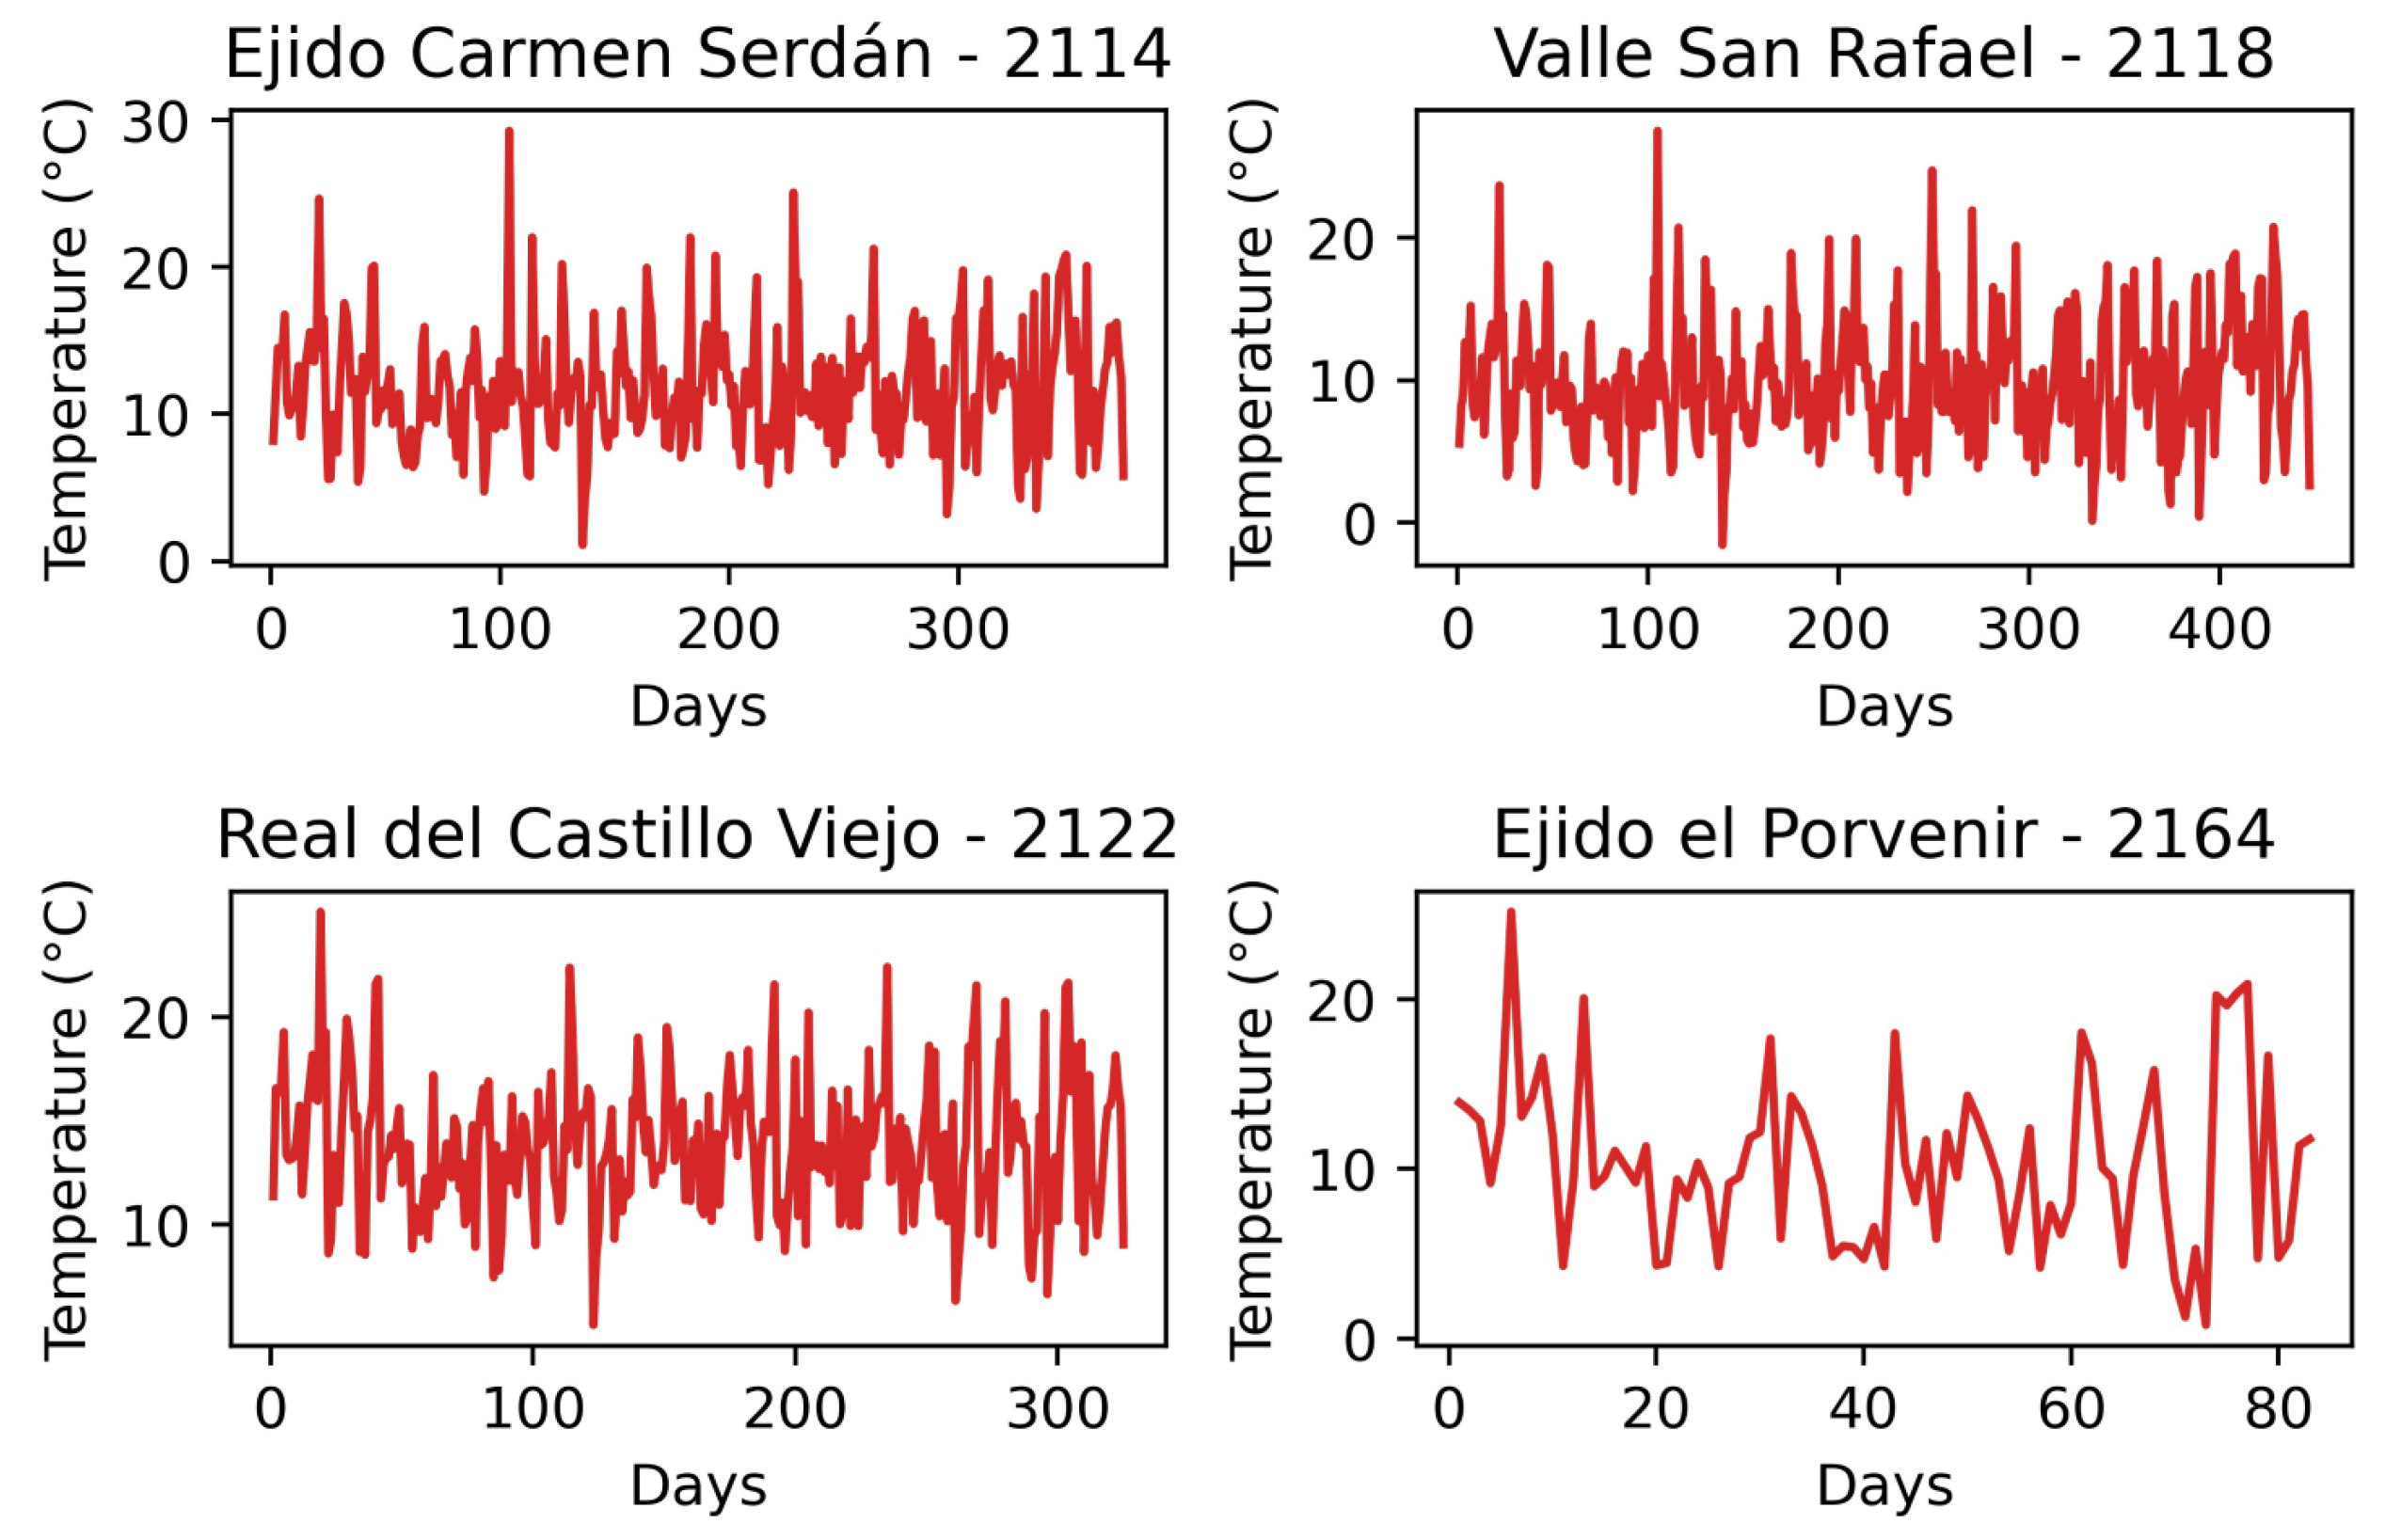
The filter proposed in [3] was used to evaluate the occurrence of days with Santa Ana wind events. This criterion for evaluating a Santa Ana event occurrence was associated with wind speed and wind direction. The benchmark wind speed was established at ≥4.5 m/s and the wind direction criterion were established in winds from the first quadrant. See in section Appendix A.

3.2. Multifractal Analysis

Several signals present self-similarity characteristics, i.e., they show similar properties in all scales. Normally, self-similarity is correlated with fractal dimensions, that is, a non-complete relation between the measure of the domain and the measure of the graph.
The scaling properties of the analyzed meteorological time series were studied with the use of the Multifractal Detrended Fluctuation Analysis (MFDFA). This tool can be used for the detection of multifractality of the time series of concern and the information on scaling behavior and the parameters obtained may eventually help for performing multifractal modelling [27].
According to [7,28,29,30,31], the modified multifractal DFA (MFDFA) procedure consists of five steps. Suppose that x k is a series of length N , and that this series is of compact support, i.e., x k = 0 for an insignificant fraction of the values only.
Step 1—Determine the profile:
Y i k = 1 i x k x ,                 i = 1 , ,   N
Subtraction of the mean x is not compulsory, since it would be eliminated by the later detrending in the third step anyway.
Step 2—Divide the profile Y ( i ) into N s = i n t ( N / s ) non-overlapping segments of equal lengths s . Since the length N of the series is often not a multiple of the considered timescale s , a short part at the end of the profile may remain. In order to disregard this part of the series, the same procedure is repeated, starting from the opposite end. The result is that 2 N s segments are obtained altogether.
Step 3—Calculate the local trend for each of the 2 N s segments by a least square fit of the series. Then determine the variance:
F 2 ( s , v ) 1 s i = 1 s Y v 1 s + i y v ( i ) 2
For each segment v ,   v = 1 , ,   N s , and:
F 2 s , v 1 s i = 1 s Y N v N s s + i y v ( i ) 2
For v = N s + 1 ,   ,   2 N s . Here, y v ( i ) is the fitting polynomial in segment v . Linear, quadratic, cubic, or higher order polynomials can be used in the fitting procedure. Since the detrending of the time series is completed through the subtraction of the polynomial fits from the profile, different order DFA differ in their capability of eliminating trends in the series.
Step 4—Average over all segments to obtain the q th-order fluctuation function, defined as:
F q s 1 2 N s   v = 1 2 N s F 2   s , v q / 2 1 / q
where, in general, the index variable q can take any real value except zero. For q = 2 , the standard DFA procedure is retrieved. Generally, we are interested in how the generalized q dependent fluctuation functions F q s depend on timescale s for different values of q . Hence, we must repeat steps 2, 3, and 4 for several timescales s . It is apparent that F q ( s ) will increase while increasing s . Of course, F q ( s ) depends on the DFA order m . F q ( s ) is intentionally only defined for s m + 2 .
Step 5—Determine the scaling behavior of the fluctuation functions by analyzing log–log plots of F q s versus s for each value of q . If the series x i is long range power law correlated, F q s increases for large values of s as a power law:
F q s ~ s h ( q )
where h ( q ) is the generalized Hurst exponent.
With the relationship τ q = q h q 1 and the Legendre transform α = d τ d q , the multifractal spectrum is obtained as:
f α = q α τ q
For this case study, the multifractal parameters of: α 0 , Δ α , and r were calculated. The width of the spectrum Δ α is the difference between α m a x and α m i n and can be regarded as a direct measure of the degree or complexity of multifractality. The result shows the length to which the fractal exponent extends in the series, which is an indicator of the “richness” of the signal structure. When the value of Δ α is greater, the multifractality is more developed. The α m i n parameter indicates the most extreme events in the studied process, and α m a x indicates the smoothest events. The   α 0 parameter delivers valuable information about the structure of the studied process, with a high value indicating that it is less correlated and possesses fine structure. If the underlying process becomes correlated and loses its fine structure, becoming more regular in appearance, the α 0 value, which indicates at which value of α multifractal spectra achieves its maximum, is low. The multifractal spectrum shape is strongly modified by the asymmetry parameter r . The asymmetry depends on α m a x , α m i n and α 0 . The negative values of r (shape of the singularity spectra is left-skewed) indicate low fractal exponents of small weights, which imply that the extreme events play a prominent role in the temporal structure of the time series. In contrast, a right-skewed spectrum (positive value of r ) means fairly strong weighted fractal exponents, which are typical in fine structure series [4,32].
The fluctuation function, generalized Hurst exponent, mass exponent scaling, multifractal spectrum, and the multifractal parameters ( α m a x , α m i n , α 0 , Δ α   a n d   r ) were calculated for the series of time, temperature, relative humidity, pressure, wind direction, and wind speed for days on which the Santa Ana event occurred. These calculations were completed by using the equations described in (1)–(6).

3.3. Spatialization

Spatial distribution maps were generated by the inverse distance weighting interpolation technique (IDW), using ArcGIS software for the generalized Hurst exponent and the multifractal parameters as α 0 , Δ α , and r for temperature, relative humidity, pressure, wind direction, and wind speed.

4. Results and Discussion

MFDFA is applied to temperature, relative humidity, pressure, wind direction, and wind speed, for the time series that comprise data records between the years 1980 and 2018.
We present the obtained results once the MFDFA method has had been applied. We selected Agua Caliente station as an illustration of the implementation process; the graphs of the output results were constructed using the MFDFA method.
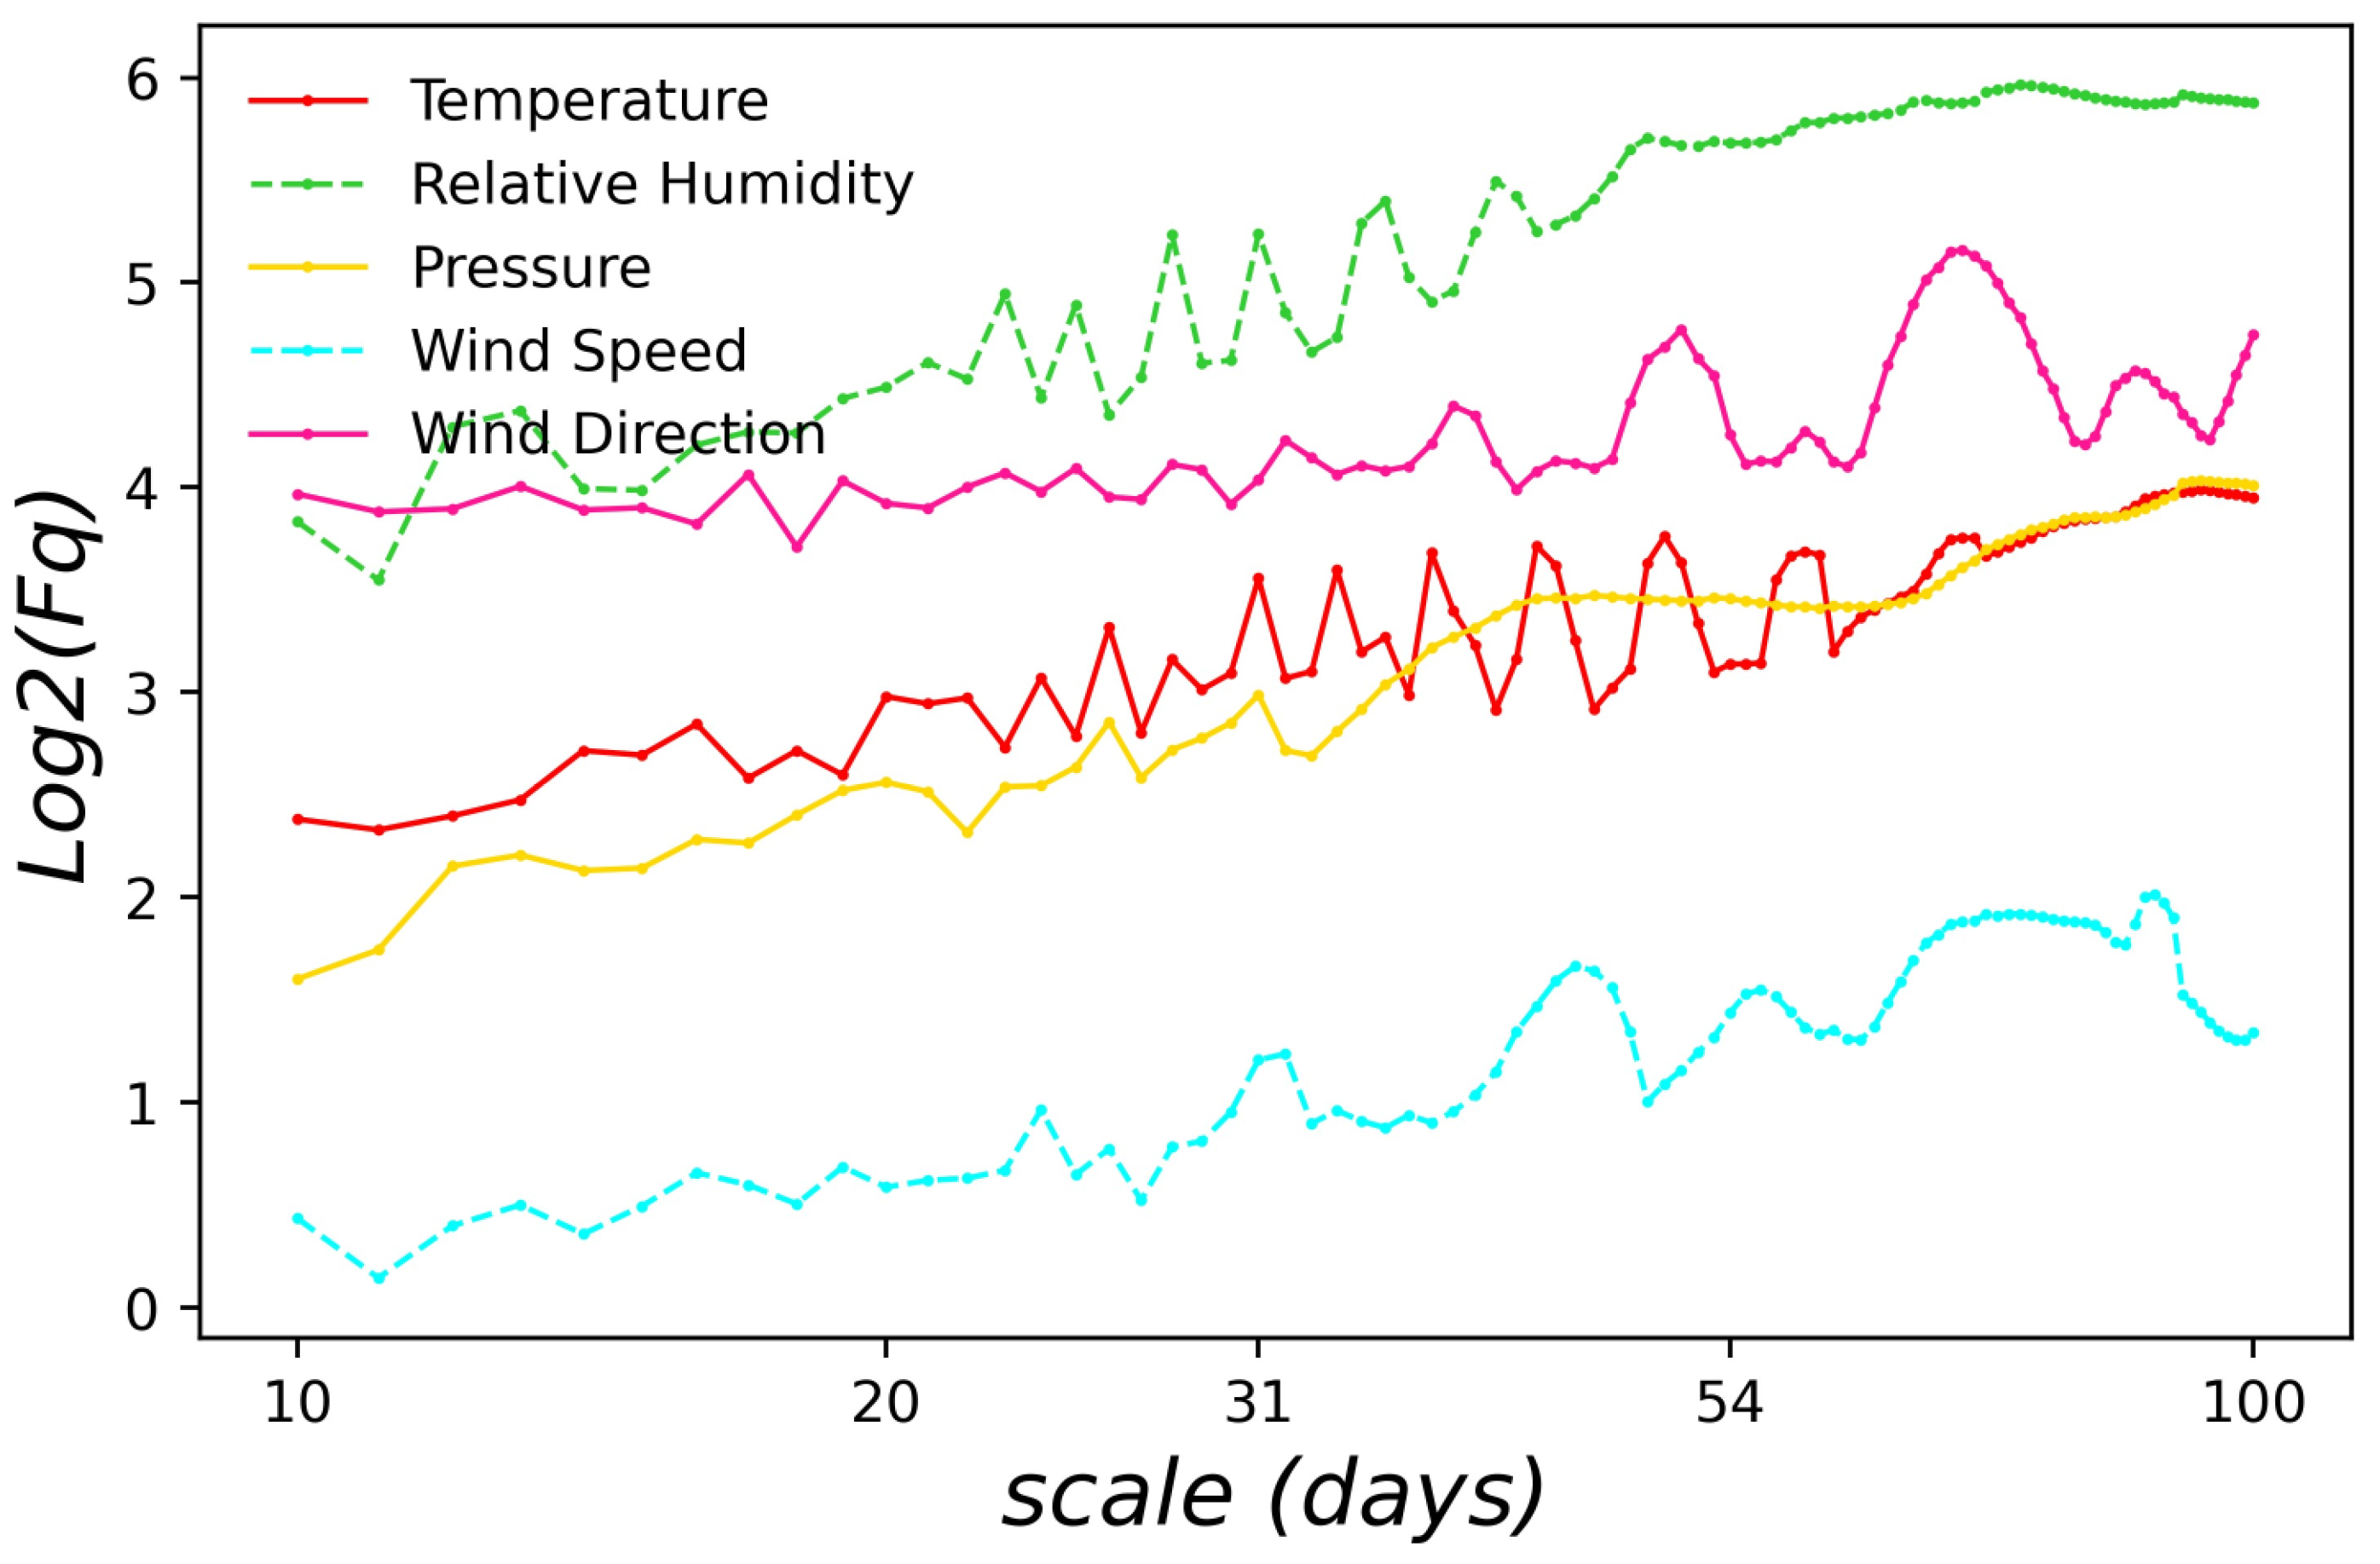
The aim of this study is to obtain a singularity spectrum that can prove the multifractal nature of Santa Ana Winds time series (temperature, relative humidity, pressure, wind direction, and wind speed). To prove the latter, the statistic moment “q” has to be defined. The present study defined it as between −10 and 10. The profile of a series is determined by applying Equation (1) with q = 10 . Once the profile has been defined, a fluctuation analysis is carried out for q = 10 and q = 10 , as shown in Figure 3. It is important to mention that, in this case in particular, fluctuation analysis is carried out with 100 segments or windows.
.
The fluctuation function in Figure 3 represents the function’s evolution, taking into account a determined number of windows for the analysis. Furthermore, this graph shows several fluctuations and changes in the slope in all analyzed variables. Changes in the slope indicate that the signal shows numerous scaling, i.e., it presents with a multifractal nature. This behavior is very similar to the analyzed moments, which in this case are q = 10   and q = 10 .
This previous procedure is carried out for each time series scales (segments) to obtain a relation between F ( s ) and the length of segment S . This is applied to different values of q . On the other hand, the slope of the fluctuation function corresponds to the generalized Hurst exponent for q-order moment h ( q ) (see Equation (5)).
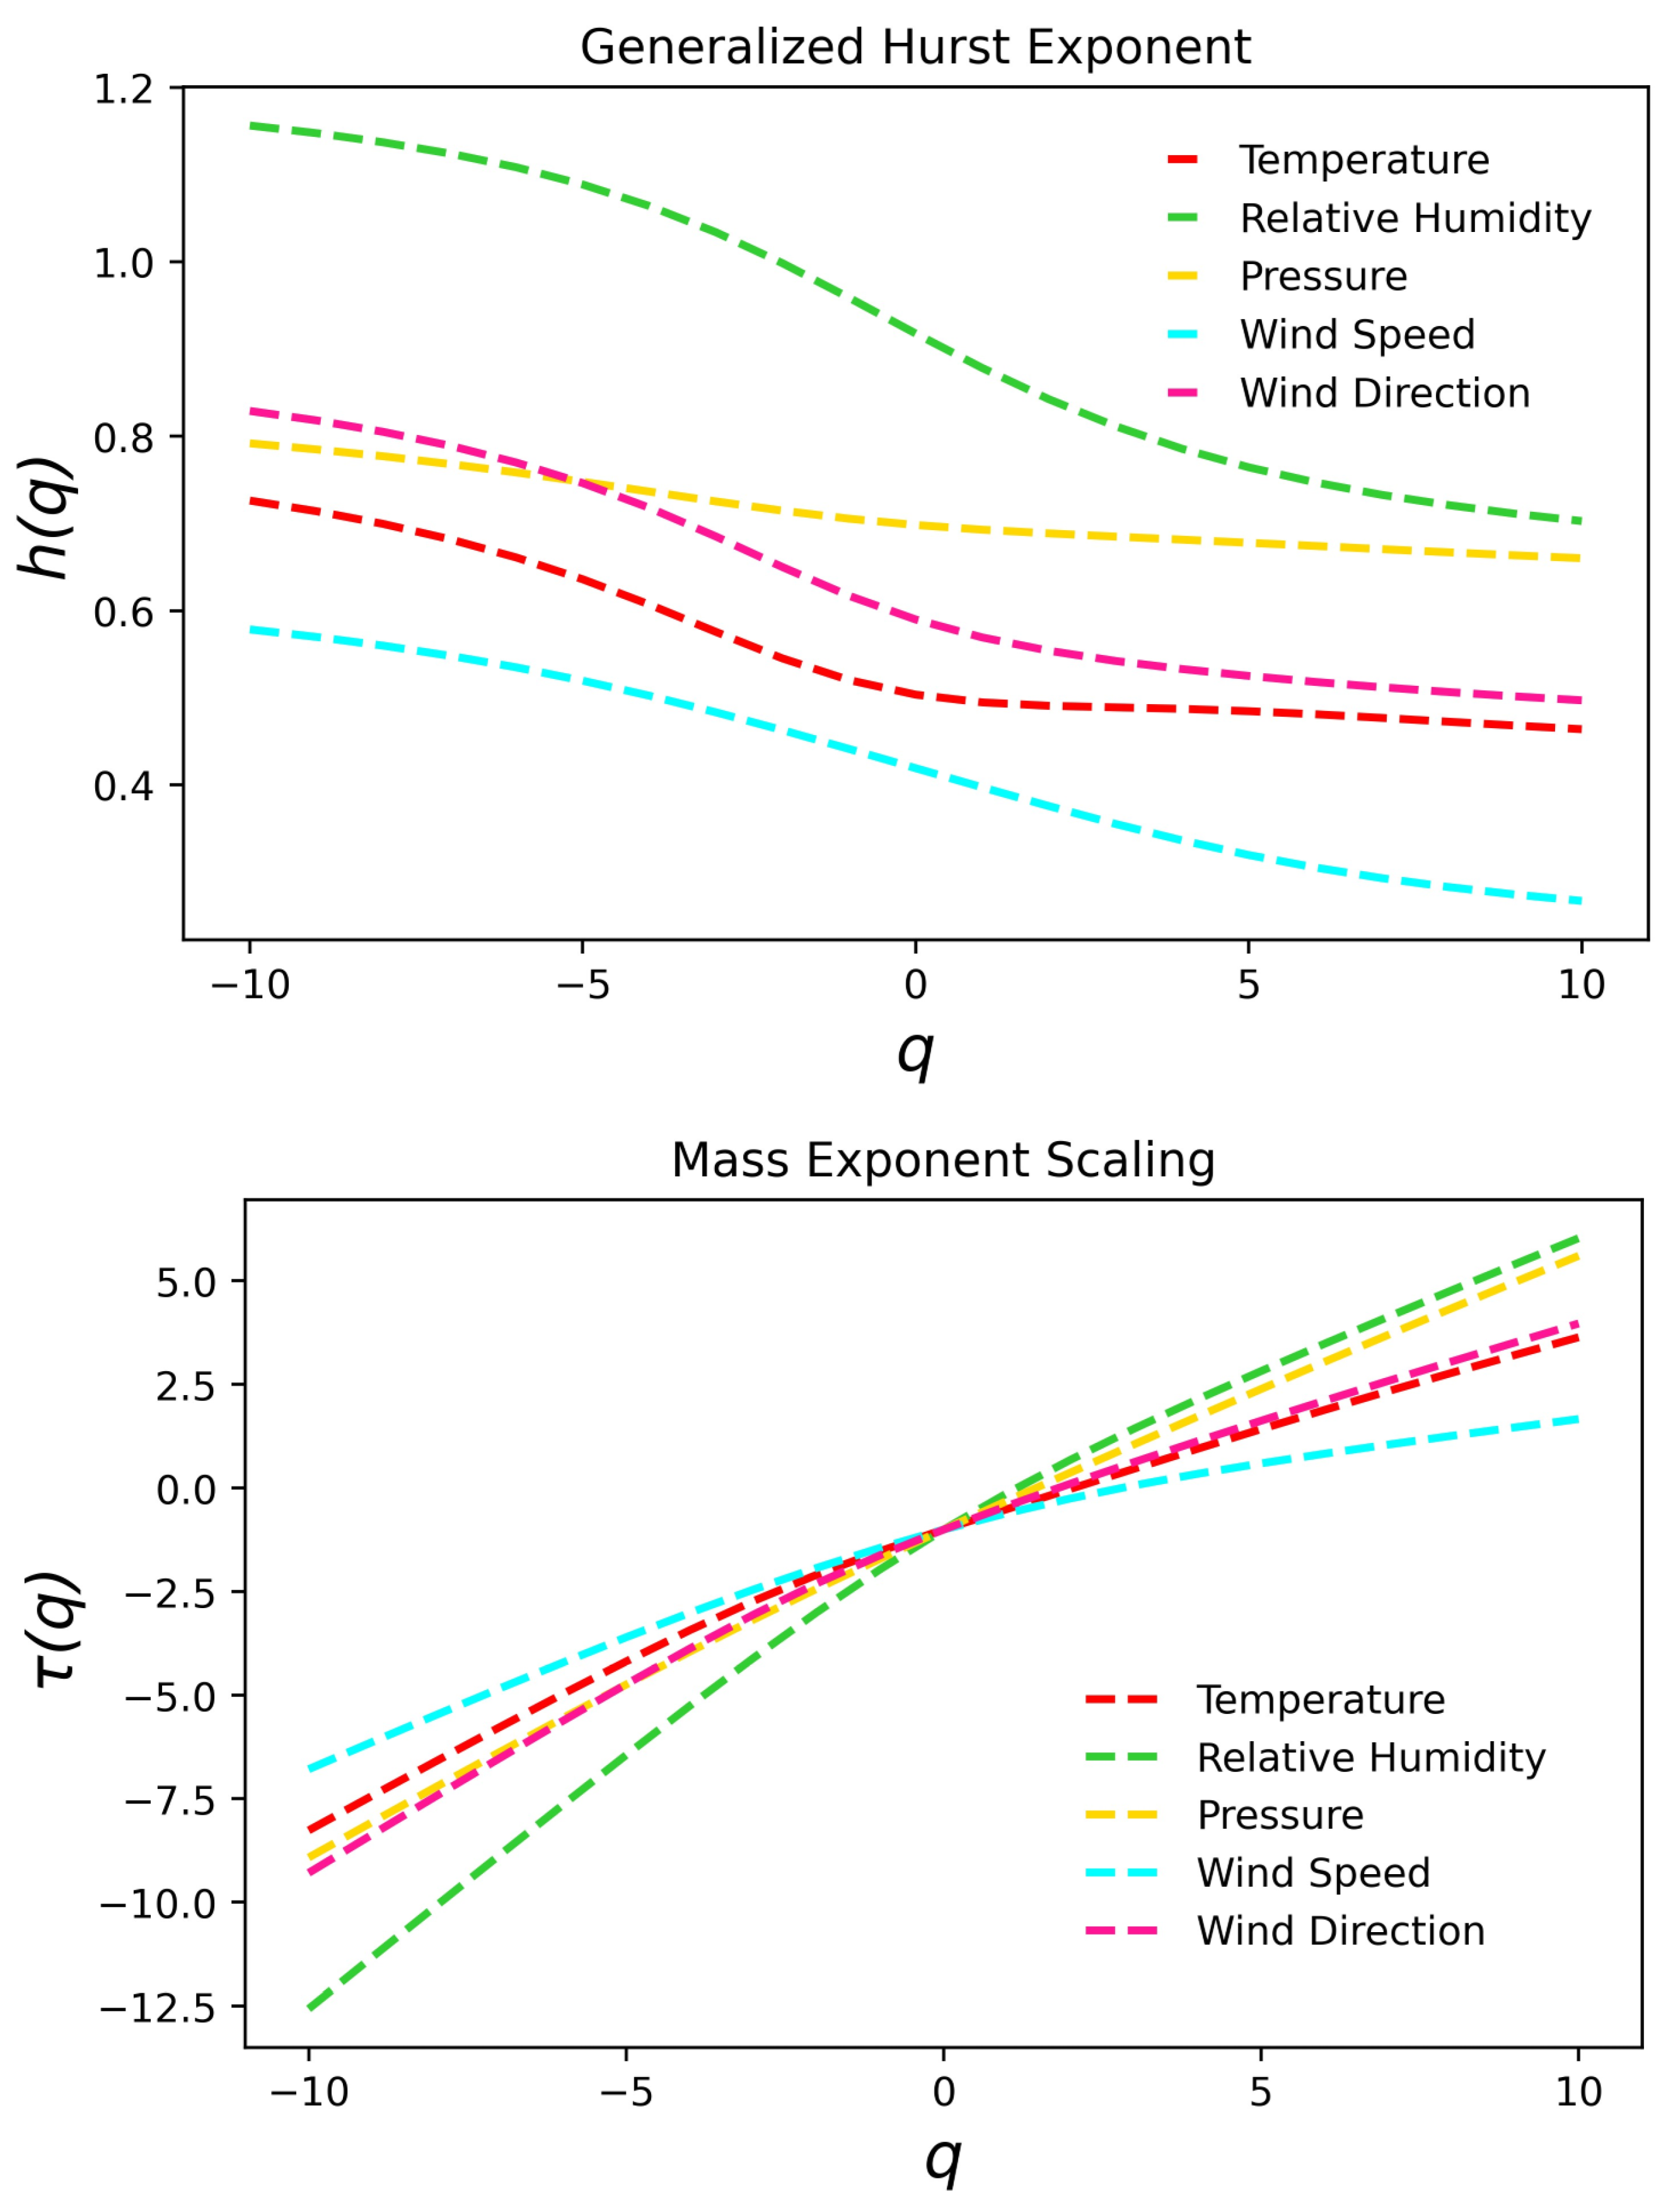
The graph for the generalized Hurst exponent is obtained for values q which range between −10 and 10 (See Figure 4); in some results, functions h ( q ) and τ ( q ) are visible (see Equation (6)).
The preceding figure shows that the Santa Ana winds time series is a multifractal process due to a strong dependency on the generalized exponents q and τ ( q ) . Values q < 0 and q > 0 have different behaviors that are caused by the variation present in the slope line that connects both points, as this line differs for positive and negative values. We have selected temperature to exemplify the change of slope. Table 2 summarizes the changes for the other variables. According to the relationship between the Hurst exponent and h ( q ) , i.e., h ( q = 10 ) 1 = H , the Hurst exponent value equals 0.4638, and fractal dimension can be obtained as D f = ( 2 H ) = 1.5362 . For negative values of q , we calculate a slope τ ( q ) of 0.70, whilst in positive values, the slope is at 0.48. We can also notice that curve τ ( q ) is a convex curve that can be interpreted as an indicator of multifractality.
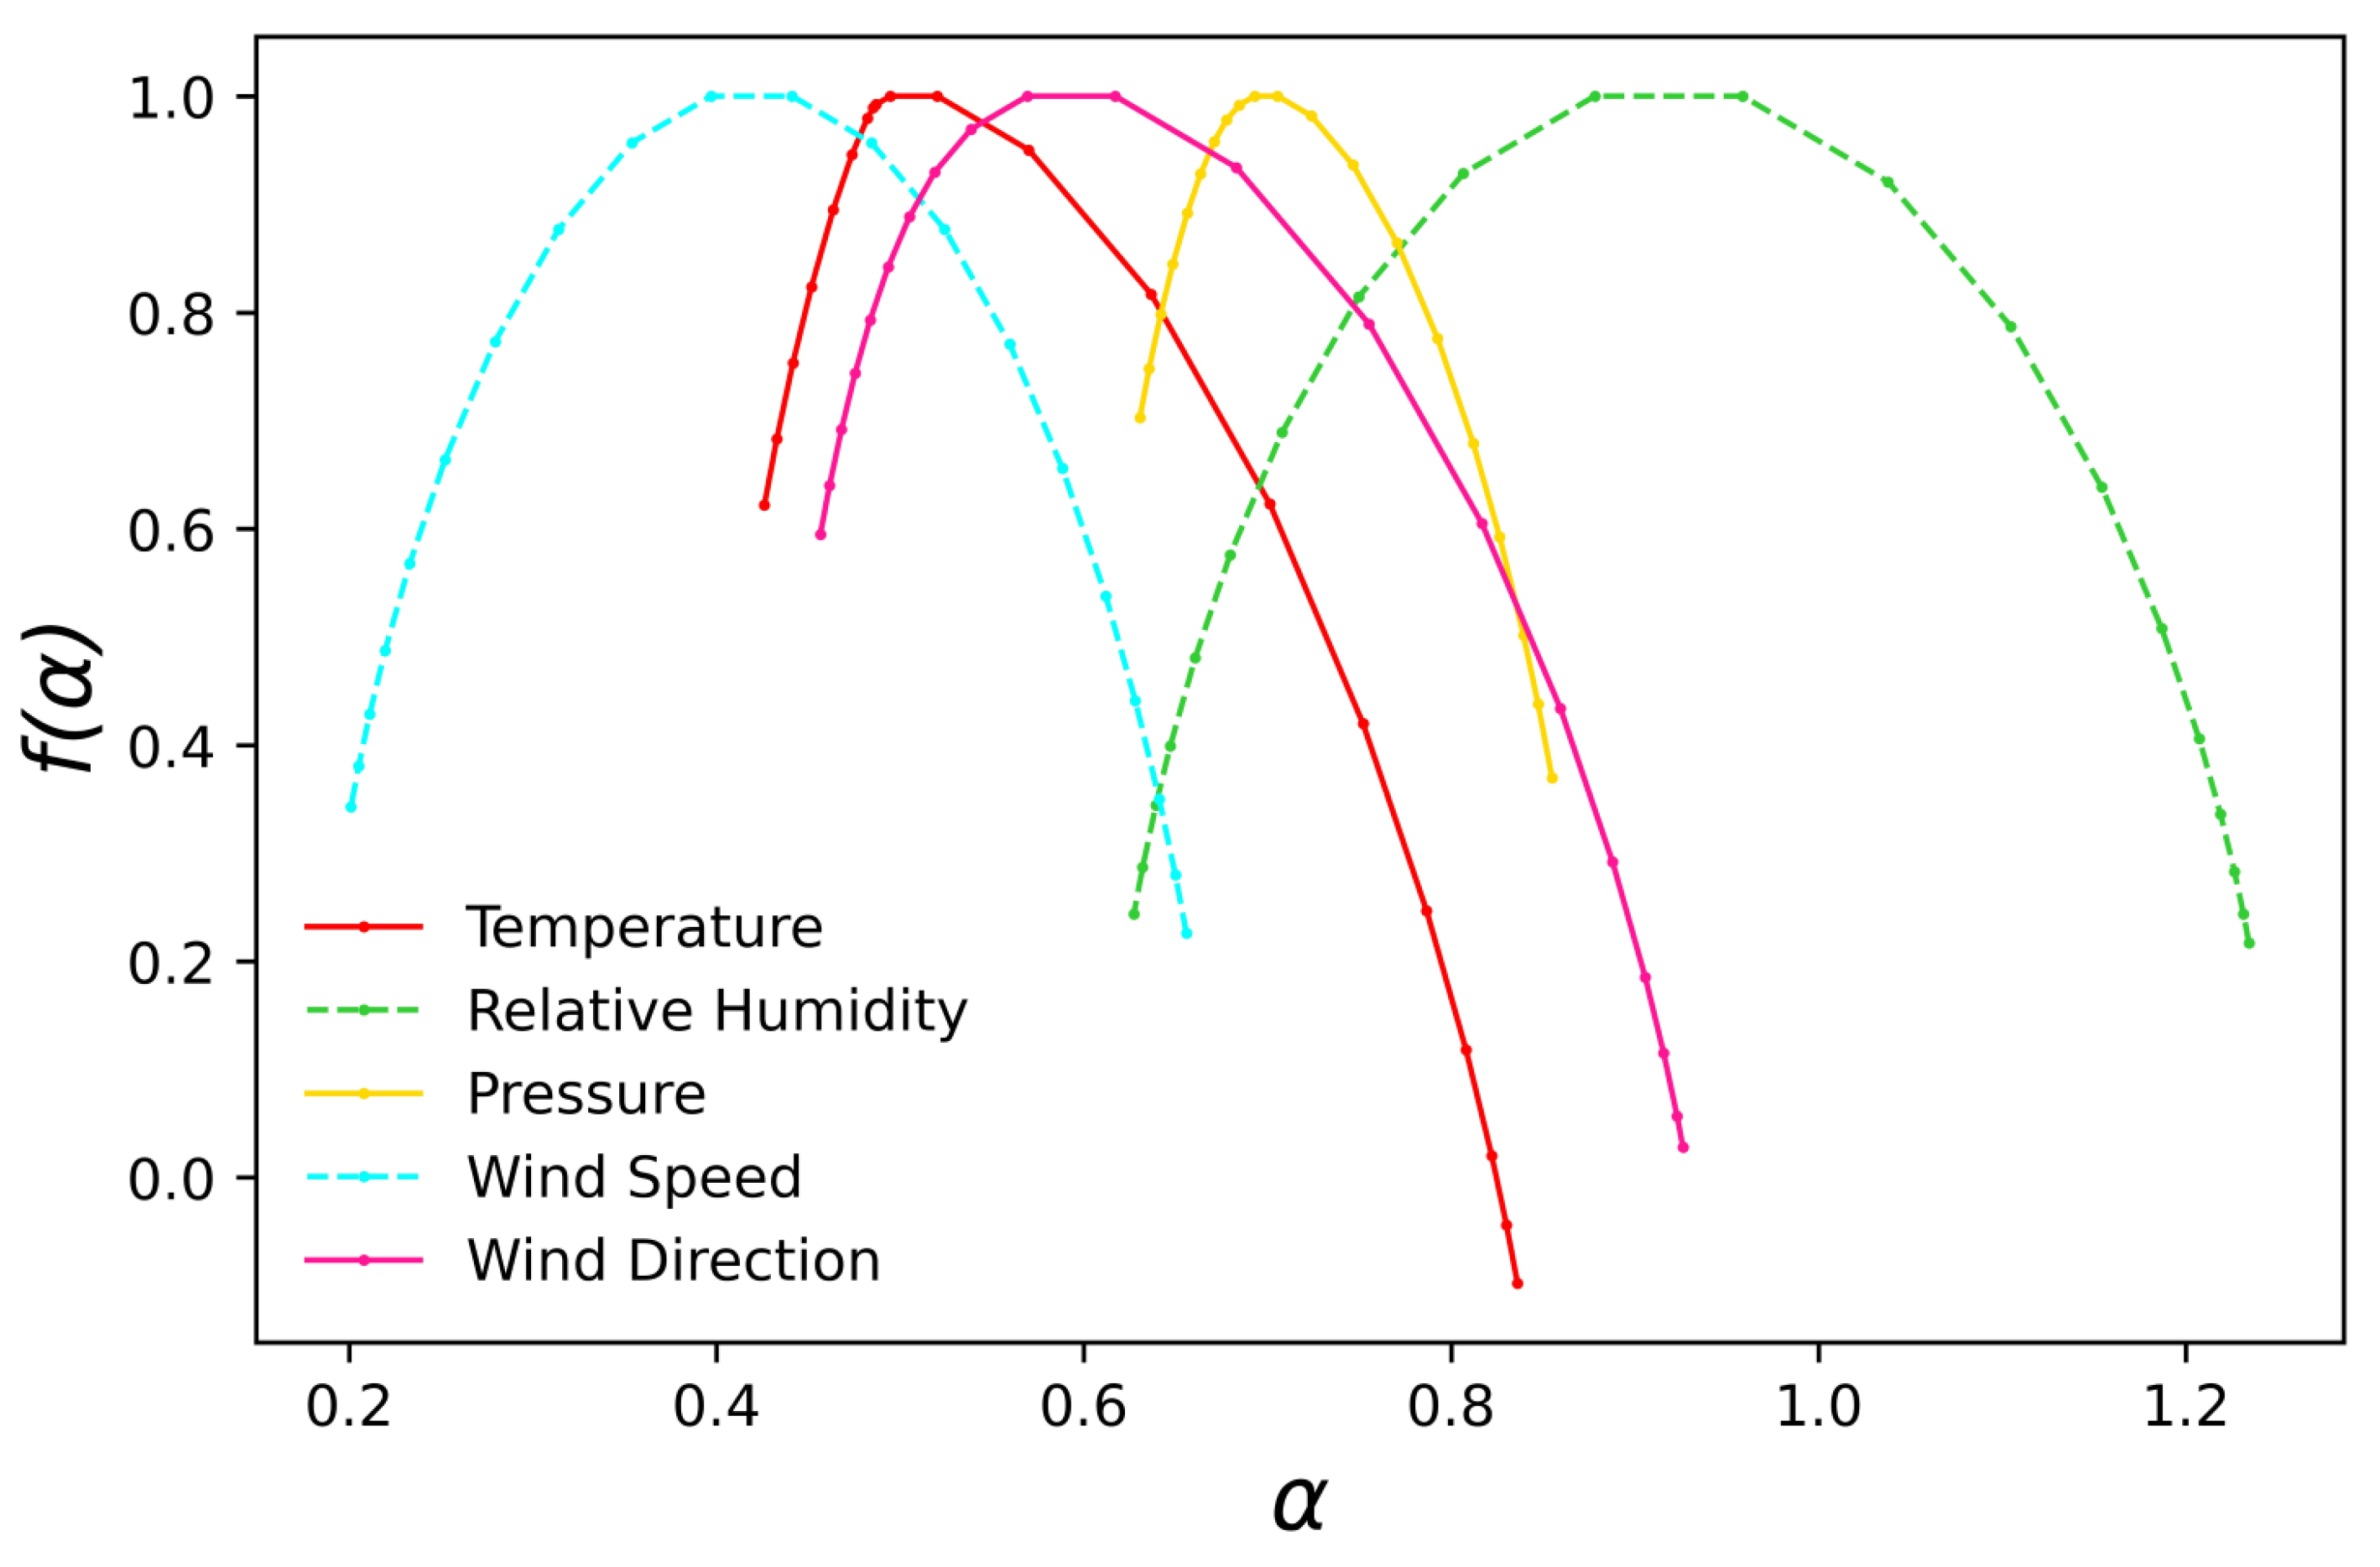
Multifractal—or singularity—spectrum can be obtained following Equation (6), corresponding to both Legendre transform; Figure 5 presents the multifractal spectrum of temperature, relative humidity, pressure, wind speed, and wind direction at Agua Caliente Station with values of q = 10 ,   10 .
The multifractal spectrum in Figure 5 represents a concave function which has different parts of the structure characterized by different values of α , leading to the existence of a multifractal spectrum f ( α ) . On the one hand, the behavior of inverse parabolas is a proof of the multifractal nature of the series and, on the other hand, the spectrum width of Δ α = ( α m a x α m i n ) provides the variability degree that a variable might show, being temperature, relative humidity, pressure, wind speed, and wind direction the variables in this study. Multifractal strength is a measure used to determine the present multifractality strength in a process. The analysis carried out in the present research estimates ( Δ α ) for Santa Ana Winds series data. The temperature spectrum in Figure 5 was chosen to exemplify the width estimation, presenting values of α m a x = 0.8361 and α m i n = 0.426 for temperature. Hence, the width of the spectrum has a value of Δ α = 0.41 . The previous values of ( α m a x α m i n ) represent the range between the maximum and minimum values of temperature. Estimations of the width for the other variables and stations are shown in Table 2.
When a concentrated accumulation of points is found on both extremes, it might indicate the existence of extreme values far from the average. This can be useful for larger orders with q ranges, as happens at the Agua Caliente station. Conversely, if one multifractal spectrum branch is smaller than the other, it might indicate heterogeneity values with the spectrums of temperature, pressure, and wind direction, as observed in Figure 5.
Visually, multifractal spectrums of relative humidity and wind speed seem to have homogeneous values of α and f ( α ) because both left and right branches have a similar length. Nonetheless, with the estimations of the asymmetry parameter, it was found that these were asymmetric to the right. This information will be discussed in more detail later.
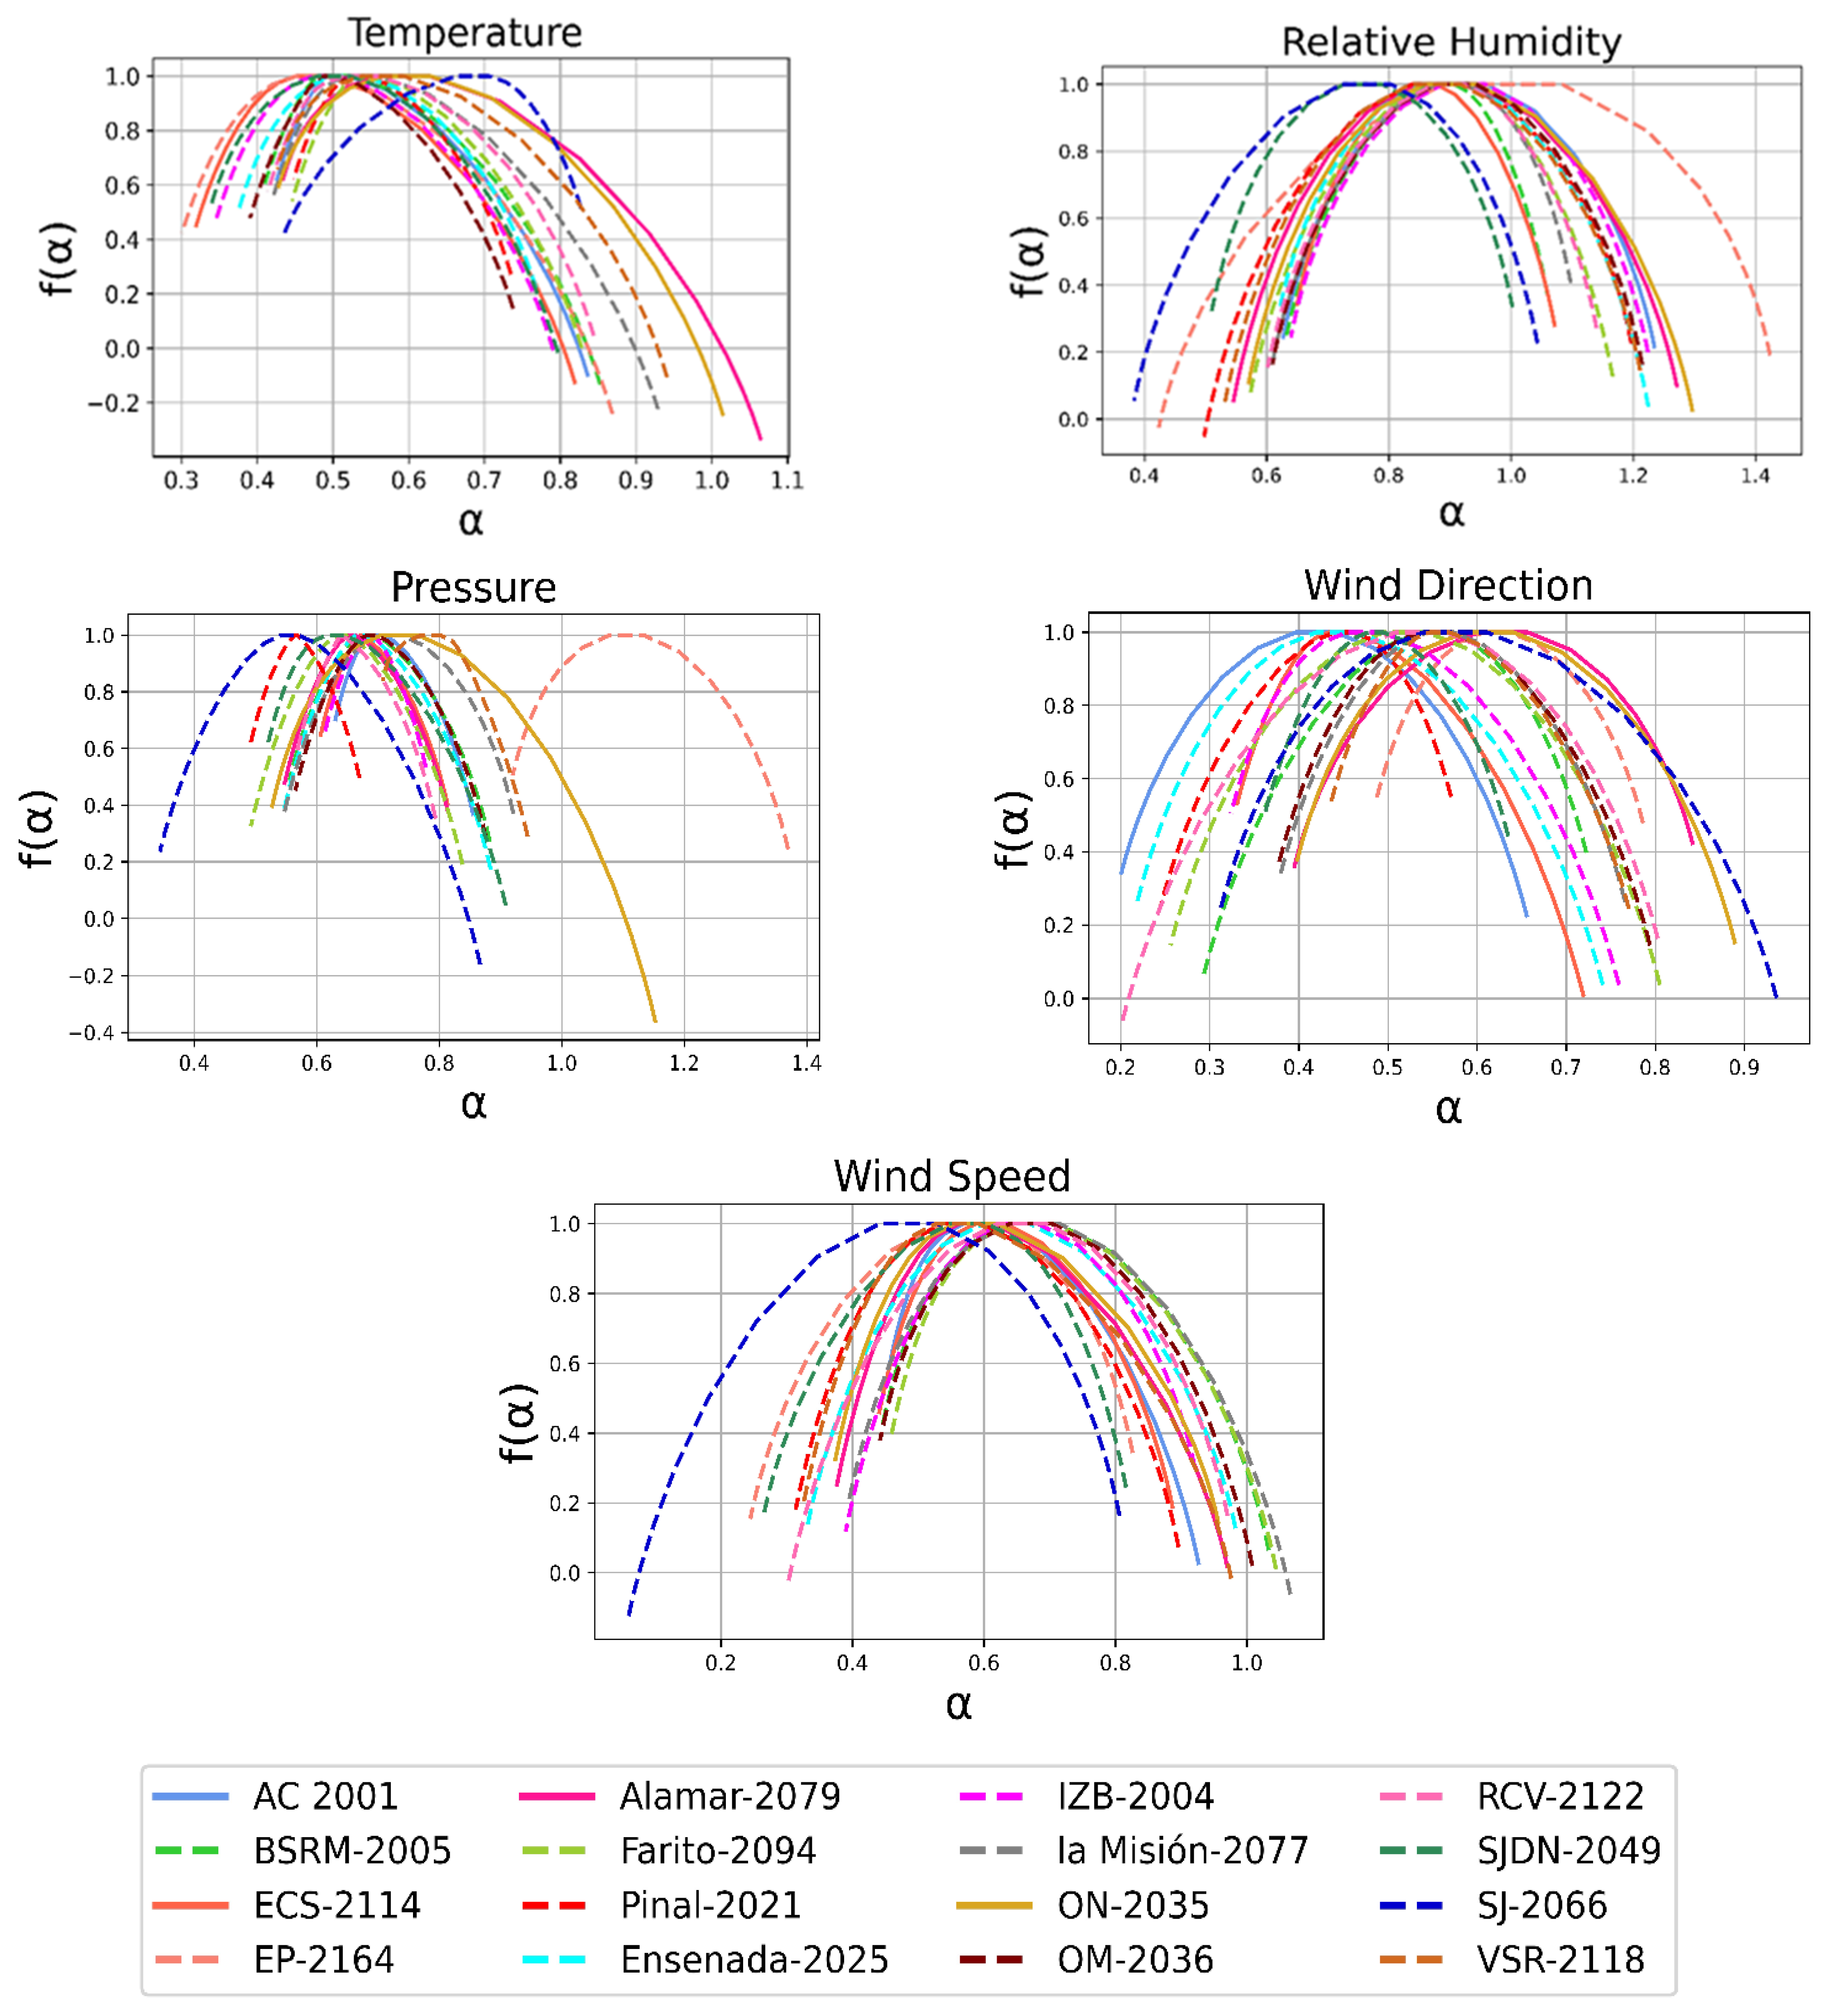
Figure 6 shows the multifractal spectrum of each station for each analyzed variable of the Santa Ana Winds.
The multifractal spectrum of the studied meteorological variables shows spatial differentiation. In addition, the temperature spectrum has the longest left branch of the other variables (Figure 6). This is attributed to the time series multifractal structure that is insensitive to the local fluctuations with large magnitudes [33].
Among the analyzed time series in Table 2, both pressure and relative humidity exhibit h ( q ) values greater than 0.5, with the exception of the Sierra de Juárez station (2066), where the h ( q ) for this variable falls below 0.5. This exception highlights the unique dynamics at the highest point above sea level of the Guadalupe basin, indicating an anti-persistent behavior. Generally, this basin has a persistent behavior, i.e., the relative humidity series have a high probability of showing a positive increasing behavior. This implies that the relative humidity time series has a degree of occurrence over future events or in its long-term behavioral memory, the same occurrence for the pressure variables.
Conversely, the lowest h ( q ) values were obtained for wind speed (0.17–0.52), wind direction (0.27–0.53), and temperature (0.36–0.49), suggesting anti-persistence behavior in these time series. This means that the temperature, wind speed, and wind direction variables in this region often exhibit a pattern of positive increases followed by subsequent decreases in their recorded values, and vice versa. According to Malamud and Turcotte, an anti-persistent time series will have a stationary behavior in time due to the increases and decreases that compensate each other. The statistical moments are independent from the time series [31].
Nonetheless, there are some exceptions, e.g., the wind direction at the Ejido Porvenir station (station 2164) has a 0.53 h ( q ) value, i.e., it has a persistent behavior in contrast to the values reported at the other stations (Table 2). This value demonstrates that there is a correlation between the length and h ( q ) values corresponding to the time series of the wind direction variable. For the Guadalupe sub-basin, wind speed exhibits values of anti-persistence and randomness, because the h ( q ) values in some stations are below 0.5 (station 2049—San Juan de Dios Norte) while it is equal to 0.5 in others (station 2001—Agua Caliente). The above may be associated with the inverse correlation found between altitude and longitude with respect to the h ( q ) values.
The results of the h ( q ) values of the temperature, speed, and direction of the wind variables denote that the Santa Ana winds exhibit high climatic variability in the area.
Although temperature was not one of the criteria used to evaluate the occurrence of wind days in Santa Ana, the h ( q ) values of this variable show the influence and occurrence of the Santa Ana wind in the temperature time series itself, i.e., in this case, the h ( q ) values of the temperature can be considered as a criterion to identify the occurrence of the Santa Ana winds in the region.
Based on the h ( q ) values and considering the moment of order q (−10 to 10), it can be noticed that the Sierra de Juárez meteorological station (2066) shows a different behavior from the rest of the stations, i.e., the values of h ( q ) for the relative humidity, pressure, and wind speed variables are lower compared to the other stations. This difference can be attributed to the fact that the station in question is located at the highest point of the basin, as shown in Table 2.
According to [34], when the multifractal parameter of α 0 is equal to 0.5, the time series are considered random. For α 0 values less than 0.5, the series are anti-persistent, i.e., they present abrupt changes over time. For values of α 0 greater than 0.5, the series exhibit persistent behavior, indicating that the time series do not show abrupt changes over time.
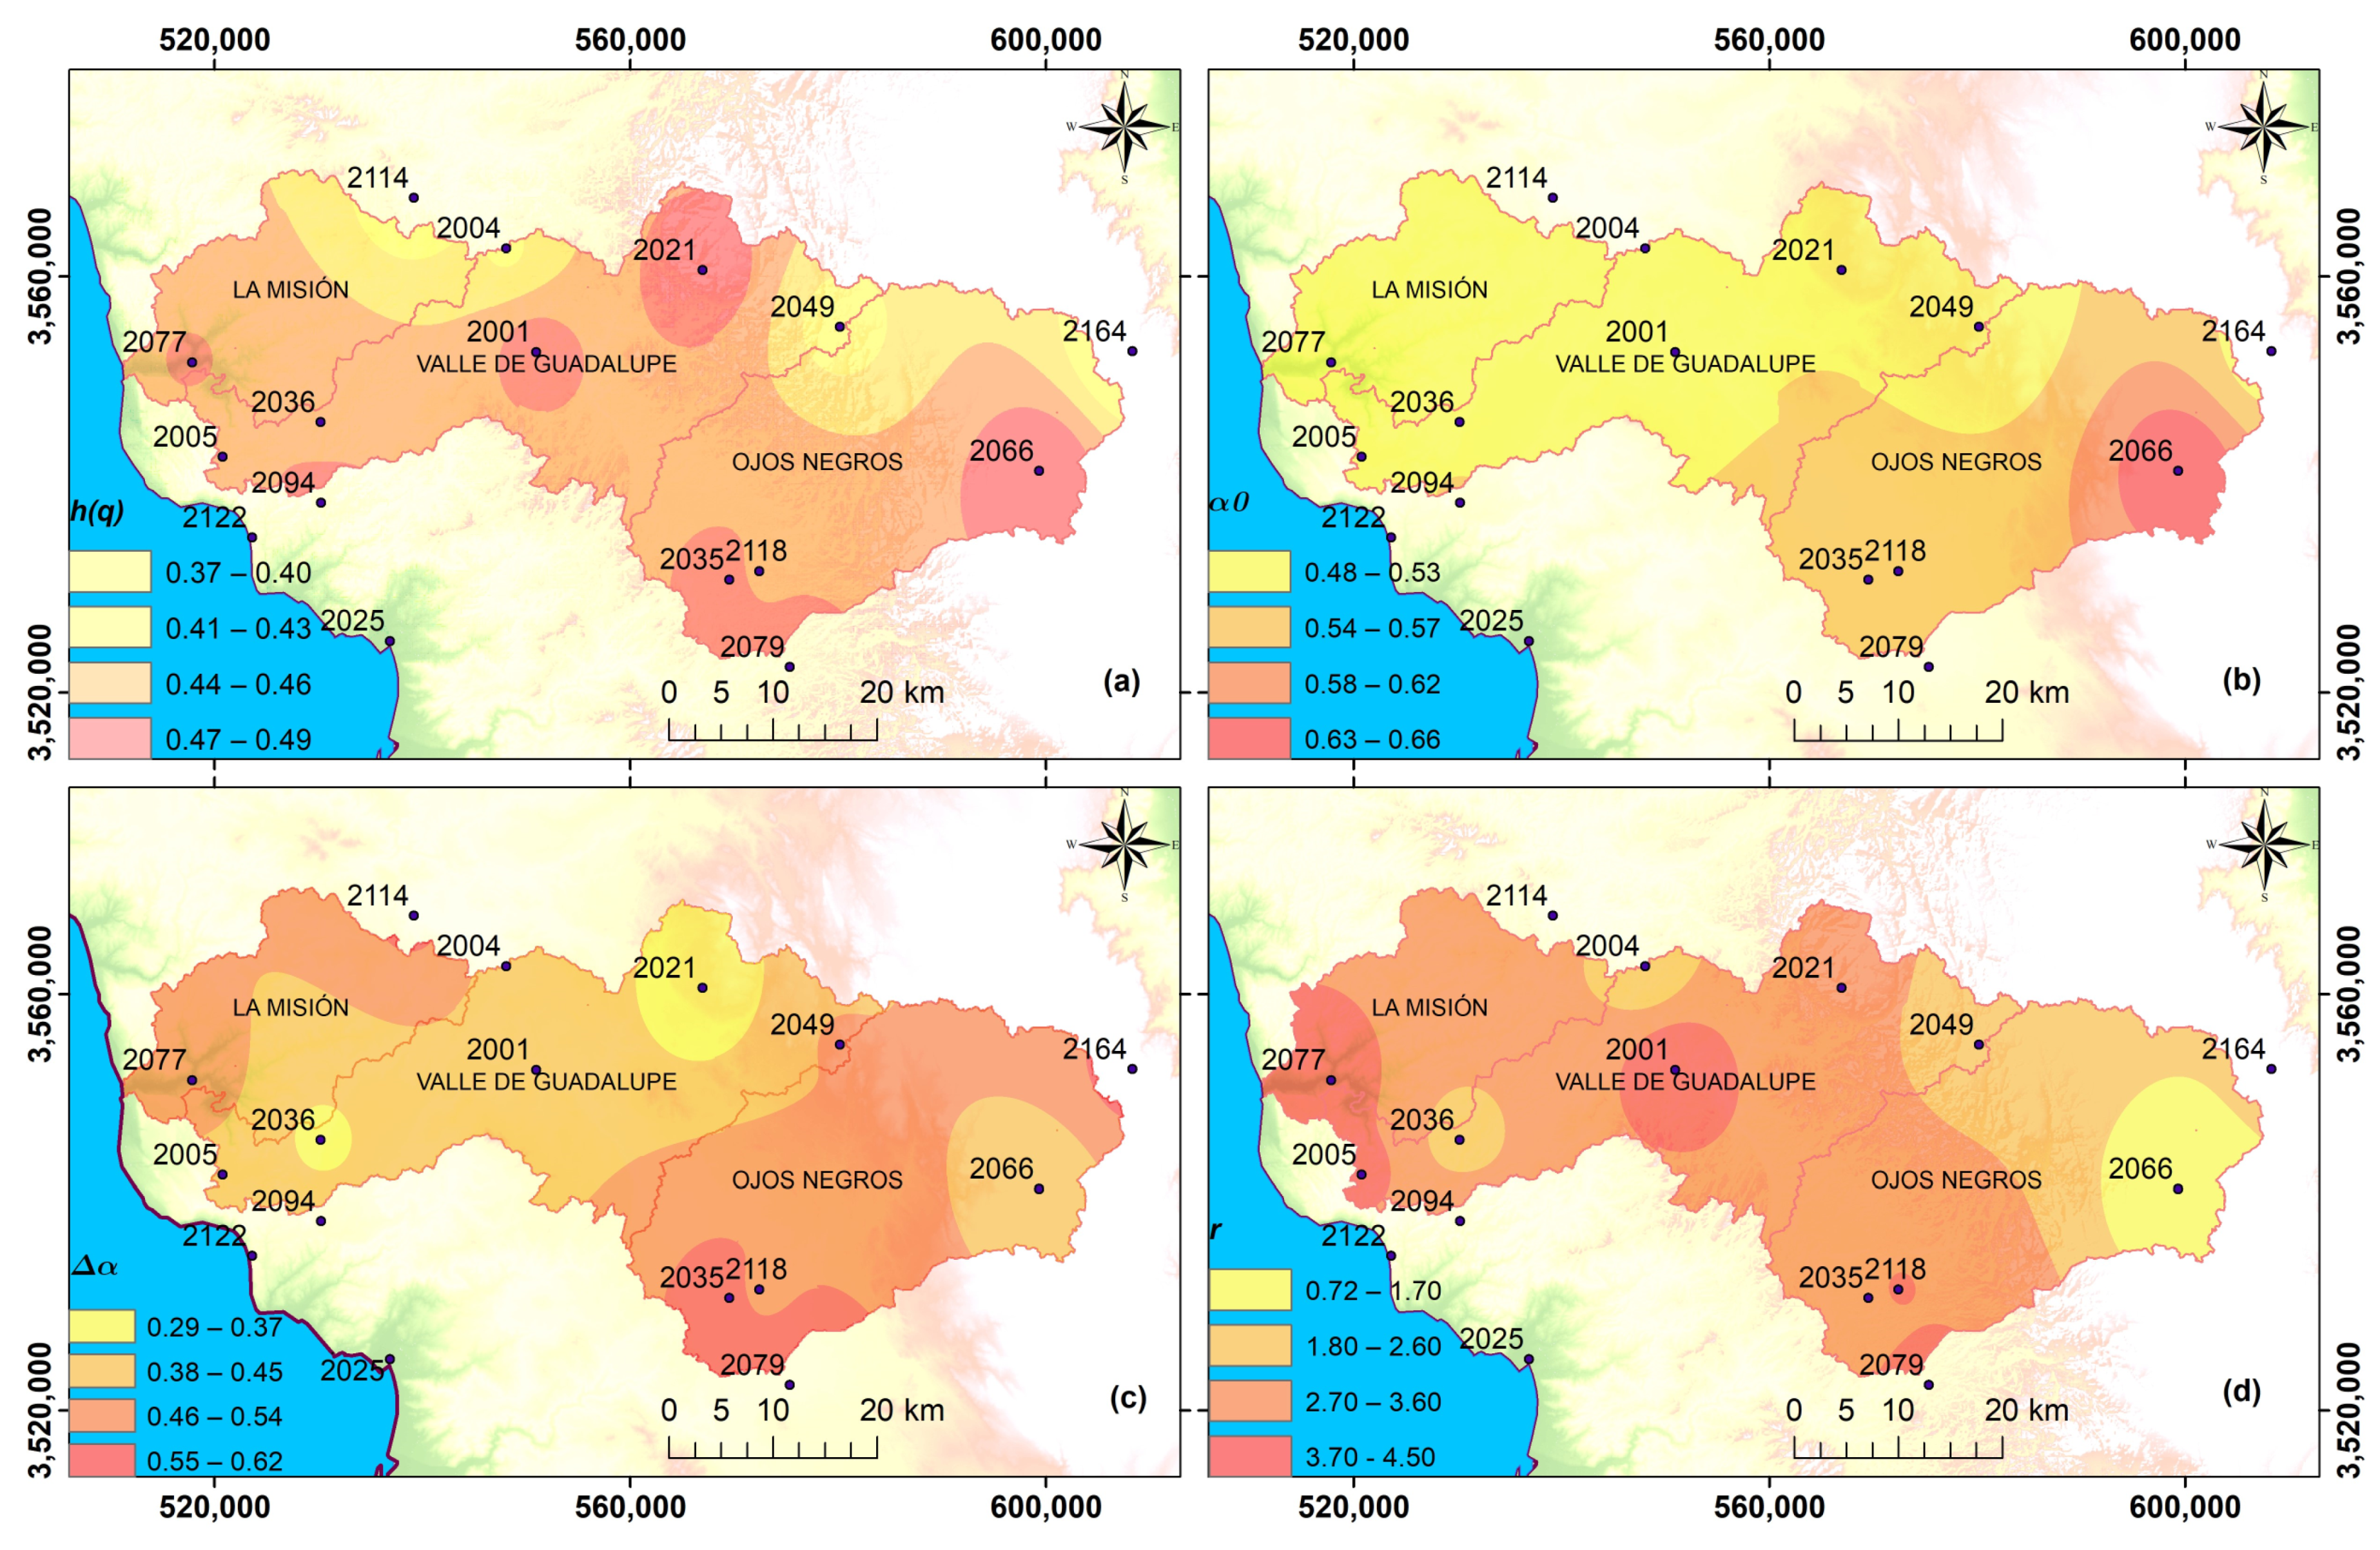
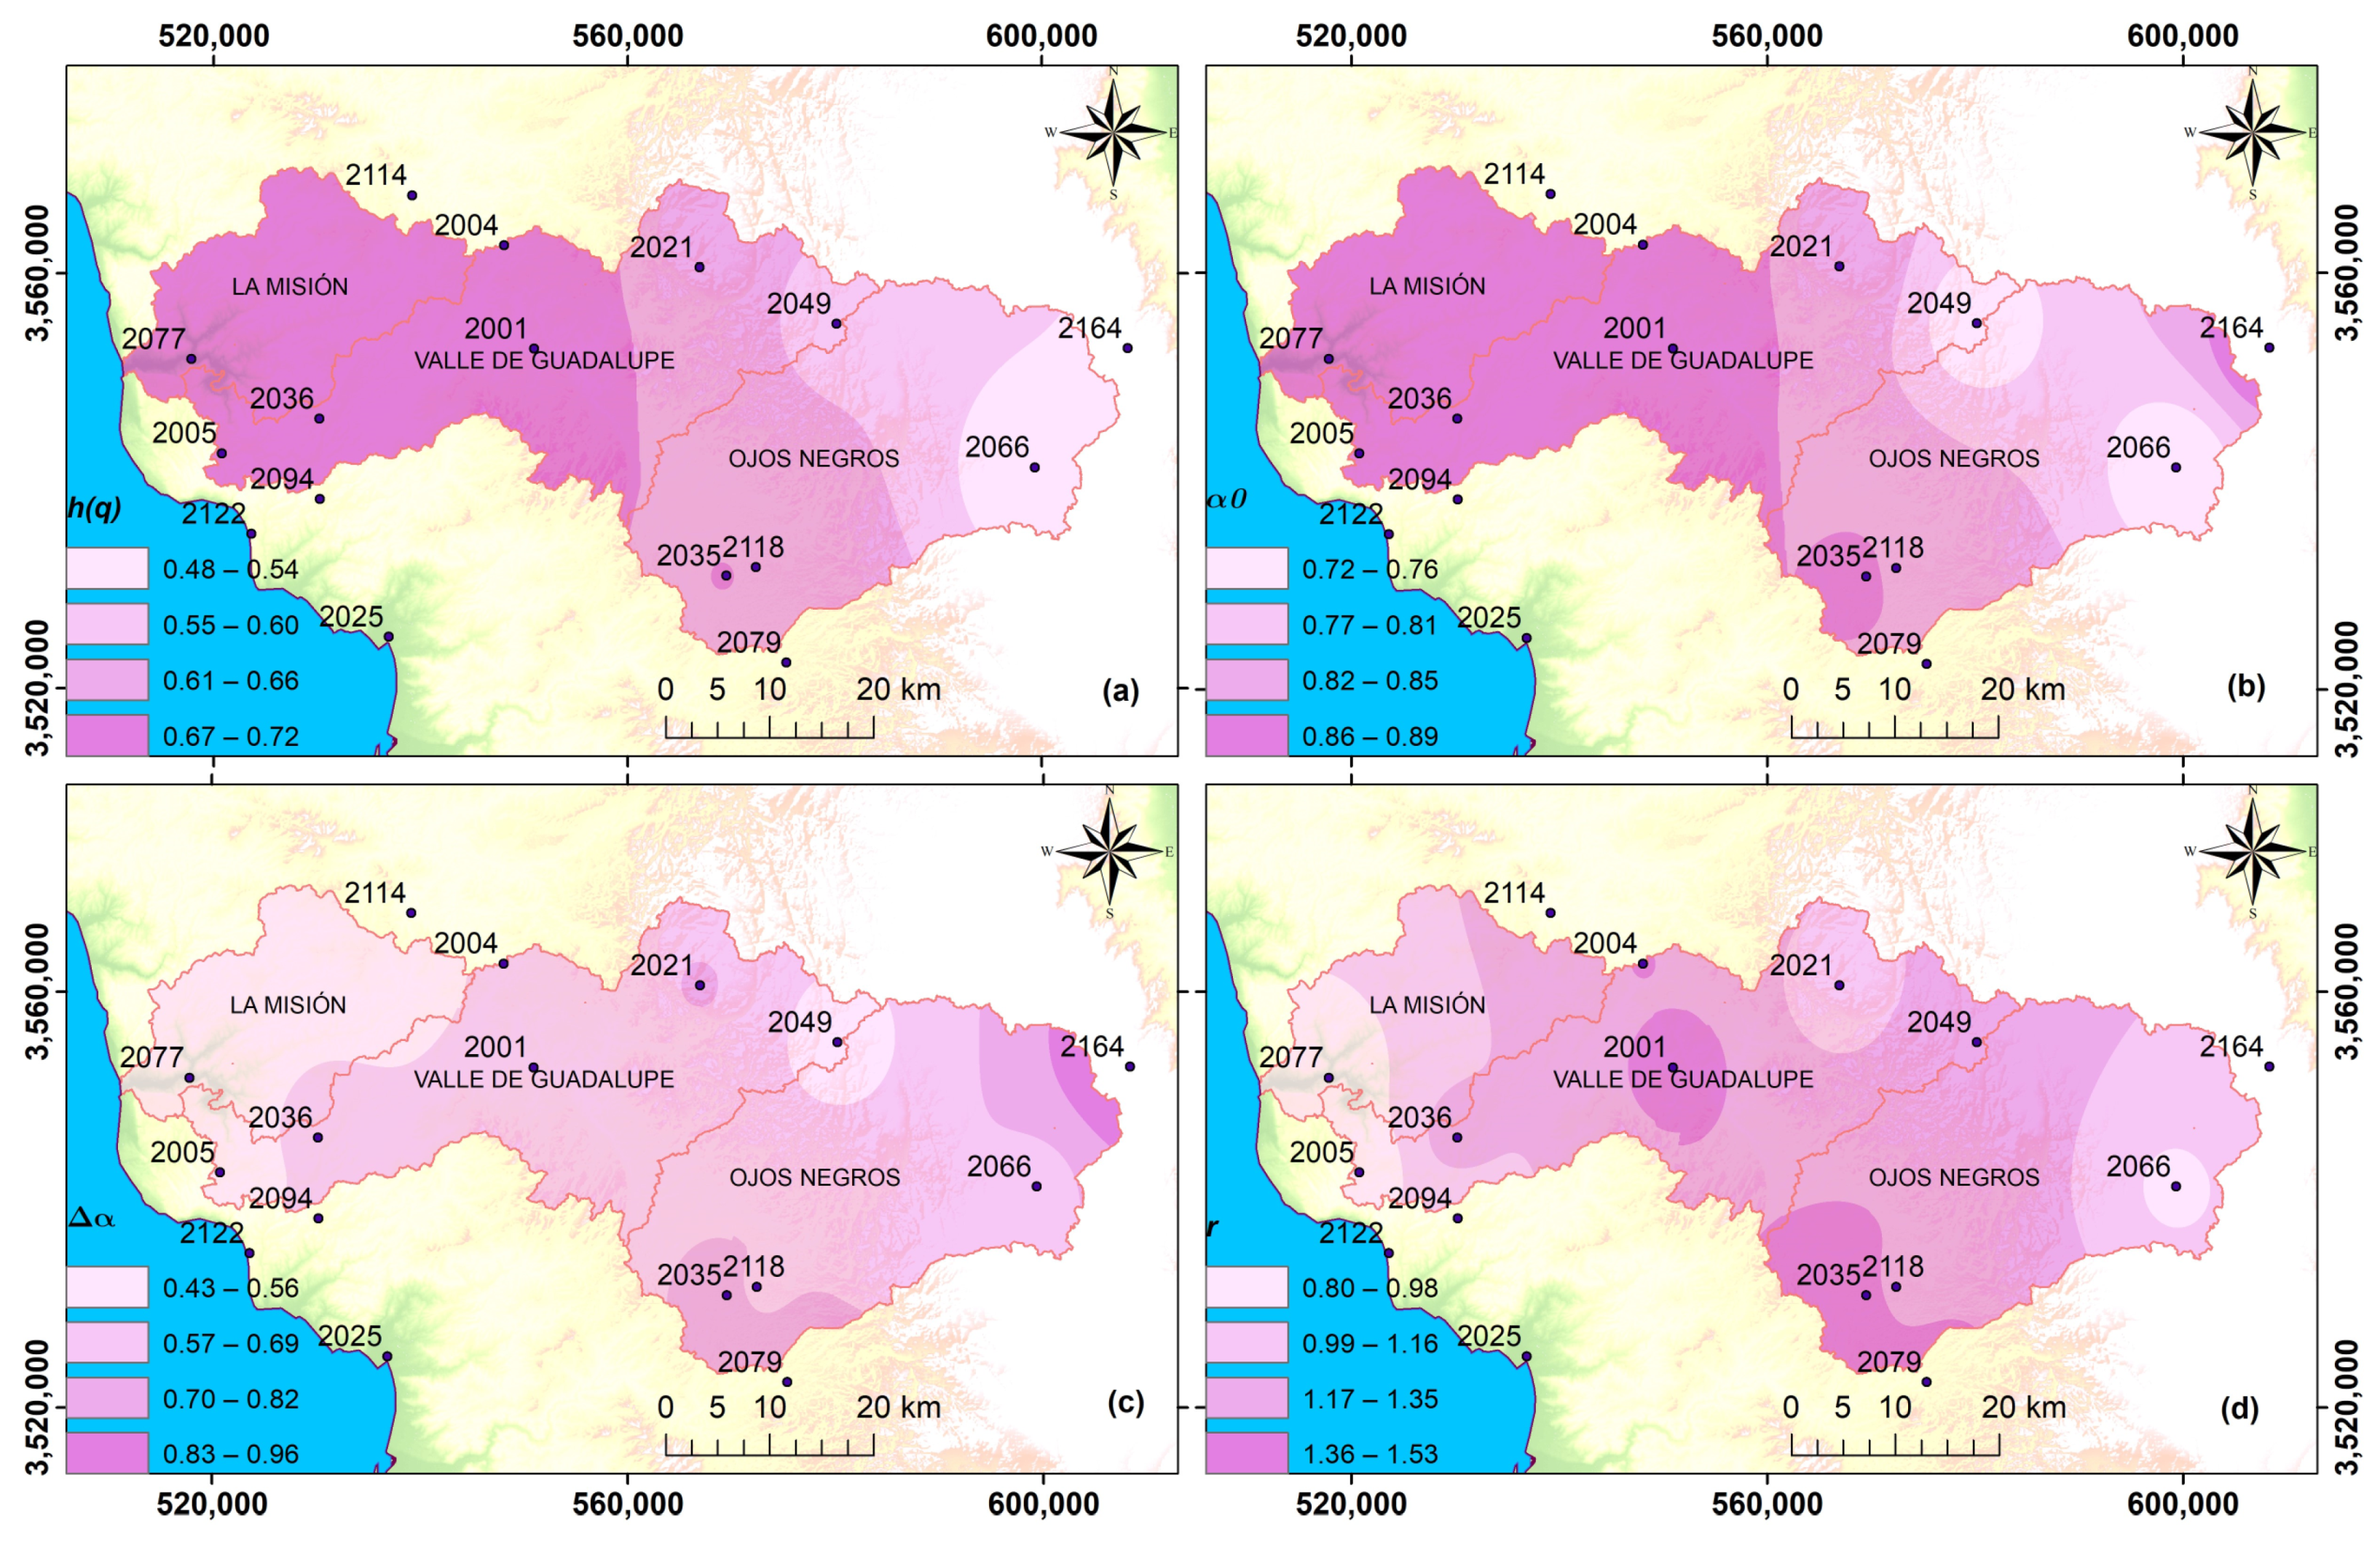
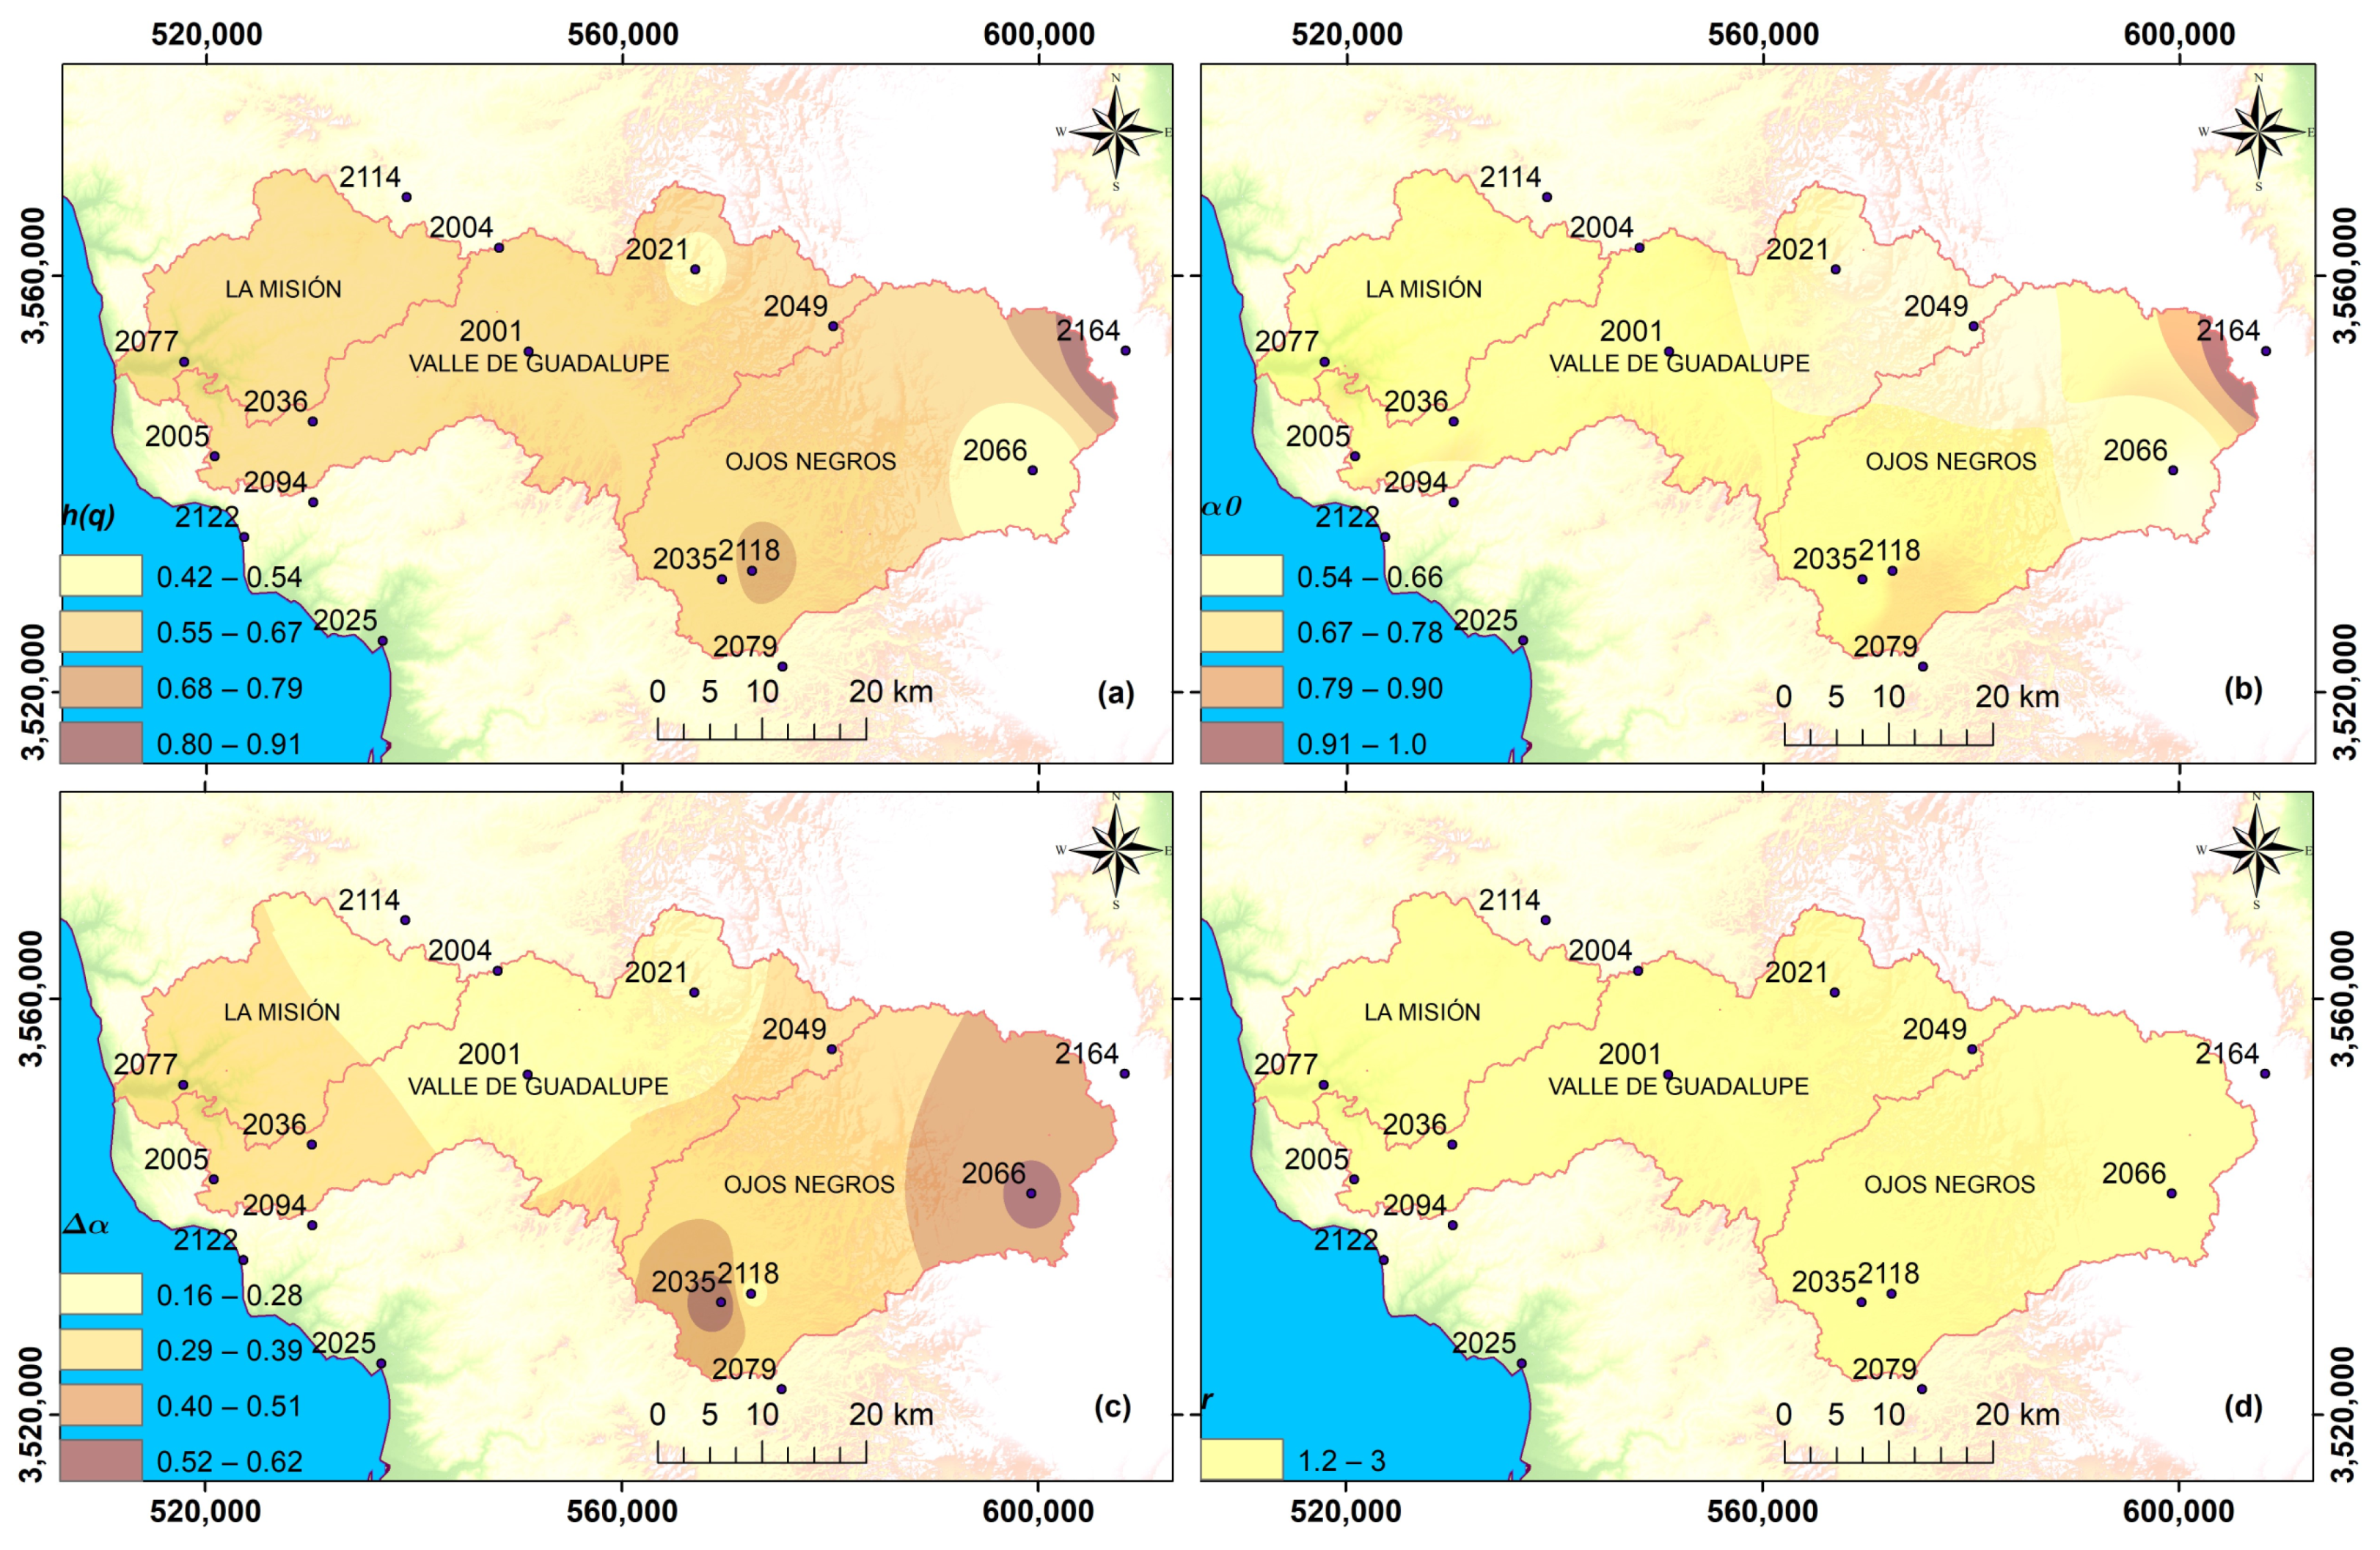
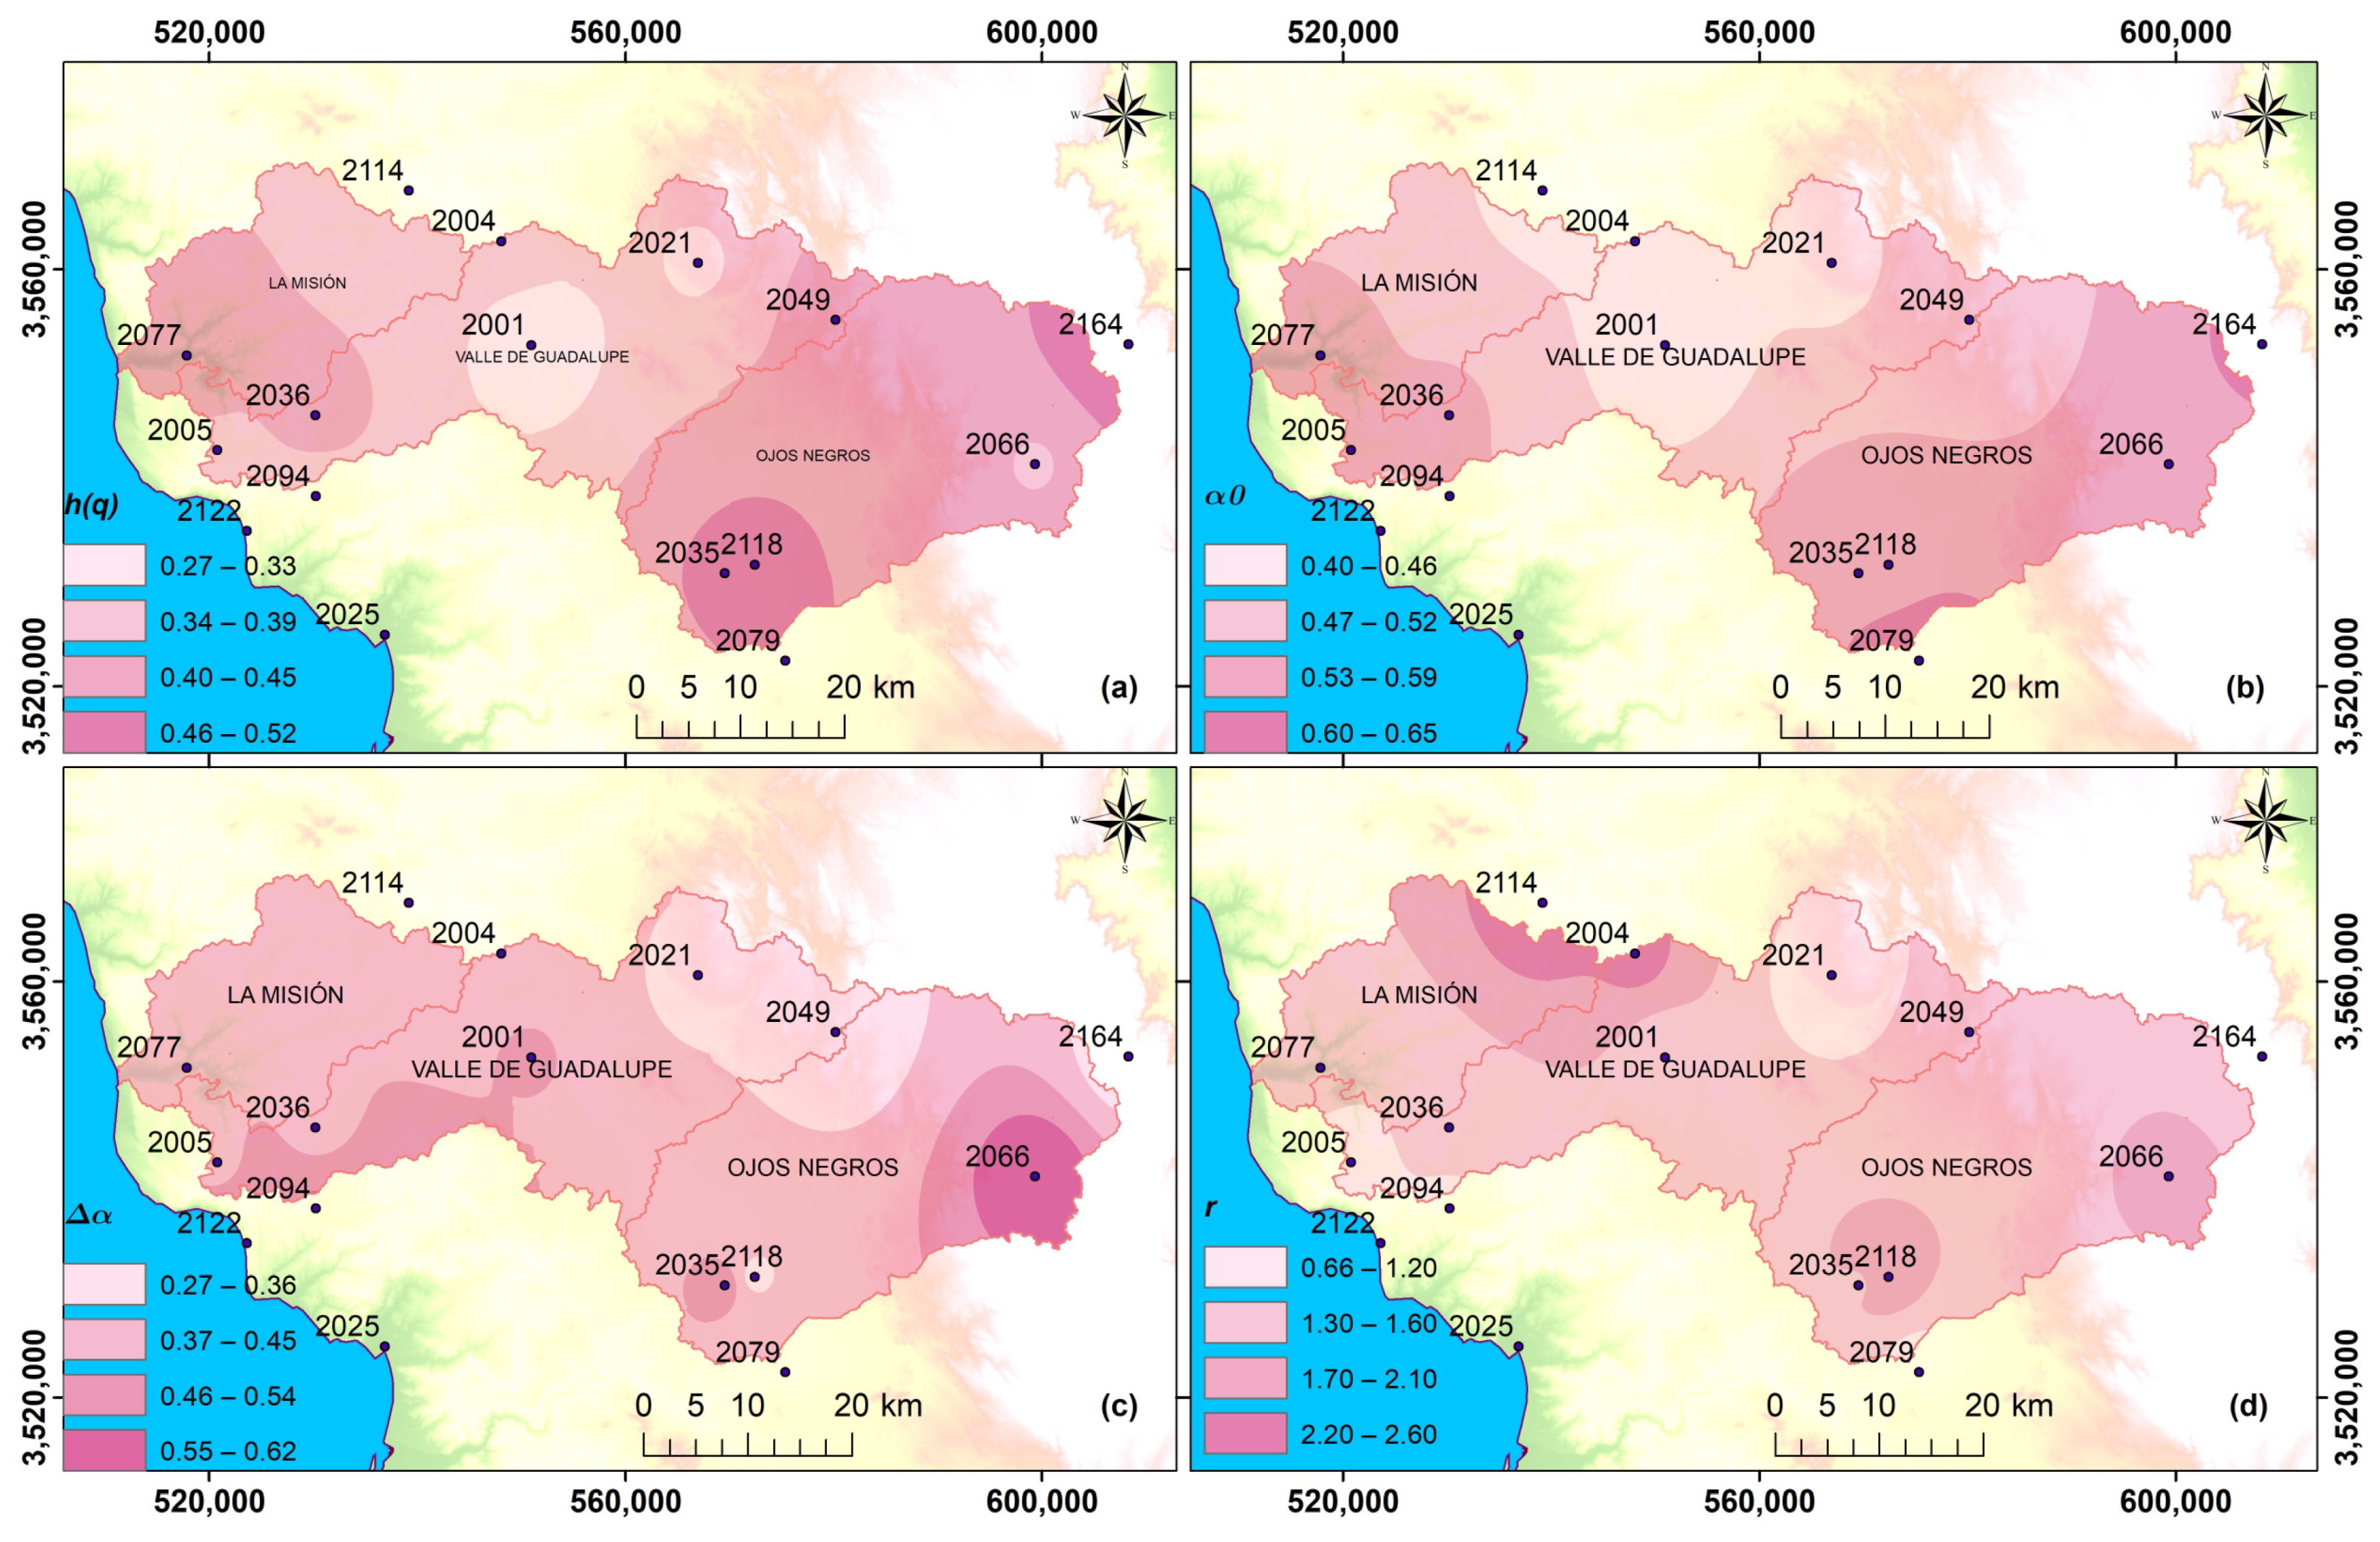
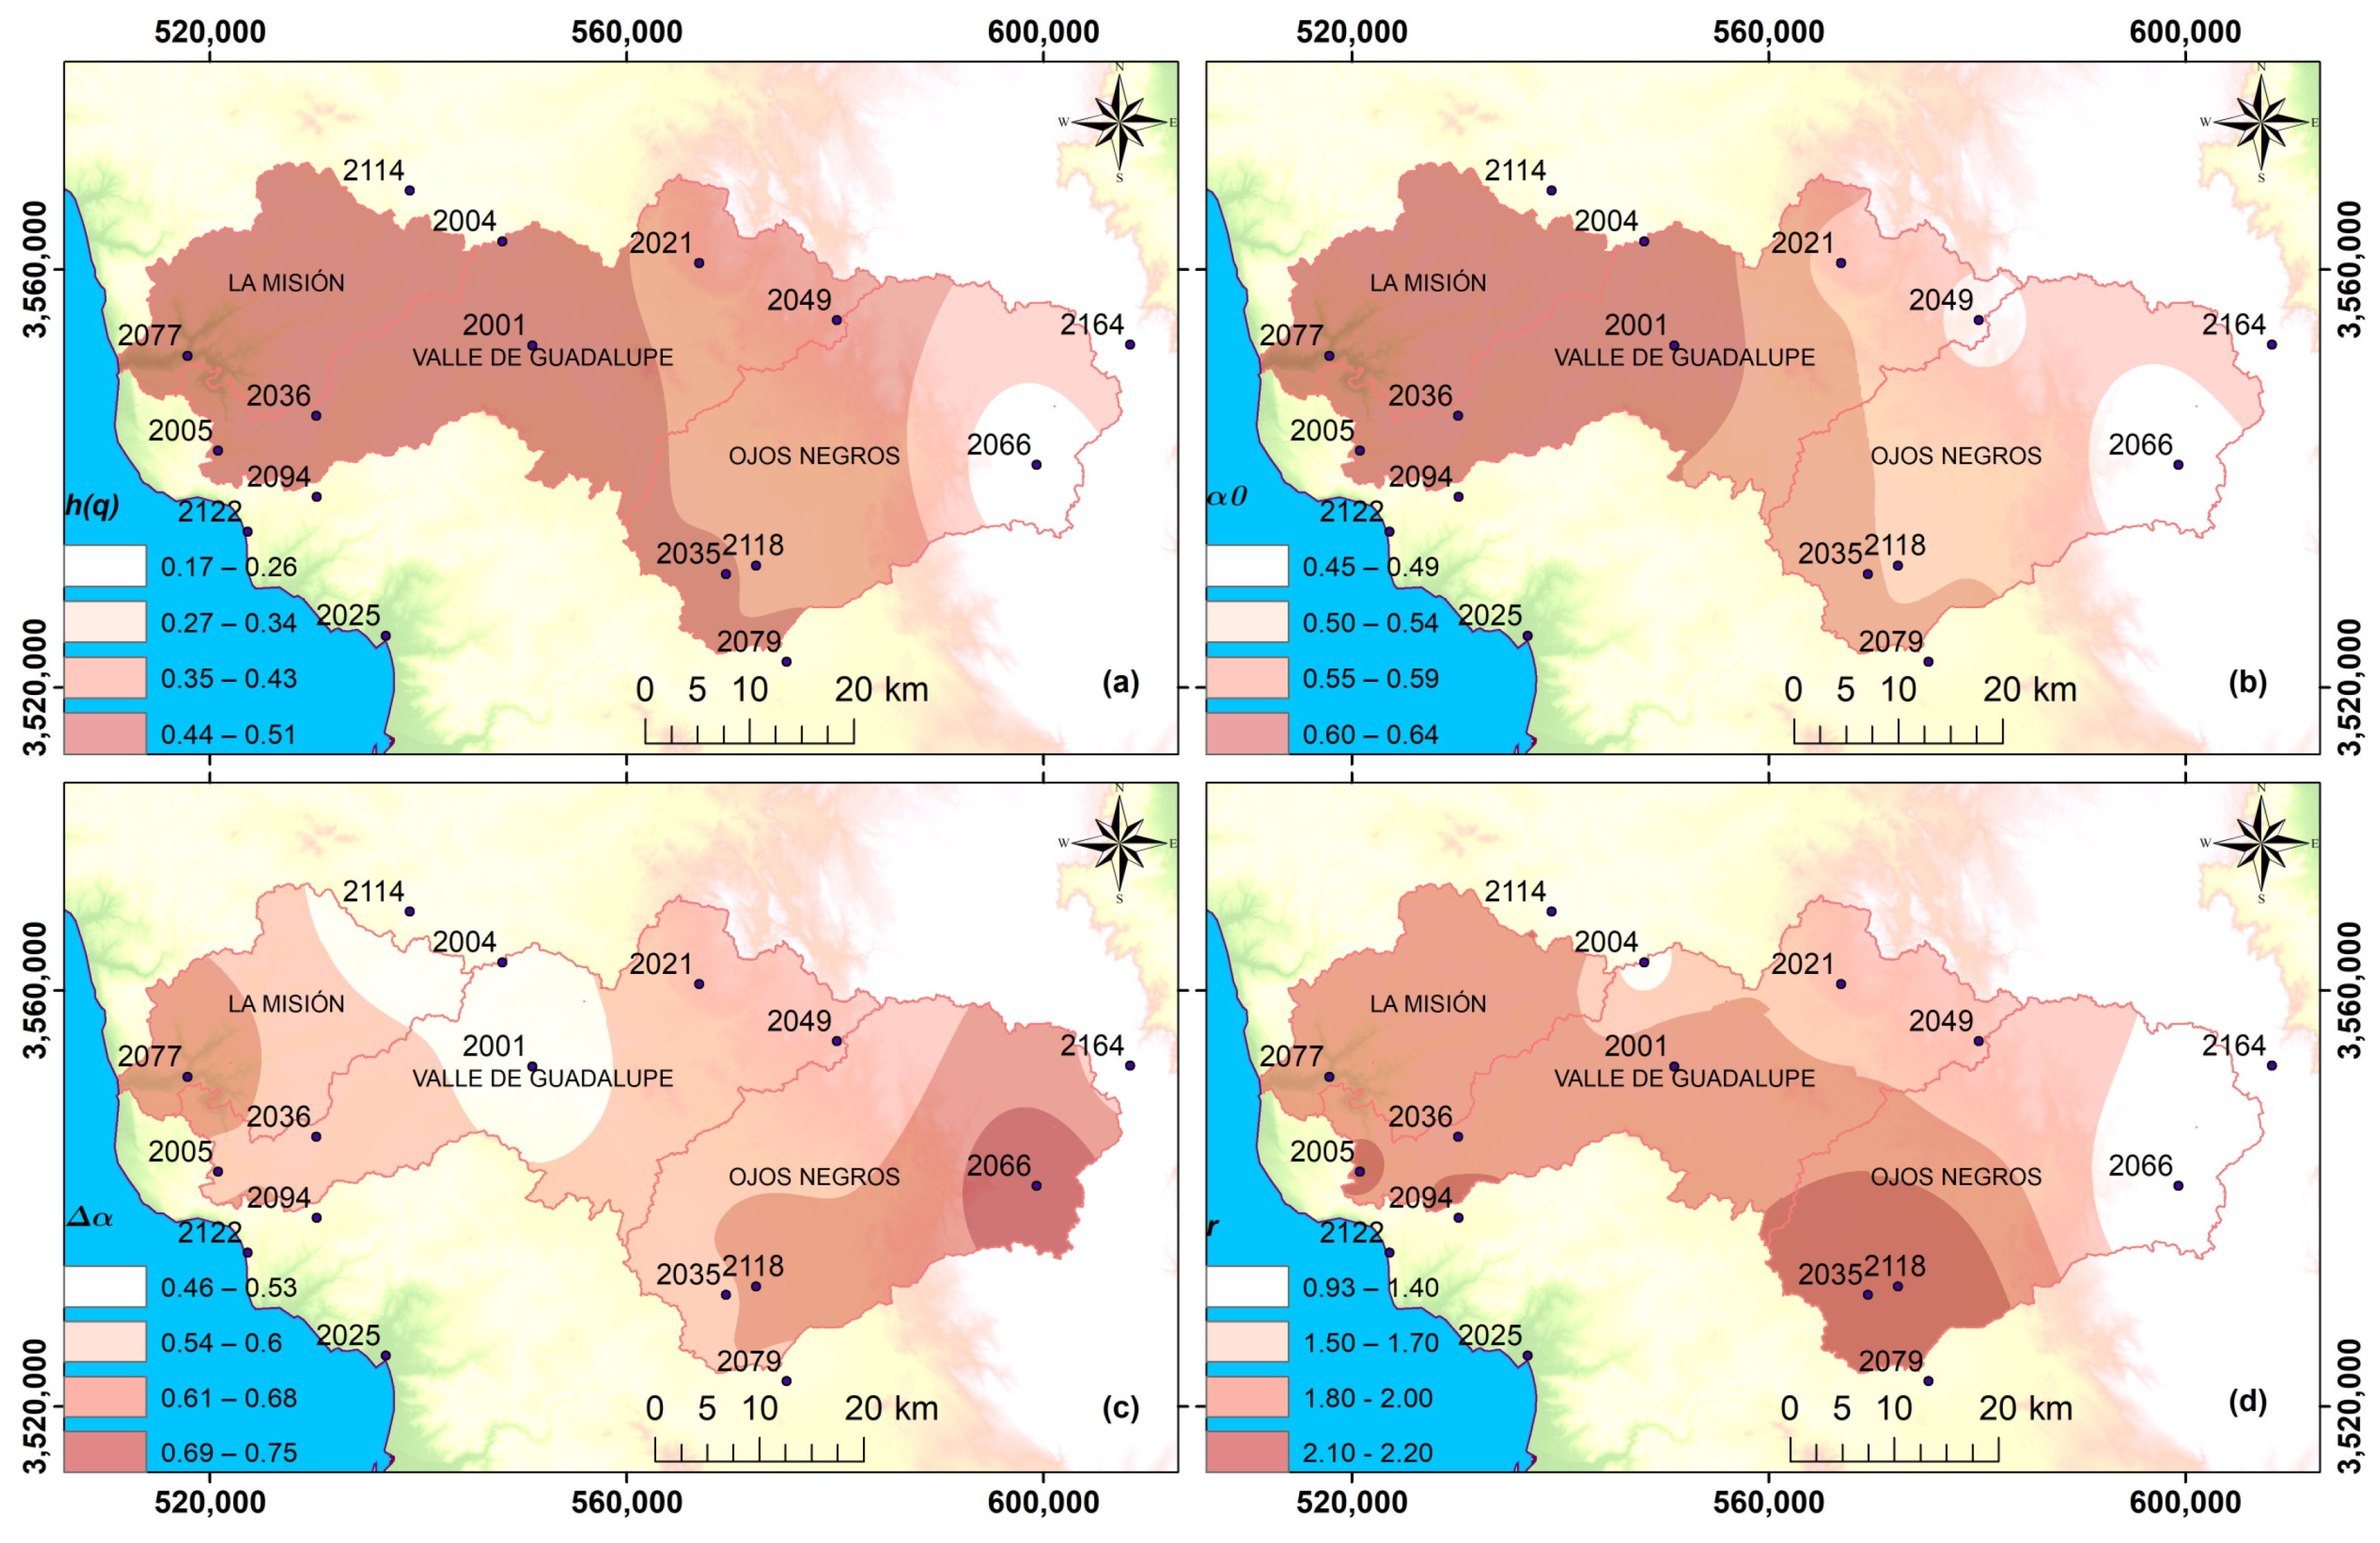
In Figure 7b, Figure 8b, Figure 9b, Figure 10b, and Figure 11b, it can be noted that the α 0 values were predominantly greater than 0.5, indicating the presence of a persistent behavior.
The α   0 values for temperature exhibit a positive correlation with altitude and a negative correlation with latitude, as shown in the map in Figure 7b. This means that α 0 decreases in the direction from east to west, indicating a decrease in persistence. This pattern is in accordance with what was reported in the research [35], where it is observed that the α 0 of the temperature series decreases with latitude.
In the case of α 0 for relative humidity (Figure 8b), an inverse correlation with altitude and longitude was observed. The highest values of α 0 occurred near the Pacific coast, and this may be associated with fog formation that occurs at sea during the occurrence of the Santa Ana winds.
In Figure 9b, a persistent behavior can be seen because the values of α 0 are greater than 0.5 and increase from west to east.
Figure 10b illustrates the values of α 0 for wind direction, and an inverse correlation with latitude is observed. In the high areas of the basin, an anti-persistent behavior occurs that may be related to the deviation of the air flow caused by the region orography.
Regarding the α 0 values for wind speed variable (Figure 11b), an inverse correlation with altitude was also observed. This behavior is similar to that observed in the α 0 values for relative humidity (Figure 8b), e.g., the Sierra Juárez station (2066) located at the highest point of the basin, which exhibited an α 0 value corresponding to 0.49. La Misión station (2077), meanwhile, is located at the lowest and most western point of the basin and presented an α value corresponding to 0.64. The stations closest to this longitude, such as Boquilla Santa Rosa de La Misión (2005), Olivares Mexicanos (2036), and El Farito (2094), also had α 0 values of 0.64.
Figure 7c, Figure 8c, Figure 9c, Figure 10c, and Figure 11c and Table 2 show the values corresponding to the width of the singularity spectrum ( Δ α ) for the different analyzed meteorological variables. The width is a measure of the size of the fluctuations and the multifractality degree. Higher values indicate a greater degree of multifractality. Δ α was found to have a weak inverse correlation between latitude and the temperature, pressure, wind speed, and direction variables. In the case of relative humidity, there is a positive correlation with longitude, and the multifractality degree increases from west to east.
The greater the width of the spectrum, the greater the difficulty in making predictions. Analyzing the temperature series (Figure 7c) and pressure (Figure 9c), it was found that the Δ α values at the El Pinal (2021) and Olivares Mexicanos (2036) stations are the lowest. These stations are located in the Valle de Guadalupe, i.e., corresponding to the area where better predictions could be made. The opposite is true in the area corresponding to the Ojos Negros sub-basin (southern region).
For the wind speed variable (Figure 11c), the highest values of Δ α occur at the Misión (2077) and Sierra de Juárez (2066) stations. This confirms that these variables have a multifractal scaling nature. For the series corresponding to wind direction, the Sierra de Juárez station (2066) presents the highest Δ α value.
In general, the maps corresponding to the parameter Δ α show that all singularity spectra are broad enough to indicate the occurrence of multifractality in the basin. The Sierra de Juárez area shows a greater multifractality degree according to the widths of the analyzed spectra.
The ( r ) parameter measures the asymmetry of the multifractal spectrum or singularities. For this study, the ( r ) asymmetry parameter presents values greater than 1 in most of the stations where the variables were analyzed (Figure 7d, Figure 8d, Figure 9d, Figure 10d, and Figure 11d), i.e., an asymmetry with a tendency towards the right of the multifractal spectrum ( r positive value), which also denotes high fractal exponents with large weights [36,37].
In addition, Figure 7d, Figure 8d, Figure 9d, Figure 10d, and Figure 11d, show that, at the Sierra de Juárez station (2066), the series corresponding to temperature, relative humidity, and wind speed have a multifractal spectrum biased towards the left ( r < 1 ). Negative values of the asymmetry parameter indicate low fractal exponents of small weights and suggest the predominance of large fluctuations, which can be related to extreme events [4,34].
The multifractality of the studied series was quantified through the width and asymmetry of the multifractal spectrum. This allows us to conclude that the multifractal nature of the time series corresponding to temperature, wind speed and direction, relative humidity, and pressure on the days when the Santa Ana winds occur exhibit a fine structure with small fluctuations.
Finally, the values corresponding to the parameters and characteristics of the multifractal spectrum or singularities can be used as quantitative and qualitative indicators to describe the dynamics of meteorological processes during the occurrence of the Santa Ana winds in the Guadalupe basin.
From these results, it can be confirmed that the studied time series, associated with the occurrence of the Santa Ana winds maintain the same behavior and structure for a moment of q = 2 order (monofractal) and a moment of q = 10 order (multifractal), i.e., it is scale-invariant.

5. Conclusions

The 38-year-long daily time series of meteorological quantities from MERRA-2 database possess multifractal properties, as has been confirmed by Multifractal Detrended Fluctuations Analysis (MFDFA).
From the multifractal analysis, by estimating the generalized Hurst exponent and multifractal spectra parameters for ( α 0 , α , and r ), the following conclusions were gathered.
First, the multifractal nature of daily time series data for climatic variables associated with the Santa Ana Winds was researched. The MFDFA method was employed to extract multifractal complexity parameters ( α 0 , α , and r ) and construct multifractal spectra for temperature, relative humidity, pressure, wind direction, and wind speed across 16 monitoring stations within the influence area of the basin. Meanwhile, the MFDFA method was adequate to evaluate the multifractality of the time series that represent the occurrence conditions of the Santa Ana winds. From the estimation of the generalized Hurst exponent ( h q ), it was possible to characterize the time series of the meteorological variables in terms of the persistence, anti-persistence, or randomness characteristics.
Second, the Multifractal Detrended Fluctuation Analysis (MFDFA) confirmed that the meteorological time series of Santa Ana winds exhibits multifractal characteristics. The strong linear correlation observed between l o g ( F q ) and l o g ( s ) , along with the stable profiles of the multifractal spectra, provide proof that the analyzed data are applicable for multifractal analysis. Additionally, the strong dependency of the generalized exponent q and τ ( q ) showed that the meteorological time series of Santa Ana winds is a multifractal process. Values q < 0 and q > 0 have different behaviors due to the variation present in the slope line that connects both points, as this line is different for positive and negative values. Also, the calculated multifractal spectra allowed for the estimation of the fractal dimension of the support set of each variable, obtaining good accuracy in estimating the information dimension. The multifractal spectra obtained at the climatological stations of the Guadalupe basin are asymmetric and have longer right branches in most cases, indicating a high heterogeneity of the variables associated with the Santa Ana winds.
Furthermore, the multifractal analysis reveals that all examined variables show a degree of persistence, with temperature, wind direction, and wind speed showing the weakest degree. At the same time, relative humidity and pressure exhibit the strongest persistence levels and the spatialization of the multifractal parameters associated with the considered meteorological variables exhibits significant spatial variability. This behavior may be linked to various factors, such as: deflection of large-scale horizontal flow by the orography, physical geography of the region, topography, proximity to the sea, the movement of air masses, and micro-climates.
The spatial distribution of the multifractal parameters exhibits variations, allowing for the identification of regions susceptible to extreme events, correlated, or uncorrelated processes. This is more noticeable in the temperature, speed, and wind direction maps. Also, it offers a valuable alternative to conventional approaches for climate dynamics analysis and holds potential for comparative studies.
The multifractal analysis and the parameters maps allow the behavior of the Santa Ana winds to be described through potential laws characterized by their own exponents. It also constitutes a valid tool for the conceptualization of possible changes over time to provide valuable information that can help farmers make decisions and carry out actions to mitigate the impact of climate variability phenomena, such as the Santa Ana winds.
Of course, the present study cannot exhaustively explain the very complex spatiotemporal variability of climatic variables associated with Santa Ana winds; nonetheless, it represents a contribution to the characterization of Santa Ana winds and to the understanding the mechanisms that govern its dynamics in the Guadalupe basin.
For future work, an hourly and monthly application must be made over the years to compare the multifractality characteristics in the series, considering that the Santa Ana winds present hourly variations in the same day. Additionally, a future work could associate multifractality with climate classification.
Finally, this type of study contributes to understanding the regional dynamics of the Guadalupe basin and to establishing a basis for the development of models that allow forecasting the days on which the Santa Ana winds occur to mitigate the potential negative consequences, such as fires and droughts.

Author Contributions

Conceptualization, A.A.L.-L., C.F., D.-L.F. and A.L.-R.; Methodology, A.A.L.-L.; Investigation, A.A.L.-L. and A.L.-R.; Resources, M.G.-D.; Writing—original draft, A.A.L.-L.; Writing—review & editing, Y.S.-U.; Funding acquisition, A.A.L.-L. and D.-L.F. All authors have read and agreed to the published version of the manuscript.

Funding

This research was funded by HIDRUS S.A. de C.V., Grupo HIDRUS S.A.S. and Universidad Autónoma de Baja California; the APC was funded by Universidad Autónoma de Baja California, HIDRUS S.A. de C.V. and Grupo HIDRUS S.A.S. The funders had no roles in the design of the study; in the collection, analysis, or interpretation of data; in the writing of the manuscript, or in the decision to publish the articles. The paper reflects the views of the scientists and not those of the funders.

Institutional Review Board Statement

Not applicable.

Informed Consent Statement

Not applicable.

Data Availability Statement

The data presented in this study are available on request from the corresponding author. The data are not publicly available due to privacy restrictions.

Conflicts of Interest

The authors declare no conflict of interest.

Appendix A. Santa Ana Time Series: Wind Direction, Wind Speed and Temperature
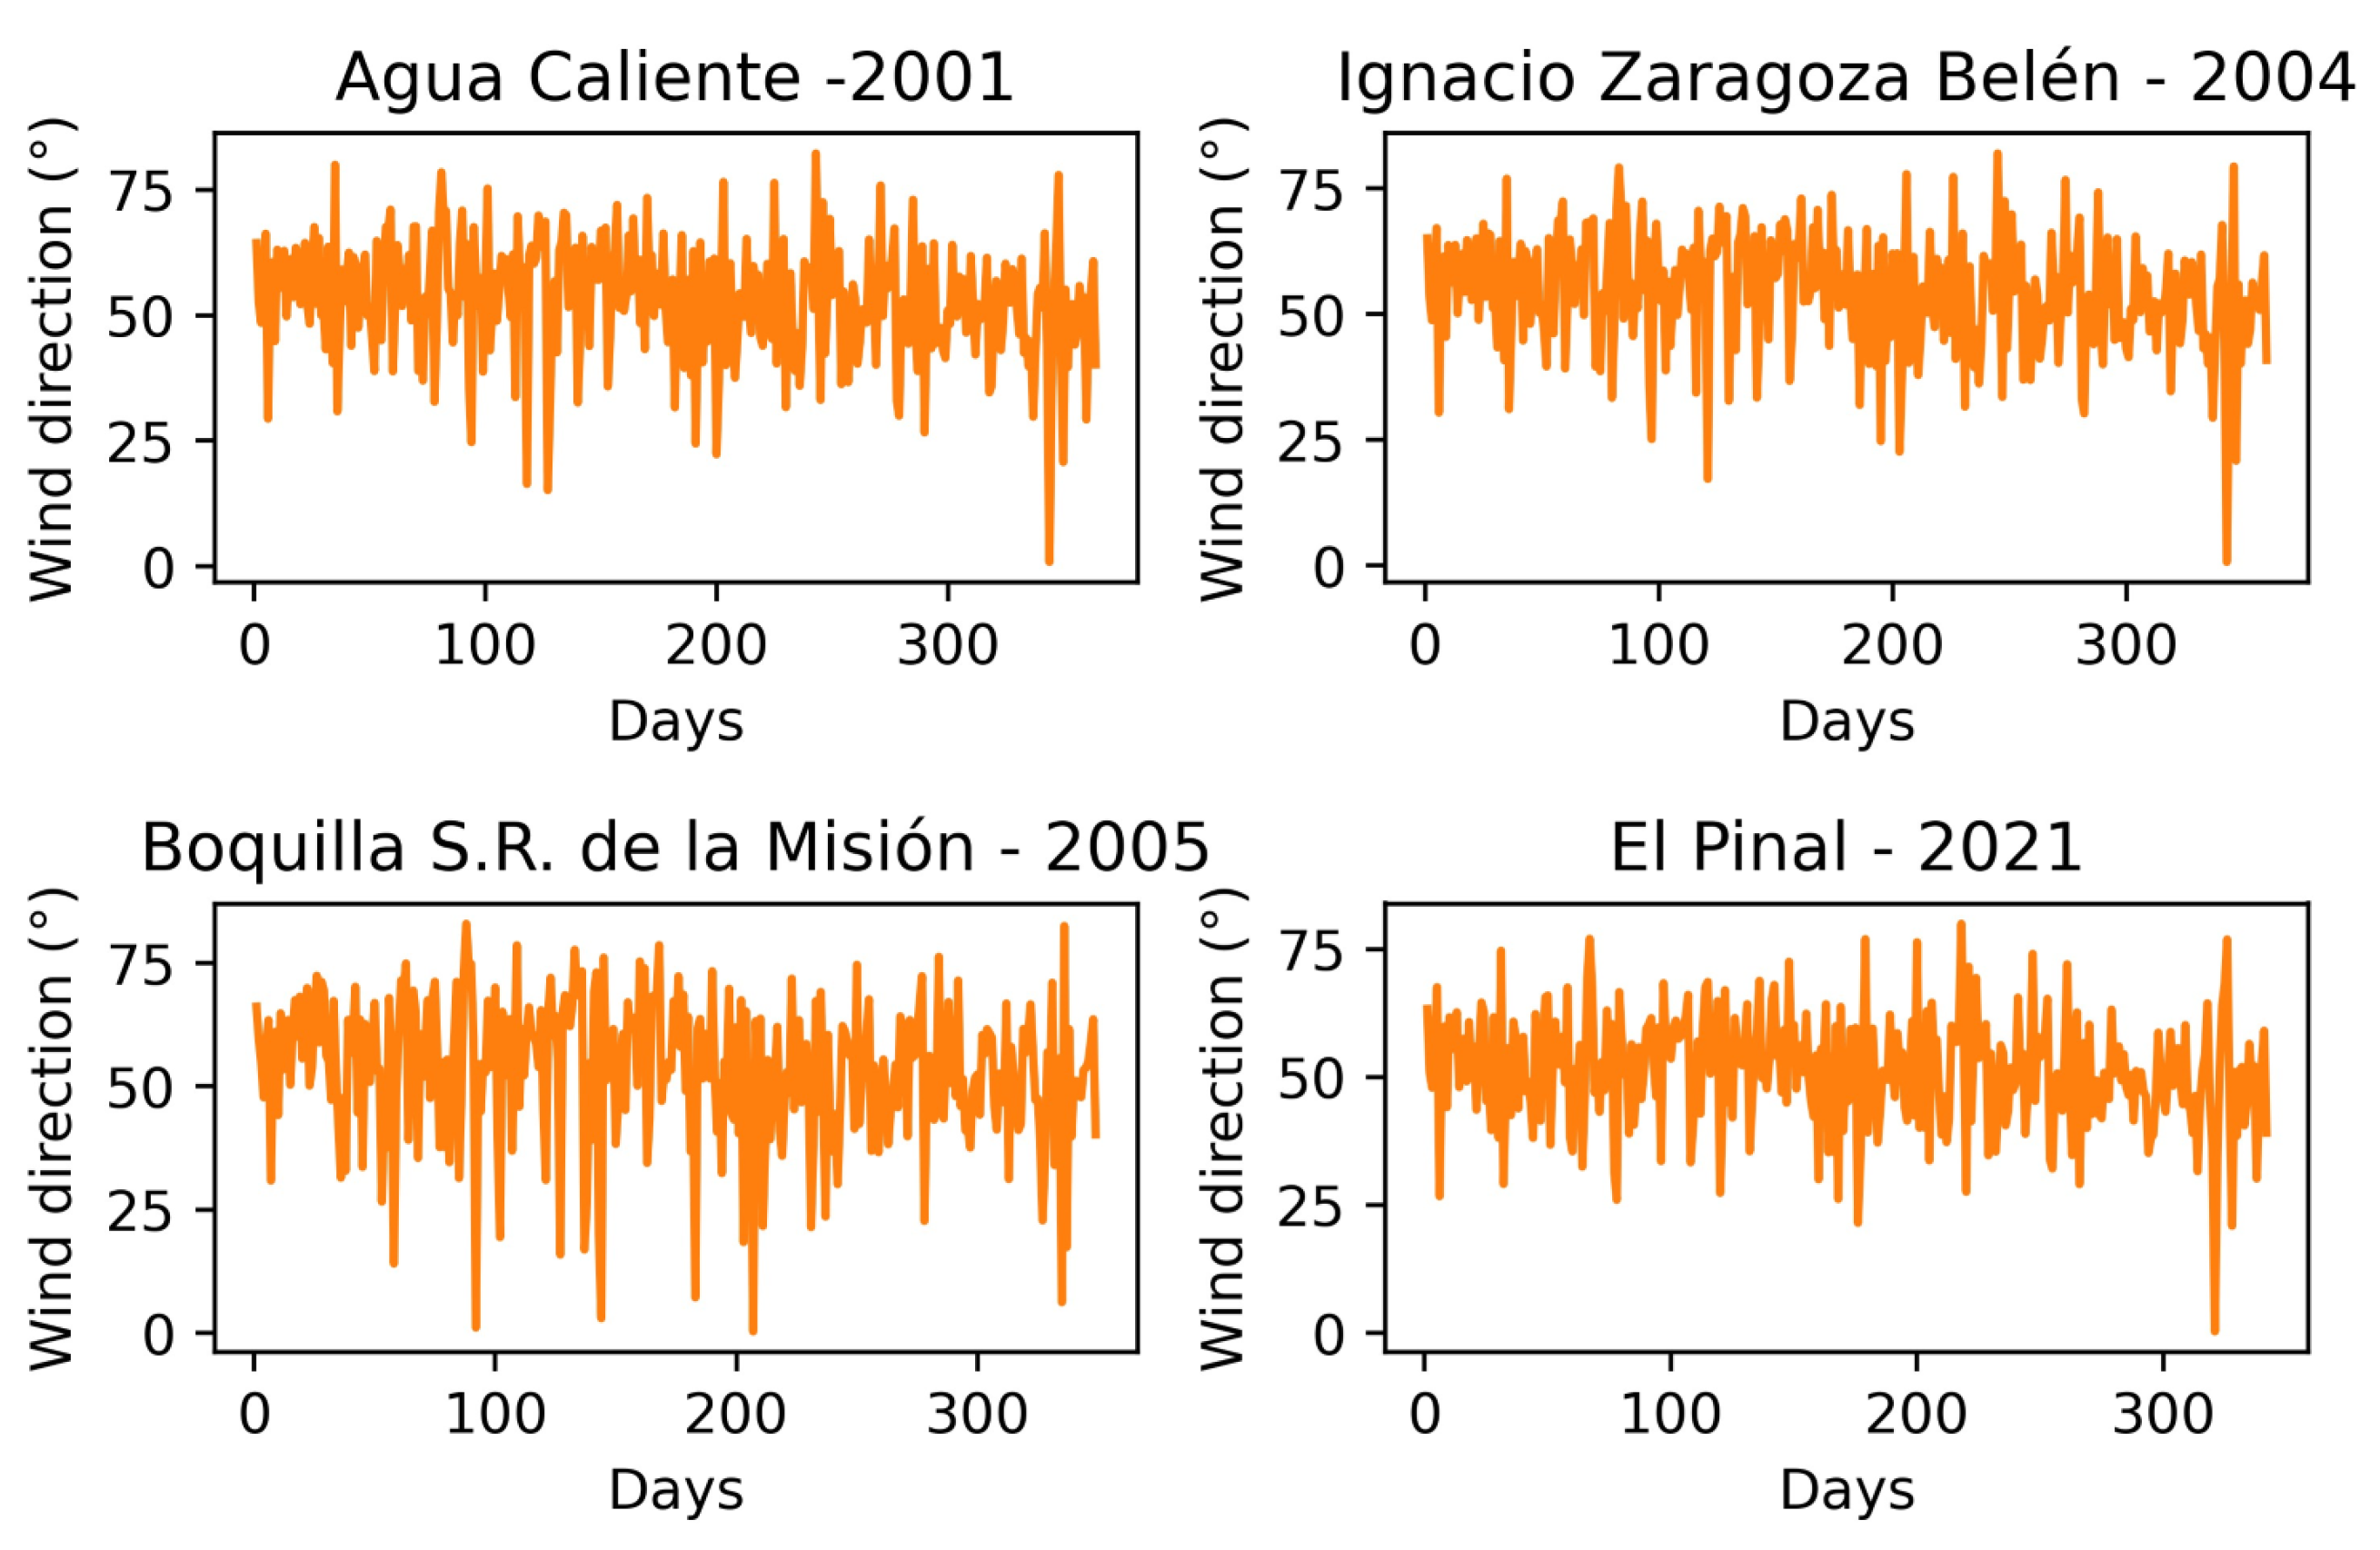
The filter proposed in [3] was used to evaluate the occurrence of days with Santa Ana wind events. This criterion for evaluating a Santa Ana event occurrence was associated with wind speed and wind direction. The benchmark wind speed was established at ≥4.5 m/s, and the wind direction criterion were established in winds from the first quadrant.
Figure A1. Wind direction time series stations 2001, 2004, 2005, and 2021.
Atmosphere 14 01751 g0a1
Figure A2. Wind direction time series stations 2025, 2035, 2036, and 2049.
Atmosphere 14 01751 g0a2
Figure A3. Wind direction time series stations 2066, 2077, 2079, and 2094.
Atmosphere 14 01751 g0a3
Figure A4. Wind direction time series stations 2114, 2118, 2122, and 2164.
Atmosphere 14 01751 g0a4
Figure A5. Wind speed time series stations 2001, 2004, 2005, and 2021.
Atmosphere 14 01751 g0a5
Figure A6. Wind speed time series stations 2025, 2035, 2036, and 2049.
Atmosphere 14 01751 g0a6
Figure A7. Wind speed time series stations 2066, 2077, 2079, and 2094.
Atmosphere 14 01751 g0a7
Figure A8. Wind speed time series stations 2114, 2118, 2122, and 2164.
Atmosphere 14 01751 g0a8
Figure A9. Temperature time series stations 2001, 2004, 2005, and 2021.
Atmosphere 14 01751 g0a9
Figure A10. Temperature time series stations 2025, 2035, 2036, and 2049.
Atmosphere 14 01751 g0a10
Figure A11. Temperature time series stations 2066, 2077, 2079, and 2094.
Atmosphere 14 01751 g0a11
Figure A12. Temperature time series stations 2114, 2118, 2122, and 2164.
Atmosphere 14 01751 g0a12

References

  1. Álvarez, C.A.; Carbajal, N. Regions of Influence and Environmental Effects of Santa Ana Wind Event. Air Qual. Atmos. Health 2019, 12, 1019–1034. [Google Scholar] [CrossRef]
  2. Glickman, T.S. Glossary of Meteorology, 2nd ed.; American Meteorogical Society: Boston, MA, USA, 2021. [Google Scholar]
  3. Serpa-Usta, Y.; López-Lambraño, A.A.; Flores, D.-L.; Gámez-Balmaceda, E.; Martínez-Acosta, L.; Medrano-Barboza, J.P.; López, J.F.R.; López-Ramos, A.; López-Lambraño, M. Santa Ana Winds: Fractal-Based Analysis in a Semi-Arid Zone of Northern Mexico. Atmosphere 2021, 13, 48. [Google Scholar] [CrossRef]
  4. Baranowski, P.; Gos, M.; Krzyszczak, J.; Siwek, K.; Kieliszek, A.; Tkaczyk, P. Multifractality of Meteorological Time Series for Poland on the Base of MERRA-2 Data. Chaos Solitons Fractals 2019, 127, 318–333. [Google Scholar] [CrossRef]
  5. De Lima, M.I.P. Multifractals and the Temporal Structure of Rainfall; Wageningen Agricultural University: Wageningen, The Netherlands, 1998. [Google Scholar]
  6. Zeleke, T.B.; Si, B.C. Scaling Properties of Topographic Indices and Crop Yield: Multifractal and Joint Multifractal Approaches. Agron. J. 2004, 96, 1082–1090. [Google Scholar] [CrossRef]
  7. López Lambraño, A. Análisis Multifractal y Modelación de La Precipitación. Ph.D. Thesis, Universidad Autónoma de Querétaro, Santiago de Querétaro, Mexico, 2012. [Google Scholar]
  8. Xiong, G.; Yu, W.; Zhang, S. Singularity Power Spectrum Distribution. Phys. A Stat. Mech. Its Appl. 2015, 431, 63–73. [Google Scholar] [CrossRef]
  9. Grassberger, P. On the Hausdorff Dimension of Fractal Attractors. J. Stat. Phys. 1981, 26, 173–179. [Google Scholar] [CrossRef]
  10. Gómez-Gómez, J.; Ariza-Villaverde, A.B.; Gutiérrez De Ravé, E.; Jiménez-Hornero, F.J. Relationships between Reference Evapotranspiration and Meteorological Variables in the Middle Zone of the Guadalquivir River Valley Explained by Multifractal Detrended Cross-Correlation Analysis. Fractal Fract. 2023, 7, 54. [Google Scholar] [CrossRef]
  11. Gómez-Gómez, J.; Carmona-Cabezas, R.; Sánchez-López, E.; Gutiérrez De Ravé, E.; Jiménez-Hornero, F.J. Multifractal Fluctuations of the Precipitation in Spain (1960–2019). Chaos Solitons Fractals 2022, 157, 111909. [Google Scholar] [CrossRef]
  12. Sankaran, A.; Plocoste, T.; Nourani, V.; Vahab, S.; Salim, A. Assessment of Multifractal Fingerprints of Reference Evapotranspiration Based on Multivariate Empirical Mode Decomposition. Atmosphere 2023, 14, 1219. [Google Scholar] [CrossRef]
  13. Devi, R.R.; Chattopadhyay, S. A Modified Multifractal Detrended Fluctuation Analysis to Study the Precipitation across Northeast India. Dyn. Atmos. Ocean. 2023, 104, 101402. [Google Scholar] [CrossRef]
  14. Balkissoon, S.; Fox, N.; Lupo, A. Fractal Characteristics of Tall Tower Wind Speeds in Missouri. Renew. Energy 2020, 154, 1346–1356. [Google Scholar] [CrossRef]
  15. Philippopoulos, K.; Kalamaras, N.; Tzanis, C.G.; Deligiorgi, D.; Koutsogiannis, I. Multifractal Detrended Fluctuation Analysis of Temperature Reanalysis Data over Greece. Atmosphere 2019, 10, 336. [Google Scholar] [CrossRef]
  16. Laib, M.; Golay, J.; Telesca, L.; Kanevski, M. Multifractal Analysis of the Time Series of Daily Means of Wind Speed in Complex Regions. Chaos Solitons Fractals 2018, 109, 118–127. [Google Scholar] [CrossRef]
  17. Jiang, L.; Zhang, J.; Liu, X.; Li, F. Multifractal Scaling Comparison of the Air Temperature and the Surface Temperature over China. Phys. A Stat. Mech. Its Appl. 2016, 462, 783–792. [Google Scholar] [CrossRef]
  18. Akinsusi, J.; Ogunjo, S.; Fuwape, I. Nonlinear Dynamics and Multifractal Analysis of Minimum–Maximum Temperature and Solar Radiation over Lagos State, Nigeria. Acta Geophys. 2022, 70, 2171–2178. [Google Scholar] [CrossRef]
  19. de Lima, M.I.P.; Grasman, J. Multifractal Analysis of 15-Min and Daily Rainfall from a Semi-Arid Region in Portugal. J. Hydrol. 1999, 220, 1–11. [Google Scholar] [CrossRef]
  20. Tan, X.; Gan, T.Y. Multifractality of Canadian Precipitation and Streamflow. Int. J. Climatol. 2017, 37, 1221–1236. [Google Scholar] [CrossRef]
  21. Liu, Z.; Xu, J.; Chen, Z.; Nie, Q.; Wei, C. Multifractal and Long Memory of Humidity Process in the Tarim River Basin. Stoch. Environ. Res. Risk Assess. 2014, 28, 1383–1400. [Google Scholar] [CrossRef]
  22. García-Marín, A.P.; Estévez, J.; Jiménez-Hornero, F.J.; Ayuso-Muñoz, J.L. Multifractal Analysis of Validated Wind Speed Time Series. Chaos Interdiscip. J. Nonlinear Sci. 2013, 23, 013133. [Google Scholar] [CrossRef]
  23. dos Santos, F.S.; do Nascimento, K.K.F.; Jale, J.d.S.; Stosic, T.; Marinho, M.H.N.; Ferreira, T.A.E. Mixture Distribution and Multifractal Analysis Applied to Wind Speed in the Brazilian Northeast Region. Chaos Solitons Fractals 2021, 144, 110651. [Google Scholar] [CrossRef]
  24. Zeng, Z.; Yang, H.; Zhao, R.; Meng, J. Nonlinear Characteristics of Observed Solar Radiation Data. Sol. Energy 2013, 87, 204–218. [Google Scholar] [CrossRef]
  25. Varotsos, C.; Kirk-Davidoff, D. Long-Memory Processes in Ozone and Temperature Variations at the Region 60° S−60° N. Atmos. Chem. Phys. 2006, 6, 4093. [Google Scholar] [CrossRef]
  26. Stosic, T.; Stosic, B.; Tošić, M.; Lazić, I.; Djurdjević, V.; Tošić, I. Climate Change Effects through MFDFA Study of Temperature in Serbia. Atmosphere 2023, 14, 1532. [Google Scholar] [CrossRef]
  27. Adarsh, S.; Nourani, V.; Archana, D.S.; Dharan, D.S. Multifractal Description of Daily Rainfall Fields over India. J. Hydrol. 2020, 586, 124913. [Google Scholar] [CrossRef]
  28. Yuval; Broday, D.M. Studying the Time Scale Dependence of Environmental Variables Predictability Using Fractal Analysis. Environ. Sci. Technol. 2010, 44, 4629–4634. [Google Scholar] [CrossRef] [PubMed]
  29. Sadegh Movahed, M.; Jafari, G.R.; Ghasemi, F.; Rahvar, S.; Reza Rahimi Tabar, M. Multifractal Detrended Fluctuation Analysis of Sunspot Time Series. J. Stat. Mech. Theory Exp. 2006, 2006, P02003. [Google Scholar] [CrossRef]
  30. Kantelhardt, J.W.; Zschiegner, S.A.; Koscielny-Bunde, E.; Havlin, S.; Bunde, A.; Stanley, H.E. Multifractal Detrended Fluctuation Analysis of Nonstationary Time Series. Phys. A Stat. Mech. Its Appl. 2002, 316, 87–114. [Google Scholar] [CrossRef]
  31. López, A.; Fuentes, C.; López Ramos, A.; Mata, J.; López, M. Spatial and Temporal Hurst Exponent Variability of Rainfall Series Based on the Climatological Distribution in a Semiarid Region in Mexico. Atmosfera 2018, 31, 199–219. [Google Scholar] [CrossRef]
  32. Krzyszczak, J.; Baranowski, P.; Zubik, M.; Kazandjiev, V.; Georgieva, V.; Sławiński, C.; Siwek, K.; Kozyra, J.; Nieróbca, A. Multifractal Characterization and Comparison of Meteorological Time Series from Two Climatic Zones. Theor. Appl. Clim. 2019, 137, 1811–1824. [Google Scholar] [CrossRef]
  33. Kalamaras, N.; Philippopoulos, K.; Deligiorgi, D.; Tzanis, C.G.; Karvounis, G. Multifractal Scaling Properties of Daily Air Temperature Time Series. Chaos Solitons Fractals 2017, 98, 38–43. [Google Scholar] [CrossRef]
  34. Dos Santos, F.S.; Do Nascimento, K.K.F.; Jale, J.S.; Xavier Júnior, S.F.A.; Ferreira, T.A.E. Multifractal Analysis of Solar Radiation in the Northeastern Region of Brazil. Fractals 2023, 31, 2350026. [Google Scholar] [CrossRef]
  35. da Silva, H.S.; Silva, J.R.S.; Stosic, T. Multifractal Analysis of Air Temperature in Brazil. Phys. A Stat. Mech. Its Appl. 2020, 549, 124333. [Google Scholar] [CrossRef]
  36. Aguilar-Molina, A.M.; Angulo-Brown, F.; Muñoz-Diosdado, A. Multifractal Spectrum Curvature of RR Tachograms of Healthy People and Patients with Congestive Heart Failure, a New Tool to Assess Health Conditions. Entropy 2019, 21, 581. [Google Scholar] [CrossRef] [PubMed]
  37. Munoz-Diosdado, A.; Del Rio-Correa, J.L. Further Study of the Asymmetry for Multifractal Spectra of Heartbeat Time Series. In Proceedings of the 2006 International Conference of the IEEE Engineering in Medicine and Biology Society, New York, NY, USA, 30 August–3 September 2006; IEEE: New York, NY, USA, 2006; pp. 1450–1453. [Google Scholar] [CrossRef]
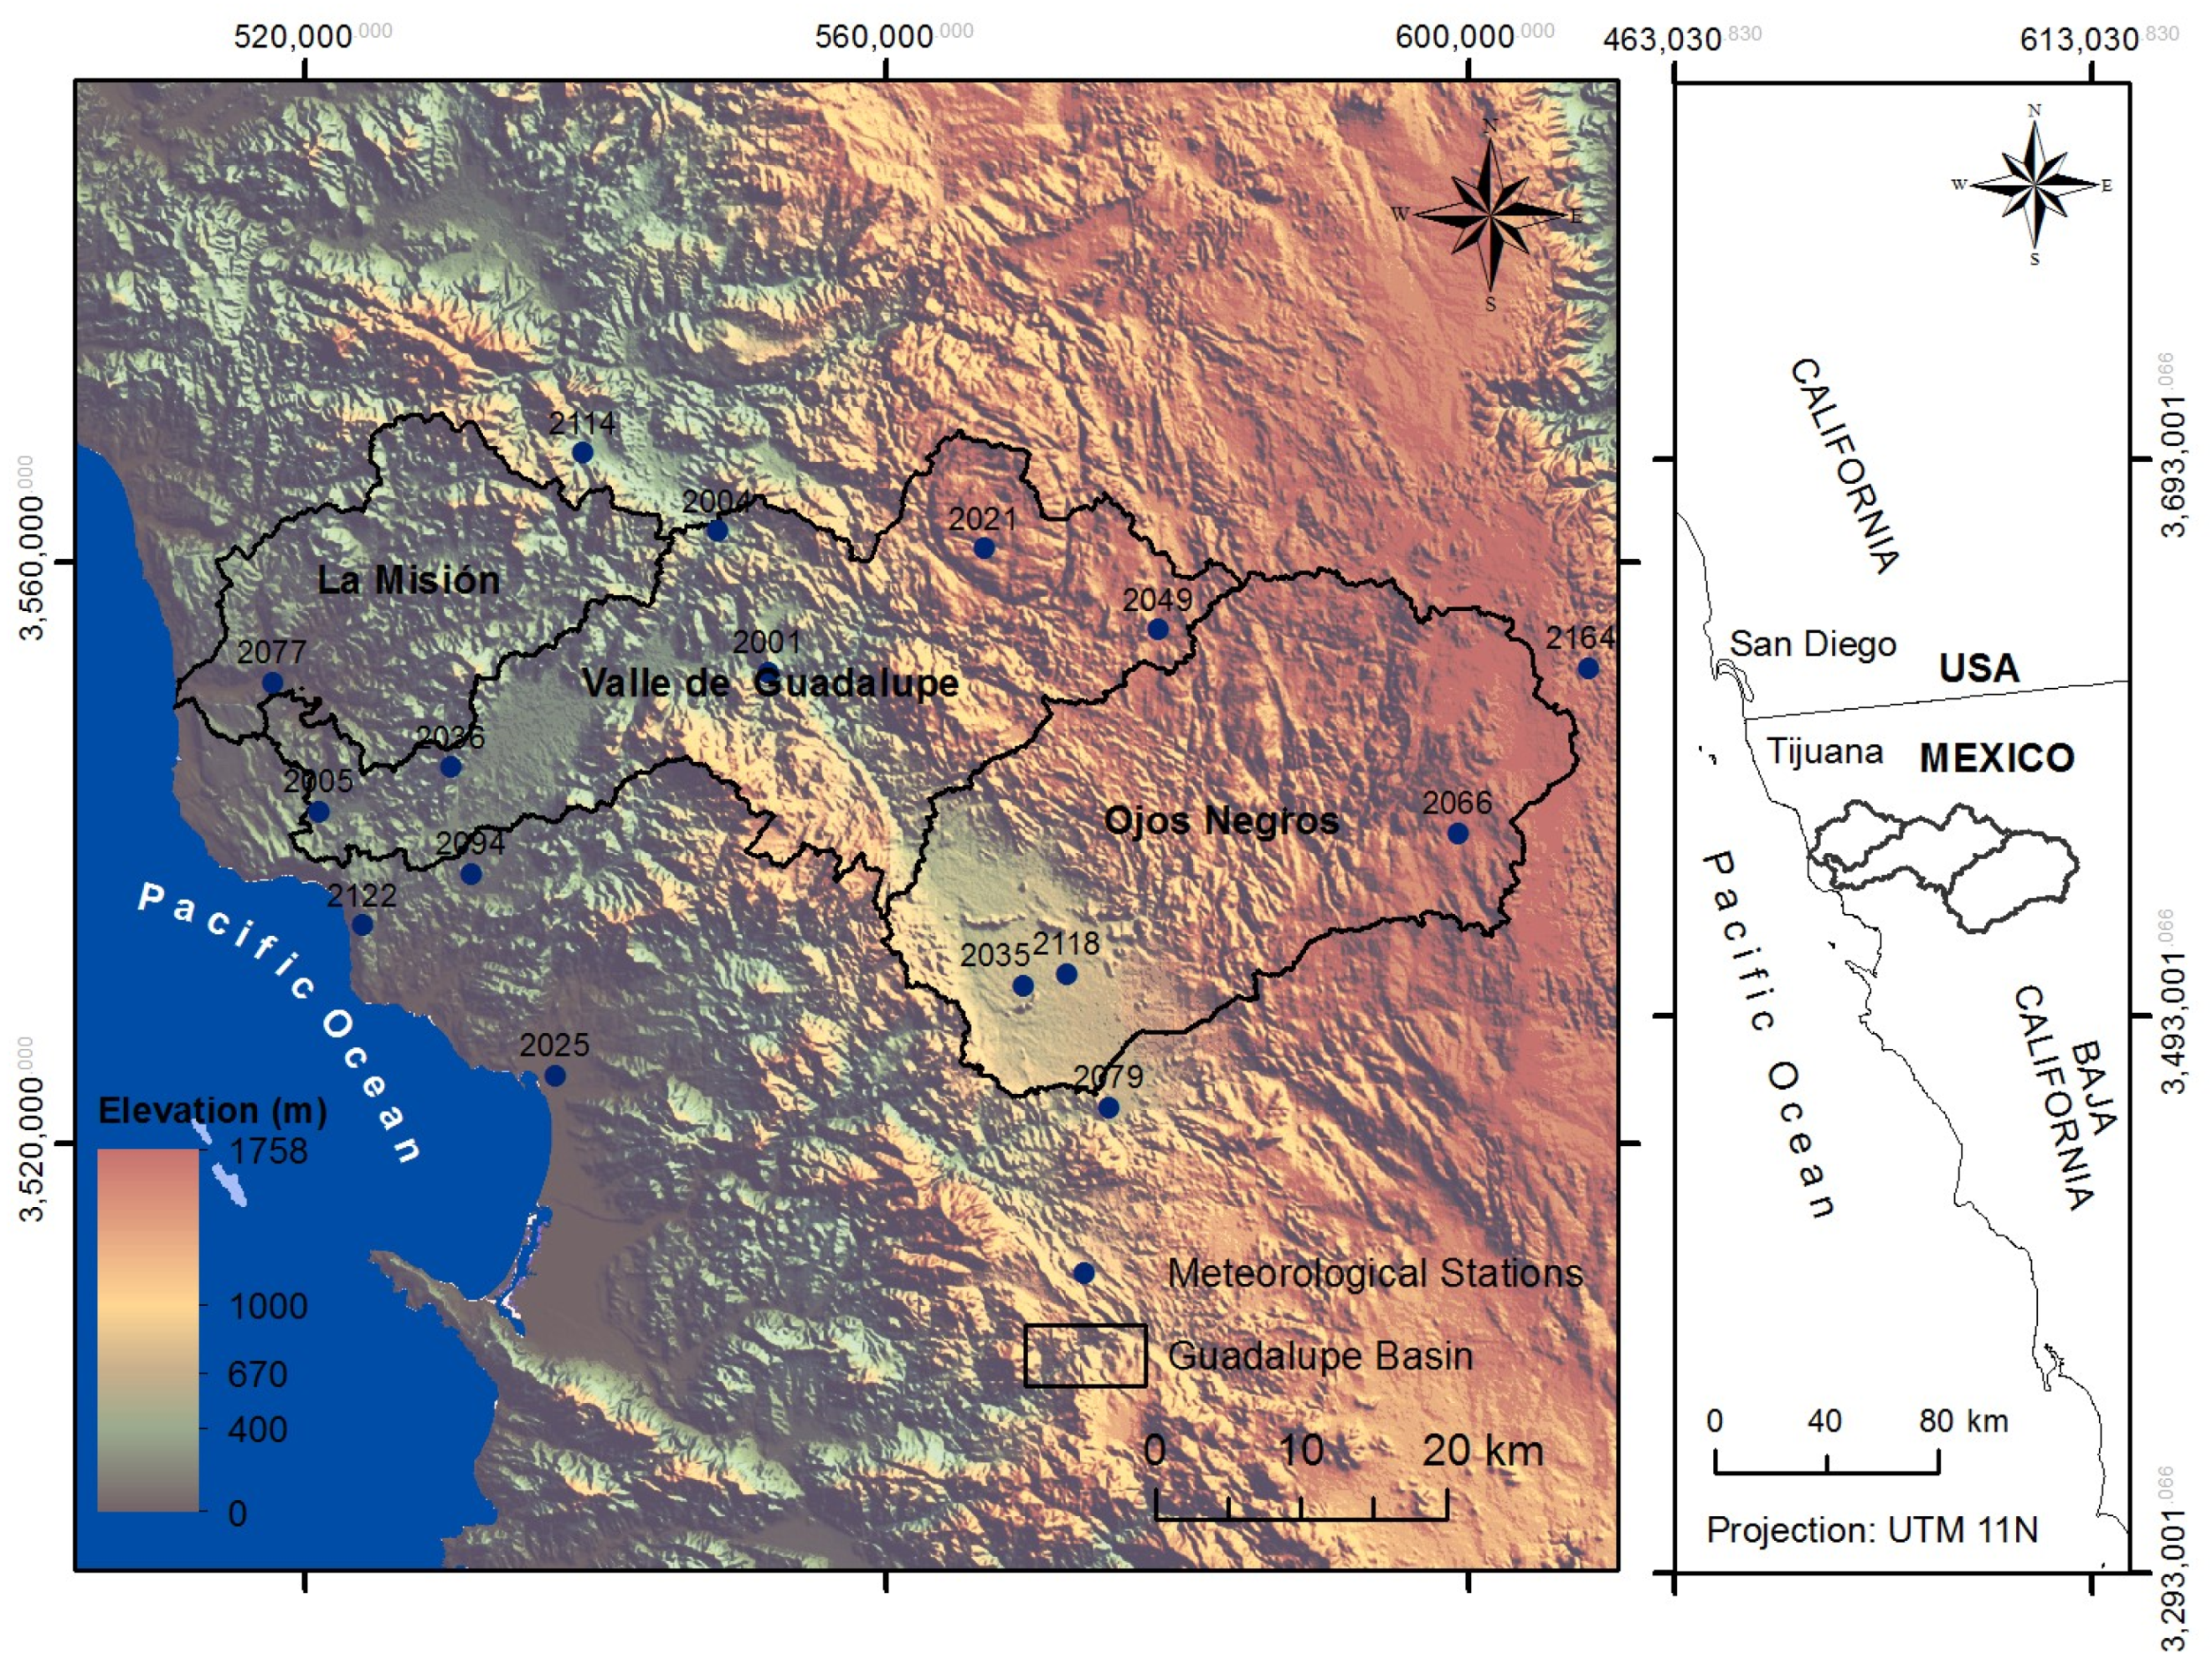
Figure 1. Study area location.
Atmosphere 14 01751 g001
Figure 2. Methodology used.
Atmosphere 14 01751 g002
Figure 3. Log–log representation for fluctuation function coming from Santa Ana Winds data in Agua Caliente station with q = 10 .
Atmosphere 14 01751 g003
Figure 4. Function h ( q ) and τ ( q ) for values q = −10, 10. This function generates a multifractal spectrum.
Atmosphere 14 01751 g004
Figure 5. Multifractal spectrum of Santa Ana Winds series recorded between 1980 and 2018 in Agua Caliente station. f ( α ) was obtained from functions h ( q ) and τ ( q ) for values of q = 10 , 10 .
Atmosphere 14 01751 g005
Figure 6. Multifractal spectra of the studied meteorological time series for Guadalupe River basin.
Atmosphere 14 01751 g006
Figure 7. (a) Values of h ( q ) , (b) values of α 0 , (c) values of Δ α , while (d) contains the asymmetry values r for temperature.
Atmosphere 14 01751 g007
Figure 8. (a) Values of h ( q ) , (b) values of α 0 , (c) values of Δ α , while (d) contains the asymmetry values r for relative humidity.
Atmosphere 14 01751 g008
Figure 9. (a) Values of h ( q ) , (b) values of α 0 , (c) values of Δ α , while (d) contains the asymmetry values r for pressure.
Atmosphere 14 01751 g009
Figure 10. (a) Values of h ( q ) , (b) values of α 0 , (c) values of Δ α , while (d) contains the asymmetry values r for wind direction.
Atmosphere 14 01751 g010
Figure 11. (a) Values of h ( q ) , (b) values of α 0 , (c) values of Δ α , while (d) contains the asymmetry values r for wind speed.
Atmosphere 14 01751 g011
Table 1. Stations.
Table 1. Stations.
CodeNameLatitudeLongitudeAltitude
2035Ojos Negros31.910−116.270680
2066Sierra de Juárez32.000−115.9501580
2079El Alamar31.840−116.200710
2118Valle San Rafael31.920−116.230721
2164Ejido El Porvenir32.110−115.850330
2001Agua Caliente32.110−116.450400
2004Ignacio Zaragoza Belén32.200−116.490540
2005Boquilla Santa Rosa de la Misión32.020−116.780250
2021El Pinal32.180−116.2901320
2025Ensenada (Obs)31.860−116.61021
2036Olivares Mexicanos32.050−116.680340
2049San Juan de Dios Norte32.130−116.1701280
2094El Farito31.980−116.670250
2122Real del Castillo Viejo31.950−116.750610
2077La Misión32.100−116.81020
2114Ejido Carmen Serdán32.240−116.580560
Table 2. Parameters of MFDFA spectra (dimensionless) for studied meteorological parameters.
Code Station2118203520662079216420012004200520212025203620492094212220772114
Temperaturem for q−0.860.920.790.960.740.700.690.740.680.700.670.710.750.770.830.73
m for q+0.450.460.470.460.350.480.400.450.480.500.440.380.490.450.460.37
hq(q = 10)0.460.470.490.470.360.460.400.450.490.420.440.390.490.460.470.37
Df1.541.531.511.531.641.541.601.551.511.581.561.611.511.541.531.63
α m a x 0.941.010.831.060.870.840.790.850.740.770.740.800.830.840.930.82
α m i n 0.430.430.430.430.300.430.350.410.450.380.390.340.450.410.420.32
Δ α 0.520.590.390.630.570.410.440.440.290.390.350.460.380.430.510.50
Relative humiditym for q−1.151.230.981.211.371.181.161.011.141.151.150.951.101.081.051.01
m for q+0.600.640.450.620.490.680.700.690.580.670.670.560.640.670.670.70
hq(q = 10)0.630.660.480.640.530.700.720.710.600.690.690.580.670.690.690.72
Df1.371.341.521.361.471.301.281.291.401.311.311.421.331.311.311.28
α m a x 1.211.301.041.271.421.231.221.061.201.221.211.001.171.141.101.07
α m i n 0.530.570.380.550.420.630.640.630.500.620.610.510.570.600.610.65
Δ α 0.680.730.660.731.000.610.580.430.700.600.610.490.590.540.490.42
Pressurem for q−0.881.040.770.761.310.800.740.820.630.820.820.830.770.800.870.76
m for q+0.720.570.410.590.960.660.640.600.530.600.610.550.550.540.600.64
hq(q = 10)0.720.590.420.600.970.660.650.610.530.610.620.560.560.550.610.64
Df1.281.411.581.401.031.341.351.391.471.391.381.441.441.451.391.36
α m a x 0.941.150.870.811.370.850.780.880.670.880.880.910.840.790.920.81
α m i n 0.710.530.340.550.920.630.610.560.490.550.570.520.490.570.550.61
Δ α 0.240.630.520.270.450.220.160.330.180.340.310.390.350.230.370.21
Wind speedm for q−0.910.900.740.900.780.850.870.960.830.920.930.760.970.910.990.82
m for q+0.390.430.140.440.310.490.460.490.380.400.490.330.510.380.040.48
hq(q = 10)0.410.440.170.450.330.500.480.500.400.420.500.350.520.410.470.49
Df1.591.561.831.551.671.501.521.501.601.581.501.651.481.591.531.51
α m a x 0.980.960.810.970.830.930.921.030.900.981.010.821.040.971.070.89
α m i n 0.330.370.060.380.240.460.390.450.310.330.440.260.460.300.390.44
Δ α 0.650.580.750.590.580.470.530.590.580.650.570.550.590.670.670.45
Wind directionm for q−0.710.820.860.800.750.590.680.670.530.660.720.590.730.740.710.64
m for q+0.480.450.370.440.520.250.360.370.310.280.430.400.320.290.430.37
hq(q = 10)0.480.460.390.460.530.270.370.390.320.290.440.410.340.310.450.38
Df1.521.541.611.541.471.731.631.611.681.711.561.591.661.691.551.62
α m a x 0.770.890.940.840.790.660.760.720.570.740.790.640.810.800.770.72
α m i n 0.430.400.310.400.490.200.320.290.240.220.380.360.260.200.380.33
Δ α 0.340.490.630.450.300.450.440.430.330.520.420.270.550.600.390.39
Disclaimer/Publisher’s Note: The statements, opinions and data contained in all publications are solely those of the individual author(s) and contributor(s) and not of MDPI and/or the editor(s). MDPI and/or the editor(s) disclaim responsibility for any injury to people or property resulting from any ideas, methods, instructions or products referred to in the content.