
Investment Evaluation of CCUS Retrofitting for Coal-to-Liquid Industry in China
Abstract
:1. Introduction
- (1)
- Internal uncertainty is mainly the impact of technical factors on the CTL-CCUS project, which is reflected in two aspects: technology selection and technology maturity. For example, the technology choice of direct coal liquefaction (DCL) or indirect coal liquefaction (ICL), as well as the choice of CO2 transportation distance and storage method. Technology maturity determines the space for future technology cost reduction. Wei et al. [10] obtained the cost of CCUS saline aquifer storage in the coal chemical industry by using a source–sink matching model, which is 14–17 USD/t CO2. Based on the trinomial tree real-option model, Li et al. [11] assessed uncertainties such as the CO2 prices, capital subsidies, water resource fees, the residual lifetime of direct coal liquefaction plants, electricity prices, transport distance and the amount of certified emission reductions (CERs) of DCL-coupled carbon capture and storage combined with enhanced deep saline water recovery (CCUS-EWR). The results show that the critical CER price for CCS-EWR retrofits is 7.15 RMB/t higher than that (141.95 RMB/t) for CCS retrofits. The Ministry of Ecology and Environment together with other departments estimated the variations in the unit capture, transport, and storage costs of CCUS in China. They anticipate that the capture cost would be 100–480 RMB/t in 2025, 90–390 RMB/t in 2030, and 20–130 RMB/t in 2060 [4]. A number of studies on the cost changes of CCUS technology coupled with coal-fired power plants also predicted a shift in the trend of CCUS technology costs and concluded that future CCUS costs could gradually decrease through learning [12,13].
- (2)
- External environmental factors, such as government policy support and subsidies for the CTL-CCUS project, as well as the regulation of carbon taxes, carbon prices and energy prices, will have an impact on the investment value of the project. Zhao et al. [8] established an evolutionary game model between government and enterprises from a micro perspective to study the issue of adopting CCUS technology and found that government policy support and active supervision for enterprises can help reduce the deployment cost of CCUS and promote the adoption of CCUS technology by enterprises. Mantripragada et al. [14] established a plant-level techno-economic model and applied it to systematically evaluate the performance, carbon emissions, and costs of a wider range of CTL plant designs, and found that the economic feasibility of CCUS largely depends on CO2 price, taxes, and electricity sales price. Energy price factors primarily refer to the fluctuations in oil prices and coal prices. Zhou [15] found that the life cycle breakeven crude oil price of the CTL process is above 96 USD/bbl. Zhou [16] used Aspen Plus to simulate the production process of CTL-CCUS and analyze its economy. The study found that the cost of liquid fuel is between 4117–5627 RMB/t, which is economically feasible. Yao et al. [6] established a real-option model assuming that oil, coal, and carbon prices are all geometric Brownian motions under the DCL project CCUS transformation value and found that it is not feasible under current market and policy conditions, but the value of delayed investment is substantial.
- (1)
- Taking the existing CTL enterprises in China as sources and deep saline aquifers and oil fields as sinks, the source–sink matching model is established based on the principle of cost minimization, considering social, geographical and geological factors comprehensively.
- (2)
- The source–sink matching results are applied to the real-option model to evaluate the investment value and critical carbon price of CTL-CCUS projects under four scenarios. Compared to existing research, this article adopts CO2 transportation data that are more in line with reality and conducts research on all projects in the CTL industry, improving the accuracy and comprehensiveness of the evaluation results.
- (3)
- Exploring the effects of policy subsidies, technological progress and CO2 transport distance on the critical carbon price of CTL-CCUS projects, the investment environment and investment decision-making process of the CTL-CCUS project are described more scientifically, which provides reference opinions for the government to formulate the transformation policy of the CTL-CCUS project.
2. Methods and Data
2.1. Source–Sink Matching
2.2. Uncertainties and Scenario Settings
2.2.1. Carbon Price and Subsidy
2.2.2. Technological Advance
2.2.3. Scenario Settings
2.3. Net Present Value
2.4. Trinomial Tree Real-Option Model
2.5. The Rules for Investment Decision Making
3. Results and Analysis
3.1. Source–Sink Matching Results
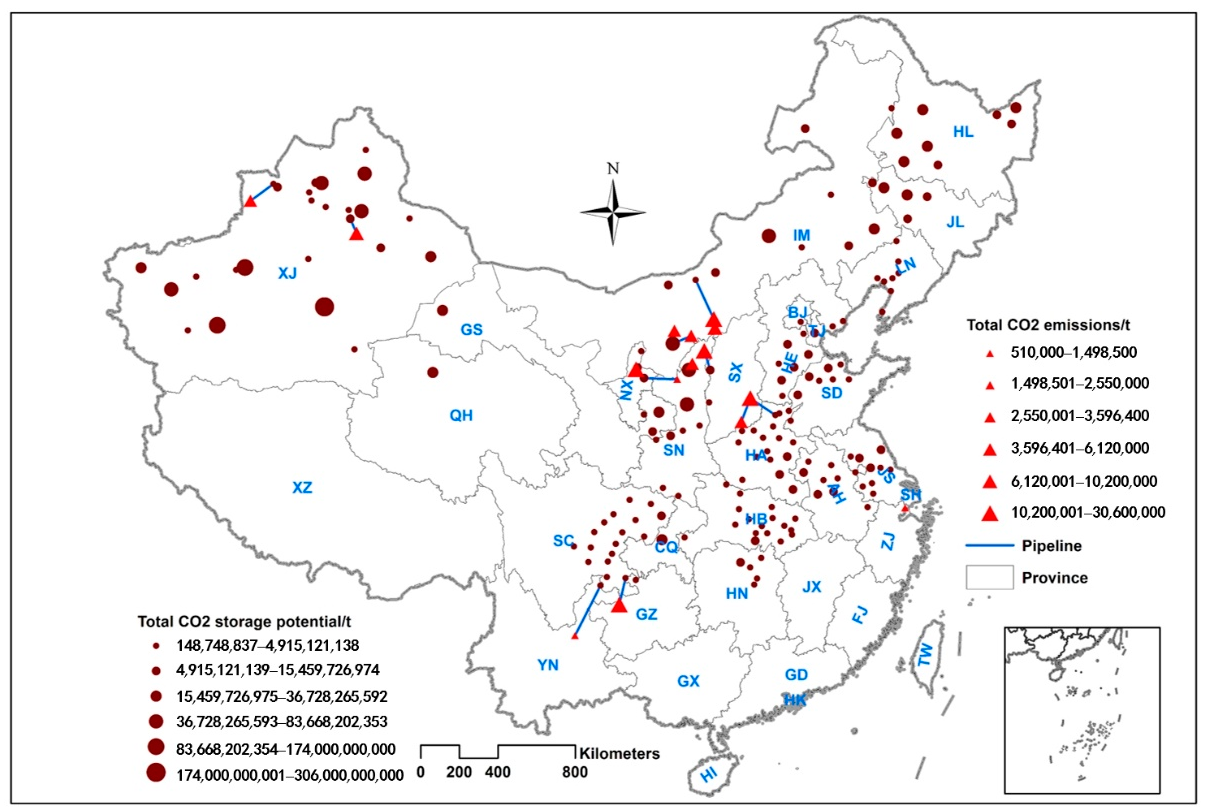
3.1.1. DSF Storage
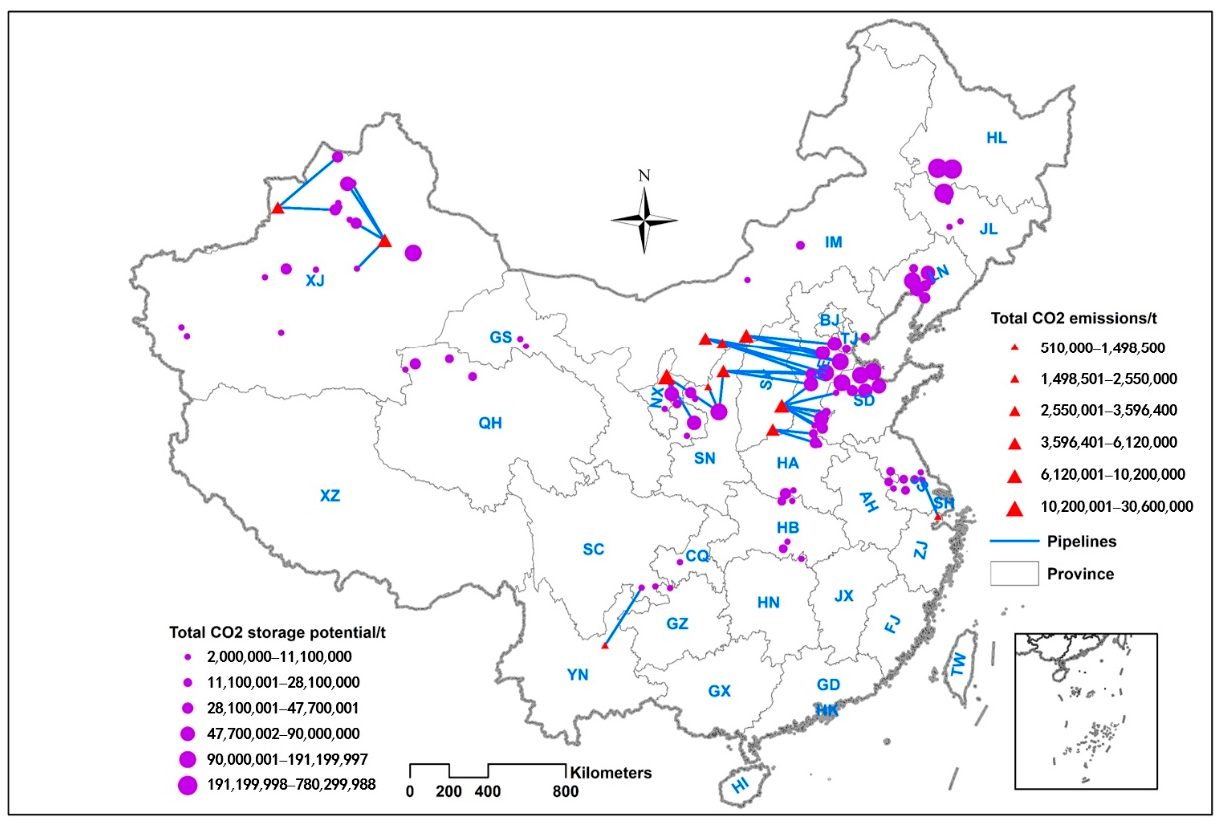
3.1.2. EOR Storage
3.2. Investment Decision Results
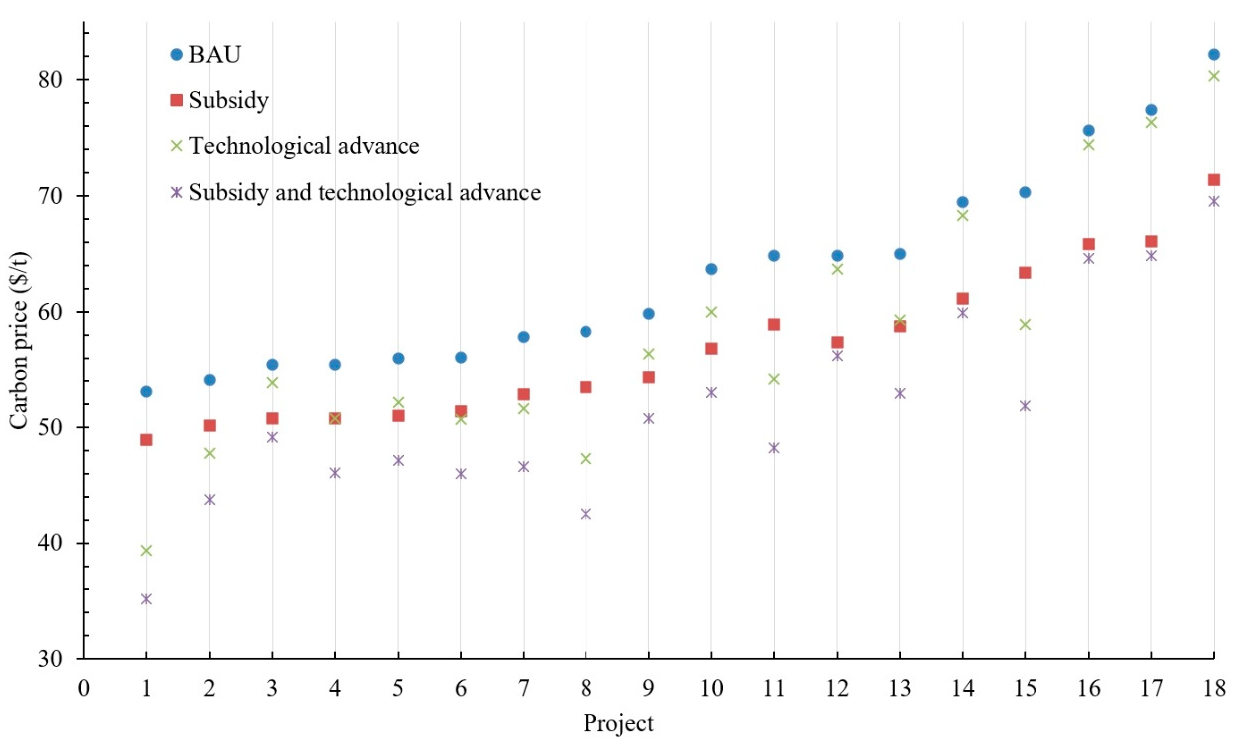
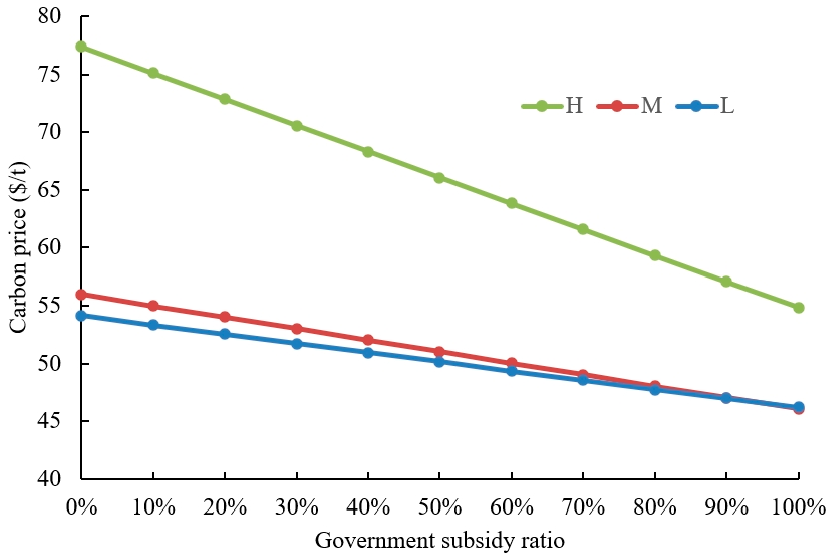
3.3. Critical Carbon Price
4. Conclusions and Policy Implications
- (1)
- For EOR storage, the CTL industry needs to construct 36 pipelines with an average transportation distance of 319.13 km. With DSF storage, the number of pipelines is 12, and the total length of construction is 1418.67 km. The pipelines for both types of storage are predominantly small-diameter pipelines. Enterprises can immediately invest in a CCUS retrofit if the CTL project can match the storage of oil fields and the ratio of pipeline construction cost to annual capture amount does not exceed 380 RMB/t.
- (2)
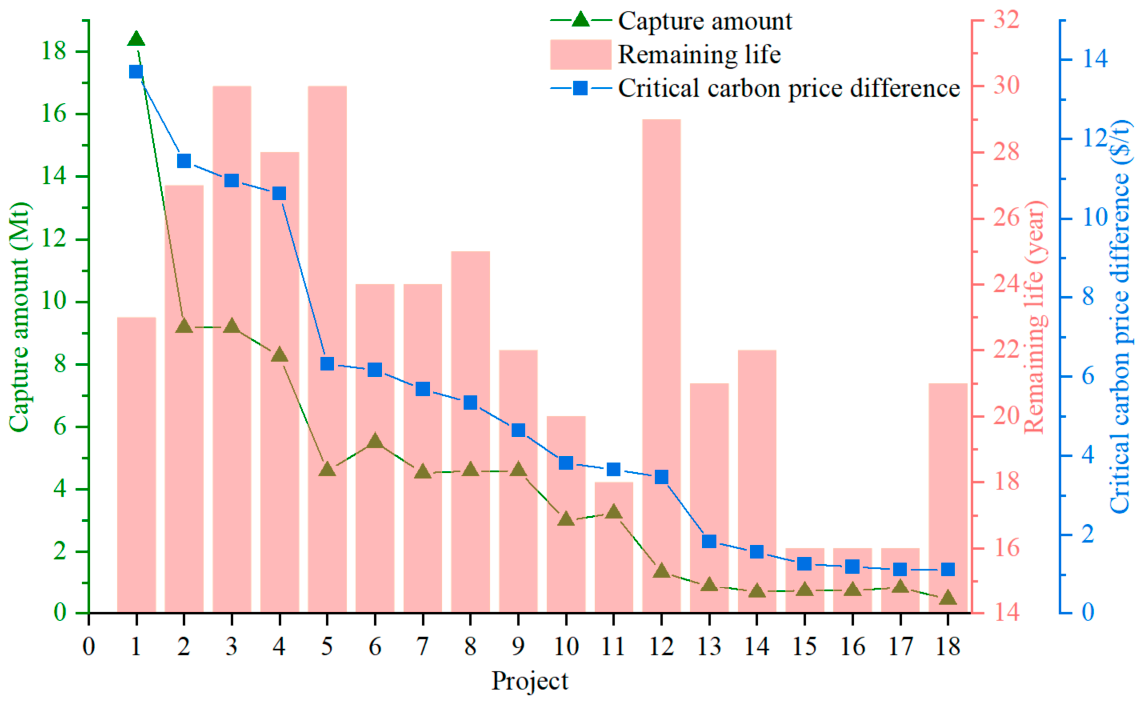
- A total of 83.33% of CTL enterprises can immediately invest in EOR storage under existing conditions, with a maximum critical carbon price of 18.05 USD/t. The current carbon market revenue is not enough to cover the high cost of DSF storage, so all CTL-CCUS projects still need to implement deferred-option investment. Therefore, the government should reasonably guide the development of the carbon market according to the demand for crude oil and the demand for emission reduction, and give play to the role of the carbon market in emission reduction incentives.
- (3)
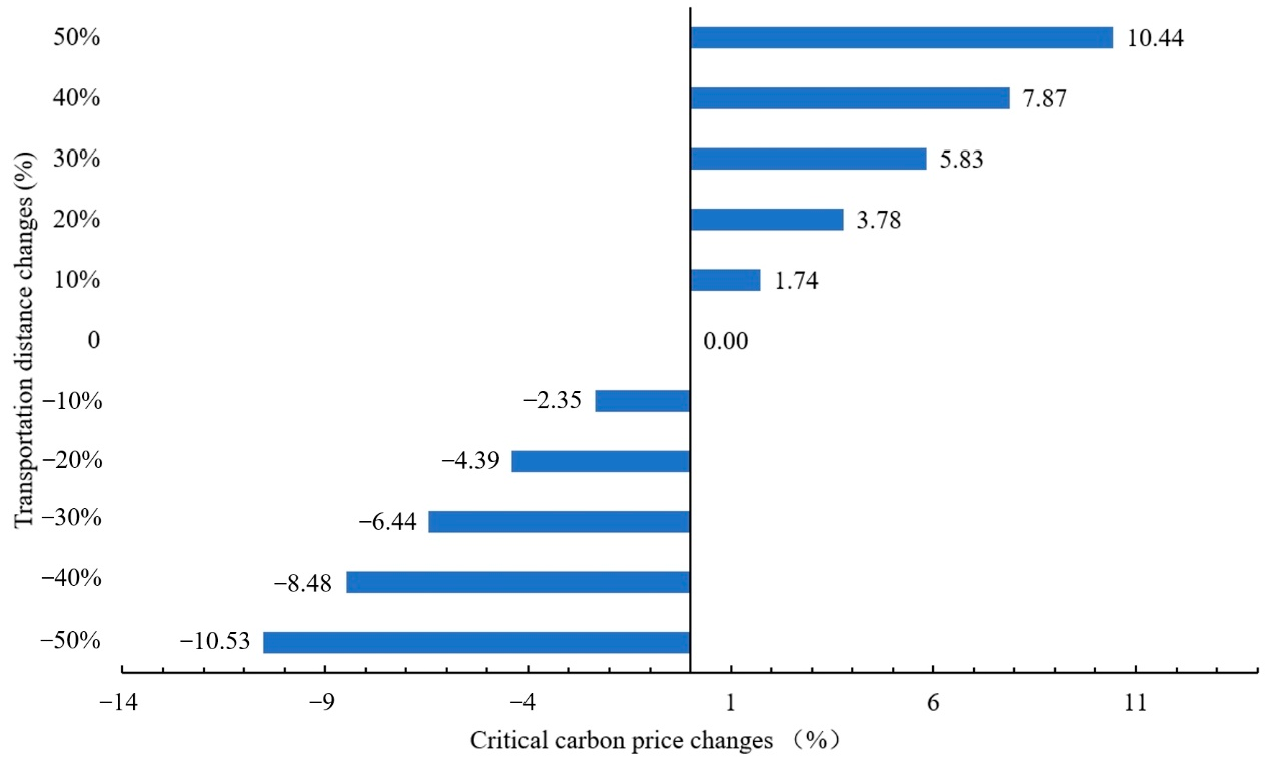
- The incentive policy can greatly improve the investment value of the CTL-CCUS project. Government subsidies have a notable impact on reducing the critical carbon price for small-scale CTL enterprises with a short remaining life, while the learning rate has a greater advantage for large-scale enterprises with a long remaining life. Moreover, changes in transportation distance also have a significant impact on the critical carbon price. The Chinese government can allocate funds to provide direct financial support for CTL-CCUS projects to promote the development of CCUS technology and improve the learning rate. In addition, to meet the requirements for clean utilization of coal in the future, clustered large-scale projects should be established when building new CTL projects. At the same time, coal transportation distance and CO2 transportation distance should be comprehensively considered when selecting sites.
Author Contributions
Funding
Institutional Review Board Statement
Informed Consent Statement
Data Availability Statement
Conflicts of Interest
References
- Yang, C.J. Coal chemicals: China’s high-carbon clean coal programme? Clim. Policy 2017, 17, 470–475. [Google Scholar] [CrossRef]
- Gao, D.; Ye, C.; Ren, X.; Zhang, Y. Life cycle analysis of direct and indirect coal liquefaction for vehicle power in China. Fuel Process. Technol. 2018, 169, 42–49. [Google Scholar] [CrossRef]
- Huang, Y.; Yi, Q.; Kang, J.X.; Zhang, Y.G.; Li, W.Y.; Feng, J.; Xie, K.C. Investigation and optimization analysis on deployment of China coal chemical industry under carbon emission constraints. Appl. Energy 2019, 254, 113684. [Google Scholar] [CrossRef]
- Cai, B.; Li, Q.; Zhang, X. China Status of CO2 Capture, Utilization and Storage (CCUS) 2021—China’s CCUS Pathways; MEEPRC: Beijing, China, 2021. [Google Scholar]
- Meng, K.C.; Williams, R.H.; Celia, M.A. Opportunities for low-cost CO2 storage demonstration projects in China. Energy Policy 2007, 35, 2368–2378. [Google Scholar] [CrossRef]
- Yao, X.; Fan, Y.; Xu, Y.; Zhang, X.; Zhu, L.; Feng, L. Is it worth to invest?—An evaluation of CTL-CCS project in China based on real options. Energy 2019, 182, 920–931. [Google Scholar] [CrossRef]
- Budinis, S.; Krevor, S.; Mac Dowell, N.; Brandon, N.; Hawkes, A. An assessment of CCS costs, barriers and potential. Energy Strategy Rev. 2018, 22, 61–81. [Google Scholar] [CrossRef]
- Zhao, T.; Liu, Z. A novel analysis of carbon capture and storage (CCS) technology adoption: An evolutionary game model between stakeholders. Energy 2019, 189, 116352. [Google Scholar] [CrossRef]
- Singh, S.; Lu, H.; Cui, Q.; Li, C.; Zhao, X.; Xu, W.; Ku, A.Y. China baseline coal-fired power plant with post-combustion CO2 capture:2. Techno-economics. Int. J. Greenh. Gas Control 2018, 78, 429–436. [Google Scholar] [CrossRef]
- Wei, N.; Li, X.; Liu, S.; Dahowski, R.T.; Davidson, C.L. Early opportunities of CO2 geological storage deployment in coal chemical industry in China. Energy Procedia 2014, 63, 7307–7314. [Google Scholar] [CrossRef]
- Li, J.Q.; Yu, B.Y.; Tang, B.J.; Hou, Y.; Mi, Z.; Shu, Y.; Wei, Y.M. Investment in carbon dioxide capture and storage combined with enhanced water recovery. Int. J. Greenh. Gas Control 2020, 94, 102848. [Google Scholar] [CrossRef]
- Lohwasser, R.; Madlener, R. Relating R&D and investment policies to CCS market diffusion through two-factor learning. Energy Policy 2013, 52, 439–452. [Google Scholar]
- Wu, X.D.; Yang, Q.; Chen, G.Q.; Hayat, T.; Alsaedi, A. Progress and prospect of CCS in China: Using learning curve to assess the cost-viability of a 2×600 MW retrofitted oxyfuel power plant as a case study. Renew. Sustain. Energy Rev. 2016, 60, 1274–1285. [Google Scholar] [CrossRef]
- Mantripragada, H.C.; Rubin, E.S. CO2 implications of coal-to-liquids (CTL) plants. Int. J. Greenh. Gas Control 2013, 16, 50–60. [Google Scholar] [CrossRef]
- Zhou, H.; Qian, Y.; Kraslawski, A.; Yang, Q.; Yang, S. Life-cycle assessment of alternative liquid fuels production in China. Energy 2017, 139, 507–522. [Google Scholar] [CrossRef]
- Zhou, L.; Duan, M.; Yu, Y. Exergy and economic analyses of indirect coal-to-liquid technology coupling carbon capture and storage. J. Clean. Prod. 2018, 174, 87–95. [Google Scholar] [CrossRef]
- Zhang, Y.; Wang, Y.; Tian, Y. Comparative studies on carbon dioxide emissions of typical modern coal chemical processes. Chem. Ind. Eng. Prog. 2016, 35, 4060–4064. [Google Scholar]
- National Energy Technology Laboratory. FE/NETL CO2 Saline Storage Cost Model: Model Description and Baseline Results; National Energy Technology Laboratory (NETL): Pittsburgh, PA, USA, 2014. [Google Scholar]
- Xie, J.; Li, X.; Gao, X. Pipeline Network Options of CCUS in Coal Chemical Industry. Atmosphere 2022, 13, 1864. [Google Scholar] [CrossRef]
- Wei, Y.M.; Li, X.Y.; Liu, L.C.; Kang, J.N.; Yu, B.Y. A cost-effective and reliable pipelines layout of carbon capture and storage for achieving China’s carbon neutrality target. J. Clean. Prod. 2022, 379, 134651. [Google Scholar] [CrossRef]
- Middleton, R.S.; Bielicki, J.M. A scalable infrastructure model for carbon capture and storage: SimCCS. Energy Policy 2009, 37, 1052–1060. [Google Scholar] [CrossRef]
- Wei, Y.M.; Li, X.Y.; Liu, L.C.; Kang, J.N.; Yu, B.Y. Economic Evaluation of CO2 Storage and Sink Enhancement Options; Tennessee Valley Authority: Knoxville, TN, USA, 2003. [Google Scholar]
- Ramírez, A.; Hagedoorn, S.; Kramers, L.; Wildenborg, T.; Hendriks, C. Screening CO2 storage options in the Netherlands. Int. J. Greenh. Gas Control 2010, 4, 367–380. [Google Scholar] [CrossRef]
- Zhong, L.F.; Lin, Q.G.; Wang, X.Z.; Wang, H.; Zhai, M.Y. Economic evaluation of carbon capture and storage enhanced oil recovery technology. Mod. Chem. Ind. 2016, 36, 7–10. [Google Scholar]
- Fan, J.H.; Todorova, N. Dynamics of China’s carbon prices in the pilot trading phase. Appl. Energy 2017, 208, 1452–1467. [Google Scholar] [CrossRef]
- Fan, J.L.; Xu, M.; Yang, L.; Zhang, X. Benefit evaluation of investment in CCS retrofitting of coal-fired power plants and PV power plants in China based on real options. Renew. Sustain. Energy Rev. 2019, 115, 109350. [Google Scholar] [CrossRef]
- Zhang, Z.; Liang, D. Study of industrial path to reduce the energy density based on divisia decomposition. In Proceedings of the 2009 International Conference on Management Science and Engineering, Moscow, Russia, 14–16 September 2009; IEEE: Piscataway, NJ, USA, 2009; pp. 1650–1655. [Google Scholar]
- Zhou, L.; Duan, M.; Yu, Y.; Zhang, X. Learning rates and cost reduction potential of indirect coal-to-liquid technology coupled with CO2 capture. Energy 2018, 165, 21–32. [Google Scholar] [CrossRef]
- Upstill, G.; Hall, P. Estimating the learning rate of a technology with multiple variants: The case of carbon storage. Energy Policy 2018, 121, 498–505. [Google Scholar] [CrossRef]
- Nadarajah, S.; Secomandi, N. A review of the operations literature on real options in energy. Eur. J. Oper. Res. 2023, 309, 469–487. [Google Scholar] [CrossRef]
- Ho, T.; Kim, K.; Li, Y.; Xu, F. Can Real Options Explain the Skewness of Stock Returns? J. Bank. Finance 2023, 148, 106751. [Google Scholar] [CrossRef]
- Fan, J.L.; Xu, M.; Yang, L.; Zhang, X.; Li, F. How can carbon capture utilization and storage be incentivized in China? A perspective based on the 45Q tax credit provisions. Energy Policy 2019, 132, 1229–1240. [Google Scholar] [CrossRef]
- Li, J.; Wei, Y.M.; Dai, M. Investment in CO2 capture and storage combined with enhanced oil recovery in China: A case study of China's first megaton-scale project. J. Clean. Prod. 2022, 373, 133724. [Google Scholar] [CrossRef]


| Project No. | Theoretical CO2 Emission (t/yr) | Capture Amount (t/year) | Province | Status |
|---|---|---|---|---|
| 1 | 918,000 | 826,200 | Inner Mongolia | Put into production |
| 2 | 5,100,000 | 4,590,000 | Shaanxi | |
| 3 | 10,200,000 | 9,180,000 | Inner Mongolia | |
| 4 | 816,000 | 734,400 | Shanxi | |
| 5 | 20,400,000 | 18,360,000 | Ningxia | |
| 6 | 9,180,000 | 8,262,000 | Shanxi | |
| 7 | 5,100,000 | 4,590,000 | Shaanxi | |
| 8 | 6,120,000 | 5,508,000 | Inner Mongolia | |
| 9 | 5,100,000 | 4,520,000 | Xinjiang | |
| 10 | 10,200,000 | 9,180,000 | Xinjiang | |
| 11 | 816,000 | 734,400 | Inner Mongolia | |
| 12 | 1,020,000 | 895,090 | Yunnan | |
| 13 | 5,100,000 | 4,590,000 | Shanxi | Under construction |
| 14 | 510,000 | 459,000 | Zhejiang | |
| 15 | 765,000 | 688,500 | Shaanxi | |
| 16 | 3,596,400 | 3,236,760 | Inner Mongolia | |
| 17 | 3,330,000 | 2,997,000 | Shaanxi | |
| 18 | 1,498,500 | 1,348,650 | Shaanxi |
| Variables/ Parameters | Definition | Unit | Value | Data Sources |
|---|---|---|---|---|
| Set | ||||
| S | CTL plant nodes set | |||
| R | Hub nodes set | |||
| Nodes adjacent to nodes m | ||||
| D | Pipe diameter set | |||
| I | All nodes | |||
| Decision variables | ||||
| CTL plant i’s capture amount | t/year | |||
| Transportation amount from node m to n | t/year | |||
| Hub j storage amount | t/year | |||
| Number of wells in Hub j | ||||
| Number of pipelines with diameter d from node m to n | ||||
| Parameters | ||||
| Capturing and retrofitting capital cost | USD/t | 61.7 | (National Petroleum Council, 2019) | |
| Maintenance cost of capture process | USD | 6% | (National Petroleum Council, 2019) | |
| Unit capture cost | USD/t | 23 | (National Petroleum Council, 2019) | |
| CTL plant i’s theoretical CO2 emission amount | t/year | |||
| Capital cost of pipeline construction per unit diameter | USD/inch·km | 21,035 | [21] | |
| Pipeline maintenance cost | USD/km | 3107 | [22] | |
| Unit transportation cost | USD/t/km | 0.052 | Domestic project | |
| Distance from node m to n | km | |||
| Pipeline diameter from node m to n | inch | - | ||
| Maximum flow of pipeline with diameter d | t/year | - | ||
| Hub j’s theoretical storage potential | t | |||
| Storage site development costs | USD | - | [23] | |
| Storage site equipment costs | USD | - | [23] | |
| Storage site monitoring costs | USD | - | [23] | |
| Storage site operation and maintenance costs | USD | 5% | [23] | |
| Unit storage cost | USD/t | 10 | [7,24] | |
| Hub j’s injection amount for a single well | t/year | 20,000 | [18,24] | |
| Injection well depth | m | - | Geological conditions | |
| Injection well drilling cost per unit | USD/m | 1562.5 | Domestic project | |
| Oil price | USD/bbl | 50 | [24] | |
| CO2 replacement ratio for oil | bbl/t CO2 | - | Geological conditions | |
| r | Discount rate | - | 5% | [24] |
| T | Project design cycle | year | 15 | |
| Total emission reduction target | Mt/year | 280 | Scenario setting | |
| Scenario | Storage Method | Government Subsidy | Learning Rate | Carbon Reduction Revenue | Oil Recovery Revenue |
|---|---|---|---|---|---|
| BAU | DSF | √ | |||
| EOR | √ | √ | |||
| Subsidy | DSF | √ | √ | ||
| EOR | √ | √ | √ | ||
| Technological advance | DSF | √ | √ | ||
| EOR | √ | √ | √ | ||
| Subsidy and technological advance | DSF | √ | √ | √ | |
| EOR | √ | √ | √ | √ |
| NPV | TIV | Decisions |
|---|---|---|
| NPV > 0 | TIV > NPV | Execution of option to defer investment |
| NPV > 0 | TIV = NPV | Abandon the option and invest immediately |
| NPV ≤ 0 | TIV > 0 | Execution of option to defer investment |
| NPV < 0 | TIV = 0 | Abandon investment |
| Pipeline No. | Pipeline Distance (km) | Transportation Amount (t/yr) | Pipeline Diameter (inch) |
|---|---|---|---|
| 1 | 104.49 | 4,062,960 | 16 |
| 2 | 12.63 | 18,360,000 | 24 |
| 3 | 157.26 | 8,996,400 | 20 |
| 4 | 66.86 | 5,508,000 | 16 |
| 5 | 147.63 | 4,520,000 | 16 |
| 6 | 81.76 | 9,180,000 | 20 |
| 7 | 216.02 | 9,914,400 | 20 |
| 8 | 290.06 | 895,090 | 8 |
| 9 | 46.29 | 4,590,000 | 16 |
| 10 | 181.27 | 459,000 | 6 |
| 11 | 36.07 | 12,865,500 | 24 |
| 12 | 78.32 | 1,348,650 | 12 |
| Pipeline No. | Pipeline Distance (km) | Transportation Amount (t/yr) | Pipeline Diameter (inch) |
|---|---|---|---|
| 1 | 560.74 | 3,390,000 | 16 |
| 2 | 208.44 | 4,144,254 | 16 |
| 3 | 408.79 | 3,224,725 | 12 |
| 4 | 509.11 | 2,169,676 | 12 |
| 5 | 187.95 | 926,401 | 8 |
| 6 | 197.75 | 870,000 | 8 |
| 7 | 239.81 | 2,260,000 | 12 |
| 8 | 234.62 | 1,120,000 | 8 |
| 9 | 148.47 | 2,213,330 | 12 |
| 10 | 274.08 | 4,520,000 | 16 |
| 11 | 91.77 | 3,980,000 | 16 |
| 12 | 39.75 | 2,260,000 | 12 |
| 13 | 326.50 | 1,130,000 | 8 |
| 14 | 149.70 | 3,390,000 | 16 |
| 15 | 216.27 | 3,380,000 | 16 |
| 16 | 291.59 | 559,999 | 8 |
| 17 | 458.64 | 2,127,647 | 12 |
| 18 | 534.85 | 2,260,000 | 12 |
| 19 | 715.34 | 3,390,000 | 16 |
| 20 | 652.47 | 1,130,000 | 8 |
| 21 | 401.29 | 2,260,000 | 12 |
| 22 | 298.08 | 2,260,000 | 12 |
| 23 | 202.89 | 466,666 | 6 |
| 24 | 346.85 | 3,390,000 | 16 |
| 25 | 171.97 | 2,173,334 | 12 |
| 26 | 335.57 | 2,016,665 | 12 |
| 27 | 210.55 | 1,130,000 | 8 |
| 28 | 462.91 | 4,519,999 | 16 |
| 29 | 348.77 | 918,000 | 8 |
| 30 | 231.48 | 3,340,000 | 16 |
| 31 | 212.59 | 1,130,000 | 8 |
| 32 | 199.31 | 459,000 | 6 |
| 33 | 489.76 | 925,685 | 8 |
| 34 | 527.37 | 735,275 | 8 |
| 35 | 463.33 | 4,333,599 | 16 |
| 36 | 139.52 | 2,195,745 | 12 |
Disclaimer/Publisher’s Note: The statements, opinions and data contained in all publications are solely those of the individual author(s) and contributor(s) and not of MDPI and/or the editor(s). MDPI and/or the editor(s) disclaim responsibility for any injury to people or property resulting from any ideas, methods, instructions or products referred to in the content. |
© 2023 by the authors. Licensee MDPI, Basel, Switzerland. This article is an open access article distributed under the terms and conditions of the Creative Commons Attribution (CC BY) license (https://creativecommons.org/licenses/by/4.0/).
Share and Cite
Dai, M.; Xie, J.; Li, X.; Gao, X. Investment Evaluation of CCUS Retrofitting for Coal-to-Liquid Industry in China. Atmosphere 2023, 14, 1737. https://doi.org/10.3390/atmos14121737
Dai M, Xie J, Li X, Gao X. Investment Evaluation of CCUS Retrofitting for Coal-to-Liquid Industry in China. Atmosphere. 2023; 14(12):1737. https://doi.org/10.3390/atmos14121737
Chicago/Turabian StyleDai, Min, Jingjing Xie, Xiaoyu Li, and Xu Gao. 2023. "Investment Evaluation of CCUS Retrofitting for Coal-to-Liquid Industry in China" Atmosphere 14, no. 12: 1737. https://doi.org/10.3390/atmos14121737
APA StyleDai, M., Xie, J., Li, X., & Gao, X. (2023). Investment Evaluation of CCUS Retrofitting for Coal-to-Liquid Industry in China. Atmosphere, 14(12), 1737. https://doi.org/10.3390/atmos14121737