Abstract
The harsh scientific research environment of Antarctic stations demands a reliable energy supply; however, traditional methods not only pose a challenge in supply but also harm the environment. Antarctic energy supply has become a new choice for energy development in Antarctica due to its abundant wind energy resources. Using ERA5 10 m wind field reanalysis data, we compared and analyzed the correlation (r) and Root Mean Square Error (RMSE) between some observation stations and reanalysis data, with correlations above 0.67 and root mean square error below 2.3. This indicates that the accuracy of the ERA5 data is suitable for resource assessment at stations in Antarctica. We assessed the wind energy potential of the Great Wall, Zhongshan, Kunlun and Taishan Stations. The results show that the annual distribution and long-term trend of wind energy at Taishan Station are the best, followed by the Great Wall, Zhongshan and Kunlun Stations. Taishan Station has stable wind direction and abundant wind energy, the average wind power density is 800 W/m2, with an annual growth trend of 2.02 W/m2·yr−1. The effective wind speed occurrence and energy level occurrence are generally above 90% and the coefficient of variation is generally below 0.8. The dominant direction of wind energy is northeast and the wind direction is stable, which is conducive to the development and utilization of wind energy.
1. Introduction
The operations and endeavors of Antarctic scientific research stations are closely linked to China’s advancement in Antarctic research. The 14th five-year plan explicitly emphasizes enhancing China’s participation in Antarctic conservation and utilization. Due to the harsh Antarctic environment, energy supply for these stations has become a significant challenge. Currently, polar ships are used to transport conventional energy to Antarctica, a journey which can be catastrophic if it is not timely. Additionally, pollutants generated during transportation and station operations further contribute to global climate change through atmospheric circulation, hindering the protection and utilization of Antarctic ecology. However, green and clean new energy is gradually proving its effectiveness. In Antarctica, where polar night occurs, using wind energy to power scientific research sites can effectively address energy supply and environmental pollution issues while reducing carbon emissions and achieving low-carbon goals. Australia’s Morsen Station is equipped with two wind turbines, and the closest Antarctic research station to zero emissions is Belgium’s Princess Elizabeth Station, which relies entirely on solar and wind energy for energy supply [1]. In 2021, a total of 29 facilities implemented renewable energy sources in their energy systems. This included the use of solar, wind, hydropower and other sustainable energy sources to generate electricity. Additionally, one permanent power station and four summer power stations utilized renewable energy to meet over 50% of their demand. These developments demonstrate a growing trend towards sustainability and a commitment to reducing greenhouse gas emissions and minimizing reliance on fossil fuels [2]. GÜĞÜL [3] considers the site selection of Antarctic research stations from the perspective of renewable energy, pointing out that the location should be determined first, and then energy demand and required systems should be compared.
Romanova and Romanov [4] used NCEP/NCAR reanalysis data to calculate the trend of changes over the past 70 years, pointing out that in the past 70 years, the sea level pressure in high-latitude regions of Antarctica has decreased, while the sea surface wind speed has been increasing year by year. Zhang and Dou [5] combined the meteorological data and load electricity consumption data of Zhongshan Station to perform system energy matching calculations, indicating that the development of wind solar complementary power generation system at Zhongshan Station in Antarctica can meet the electricity demand of Zhongshan Station. Guichard et al. [6] evaluated the production potential of deploying turbines at Antarctic stations and pointed out that further load regulation or energy storage systems can make Antarctic stations significantly energy sustainable. Based on analysis and computer simulation, Henryson and Svensson [7] concluded that wind power generation has enormous potential as the main energy source in Antarctica. Petrenko et al. [8] evaluated the power generation of Akademik Vernadsky station based on observational data, pointing out that the average wind speed at the station is 3.9 m/s, with prevailing winds heading north–northeast, and estimated that 10 wind turbines can meet 28.4% of the station’s annual power demand. Boccaletti et al. [9] designed wind turbines for installation under extreme environmental conditions, and calculated the possibility of wind energy supplying energy to Concordia base through comparative simulations. Dou et al. [10] analyzed the distribution of renewable energy at Zhongshan Station, proposed energy management strategies for the power system, and pointed out that independent renewable energy systems can meet the electricity demand for the normal operation of Zhongshan Station.
Messmer et al. [11] used wind and wave data from the ERA5 dataset to assess floating wind power in Europe and pointed out that Ireland, Iceland, Norway and the United Kingdom have both large waves and enormous potential. Yu et al. [12] used ERA5 wind field data to study the sea surface wind fields in the Yellow Sea and Bohai Sea regions. McErlich et al. [13] compared ERA5 data with temperate cyclone data measured by Windsat and pointed out that ERA5 shows a strong correlation with Windsat, which can effectively represent cyclone structures. Zhao et al. [14] compared South China Sea buoy data with ERA5 data and pointed out that ERA5 underestimated the actual wind speed and significant wave height and overestimated the average wave period, but the overall quality is trustworthy. Cavaiola et al. [15] implemented quantile random forest calibration to alleviate the problem of poor fit of ERA5 data in complex terrain areas. The calibrated ERA5 data performs better than high-resolution 3 km wind energy assessments. Dai [16] analyzed 3 h ground observation data and hourly ERA5 data to evaluate the performance of ERA5 in simulating diurnal cycles. He also noted that ERA5 can effectively simulate variables such as surface pressure, temperature and relative humidity.
The study of renewable energy supply for polar scientific research stations has received increasing attention, and evaluating energy sources such as wind energy near the stations provides a basis for the development of renewable energy. Unlike previous studies that only calculate wind speed for wind energy evaluation [4,5,8], this paper uses a series of wind energy evaluation indicators to evaluate the wind energy at Antarctic Stations. By analyzing the wind energy distribution of the Great Wall, Zhongshan, Kunlun and Taishan stations in Antarctica with ERA5, we aim to raise awareness of the importance of wind energy in building sustainable Antarctic stations, increasing the use of clean energy and promoting sustainable scientific research within the region.
The innovation of this study is to use reanalysis data to evaluate the wind energy resources of Antarctic stations using a complete set of wind energy assessment indicators, taking into account wind power density, effective wind speed occurrence, stability and other indicators of wind energy in Antarctic locations. Previous studies have mainly focused on analyzing meteorological properties such as wind speed and temperature at Antarctic stations, but an assessment of renewable energy at Antarctic stations was missing. The use of wind energy resources in the Antarctic can significantly reduce environmental impact and reduce the energy dependence of Antarctic stations. The prerequisite for energy use is the effective assessment of wind energy resources at Antarctic stations. This study uses reanalysis data and verifies observational data to analyze the monthly and annual variation characteristics of a complete set of wind energy assessment indicators. The wind energy rose diagram is used to display the prevailing wind energy direction and the frequency of wind energy concentration, which can support the rational development of wind energy resources at the site.
The structure of this study is as follows:
1. Data and methods: This chapter presents the selected data sources for the study and the calculation methods for the entire set of wind energy indicators.
2. Monthly variation characteristics of wind energy at Antarctic stations: Based on the calculation of a complete set of wind energy indicators (wind power density, effective wind speed occurrence, energy level occurrence and stability), we use a bar or line chart to display the monthly variation characteristics of wind energy, and a wind energy rise chart to display the prevailing direction and frequency of wind energy resources.
3. Annual fluctuation characteristics of Antarctic stations: Using the least squares method to linearly fit the interannual fluctuation trends of wind energy at the four stations in Antarctica can help to make future planning decisions for wind energy development.
2. Data and Methods
2.1. Data
The wind field data selected for this study is the ERA5 reanalysis dataset, which covers the whole globe, including 10 m wind field data from 1940 to present, with a spatial resolution of 0.25° and a temporal resolution of 1 h. Previous studies have investigated the accuracy of ERA5 in simulating wind speed. ERA5 has problems with poor simulation quality in mountainous areas, overestimating low-level wind speeds, and underestimating high-level wind speeds [14,17,18,19]. However, it still accurately reproduces wind speed distribution and describes overall wind characteristics [18,19,20,21,22]. At the same time, some scholars have also tested ERA5 data in high latitude regions, pointing out that although there are deviations in precipitation, temperature [18,23,24] and water vapor products [25], they can still serve as powerful tools for exploring the polar regions.
Referring to previous assessment methods for global reanalysis datasets [26,27], ERA5 data [28] replaced its predecessor products. Compared to ERA-interim and observational data, ERA5 data improves spatiotemporal resolution and accuracy, which is reflected in the precipitation, wind speed, wave height and temperature in the troposphere. Based on the Integrated Forecasting System (IFS) CY41R2, which began operations in 2016. ERA5 has therefore benefited from the development of model physics, nuclear dynamics and data assimilation over the last decade.
The spatial range selected for this study is 60~90° S, 0~360°, with a resolution of 0.25°. The time range is from 1981 to 2020, with a time resolution of 6 h. The study area is shown in the Figure 1 below. Four stations built in China, Great Wall, Zhongshan, Kunlun and Taishan Station, are selected as the study area to assess the station wind energy. The longitude and latitude of stations are shown in Table 1.
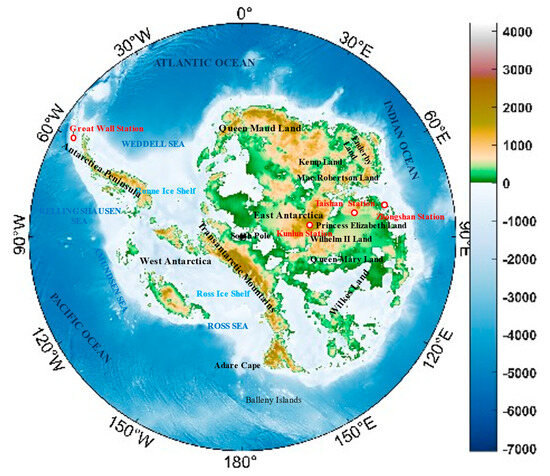
Figure 1.
Antarctic terrain and China’s Antarctic scientific research sites.

Table 1.
Longitude and latitude of China’s Antarctic stations.
Due to the scarcity of Antarctic stations, data from British Antarctic Survey observation stations were used for this study. Table 2 below shows the correlation and root mean square error between ERA5 data and measured data from stations such as Novolazarevskaya, Casey, Great Wall and Zhongshan. Figure 2 shows the comparison between the measurement data at each station and the wind speed at each station, while Figure 3 shows the quantile-quantile plots of the two data sets. From the graph below, it can be seen that ERA5 data can effectively simulate wind speed at the Antarctic station.

Table 2.
Errors of ERA5 and actual meteorological station observation data.
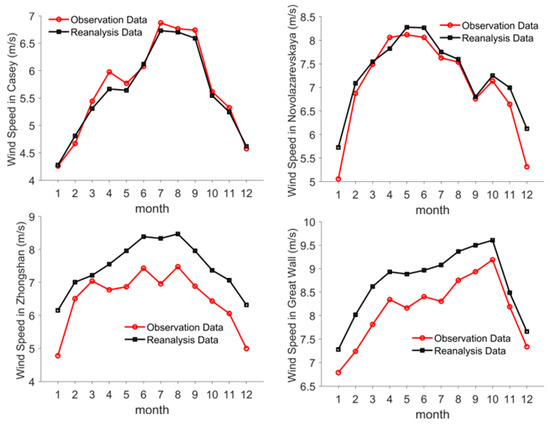
Figure 2.
Comparison of ERA5 data from the Antarctic station and wind speed data from the measured station.
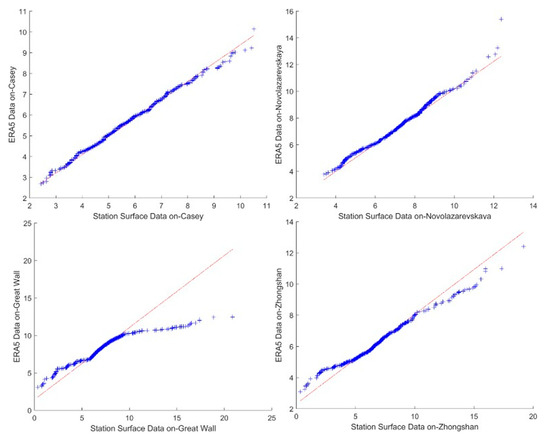
Figure 3.
Antarctic station ERA5 data and measured station wind speed data quantile-quantile plot.
2.2. Method
To effectively evaluate the distribution of wind energy at Antarctic sites, it was necessary to analyze their wind power density, availability and stability. Referring to the wind energy evaluation indicators proposed by Zheng et al. [29], this study calculated a series of indicators such as wind power density, effective wind speed occurrence, energy level occurrence, coefficient of variation, monthly variation index and seasonal variation index to demonstrate the enrichment of wind energy, availability and development stability. The next step was to analyze wind energy resources based on the above indicators, providing a basis for wind energy development. This study also calculated the frequency and direction of wind energy to obtain a wind rose diagram, which can help to analyze the dominant direction of wind energy and the frequency occupied by each energy level.
Wind power density:
In Formula (1), is wind power density (W/m2); is wind speed (m/s); and is sea surface air density (kg/m3). Due to the proportional relationship between wind energy density and the cubic power of wind speed, air density has little influence on wind energy density. The air density is selected at 15 °C below 1 atmospheric pressure, which is 1.225 kg/m3. Wind energy density is used to describe the wind energy resources contained per unit area, which can intuitively represent the content of regional wind energy.
Effective Wind Speed Occurrence:
In Equation (2), EWSO is the effective wind speed occurrence, t1 is the occurrence time of effective wind speed (between 5 m/s and 25 m/s) and T is the total time. Effective wind speed occurrence represents the availability rate of wind energy resources. It is generally believed that only wind speeds of up to 5–25 m/s can cause the wind turbine to rotate and generate electricity, while wind speeds below 5 m/s are too low to make wind energy effectively. Since not all time slots are available, we calculated the availability of Antarctic wind energy by counting the time slots within the available range.
Energy level occurrence:
In Equations (3)–(5), t100, t200 and t400 are the times when the wind power density is above 100, 200 and 400 W/m2, respectively, and T is the total time.
Energy level occurrence refers to the occurrence at which the wind power density exceeds a certain threshold, while ALO refers to the occurrence at which the wind power density exceeds 100 W/m2. According to the division of energy level occurrence, if it is greater than 100 W/m2, it is available level occurrence, if it is greater than 200 W/m2, it is rich level occurrence and if it is greater than 400 W/m2, it is superb level occurrence. Unlike wind power density values, energy level occurrence focuses more on the occurrence of wind energy at a certain value and can better focus on the degree of energy utilization.
Coefficient of Variation:
In Equations (6) and (7), is the coefficient of variation, is the mean value, S is the standard deviation and n is the number of samples.
The coefficient of variation refers to the variability of wind energy resources at different times within a day. This index allows you to intuitively see whether wind power generation in the region is efficient. Compared with areas with stable wind energy, areas with a coefficient of variation greater than 1 have greater dispersion of wind energy, unstable voltage in wind power generation and inefficient use of wind energy, which is not conducive to the development of wind energy.
Monthly Variation Index:
In Formula (8), is the wind power density of the most abundant month, is the wind power density of the poorest month and is the average wind power density of the years.
Seasonal Variation Index:
In Formula (9), is the wind power density of the most abundant season, is the wind power density of the least abundant season and is the average wind power density of the years. The monthly variation index (seasonal variation index) refers to the difference between the wind energy density of the month (season) with the maximum wind energy density and the month (season) with the minimum wind energy density during the year. It shows the annual variation characteristics of wind energy density, which are related to the quality of wind energy development during the year.
3. Monthly Variation Characteristics of Wind Energy Resources
3.1. Wind Power Density
After averaging every 6 h wind power density in March 1981, we obtained the average wind power density for four sites in the Antarctic region in March 1981. Using the same method, we obtained the monthly average wind power density for each of the 12 months over 40 years. We averaged the wind power density for March over 40 years and obtained the wind power density for the Antarctic stations in March under 40-year average state. The monthly variation characteristics of wind power density at four stations in Antarctica from 1981 to 2020 are shown in Figure 4.
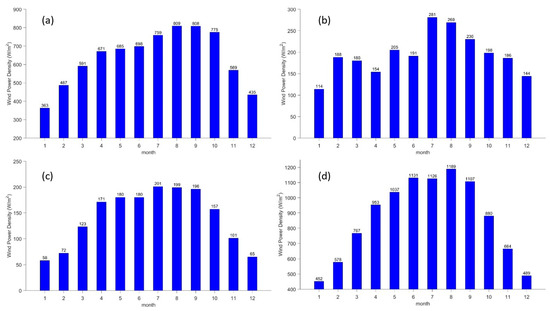
Figure 4.
Monthly variation characteristics of wind power density at the Antarctic Stations. (a–d), respectively refer to Great Wall Station, Zhongshan Station, Kunlun Station and Mount Taishan Station.
At the Great Wall Station (as shown in Figure 4a), the peak wind power density occurs from August to September, reaching around 809 W/m2; the trough appears in January at 363 W/m2; and the wind power density at the Great Wall Station was over 400 W/m2 throughout the year, with half of the months being over 600 W/m2 and an average annual wind power density of 638 W/m2. It is generally believed that a wind power density of over 50 W/m2 is in the available range, while a wind power density of over 400 W/m2 is in the superb range. The wind power density at the Great Wall Station was twice that of the superb half months, which was higher than the superb range throughout the year. This paper calculates wind energy at a height of 10 m above the sea surface, which is easily affected by terrain, friction and other factors. The actual wind turbine is about 100 m high, so the wind energy potential is greater.
At the Zhongshan Station (as shown in Figure 4b), the peak wind power occurs from July to August, reaching 280 W/m2, and the trough occurs in January at around 114 W/m2. The annual wind power density was generally above 100 W/m2, with an average annual wind power density of 200 W/m2. Zhongshan Station had abundant wind power density resources throughout the year and it was even closer to the rich range from June to August.
At Kunlun Station (as shown in Figure 4c), the peak wind power density occurs from July to September, at above 190 W/m2, and the trough occurs from December to February, at around 60 W/m2. More than half of the months of the year are above 100 W/m2, with an average annual wind power density of 140 W/m2. The wind power density of Kunlun Station was in the available range all year round, and it was closer to the rich range from July to September.
At Taishan Station (as shown in Figure 4d), the peak wind power density appears from June to September, reaching more than 1100 W/m2, and the trough appears from December to January, at levels below 450 W/m2. The wind power density reaches over 800 W/m2 for more than half months of the year, with an average annual wind power density of 860 W/m2. Nearly half of the months of the year had a wind power density of over 800 W/m2, which is firmly in the twice superb range.
The above four stations in the Antarctic region, except for Kunlun Station, had relatively abundant wind energy resources throughout the year, showing a clear single peak distribution. Wind energy was relatively concentrated with the most abundant wind energy resources from July to September, which is the late winter and early spring season in the Antarctic region.
3.2. Effective Wind Speed Occurrence
The effective wind speed occurrence of the four stations in the Antarctic region was calculated to represent the availability of wind energy resources. To calculate the number of occurrences of 5~25 m/s wind speeds in the 6 h wind field data of the four stations in March 1981, we divided by the total times in March to obtain the availability rate for March 1981. Using the same method, we obtained the availability rates for the four stations in the Antarctic region for every March in the following 40 years, and calculated the average value to obtain the annual average availability rate for March. Using the same method, we obtained the average availability rates for all 12 months. See Figure 5.
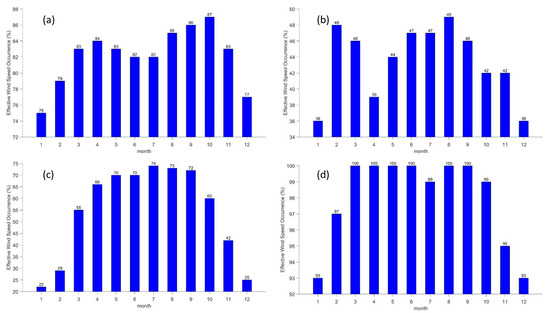
Figure 5.
Monthly variation characteristics of effective wind speeds occurrence at the Antarctic stations. (a–d) refer to Great Wall Station, Zhongshan Station, Kunlun Station and Mount Taishan Station, respectively.
The Great Wall Station’s monthly fluctuations in availability and wind power density are consistent (see Figure 5a). Peak performance occurs in October with an availability rate of 87%, while troughs occur from December to February of the subsequent year with a rate of around 75%. The annual frequency exceeds 80%, making it a promising location for wind energy. Zhongshan Station experiences a peak availability rate from June to August, reaching over 47%, while the trough occurs from December to January of the following year with an availability rate of below 36% (see Figure 5b). Over half of the months throughout the year had a utilization rate of over 45%. The Kunlun Station experiences its peak utilization between May and September, reaching up to 70% (see Figure 5c). The trough period occurs from December to February of the following year, with a utilization rate of around 25%. Over half of the months had a utilization rate higher than 50%, with the majority being between March and October. The peak availability of Taishan Station is consistently high, averaging 100% from March to September (see Figure 5d). The trough period occurs between December and January of the following year, with a utilization rate of around 93%. The annual availability rate exceeds 90%, making Taishan Station an attractive location for wind energy.
3.3. Energy Level Occurrence
Energy level classification is a useful tool for assessing wind energy levels at stations. It is generally believed that a wind power density of above 100 W/m2 is in the available range, while a wind power density of above 200 W/m2 is abundant. According to the statistical analysis, energy level frequencies for each month at the four stations above 100 W/m2 indicate an Available Level Occurrence (ALO), frequencies above 200 W/m2 indicate a Rich Level Occurrence (RLO) and frequencies above 400 W/m2 indicate a Superb Level Occurrence (SLO). These are shown in Figure 6.
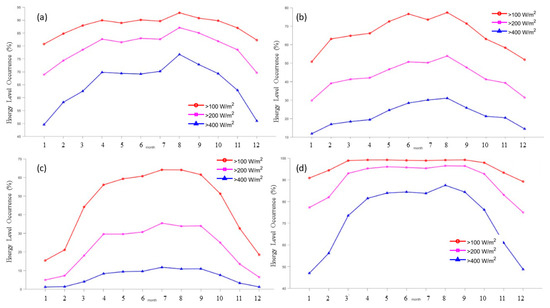
Figure 6.
Monthly variation characteristics of energy level occurrence at the Antarctic stations. (a–d) refer to Great Wall Station, Zhongshan Station, Kunlun Station and Mount Taishan Station, respectively.
The Great Wall Station (Figure 6a) exhibits a bimodal monthly variation characteristic, especially the monthly variation trend of SLO at the Great Wall Station. For the frequency of energy levels above 100 W/m2, the peak was from April to September, with a frequency of around 90%, and the other months are also above 80%. The variation characteristics of RLO and SLO at the Great Wall Station are similar to those of ALO, with lower energy level occurrence values. At Zhongshan Station (Figure 6b), the monthly variation of energy levels exhibits a unimodal pattern, similar to the one observed in the effective wind speed frequency. The peak of energy levels above 100 W/m2 occurs from May to September, with a frequency exceeding 70%, while the other months are above 50%. The annual average frequency was 65%, indicating that the wind energy utilization rate at Zhongshan Station was very high. The frequency variation characteristics of energy levels above 200 W/m2 and 400 W/m2 are similar to those of 100 W/m2, but the values are relatively low. At Kunlun Station (Figure 6c), the monthly energy level variation at the study site shows a circular arc-like pattern, with the highest energy levels occurring between April and September. A sudden increase in energy level occurrence occurs from February to March, with a rise from 20% to 45%. The peak frequency reaches 65%, while the average annual frequency was 45%. The RLO and SLO peaks are consistent with the ALO months, with RLO peaking at only 35% and SLO peaking at only 11%, indicating relatively low values. At Taishan Station (Figure 6d), the frequency of energy levels above 100 W/m2 was as follows: the ALO peak months at Taishan Station are concentrated in March and October, reaching 100% of the energy level occurrence, while the other months are also more than 90% with an annual average frequency of 97%, indicating excellent wind energy availability. The RLO of Taishan Station was consistent with the peak months of ALO, with a frequency of only 95%, and the RLO value for the other months was approximately 80%. The SLO peak frequency of Taishan Station was concentrated in April and September, with a value of about 80%, and values of 50%~60% in other months, indicating that the wind energy resources in March and October are better than those in other months. The peak frequency distribution months of energy levels at each station are shown in Table 3 below.

Table 3.
Peak distribution of energy levels occurrence at Antarctic stations.
3.4. Stability
The coefficient of variation (Cv) is a measure of the stability of wind energy resources, which is crucial for the construction and operation of wind farms. Unstable winds can result in fluctuations in power generation, making it difficult to connect to the grid, while destructive winds can cause facility damage.
As shown in Figure 7, the Great Wall Station coefficient of variation was relatively stable throughout the year, with a peak value of 1.17 occurring from June to August. This indicates that the wind energy resources at the Great Wall Station are unstable. The coefficient of variation of wind energy at Zhongshan Station was above 2 throughout the year, with a maximum value of 2.42 in September, indicating unstable and variable wind energy resources. The coefficient of variation at Kunlun Station shows a clear ‘u’ shape, with values above 1.1 from November to February of the following year and around 0.95 in other months. This suggests that wind energy resources at Kunlun Station are relatively stable from March to October but unstable from November to February, which may not be conducive to development. Taishan Station has the lowest coefficient of variation among the four stations, with a maximum value of only 0.76 in December. This indicates that there are stable wind energy resources, which is beneficial for the development and utilization of wind energy.
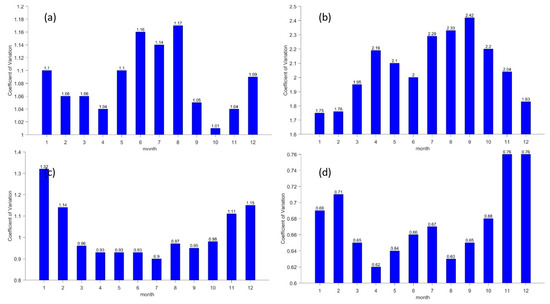
Figure 7.
Monthly variation characteristics of coefficient of variation at Antarctic stations. (a–d) refer to Great Wall Station, Zhongshan Station, Kunlun Station and Mount Taishan Station, respectively.
3.5. Wind Rose
The rose plot of wind energy resources at the Antarctic site was used to determine the dominant wind direction and main sources of energy. As shown in Figure 8, the Great Wall Station’s wind energy rose plot indicates that the dominant wind direction was northwest [30,31,32], accounting for 60% of total energy, with a highest contribution rate of 400~800 W/m2. The wind energy was stronger during winter and spring than summer and autumn. The average annual wind energy was consistent in the spring, with a frequency of 1400 W/m2.
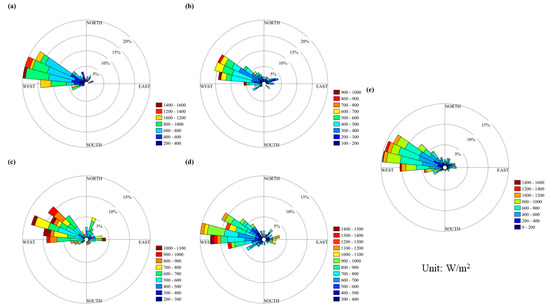
Figure 8.
Wind energy rose graph for the Great Wall Station. (a–e) represent spring, summer, autumn, winter and the entire year.
Figure 9 illustrates the wind energy rose diagram of Zhongshan Station, which shows a more stable wind energy direction towards the east wind with a contribution rate exceeding 90% [30,33,34]. The four seasons’ wind energy rose diagrams are relatively similar, with an average annual wind energy similar to that in spring. Winter was the strongest season for wind energy, with the highest frequency exceeding 400 W/m2. Although Zhongshan Station’s wind energy direction was stable, its intensity was comparatively weaker than that of the Great Wall Station, with the largest contribution rate ranging from 100 to 250 W/m2.
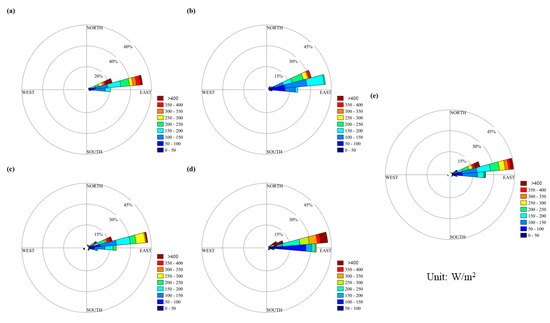
Figure 9.
Wind energy rose graph for the Zhongshan Station. (a–e) represent spring, summer, autumn, winter and the entire year.
The wind energy at Kunlun Station was unstable, as seen in Figure 10. The annual average wind power density exists from northeast to southeast, with the strongest wind energy direction being easterly. The low intensity of the wind energy hinders its development and utilization. The seasonal wind energy rose diagram indicates that the direction of wind energy in spring was relatively stable, while summer was the most unstable and had the weakest wind power density. In winter, the wind energy direction was also unstable, with strong winds mostly occurring in the easterly direction, accounting for 20% of the total wind energy. The wind power density was mostly 100~200 W/m2.
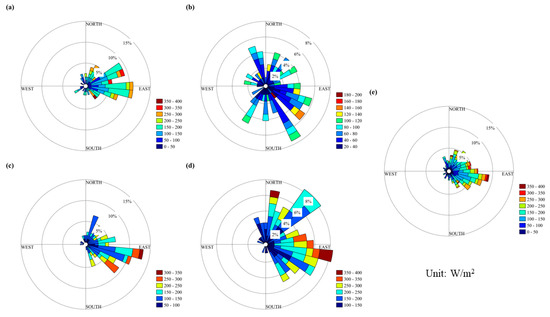
Figure 10.
Wind energy rose graphs for the Kunlun Station. (a–e) represent spring, summer, autumn, winter and the entire year.
Figure 11 illustrates the stability of wind energy at Taishan Station. The average annual wind power density was consistent with northeastern winds, accounting for 100% of the total wind energy. Additionally, Taishan Station has relatively strong wind power density, with a frequency exceeding 1500 W/m2 and a maximum contribution of wind energy ranging from 600 to 1200 W/m2. The dominant wind direction was stable, providing abundant wind energy resources that are conducive to its development and utilization. Wind power generation and other activities can be carried out in this area. However, Taishan Station’s wind energy resources are weakest during summer and strongest during winter and spring.
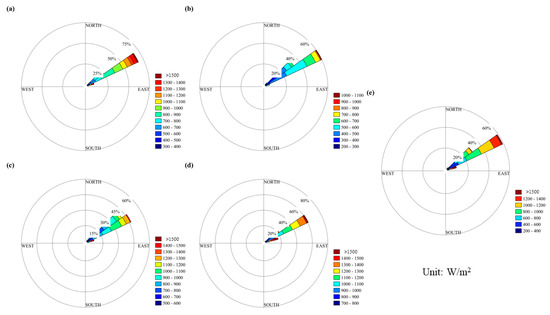
Figure 11.
Wind energy rose graphs for the Taishan Station. (a–e) represent spring, summer, autumn, winter and the entire year.
4. Interdecadal Variation Characteristics of Wind Energy Resources
4.1. Wind Power Density
Figure 12 reveals the annual wind power density variations of the four Antarctic stations over the past 40 years. All four stations show an upward trend, with Taishan Station exhibiting the highest and the most significant growth rate of 2.76 W/m2·yr−1, followed by the Great Wall Station with a growth rate of 1.86 W/m2·yr−1. The wind power densities of Zhongshan Station and Kunlun Station were relatively low, with Kunlun Station showing a weak growth trend of only 0.28 W/m2·yr−1, indicating a limited weak growth potential of wind energy resources.
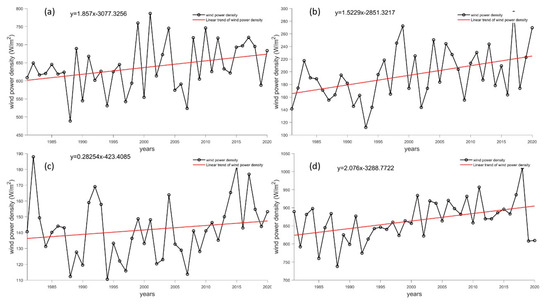
Figure 12.
Long-term trends in wind power density at Antarctic stations (unit: W/m2·yr−1). (a–d) refer to the Great Wall Station, Zhongshan Station, Kunlun Station and Mount Taishan Station, respectively. The black line represents reanalysis data, while the red line represents a linear fitting trend.
4.2. Effective Wind Speed Occurrence
Figure 13 illustrates the station availability trend, with all stations displaying a slight growth rate, with Kunlun Station showing the highest growth rate of only 0.08%/yr. The Great Wall Station has an availability rate range of 76% to 88%, Zhongshan Station was around 43%, and Kunlun Station was between 50% and 60%. Taishan Station has the strongest availability of above 96%, which has reached 100% in some years, indicating that it has relatively abundant wind energy resources in the long term.
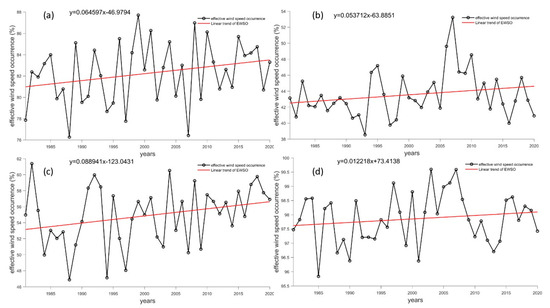
Figure 13.
Long-term trends in effective wind speed occurrence at Antarctic stations (unit: %/yr). (a–d) refer to the Great Wall Station, Zhongshan Station, Kunlun Station and Mount Taishan Station, respectively. The black line represents reanalysis data, while the red line represents a linear fitting trend.
4.3. Energy Level Occurrence
Figure 14 displays the interannual variation of wind energy enrichment at Antarctic sites using RLO as an example. RLO indicates wind power density greater than 200 W/m2. The interannual variation of RLO was consistent with the change in effective wind speed occurrence. The most significant growth trend was at the Great Wall Station, which was 0.12%/yr, while the other three stations are around 0.06%/yr. The wind power density range of the Great Wall Station was 60~76%; Taishan Station has the strongest RLO between 86% and 95%, with a growth rate of 0.07%/yr. Although they grew slowly, wind energy resources are abundant, which is beneficial for their development and utilization. However, Zhongshan Station and Kunlun Station’s RLO growth rates were slow, with RLOs ranging between 15% and 30%. In comparison to Taishan Station, the wind energy levels are relatively poor, which hinders their development.
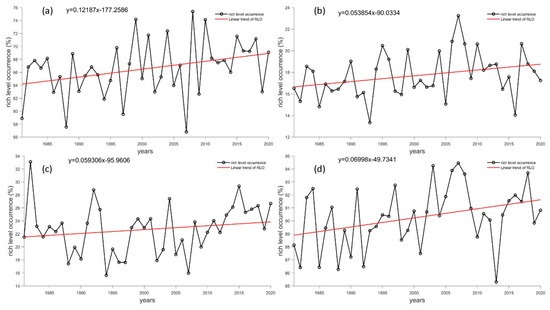
Figure 14.
Long-term trends in RLO at Antarctic stations (unit: %/yr). (a–d) refer to the Great Wall Station, Zhongshan Station, Kunlun Station and Mount Taishan Station, respectively. The black line represents reanalysis data, while the red line represents a linear fitting trend.
4.4. Stability
The coefficient of variation was used to analyze the trend of variation for the four Antarctic stations, as shown in Figure 15. The results revealed that all four stations had small slopes, indicating a stationary trend that was conducive to wind energy stability. However, except for Taishan Station, the average annual variation coefficient of the other stations was above 1, indicating that there was unstable wind energy. Zhongshan Station had the largest variation coefficient, which reached 2.5. This large variation coefficient is not beneficial for the development of wind energy.
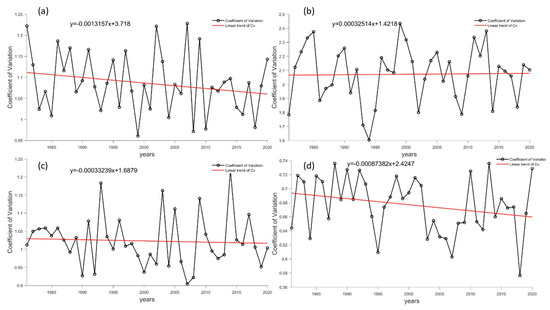
Figure 15.
Long-term trends in Cv at Antarctic stations. (a–d) refer to the Great Wall Station, Zhongshan Station, Kunlun Station and Mount Taishan Station, respectively. The black line represents reanalysis data, while the red line represents a linear fitting trend.
Figure 16 displays the monthly variation coefficient of the Antarctic stations, which differs from the coefficient used to describe overall wind energy stability. This coefficient characterizes the monthly variability of wind power density within a year. The higher the coefficient, the greater the difference in wind power density within a year. Figure 17 illustrates the seasonal variation index, which describes seasonal variability of wind power density within a year. The larger the coefficient, the more pronounced the seasonal variation. The change trends of both coefficients at each station are similar, with the exception of the Kunlun and Taishan stations, which display positive trends. However, Kunlun Station’s stability coefficient was relatively high, indicating that its wind energy resources are not conducive to development. Zhongshan Station had significant changes in Mv and Sv values, indicating that there is potential for exploitation and utilization of wind energy resources. The Great Wall and Taishan stations exhibit static trends, with small stability coefficient values, promoting the development of wind energy resources.
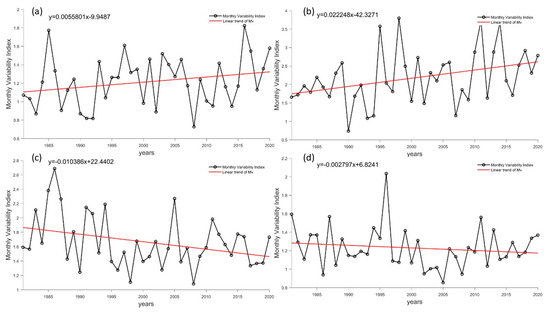
Figure 16.
Long-term trends in Mv at Antarctic stations. (a–d) refer to the Great Wall Station, Zhongshan Station, Kunlun Station and Mount Taishan Station, respectively. The black line represents reanalysis data, while the red line represents a linear fitting trend.
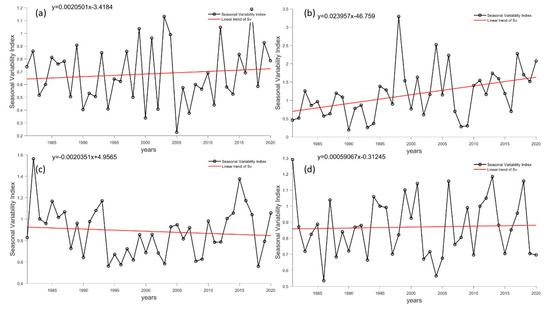
Figure 17.
Long-term trends in Sv at Antarctic stations. (a–d) refer to the Great Wall Station, Zhongshan Station, Kunlun Station and Mount Taishan Station, respectively. The black line represents reanalysis data, while the red line represents a linear fitting trend.
5. Discussion
(1) The monthly variation of wind power density at Antarctic stations is significant, with August being the most abundant month and January being the leanest. The Great Wall Station and Taishan Station had the highest wind power densities, followed by Zhongshan Station and Kunlun Station. The availability of wind energy varies among the four stations, with Taishan Station having the best availability and Kunlun Station having the worst. The dominant months for wind power density are from April to October, while March to October is the dominant energy level occurrence period for all four stations. The Great Wall Station and Taishan Station had better energy level frequencies than Zhongshan Station and Kunlun Station. The variation coefficients of Taishan Station and the Great Wall Station are below 1, indicating that there is stable wind energy development, whereas the variation coefficient of Zhongshan Station is above 1, indicating violent changes in wind energy that are not conducive to its development and utilization.
(2) The wind energy at the Great Wall Station is mainly derived from northwest winds with stable directions. Winter and spring had higher wind power densities, while summer has the lowest. Zhongshan Station’s dominant wind direction is easterly, with a wind power density of 100~200 W/m2. The highest wind power density occurs in winter and spring, while the lowest is in summer. Kunlun Station’s wind energy direction varies, especially in summer, which may not be ideal for its development and utilization. The wind power density is concentrated between 100~200 W/m2, and its degree of utilization is not significant. Taishan Station’s fixed northeast wind energy direction has a large wind power density of 800 W/m2, accounting for over 80% of its total energy output, making it conducive to wind energy development.
(3) In the annual variation of wind power density, Taishan Station has the dominant trend, increasing year by year with a relatively strong average wind power density. The Great Wall Station and Zhongshan Station follow, while Kunlun Station’s trend is the weakest. Availability has the strongest increase trend at Kunlun Station, followed by the Great Wall Station and Zhongshan Station, with Taishan Station showing stable change. However, the Kunlun Station and Great Wall Station had high dispersion, which hinders their wind energy exploitation. The most significant growth in RLO is at the Great Wall Station, while the other three stations show consistent trends. Taishan Station has the strongest RLO, with an increasing trend and a value of about 90%. Zhongshan Station shows decreasing stability, as its value is less than 1. The monthly and seasonal change indices are lowest among the four stations, indicating a decreasing or static trend. Therefore, Taishan Station has the most stable wind energy, followed by Kunlun Station and the Great Wall Station, and Zhongshan Station has the worst stability.
6. Conclusions
This article employs ERA5 reanalysis data to scrutinize the wind energy attributes of four Antarctic stations, which encompass monthly variability, long-term trends, wind power density, effective wind speed occurrence, energy level occurrence, stability and wind energy rose diagrams.
Taishan Station has the highest wind power density (860 W/m2), effective wind speed occurrence (98%) and energy level occurrence (ALO:98%; MLO:80%; RLO:70%) among the four Antarctic stations. Its wind energy direction is stable and has the lowest coefficient of variation (below 0.76). In the long term, Taishan Station’s wind power density, availability and energy level occurrence show a positive trend and are the strongest among the four stations. The coefficient of variation, monthly variation index, seasonal variation index and other indexes also show a decreasing trend and relatively small values, which promotes the stability of wind energy. In contrast, Zhongshan and Kunlun Station are the poorest stations, their wind power density (Zhongshan: 200 W/m2; Kunlun: 140 W/m2), effective wind speed occurrence (Zhongshan: 44%; Kunlun: 55%), and energy level occurrence are all poor. Almost all sites had advantage months from April to September, while Mountain Tai has advantage months from March to October. Therefore, Taishan Station dominates the wind energy of the four Antarctic stations, followed by Great Wall Station, Zhongshan Station and Kunlun Station. In the future, China’s scientific research stations in Antarctica could participate in the development of clean energy to generate electricity. Using a combination of solar and wind energy to generate electricity can not only maximize environmental protection, but also achieve efficient use of clean energy and alleviate energy problems.
Author Contributions
K.W. (Kaishan Wang), D.W., J.W. and Y.Y. contributed equally to this study. They are the co-first authors. Conceptualization, C.Z., J.W. and D.W.; methodology, Y.Y., S.L. and K.W. (Kaishan Wang); software, Y.Y. and K.W. (Kaishan Wang); formal analysis, K.W. (Kaishan Wang); investigation, K.W. (Kaishan Wang); resources, C.Z., D.W., X.Z. and J.W.; writing—original draft preparation, K.W. (Kaishan Wang); writing—review and editing, K.W. (Kaishan Wang) and K.W. (Kai Wu); supervision, C.Z. and D.W.; project administration, C.Z. and D.W.; funding acquisition, C.Z. and D.W. All authors have read and agreed to the published version of the manuscript.
Funding
This research was funded by the open fund project of Shandong Provincial Key Laboratory of Ocean Engineering, Ocean University of China, grant number kloe201901. This research was funded by the project of “Doctoralization for Master Education” of Marine Resources and Environment Research Group on the Maritime Silk Road.
Institutional Review Board Statement
Not applicable.
Informed Consent Statement
Not applicable.
Data Availability Statement
The data presented in this study are openly available in ECMWF ERA5 at doi:10.24381/cds.adbb2d47, reference number Hersbach, H., Bell, B., Berrisford, P., Biavati, G., Horányi, A., Muñoz Sabater, J., Nicolas, J., Peubey, C., Radu, R., Rozum, I., Schepers, D., Simmons, A., Soci, C., Dee, D., Thépaut, J.-N. (2023): ERA5 hourly data on single levels from 1940 to present. Copernicus Climate Change Service (C3S) Climate Data Store (CDS), DOI:10.24381/cds.adbb2d47. Website: https://cds.climate.copernicus.eu/cdsapp#!/dataset/reanalysis-era5-single-levels?tab=form.
Acknowledgments
The authors would also like to thank the ECMWF for providing the wind data.
Conflicts of Interest
The authors declare no conflict of interest.
References
- Conti, J. In Search of the Zero-Emission Continent. Eng. Technol. 2009, 4, 46–49. [Google Scholar] [CrossRef]
- Lucci, J.; Alegre, M.; Vigna, L. Renewables in Antarctica: An Assessment of Progress to Decarbonize the Energy Matrix of Research Facilities. Antarct. Sci. 2022, 34, 374–388. [Google Scholar] [CrossRef]
- Güğül, G. Site Selection of the Antarctic Research Stations in Aspect of Required Optimum Hybrid Renewable System Capacity. Int. J. Energy Stud. 2023, 8, 215–235. [Google Scholar] [CrossRef]
- Romanova, N.; Romanov, P. Antarctic wind intensification as inferred from the NCEP/NCAR reanalysis data. J. Oceanol. Res. 2020, 48, 96–108. [Google Scholar] [CrossRef] [PubMed]
- Zhang, L.; Dou, Y. Study of Wind-Solar Complementary Power System in Zhongshan Station of Antarctic. IOP Conf. Ser. Mater. Sci. Eng. 2019, 631, 042016. [Google Scholar] [CrossRef]
- Guichard, A.; Magill, P.; Godon, P.; Lyons, D.; Brown, C. Potential for significant wind power generation at Antarctic stations. In Proceedings of the Seventh Symposium on Antarctic and Logistics Operations (SCALOP), Cambridge, UK, 6–7 August 1996. [Google Scholar]
- Henryson, M.; Svensson, M. Renewable Power for the Swedish Antarctic Station Wasa; U.S. Department of Energy Office of Scientific and Technical Information: Oak Ridge, TN, USA, 2023.
- Petrenko, K.; Ivanchenko, І.; Karmazin, O. Prospects for the Use of Wind Energy Resources at the Akademik Vernadsky Station. Ukr. Antarct. J. 2021, 2, 117–126. [Google Scholar] [CrossRef]
- Boccaletti, C.; Felice, P.; Santini, E. Designing Wind Plants for Extreme Ambient Conditions. In Proceedings of the XIX International Conference on Electrical Machines-ICEM 2010, Rome, Italy, 6–8 September 2010. [Google Scholar]
- Dou, Y.; Zuo, G.; Chang, X.; Chen, Y. A Study of a Standalone Renewable Energy System of the Chinese Zhongshan Station in Antarctica. Appl. Sci. 2019, 9, 1968. [Google Scholar] [CrossRef]
- Messmer, T.; Ran, X.; Benifla, V.; Lutz, M.; Adam, F.; Bachynski-Polić, E.; Hölling, M. Overview of the Potential of Floating Wind in Europe Based on Met-Ocean Data Derived from the ERA5-Dataset. J. Phys. Conf. Ser. 2023, 2626, 012021. [Google Scholar] [CrossRef]
- Yu, Y.; Wang, Y.-T.; Yang, R.-P.; Li, C.-X.; Liu, H.-Y.; Wei, D.-J.; Li, W. Wind Climate Analysis in the Yellow Sea and Bohai Sea Based on ERA5 Reanalysis Data. In Environmental Pollution Governance and Ecological Remediation Technology; Springer: Berlin/Heidelberg, Germany, 2023; pp. 65–77. ISBN 978-3-031-25283-9. [Google Scholar]
- McErlich, C.; McDonald, A.; Renwick, J.; Schuddeboom, A. An Assessment of Southern Hemisphere Extratropical Cyclones in ERA5 Using WindSat. J. Geophys. Res. Atmos. 2023, 128. [Google Scholar] [CrossRef]
- Zhai, R.; Huang, C.; Yang, W.; Tang, L.; Zhang, W. Applicability Evaluation of ERA5 Wind and Wave Reanalysis Data in the South China Sea. J. Oceanol. Limnol. 2023, 41, 495–517. [Google Scholar] [CrossRef]
- Cavaiola, M.; Tuju, P.E.; Ferrari, F.; Casciaro, G.; Mazzino, A. Ensemble Machine Learning Greatly Improves ERA5 Skills for Wind Energy Applications. Energy AI 2023, 13, 100269. [Google Scholar] [CrossRef]
- Dai, A. The Diurnal Cycle from Observations and ERA5 in Surface Pressure, Temperature, Humidity, and Winds. Clim. Dyn. 2023, 61, 2965–2990. [Google Scholar] [CrossRef]
- Deng, X.; He, D.; Zhang, G.; Zhu, S.; Dai, R.; Jin, X.; Fu, W.; Shen, W.; Chen, J.; Fan, Y.; et al. Comparison of Horizontal Wind Observed by Wind Profiler Radars with ERA5 Reanalysis Data in Anhui, China. Theor. Appl. Climatol. 2022, 150, 1745–1760. [Google Scholar] [CrossRef]
- Gualtieri, G. Reliability of ERA5 Reanalysis Data for Wind Resource Assessment: A Comparison against Tall Towers. Energies 2021, 14, 4169. [Google Scholar] [CrossRef]
- Jiang, Y.; Han, S.; Shi, C.; Gao, T.; Zhen, H.; Liu, X. Evaluation of HRCLDAS and ERA5 Datasets for Near-Surface Wind over Hainan Island and South China Sea. Atmosphere 2021, 12, 766. [Google Scholar] [CrossRef]
- Çalışır, E.; Soran, M.; Akpinar, A. Quality of the ERA5 and CFSR Winds and Their Contribution to Wave Modelling Performance in a Semi-Closed Sea. J. Oper. Oceanogr. 2021, 16, 106–130. [Google Scholar] [CrossRef]
- Molina, M.O.; Gutiérrez, C.; Sanchez, E. Comparison of ERA5 Surface Wind Speed Climatologies over Europe with Observations from the HadISD Dataset. Int. J. Climatol. 2021, 41, 4864–4878. [Google Scholar] [CrossRef]
- Olauson, J. ERA5: The New Champion of Wind Power Modelling? Renew. Energy 2018, 126, 322–331. [Google Scholar] [CrossRef]
- Herrmannsdörfer, L.; Müller, M.; Shupe, M.; Rostosky, P. Surface Temperature Comparison of the Arctic Winter MOSAiC Observations, ERA5 Reanalysis, and MODIS Satellite Retrieval. Elem. Sci. Anthr. 2023, 11, 1–17. [Google Scholar] [CrossRef]
- Wang, C.; Graham, R.; Wang, K.; Gerland, S.; Granskog, M. Comparison of ERA5 and ERA-Interim near Surface Air Temperature, Snowfall and Precipitation over Arctic Sea Ice: Effects on Sea Ice Thermodynamics and Evolution. Cryosphere 2019, 13, 1661–1679. [Google Scholar] [CrossRef]
- Yu, C.; Li, Z.; Blewitt, G. Global Comparisons of ERA5 and the Operational HRES Tropospheric Delay and Water Vapor Products with GPS and MODIS. Earth Space Sci. 2021, 8, e2020EA001417. [Google Scholar] [CrossRef]
- Kanwal, A.; Tahir, Z.R.; Asim, M.; Hayat, N.; Farooq, M.; Abdullah, M.; Azhar, M. Evaluation of Reanalysis and Analysis Datasets against Measured Wind Data for Wind Resource Assessment. Energy Environ. 2022, 34, 1258–1284. [Google Scholar] [CrossRef]
- Tahir, Z.R.; Abdullah, M.; Ahmad, S.; Kanwal, A.; Farhan, M.; Saeed, U.B.; Ali, T.; Amin, I. An Approach to Assess Offshore Wind Power Potential Using Bathymetry and Near-Hub-Height Reanalysis Data. Ocean. Eng. 2023, 280, 114458. [Google Scholar] [CrossRef]
- Hersbach, H.; Bell, B.; Berrisford, P.; Hirahara, S.; Horányi, A.; Muñoz-Sabater, J.; Nicolas, J.; Peubey, C.; Radu, R.; Schepers, D.; et al. The ERA5 Global Reanalysis. Q. J. R. Meteorol. Soc. 2020, 146, 1999–2049. [Google Scholar] [CrossRef]
- Zheng, C.W. Temporal-spatial characteristics dataset of offshore wind energy resource for the 21st Century Maritime Silk Road. China Sci. Data 2020, 5, 106–119. [Google Scholar]
- Bian, L.; Ma, Y.; Lu, C.; Lu, L. Climate characteristics of precipitation and wind as well pressure and cloud amount at the great wall station (1985–2008) and zhongshan station (1989–2008), Antarctic. Adv. Polar Sci. 2010, 22, 321–333. [Google Scholar] [CrossRef]
- Ma, Q.; Wang, Y.; Zhang, C.; He, Y.; Guo, G. Analysis of the characteristics of temperature, wind, and precipitation changes at the Great Wall Station in Antarctica. J. Shaanxi Meteorol. 2016, 25–28. [Google Scholar]
- Huang, Y.; Xu, C.; Yin, T.; Zhang, H. Analysis of pressure and Windd field at great wall station, Ant-Arctic. Adv. Polar Sci. 2000, 129–136. [Google Scholar]
- Sun, Q.; Zhang, L.; Zhang, Z.; Yang, Q. Numerical Simulation of Summer Katabatic Wind at Zhongshan Station, Antarctica: A Case Study. Acta Oceanologica Sinica. 2016, 38, 71–81. [Google Scholar] [CrossRef]
- Ma, Y.; Bian, L.; Xiao, C.; Allison, I.; Zhou, X. Near Surface Climate of the Traverse Route from Zhongshan Station to Dome A, East Antarctica. Antarct. Sci. 2010, 22, 443–459. [Google Scholar] [CrossRef]
Disclaimer/Publisher’s Note: The statements, opinions and data contained in all publications are solely those of the individual author(s) and contributor(s) and not of MDPI and/or the editor(s). MDPI and/or the editor(s) disclaim responsibility for any injury to people or property resulting from any ideas, methods, instructions or products referred to in the content. |
© 2023 by the authors. Licensee MDPI, Basel, Switzerland. This article is an open access article distributed under the terms and conditions of the Creative Commons Attribution (CC BY) license (https://creativecommons.org/licenses/by/4.0/).