Article

Diagnosis of Warm-Sector Heavy Rainfall with Warm Shear in the Yangtze–Huaihe Coastal Areas from the Perspective of Moist Static Energy

Key Laboratory of Meteorology Disaster (Ministry of Education (KLME))/Joint International Research Laboratory of Climate and Environment Change (ILCEC), Collaborative Innovation Center on Forecast and Evaluation of Meteorological Disasters (CIC-FEMD), Nanjing University of Information Science and Technology, Nanjing 210044, China
*
Author to whom correspondence should be addressed.
Atmosphere 2023, 14(12), 1730; https://doi.org/10.3390/atmos14121730
Submission received: 22 October 2023 / Revised: 23 November 2023 / Accepted: 23 November 2023 / Published: 24 November 2023
(This article belongs to the Section Meteorology)

Abstract

:
Based on the Climate Precipitation Center Morphing (CMORPH) precipitation data and the fifth-generation ECMWF reanalysis (ERA5) data, moist static energy (MSE) diagnosis for 14 cases of southerly warm-sector heavy rainfall with warm shear (WSWR) along the Yangtze-Huaihe coastal area (YHCA) was conducted. The results indicate that the vertically integrated MSE tendency peaks before the precipitation reaches its maximum. This suggests a rapid MSE accumulation leading up to precipitation onset, with moist enthalpy advection dominantly influencing this increase. The vertical advection of MSE is negative, suggesting that upward motions and rainfall play a crucial role in consuming MSE. Vertical integrated MSE budget analysis for the nine cases of nocturnal rain shows that moist enthalpy advection was the primary contributor, driven mainly by meridional latent energy advection. Scale analysis shows that the combination of meridional disturbance wind and the mean specific humidity field results in pronounced meridional latent energy advection. For the five cases of non-nocturnal rain, the net energy flux was dominant before the onset of precipitation, primarily driven by clear-sky net shortwave radiation (SWCS). The meridional internal energy advection also makes a substantial contribution. The scale analysis indicates that the combined effects of the meridional disturbance wind and the average temperature field lead to significant meridional internal energy advection.

1. Introduction

Warm-sector heavy rainfall (WR) was first proposed in China by Huang in 1986 [1]. This type of rainfall occurs in the warm sector, approximately 200–300 km away from the surface front, and is not influenced by cold air. It is characterized by its intense and focused precipitation within a limited regional expanse. According to the definition, it is evident that WR occurs under weak synoptic disturbances, as it is different from front-heavy rainfall, which is associated with strong synoptic-scale forcing. Due to these characteristics, current numerical models have lower accuracy in forecasting such precipitation systems [2,3,4,5].
As our understanding of WR deepens, the mechanism of its formation and development has attracted widespread attention [6,7,8,9,10,11,12,13]. Zhang et al. (2022) found that a warm moist tongue characterized by θ s e together with a low-level jet and convergence can be a precursor signal to WR in southern China [2]. Du and Chen (2019) revealed that the coupling between the boundary layer jet and low-level jet (LLJ) plays a crucial role in the convection of WR [14]. Wu et al. (2021) compared the frontal heavy rainfall to WR in South China and highlighted that due to the convergence of nocturnal LLJ and land breezes, WR shows diurnal variation with a surge in the early morning [15]. Furthermore, Du et al. (2020) investigated the impact of terrain, coastline, and cold pools on the convection of WR and found that the convergence of coastline and terrain-induced lifting and cold pools all contribute to initiating WR convection [13]. However, the majority of these studies focused on dynamic mechanism analysis, and very little research has been conducted on WR from the perspective of energy.
MSE illustrates the primary energy processes within the atmosphere, providing insights into the onset and evolution of rainfall through the lens of energy conservation and transformation [16,17,18,19,20,21,22,23,24,25]. Prive and Plumb (2007) pointed out that the maximum value of low-level MSE can serve as a precursor for the onset of monsoon rainfall [26]. To address the problem of being unable to decompose diabatic heating, researchers introduced the diagnosis of the MSE budget. This method can distinguish the role of moist enthalpy advection and vertical moisture advection, as well as the relative contributions of radiative and heat flux processes within the atmospheric column, which offers significant advantages over the traditional thermodynamics analysis method [27,28,29,30]. By applying the MSE budget, Chen and Bordoni (2014) discovered that the dynamic processes of the Tibetan Plateau have an impact on the East Asian summer monsoon (EASM) [31]. Yao et al. (2017) employed the MSE budget diagnosis to comprehend the mechanisms while simulating the EASM rain belt [32].
Most studies have focused on applying the MSE budget in relation to monsoons [16,20]. Yet, few studies have discussed the relationship between the MSE budget and WSWR. The purpose of this paper is to reveal the connection between WSWR and the MSE budget. We intend to address the following questions: (1) What are the characteristics of the vertical integrated MSE tendency before the onset of precipitation? (2) Which term within the MSE budget dominates during the onset of precipitation? (3) How do energy exchanges differ between nighttime and daytime rainfall events? The paper is organized as follows: The data and method are explained in Section 2. The role of MSE tendency is analyzed in Section 3, and the MSE budget is then studied in Section 4. Section 5 follows with a summary and discussion.

2. Materials and Methods

The CMORPH data use motion vectors from geostationary satellite infrared data to propagate precipitation estimates from passive microwave satellite scans. This method adjusts the shape and intensity of precipitation between microwave scans using a time-weighted linear interpolation [33]. For this paper, the China Meteorological Administration’s National Meteorology Information Center provided hourly precipitation data with 0.1° × 0.1° resolution. These data are combined using over 30,000 automatic weather stations across China and the CMORPH precipitation product [34]. The hourly three-dimensional wind, temperature, specific humidity, and radiation data were sourced from the 0.25° × 0.25° resolution ERA5 reanalysis datasets, provided by the European Center for Medium-Range Weather Forecasts [35].
In this study, the MSE budget was employed for diagnosis analysis. It contains both the thermodynamics equations and the water vapor equations [27]. The MSE is defined as
h = L v q + C p T + Φ ,
where Φ is the geopotential, L v is the latent heat of condensation, q is the specific humidity, C p is the specific heat at constant pressure, and T is the temperature. The moist enthalpy is
E = L v q + C p T ,
where L v q refers to latent heat energy and C p T is internal energy. The net energy flux within each atmospheric column is
F n e t = S t S t S s + S s R t + R s R s + SH + LH ,
where S and R are shortwave radiation and longwave radiation, respectively; subscript t stands for the top of the atmosphere; subscript s represents the surface; and the superscript arrow represents the direction of radiation. The sum of the first seven terms on the right is termed the “radiative flux”. SH is the sensitive heat flux, and LH is the latent heat flux. The three longwave radiation fluxes can be combined into the net longwave radiation flux, which can further be decomposed into clear-sky net longwave radiation (LWCS) and cloud net longwave radiation (LWCL). Similarly, the four shortwave radiation fluxes can be combined into the net shortwave radiation flux, which can further be decomposed into clear-sky net shortwave radiation (SWCS) and cloud net shortwave radiation (SWCL). The vertically integrated MSE equation is defined as
h t = F n e t V · E ω h p + Resi ,
where <> = 1 g P s P t d p refers to vertical integration, and − V · E is the moist enthalpy horizontal advection, which can be broken down into temperature advection and humidity advection and further divided into zonal and meridional components.
V · E = V · T V · q = u · T x v · T y u · q x v · q y
Further, ω h p is the vertical advection of MSE, and Resi is the residual. When h t > 0, it indicates an increase in MSE, and vice versa. A positive value of F n e t indicates that the energy entering the atmospheric column exceeds the energy departing, a condition favorable for precipitation. A positive value of horizontal moist enthalpy indicates that there is warm and humid air. When WR begins, the atmospheric stratification is usually unstable, implying that h p is greater than 0. Therefore, if ω h p is positive, then ω < 0, indicating vertical upward movement.
To analyze the impact of disturbances on precipitation, the wind field V, the specific humidity q, and the temperature field T can be decomposed into their mean and disturbance components. The mean is derived from averaging across longitude, while the disturbance is calculated by subtracting the mean field from the original field.
V = V ¯ + V
q = q ¯ + q
T = T ¯ + T

3. The WSWR Selection Criteria and Climatology Characteristics

The selection criteria for WSWR below were employed in this study based on the concept of WR [1] and the shear line [36,37,38]:
(1)
Based on the JTWC path, precipitation within a 500 km radius of the typhoon’s center must be excluded.
(2)
A mesoscale rainstorm is defined as a Continuous Rainfall Area (CRA) in which the average rainfall goes beyond 5 mm/h and peaks above 20 mm/h. Additionally, the CRA’s long axis spans more than 100 km. Spatial attribute analysis is used to determine the axis length and geometric center of the CRA [39].
(3)
The definition of a front is based on a pronounced gradient of equivalent potential temperature at 850 hPa within the region of 20°–40° N and 110°–130° E (Fu et al., 2020; Zhang et al., 2022). If there is a low-level front within 28°–40° N and 110°–130° E, then the CRA should occur above 200 km from the front. If not, the CRA should be influenced by low-level southerlies, with no surface northerlies within 100 km of the CRA.
(4)
A shear line is present and the minimum distance from the shear line to CRA is between 100 and 300 km. Within the region of 28°–40° N and 110°–130° E, the shear line is characterized by the meridional shear of the zonal wind (zu/zy < 0) and the relative vorticity at 850 (ζ > 0).
Nocturnal rainfall is defined as occurring from 20:00 to 08:00 (LST). Therefore, the WSWR cases over Yangtze–Huaihe coastal areas in the context of southerly winds were investigated (Table 1). Our study includes nine instances of nocturnal rainfall and five instances of non-nocturnal rainfall.
Based on the selection criteria, the accumulated precipitation rainfall and environmental background were further investigated (Figure 1). Within YHRA, two distinct rainfall centers emerged. The first center is located around Hangzhou Bay, while the second is positioned along the coastline near the Jiangsu province. From the environmental field, we can see (Figure 1b) that the subtropical high indicated by 5880 gpm contours of geopotential height is located in the East China Sea. Additionally, there is a trough at the 850 hPa level near the South China Sea. The southerly winds bring abundant moisture. One flow is along the periphery of the subtropical high and another originates from the East China Sea, with both moist pathways converging near the YHCA. To the north of the YHCA, there exists a shear line, aligning with our definition of WSWR, indicating that these WSWR events are not directly affected by the synoptic systems. A robust boundary layer jet flows north–south along the YHCA, with its core exceeding speeds of 10 m/s. The precipitation has a close relationship with the boundary layer jet and coastline; however, this is not the primary focus of this paper.

4. MSE Diagnosis

4.1. Vertical Integrated MSE Tendency Diagnosis

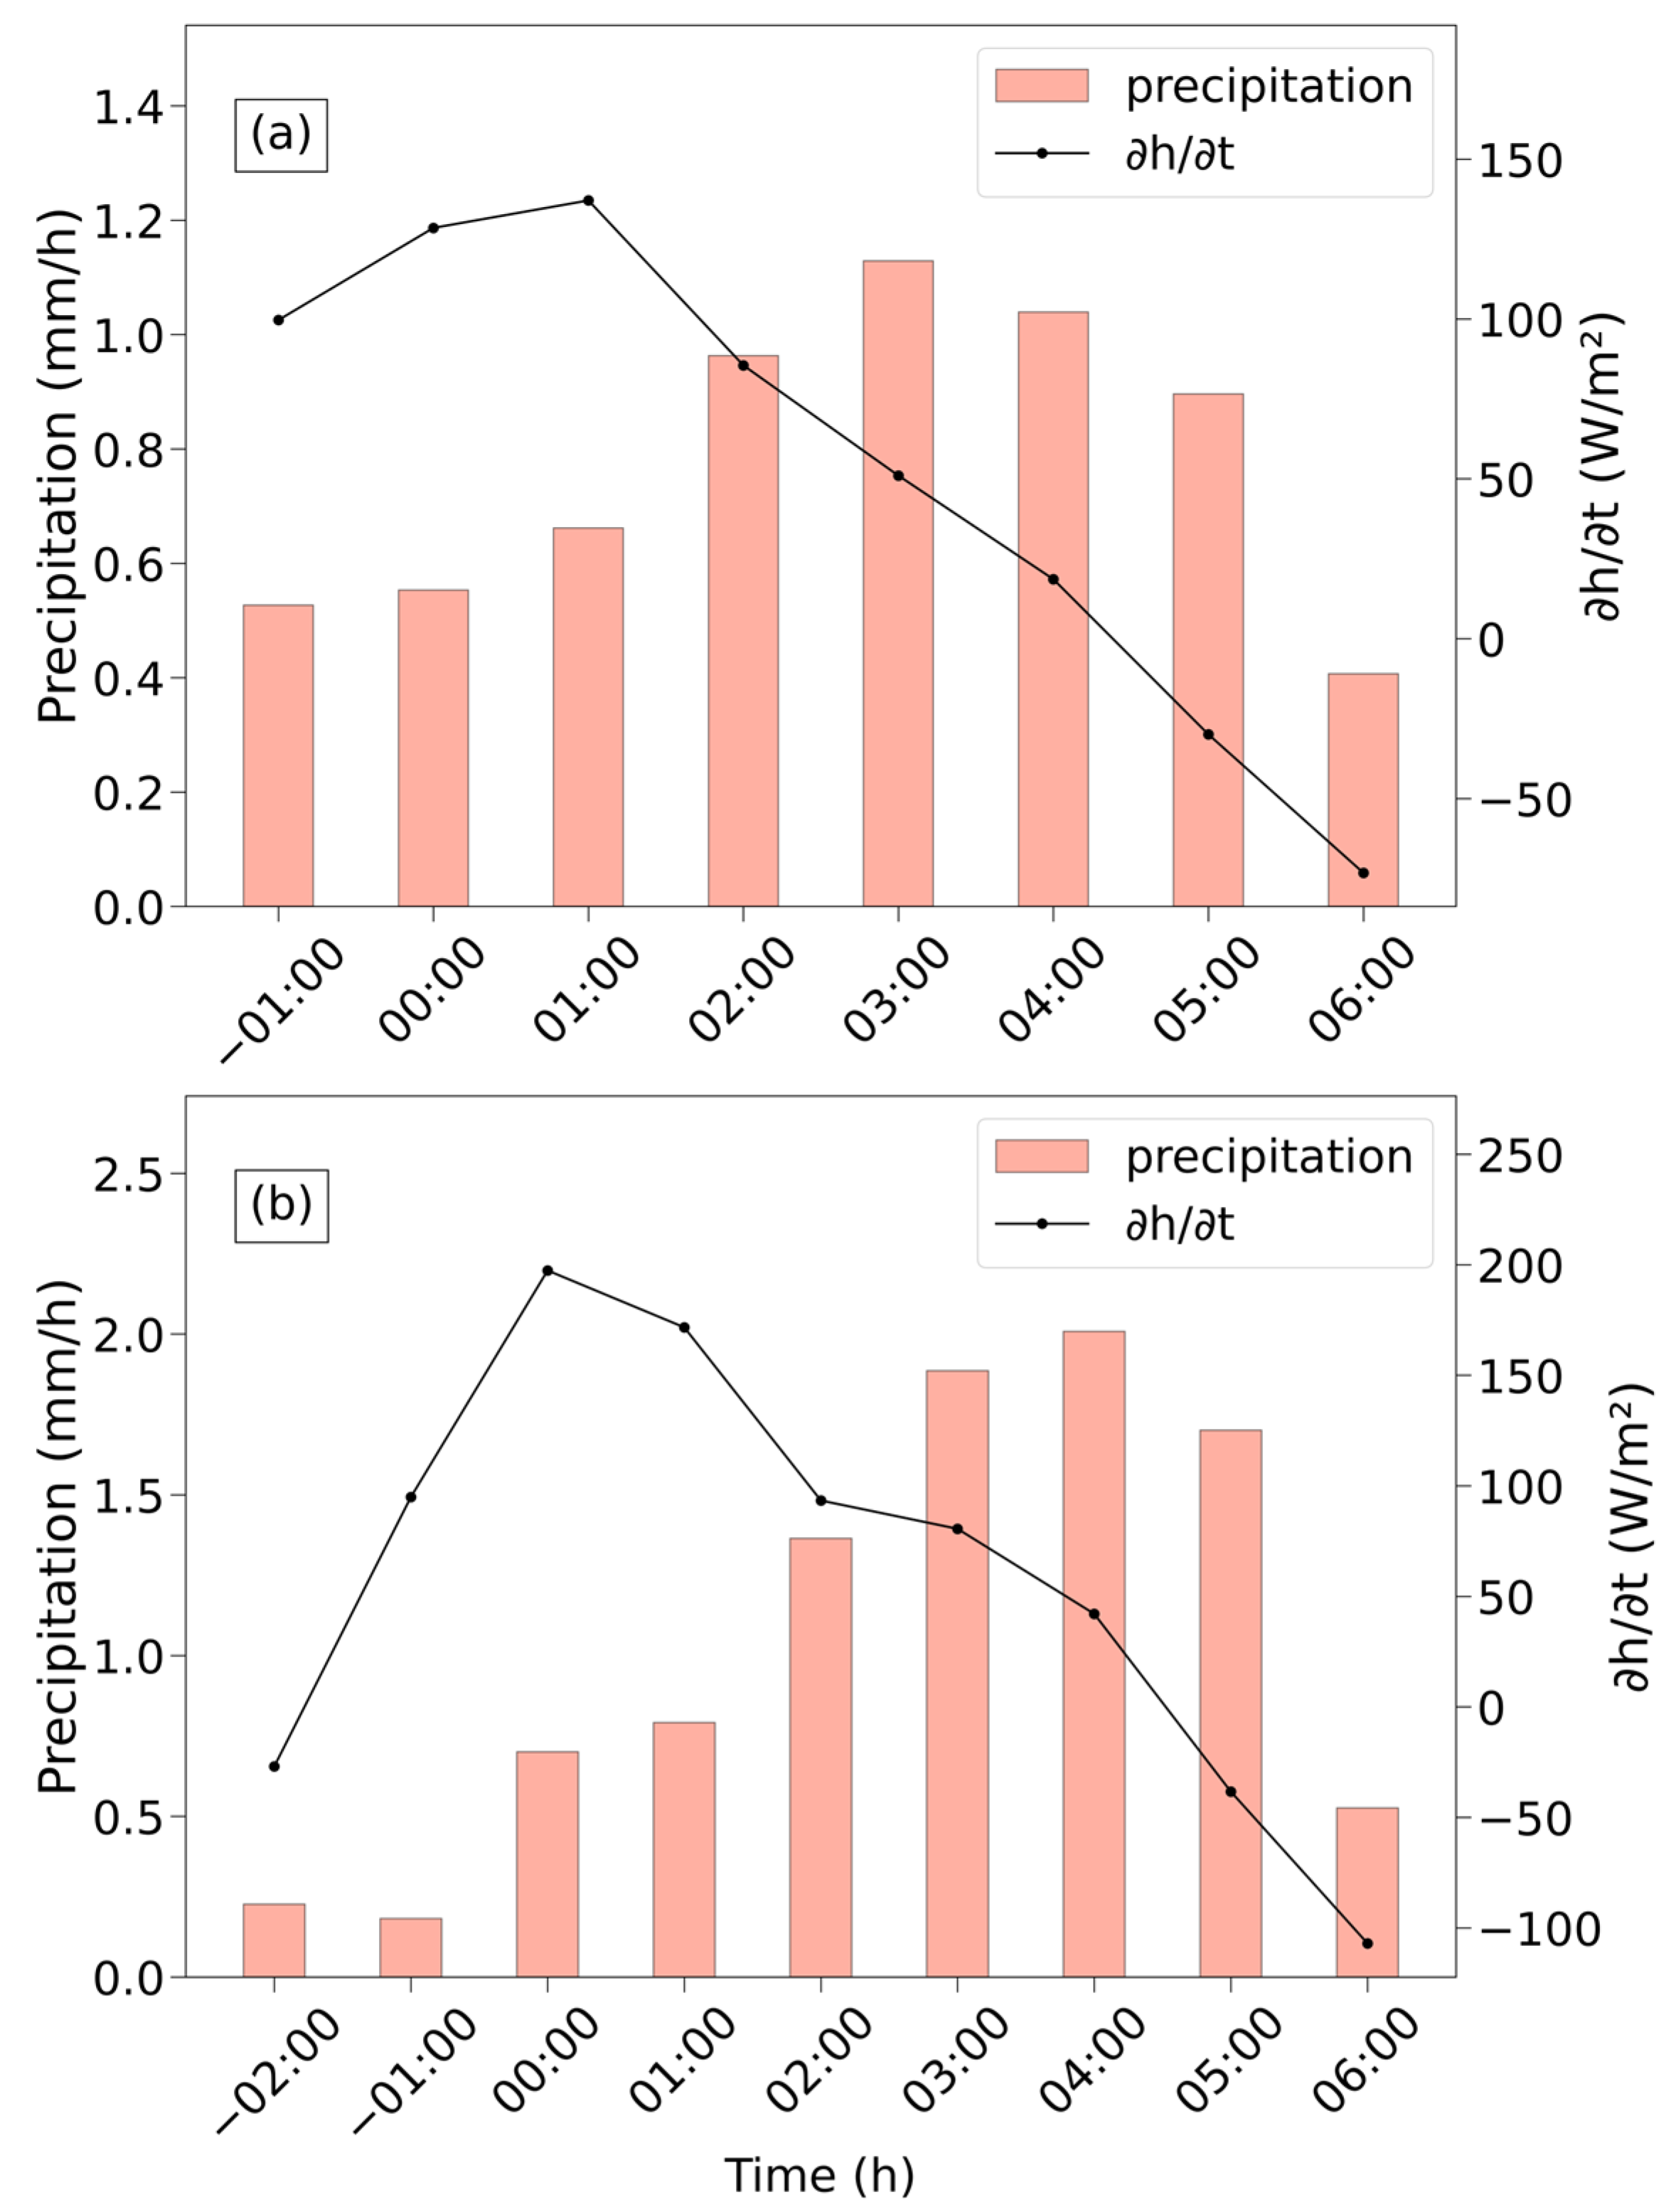
Precipitation is intricately connected to thermodynamic processes. The onset of precipitation is typically triggered by a swift accumulation of energy [16]. To fully comprehend the energy linked with WSWR, the vertical integrated MSE tendency was further analyzed. The area-averages of the integrated MSE tendency and precipitation were investigated both in the YHCA and in Hangzhou Bay. Within the YHCA (Figure 2a), precipitation exhibits a maximum at three hours after the onset, reaching 1.1 mm/h, subsequently indicating a decline. The vertical integrated MSE tendency increases from an hour prior to the onset, starting from an initial 90 W/m². This tendency peaks at 140 W/m², two hours before the peak of precipitation, then undergoes a sharp decrease, bottoming out at −75 W/m² six hours after the onset of WSWR.
In our study, Yangzhou Bay (Figure 2b), identified as one of the distinct rainfall centers (Figure 1a), manifested a pattern consistent with that in our research for the YHCA. Within this domain, a progressive rise in precipitation was observed from an initial rate of approximately 0.3 mm/h, peaking at around 2 mm/h before subsequently declining. The vertical integrated MSE tendency shows a similar trend. It starts from −27 W/m² and soars to its peak at 197 W/m², followed by a downward trend to −107 W/m² six hours after the onset. Interestingly, the peak of the vertical integrated MSE tendency occurs four hours before the maximum precipitation.
For both the YHCA and Hangzhou Bay, we observed that the vertical integrated MSE tendency peaks before the maximum precipitation and then diminishes as the rainfall continues. Consequently, our findings suggest that before the initiation of WSWR events, there is a notable and rapid accumulation of MSE. This accumulated energy appears to play a pivotal role, not only in triggering the precipitation but also in sustaining it over a duration. The appearance, maintenance, and retreat of the WSWR is a process of energy accumulation, replenishment, and release. The relationship between the vertical integrated MSE tendency and precipitation highlights the significance of thermodynamic processes in the context of WSWR events.
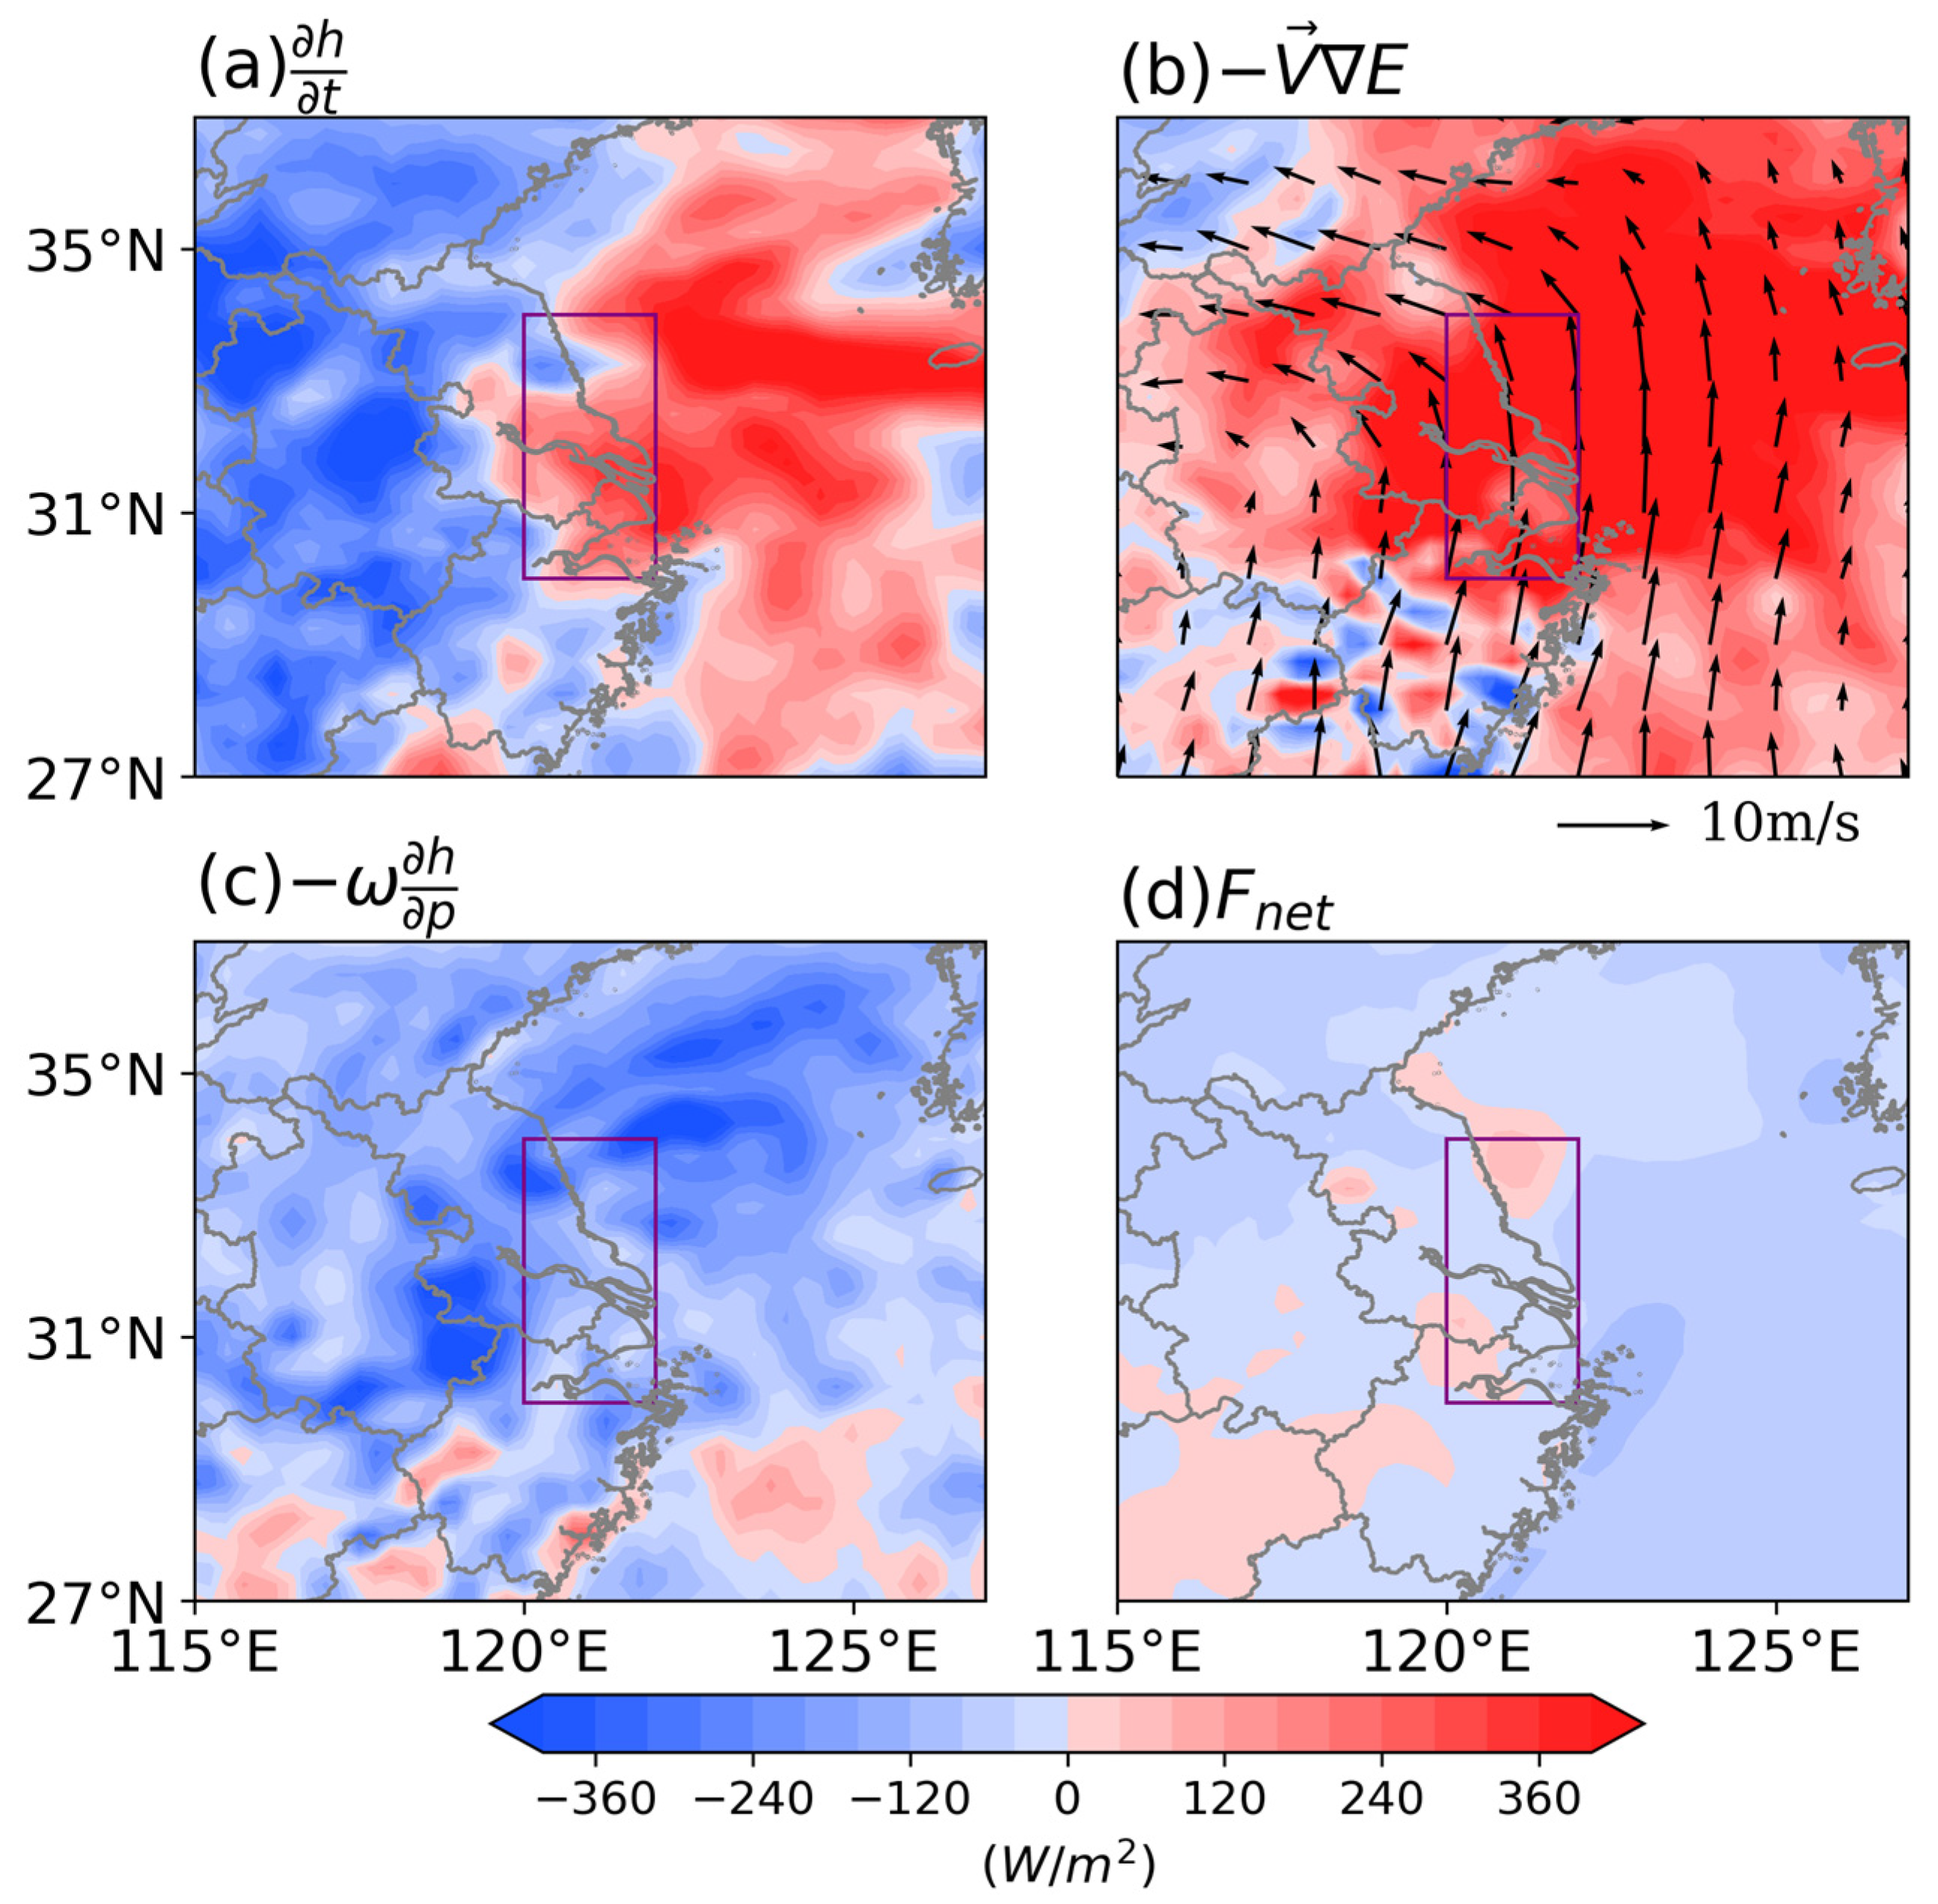
The vertical integrated MSE tendency budget provides new insights into the relative contributions of moist enthalpy horizontal advection, vertical MSE advection, and the net energy flux into the atmospheric column. Within the YHCA (Figure 3), the values for the vertically integrated MSE tendency are predominantly positive across the majority of the region. This suggests an accumulation of energy during the onset of precipitation. The moist enthalpy horizontal advection plays a dominant role in increasing the MSE, with the southerly bringing abundant warm humid air. The vertical advection of MSE is negative, working against MSE accumulation. This implies that it is favorable for precipitation, as precipitation consumes energy. When compared to that of other components, the contribution of the net energy flux is relatively minor.

4.2. MSE Budget Diagnosis

4.2.1. Nocturnal WSWR

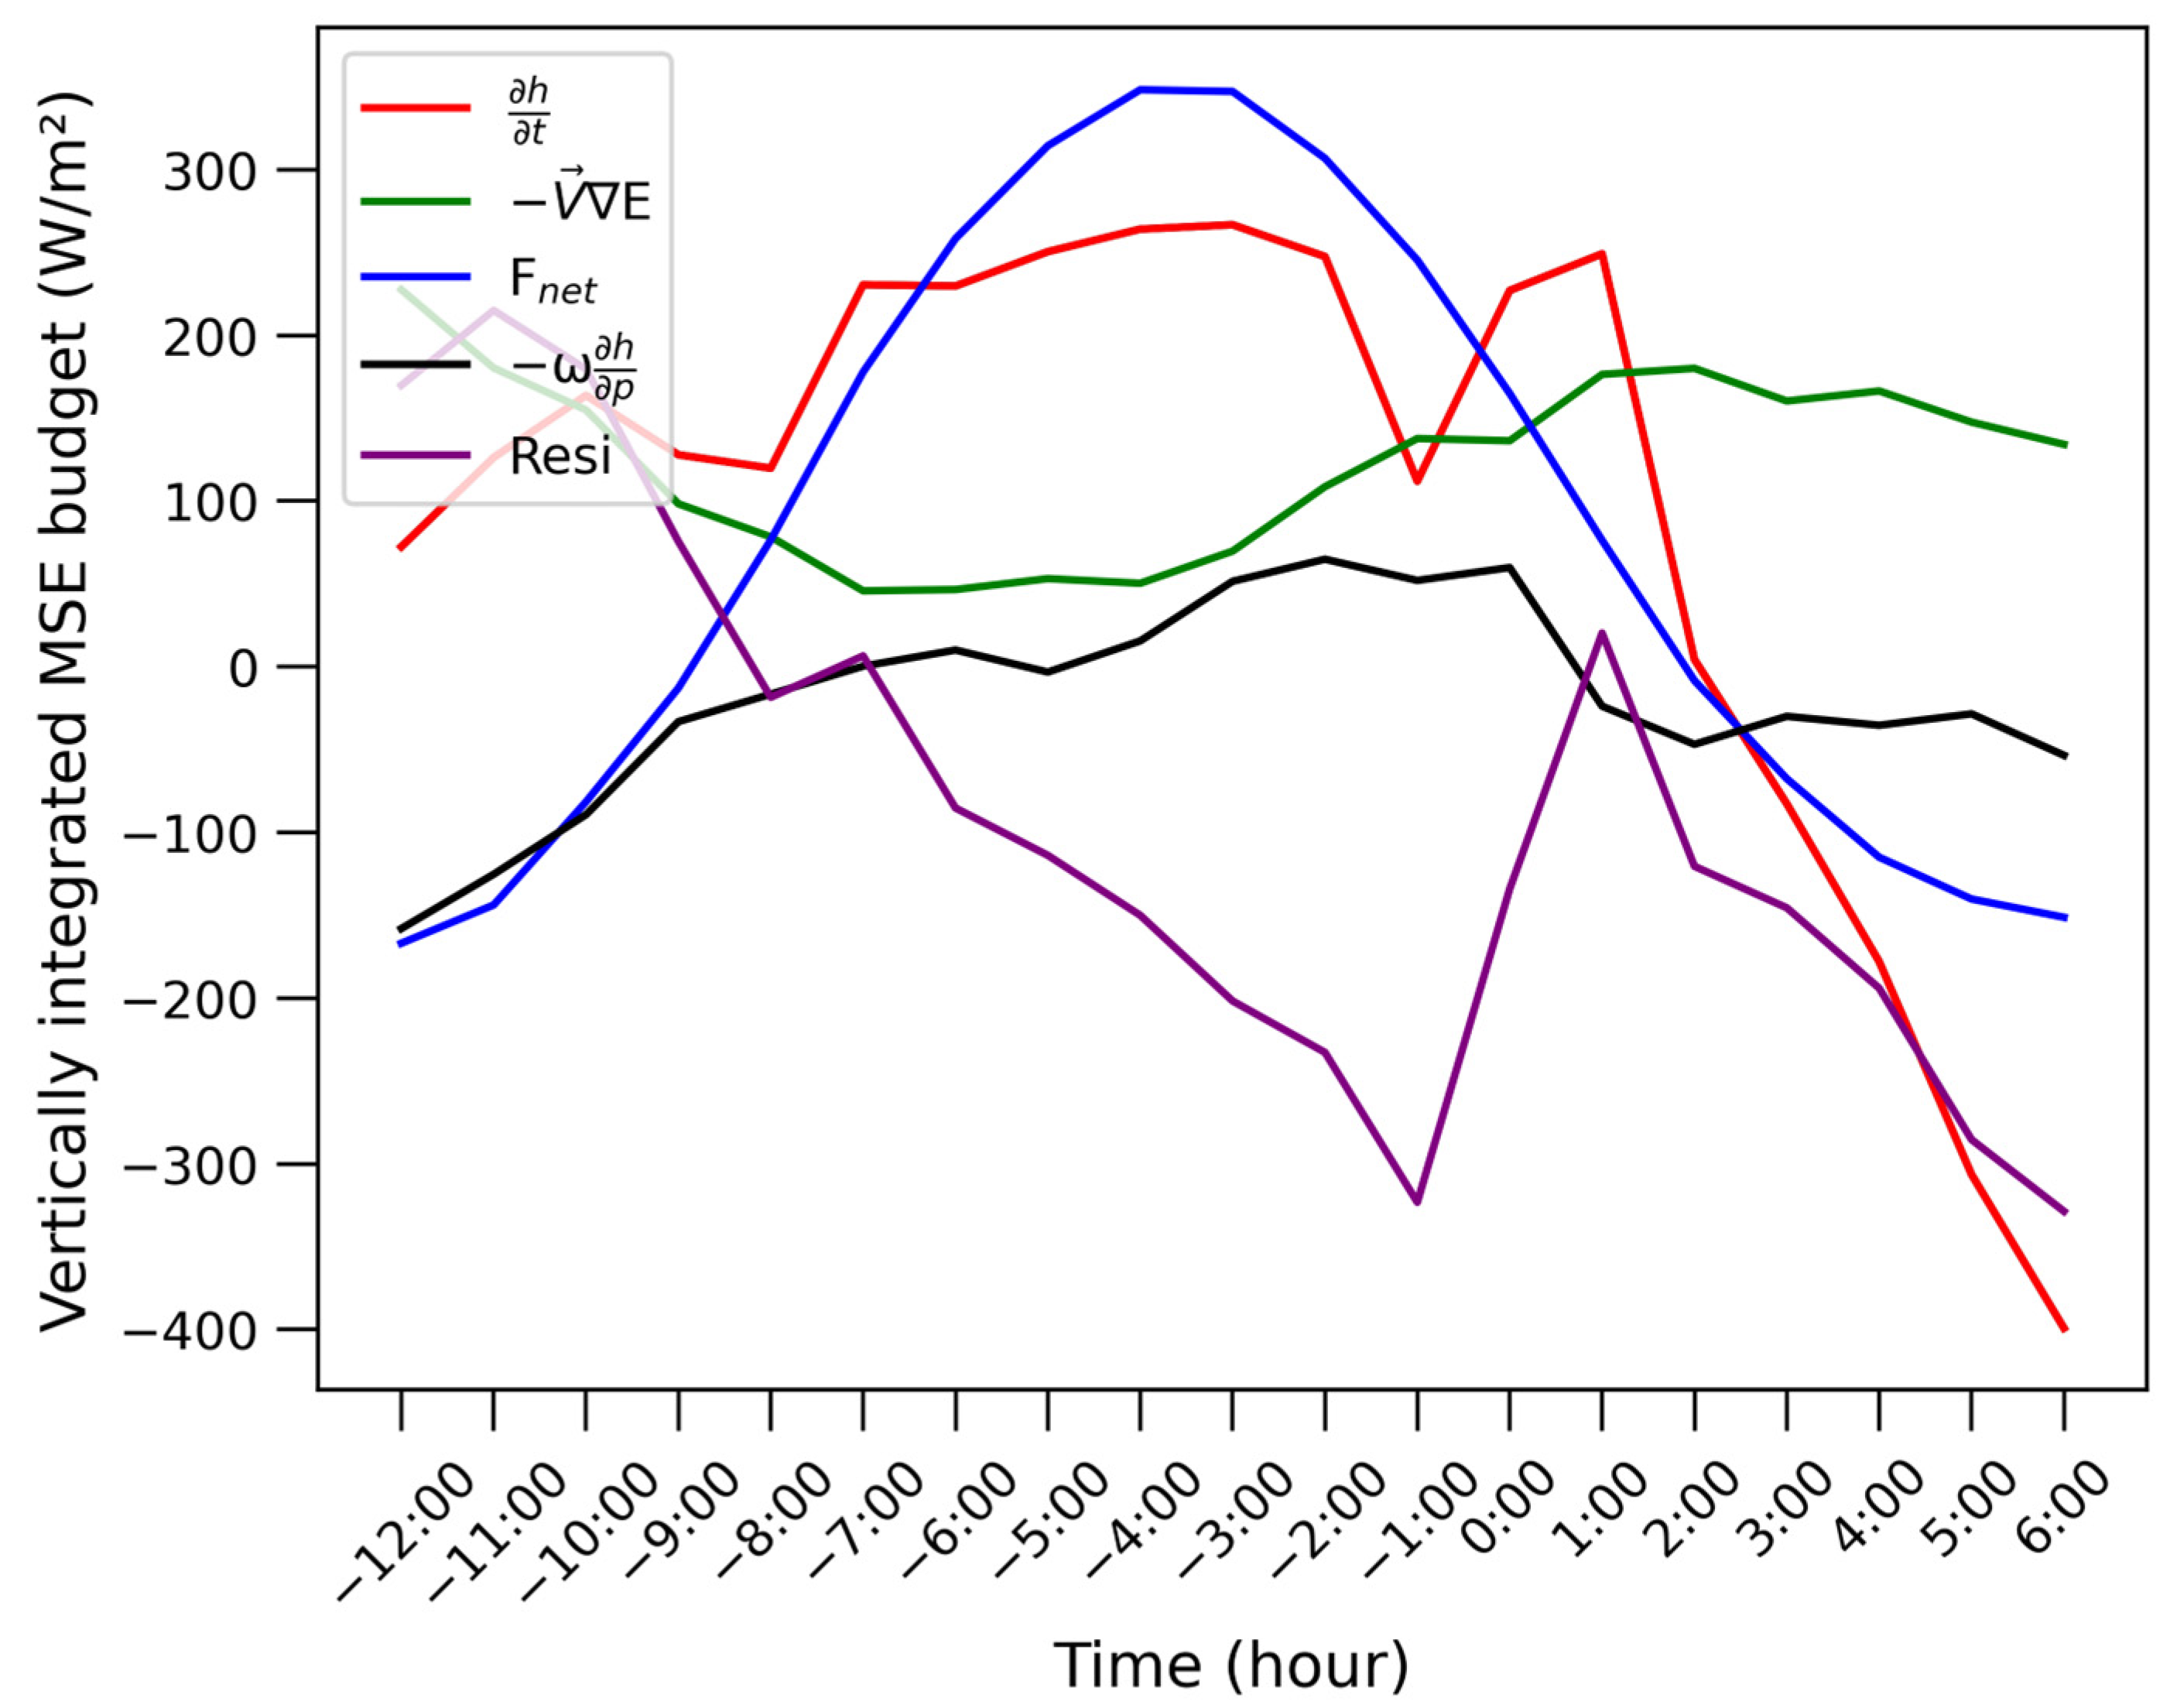
Previous research has extensively explored nocturnal rainfall. It has been found that nocturnal rain is closely associated with propagating mesoscale convective systems linked to topography [40] and accelerated nocturnal southwesterlies [41]. Additionally, studies have identified connections between the nocturnal rainfall phenomenon and the low-level jet [42,43,44,45]. Therefore, it is necessary to distinguish between nocturnal and daytime WSWR to reveal the underlying mechanisms from energy perspectives. For the nine nocturnal WSWR cases, the vertical integrated MSE tendency budget (Figure 4) shows that, whether before or after the onset of precipitation, moist enthalpy advection consistently remains the most dominant term, leading to the increase in MSE. This indicates that for the nocturnal rain, the boundary layer jet introduces an abundant influx of warm, moist air. The net energy flux stands as the second most significant term. It peaks 8 h before the onset of precipitation and hits its lowest point one hour prior to the precipitation onset, coinciding with the decrease in solar radiation at night.
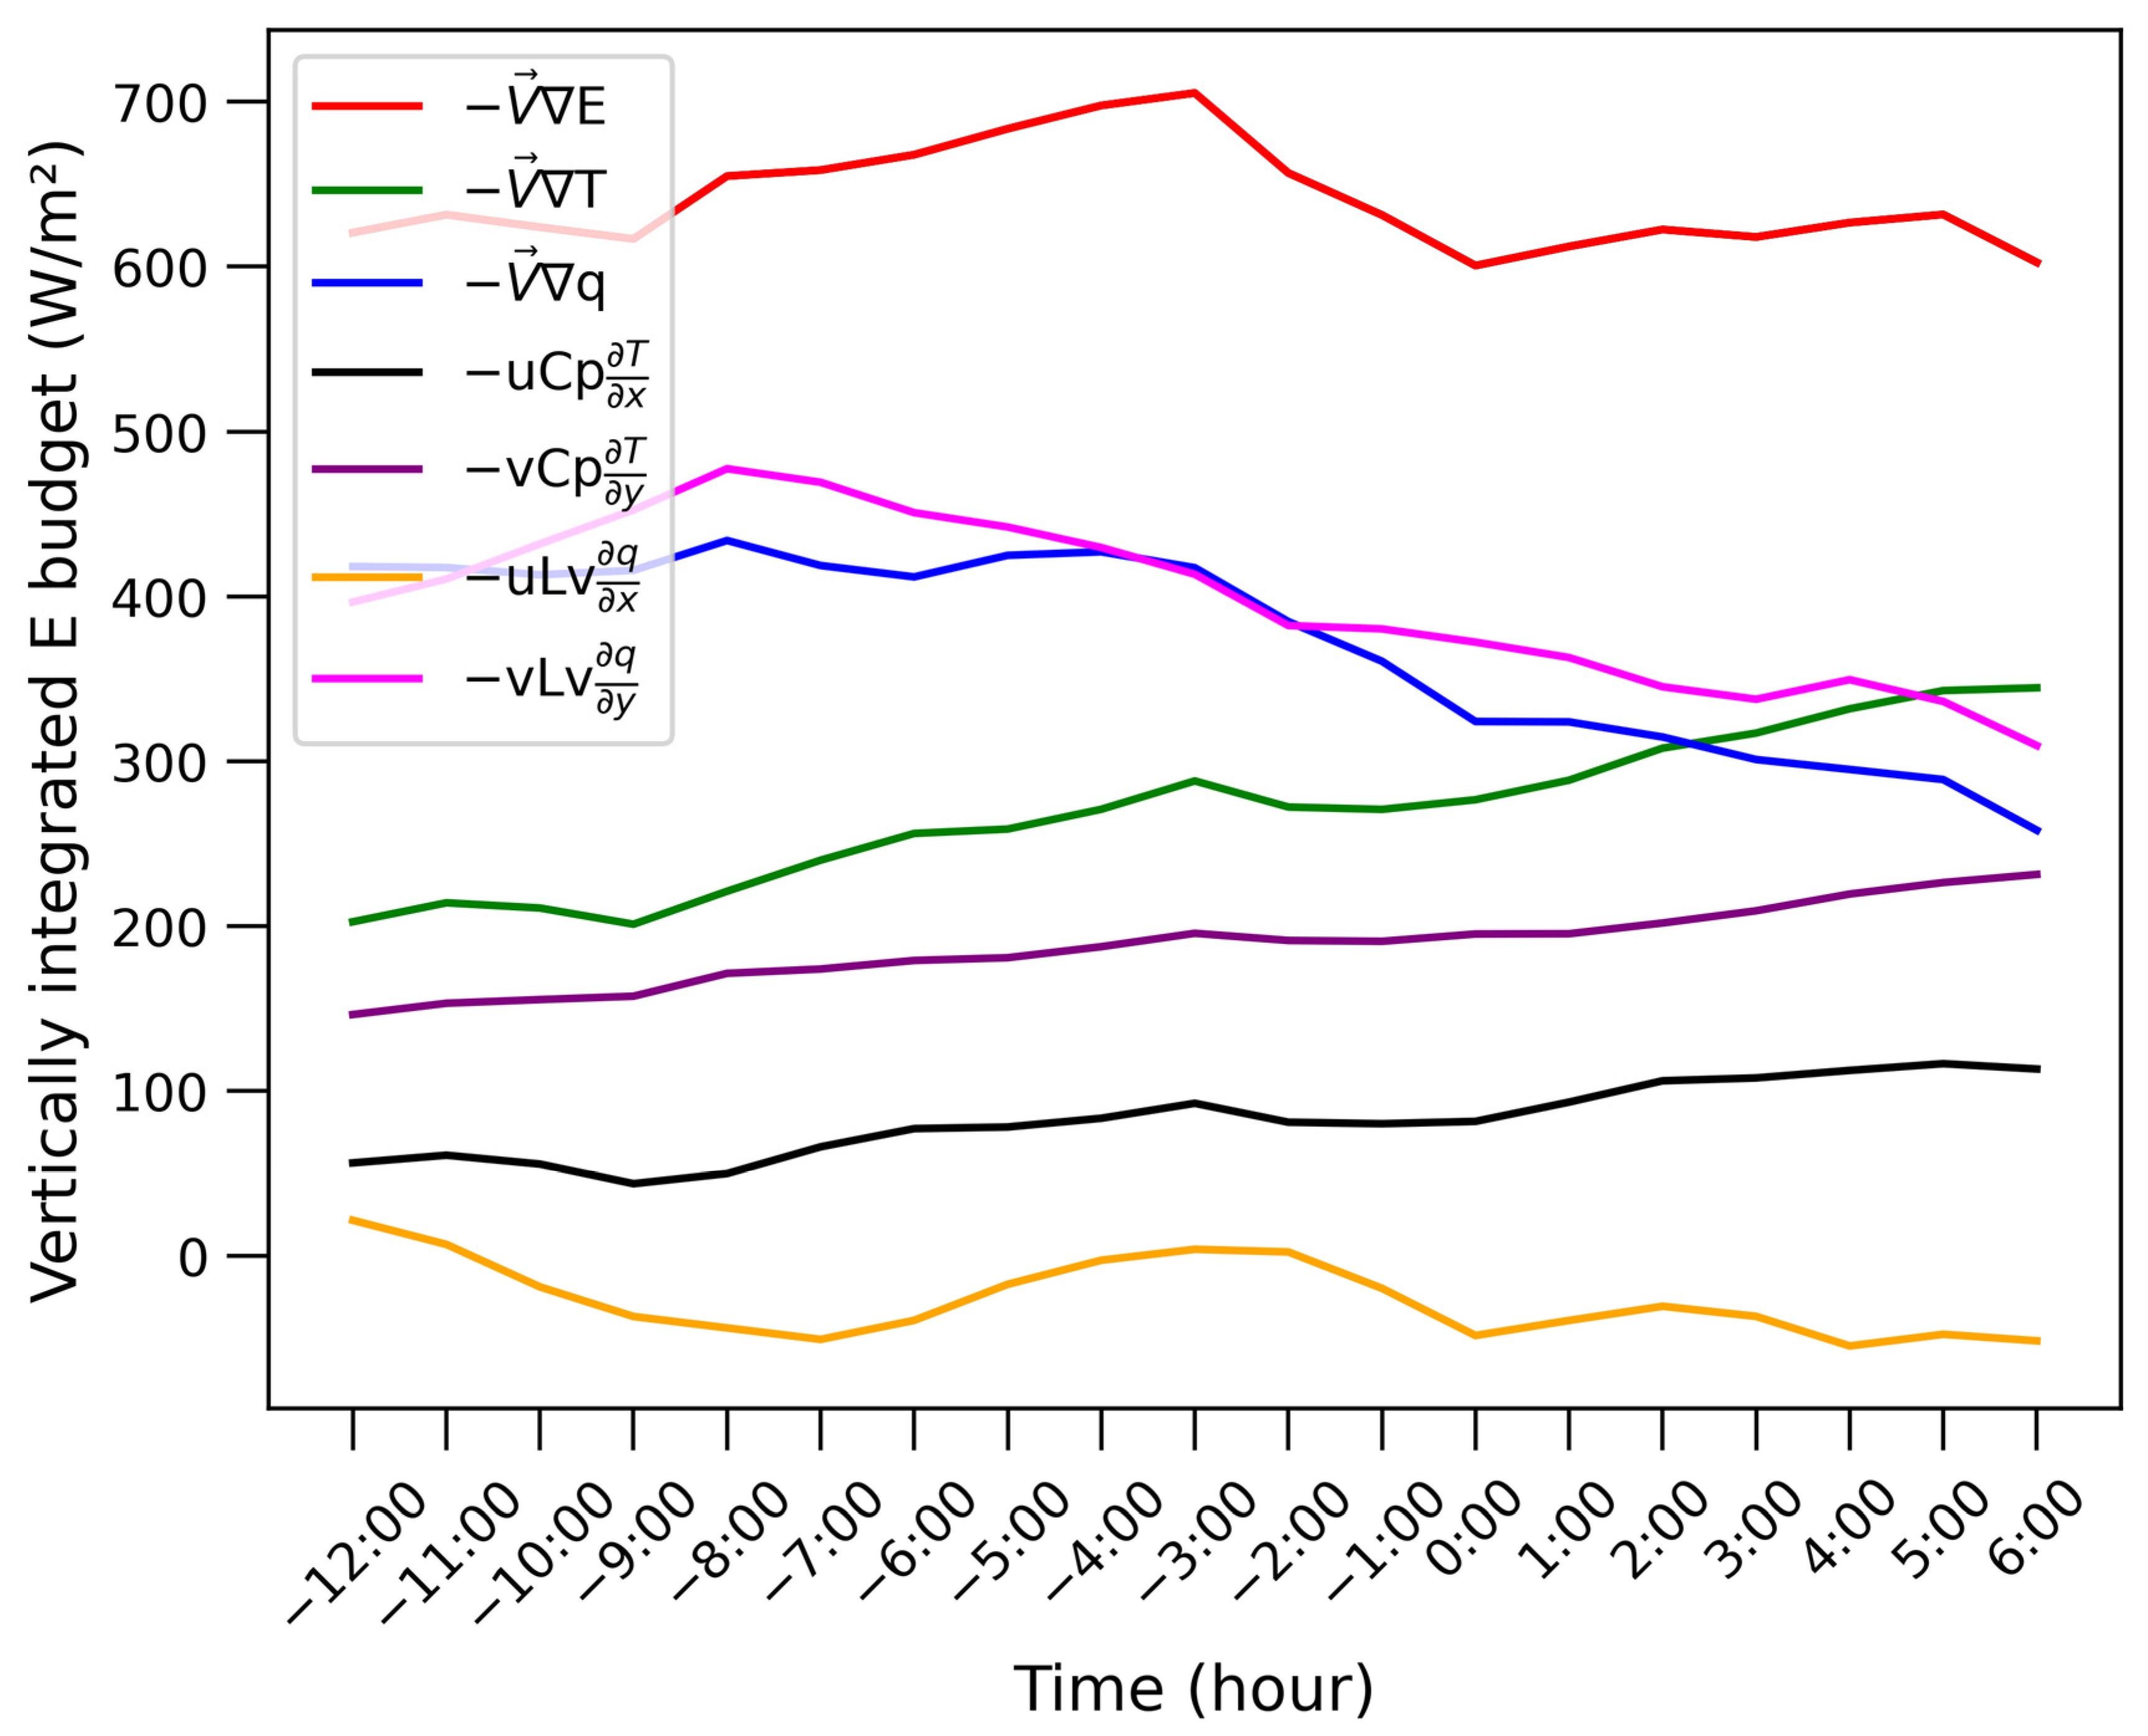
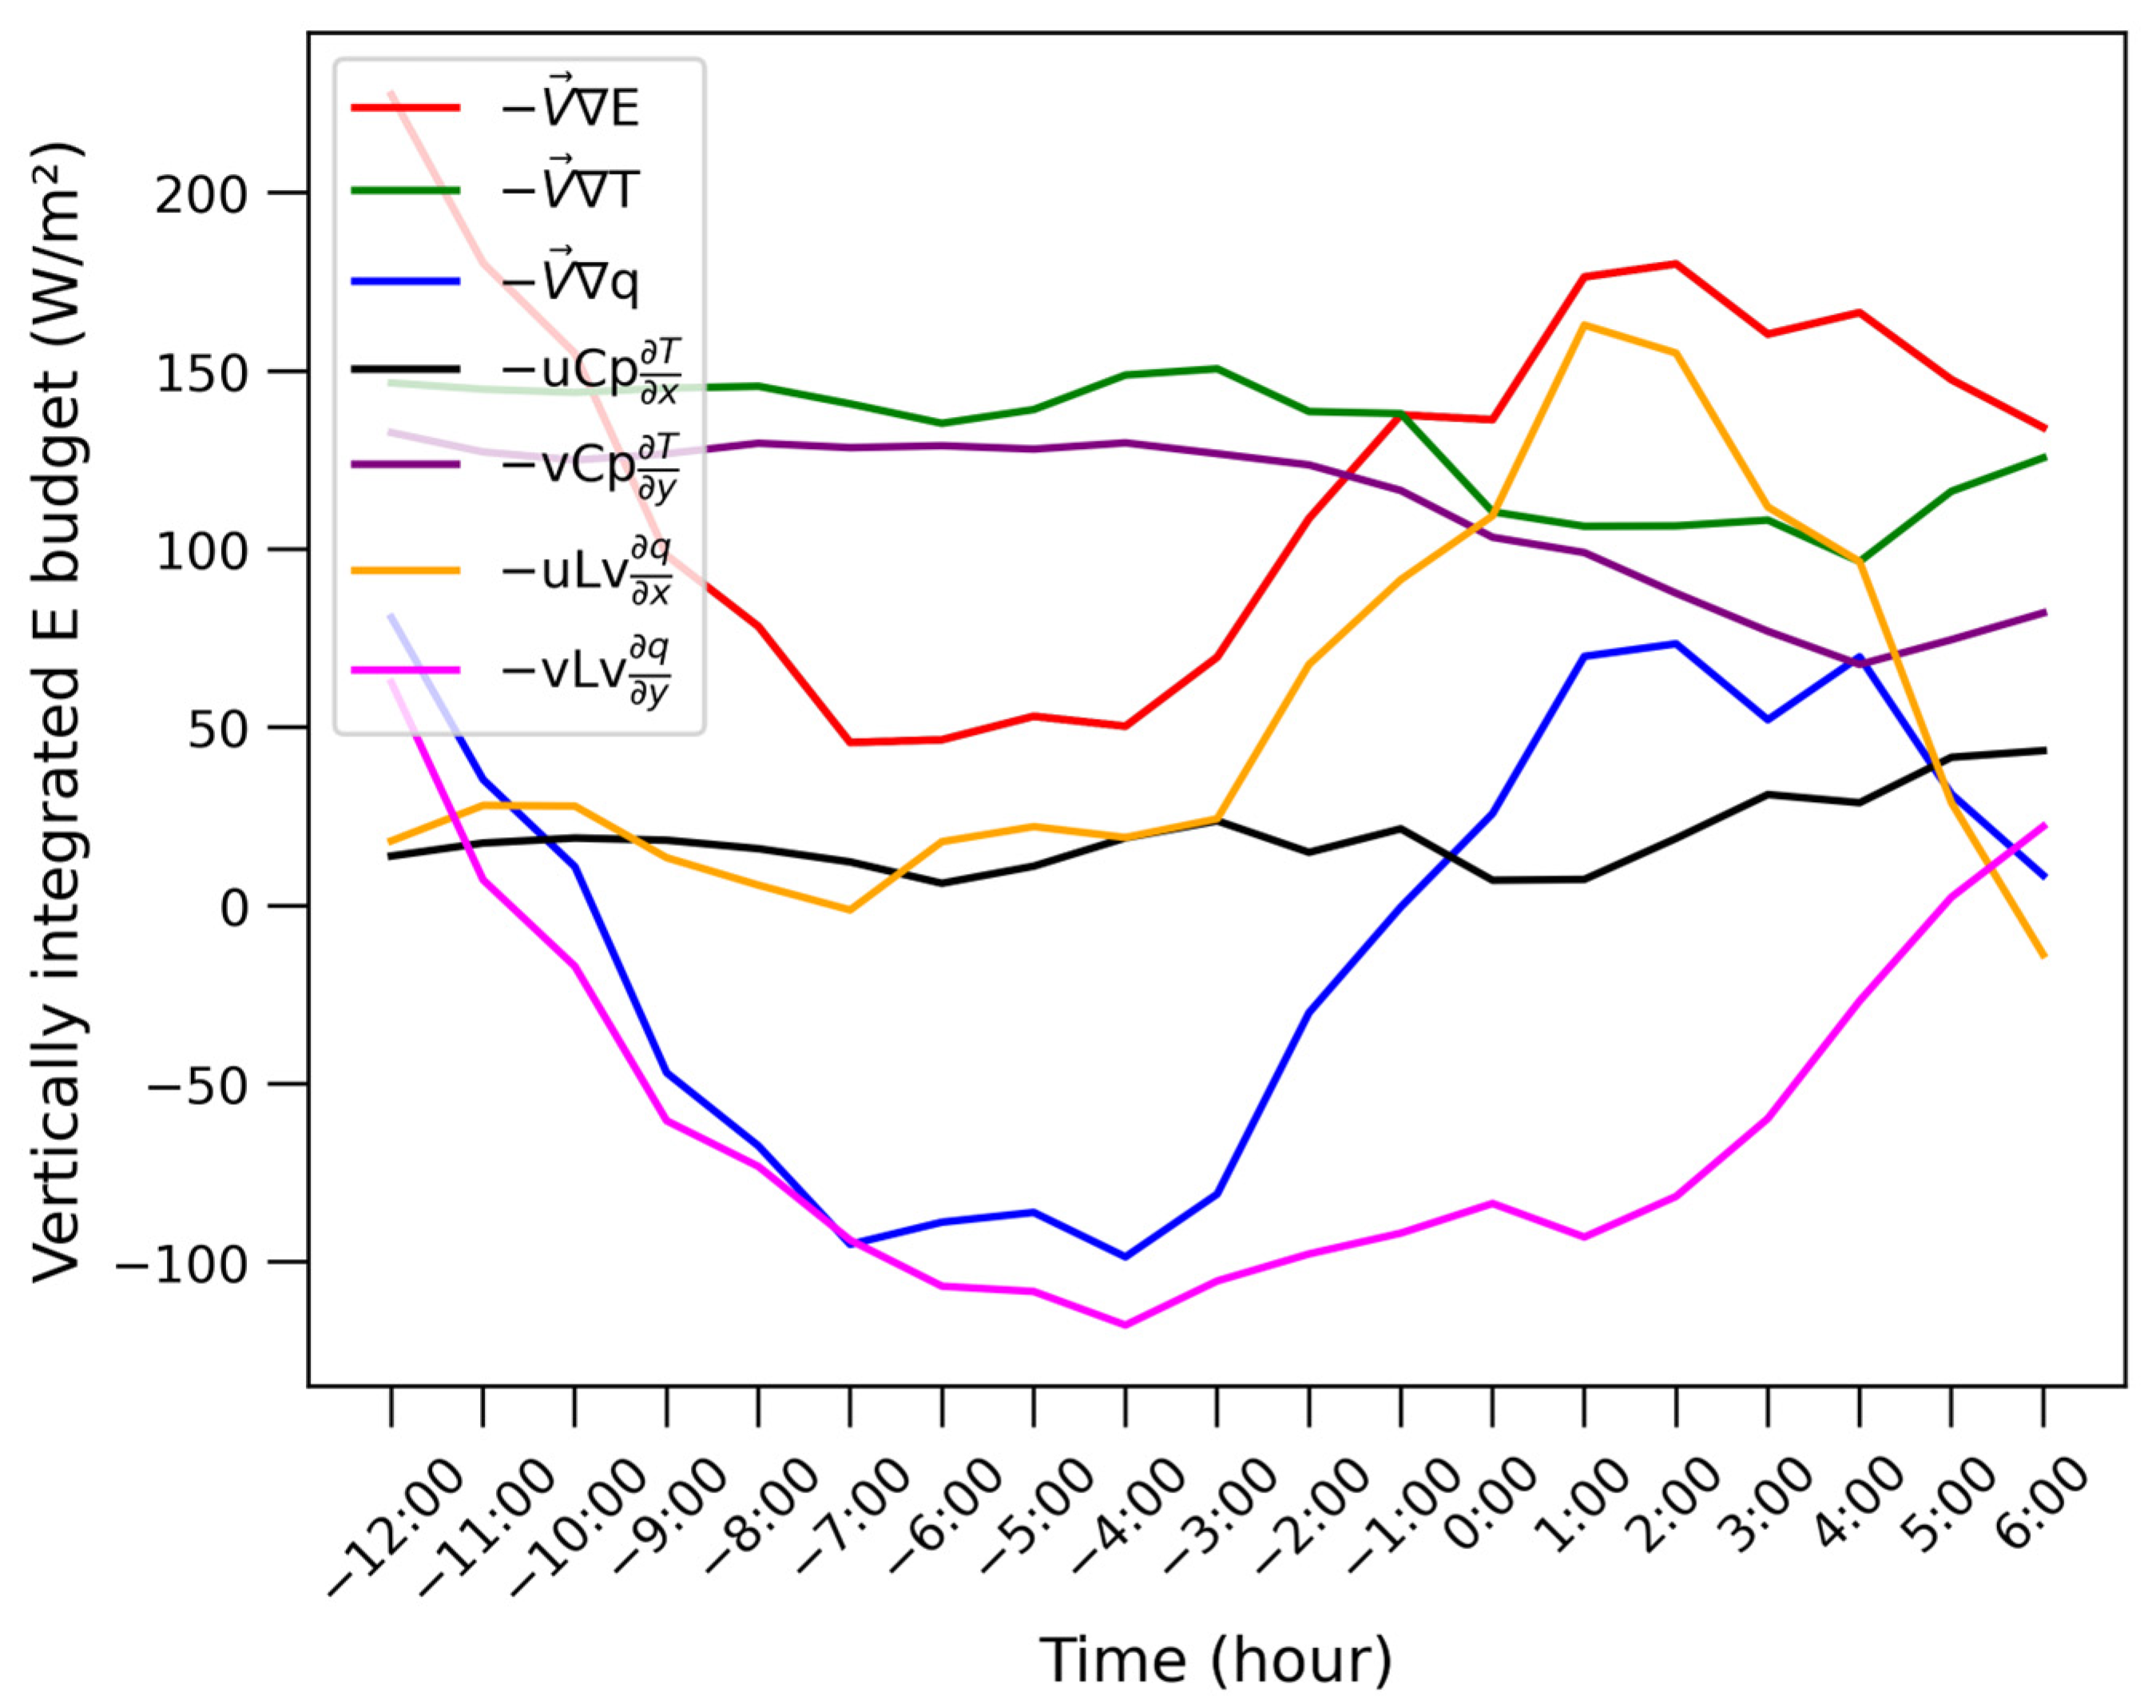
Given the significant role of moist enthalpy advection for the nocturnal WSWR, it becomes essential to analyze its budget. As illustrated in Figure 5, during the period spanning 12 h before to 6 h after the precipitation onset, latent energy advection consistently exceeds the internal energy advection. This pattern emphasizes the predominance of moisture over the temperature during this interval. Breaking down latent energy advection into zonal and meridional advection reveals the significant influence of the meridional latent energy advection. This component reaches its peak, 477 W/m², eight hours preceding the precipitation onset and distinctly surpasses other terms. Prior to the precipitation’s onset, the moist energy is notably strong. However, following the onset of precipitation, there is a discernible decline in its intensity. Conversely, the zonal latent energy advection remains in the negative and is negligible. By decomposing internal energy advection into zonal and meridional components, both exhibit an upward trend over the timespan. Notably, the meridional internal energy advection surpasses the zonal component both before and after the precipitation onset. Therefore, we can conclude that for the nocturnal rain, the meridional latent energy advection plays a pivotal role in influencing WSWR events; this is closely tied to the north–south-oriented boundary layer jet, as depicted in Figure 1b.
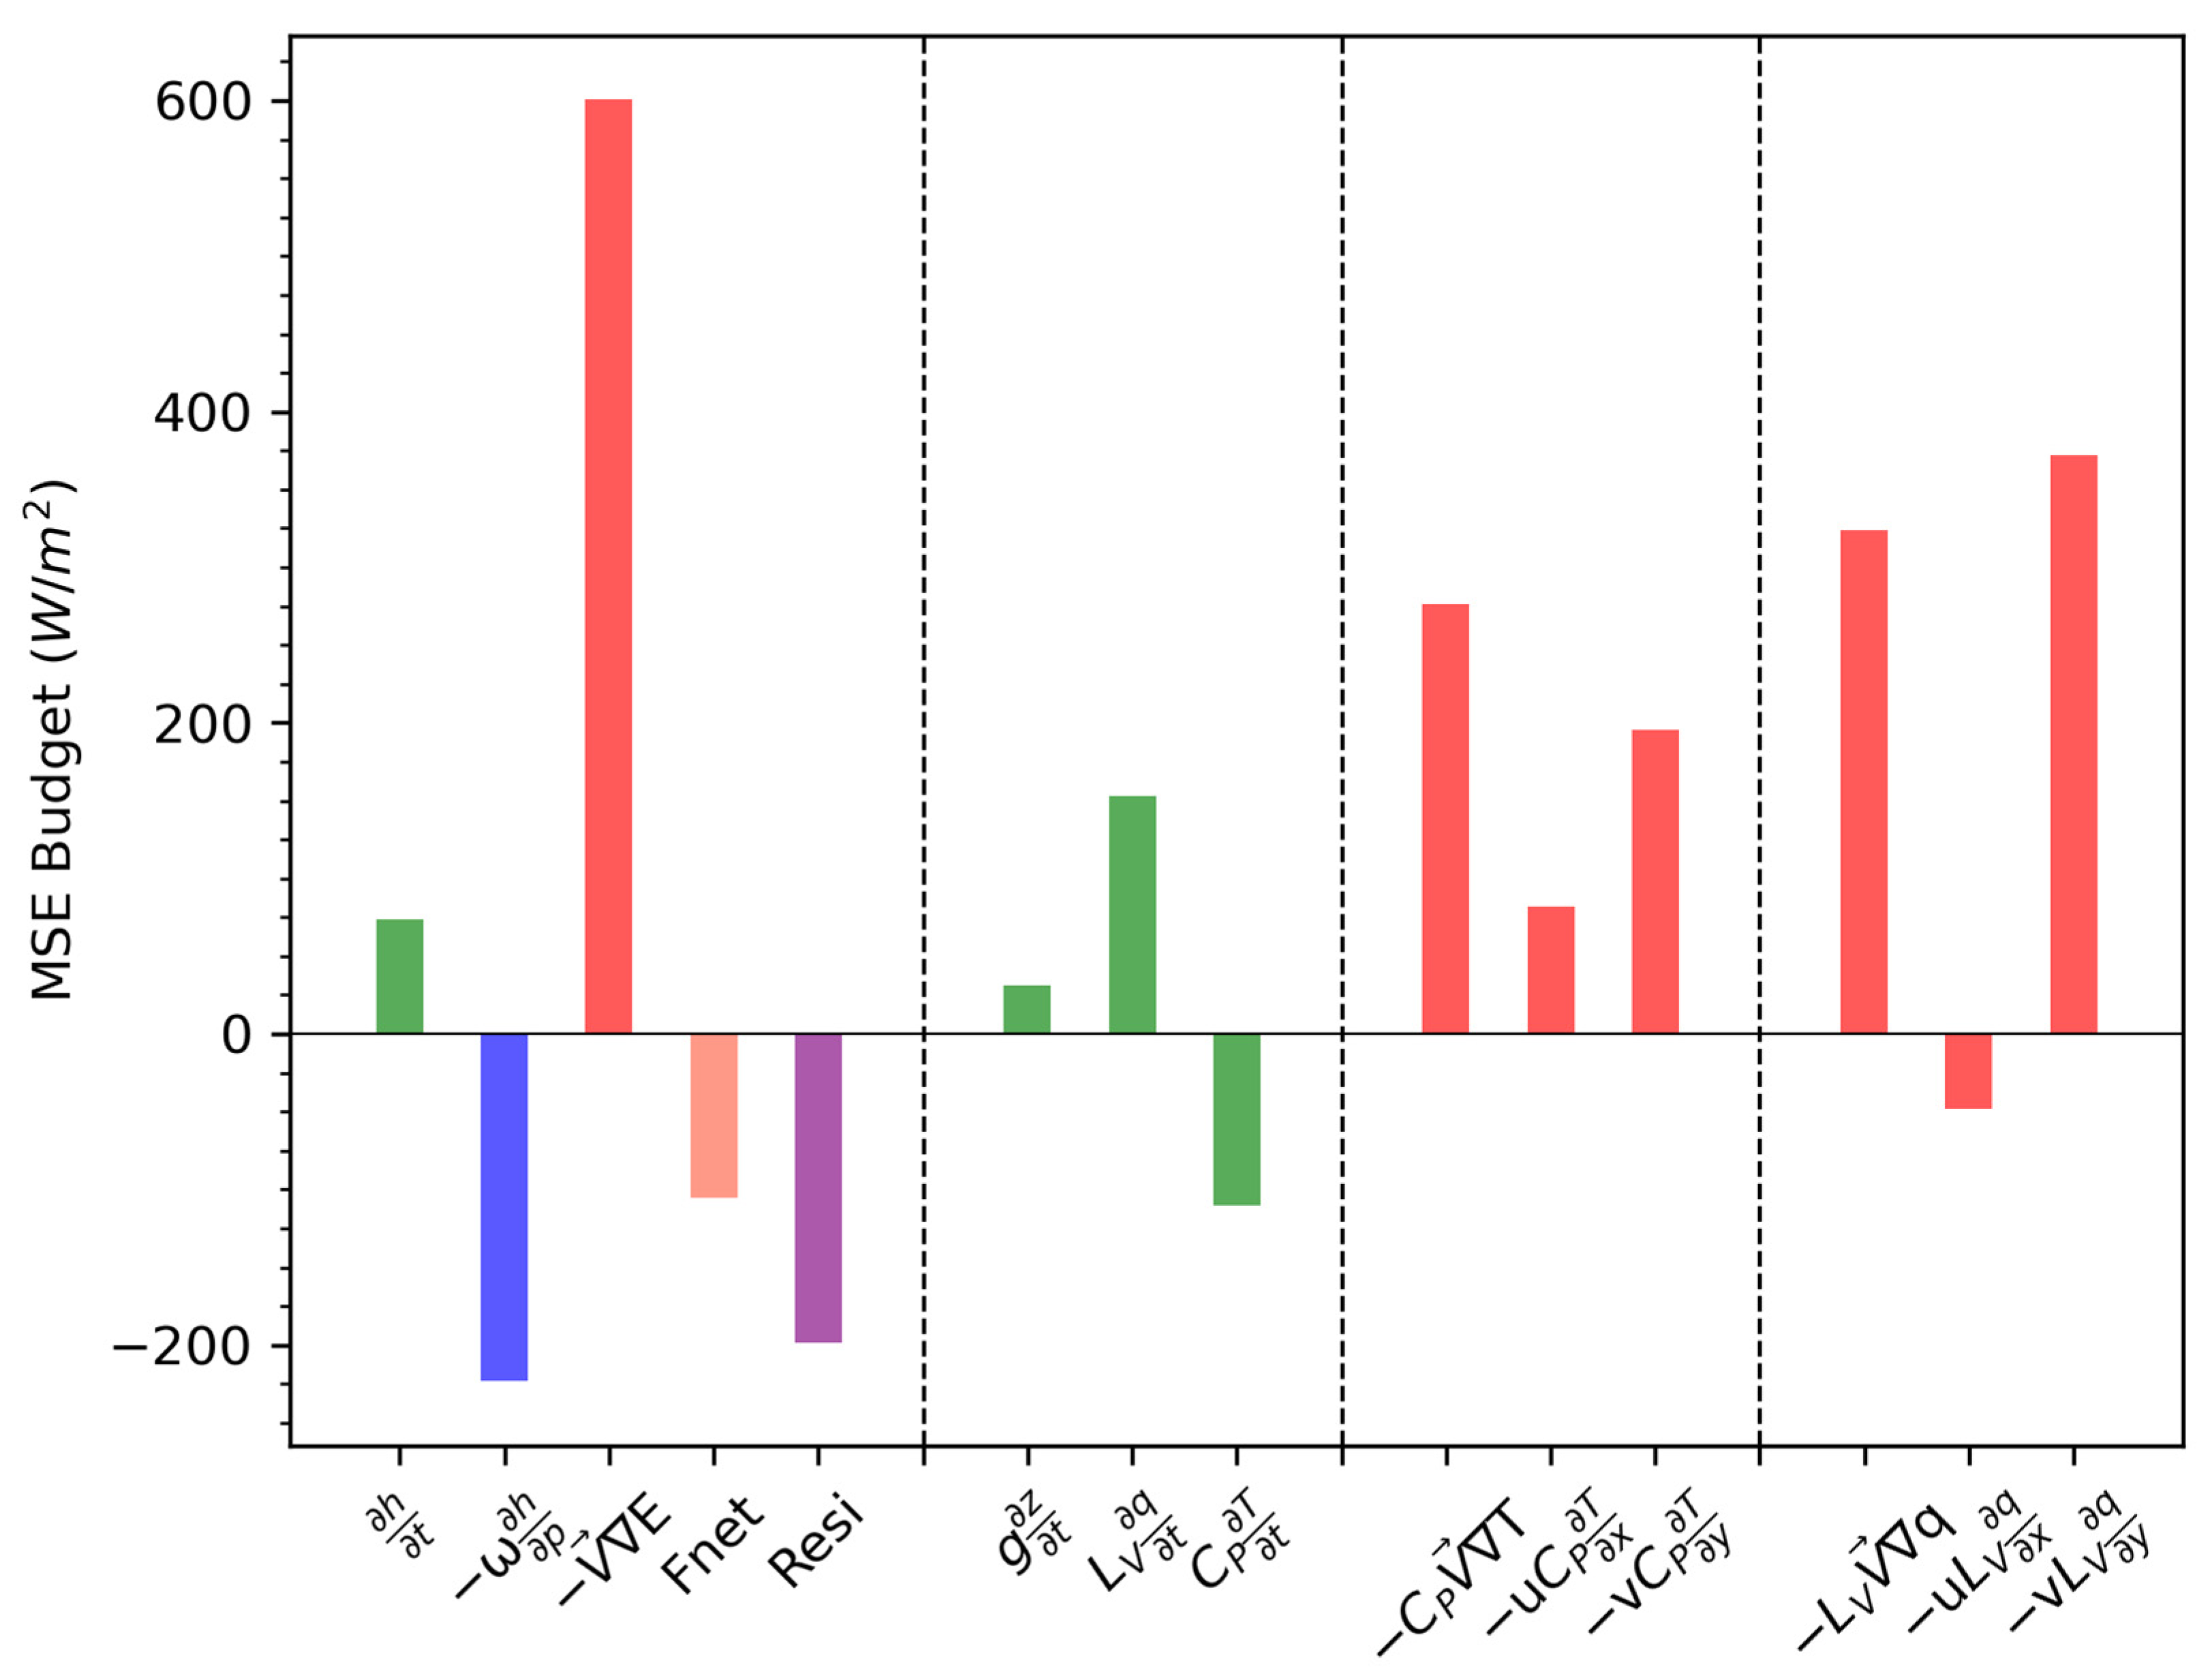
To clearly and quantitively show the relative contribution of each term, the budget for nocturnal WSWR at the occurrence moments was studied (Figure 6). The first column displays the vertical integrated MSE budget. It reveals that the moist enthalpy advection is the dominant term, with a value of 600 W/m². This indicates that warm and humid air is crucial for the initiation of the WSWR. The negative value (−223 W/m²) of vertical MSE advection is favorable for the onset of the WSWR, as the initiation of WSWR consumes energy. The second column presents the gravitational potential energy tendency, latent heat energy tendency, and internal energy tendency. The latent heat energy tendency is the most significant component. In the data presented across the third and fourth columns, the comparison between internal energy advection and latent energy advection reveals some interesting insights. Notably, latent energy advection (324 W/m²) exceeds internal energy advection (277 W/m²). A closer look at their respective components highlights that, for both internal and latent energy advection, the meridional terms dominate the zonal ones. Among all terms, it is the meridional latent advection that stands out most prominently, with a value of 372 W/m².
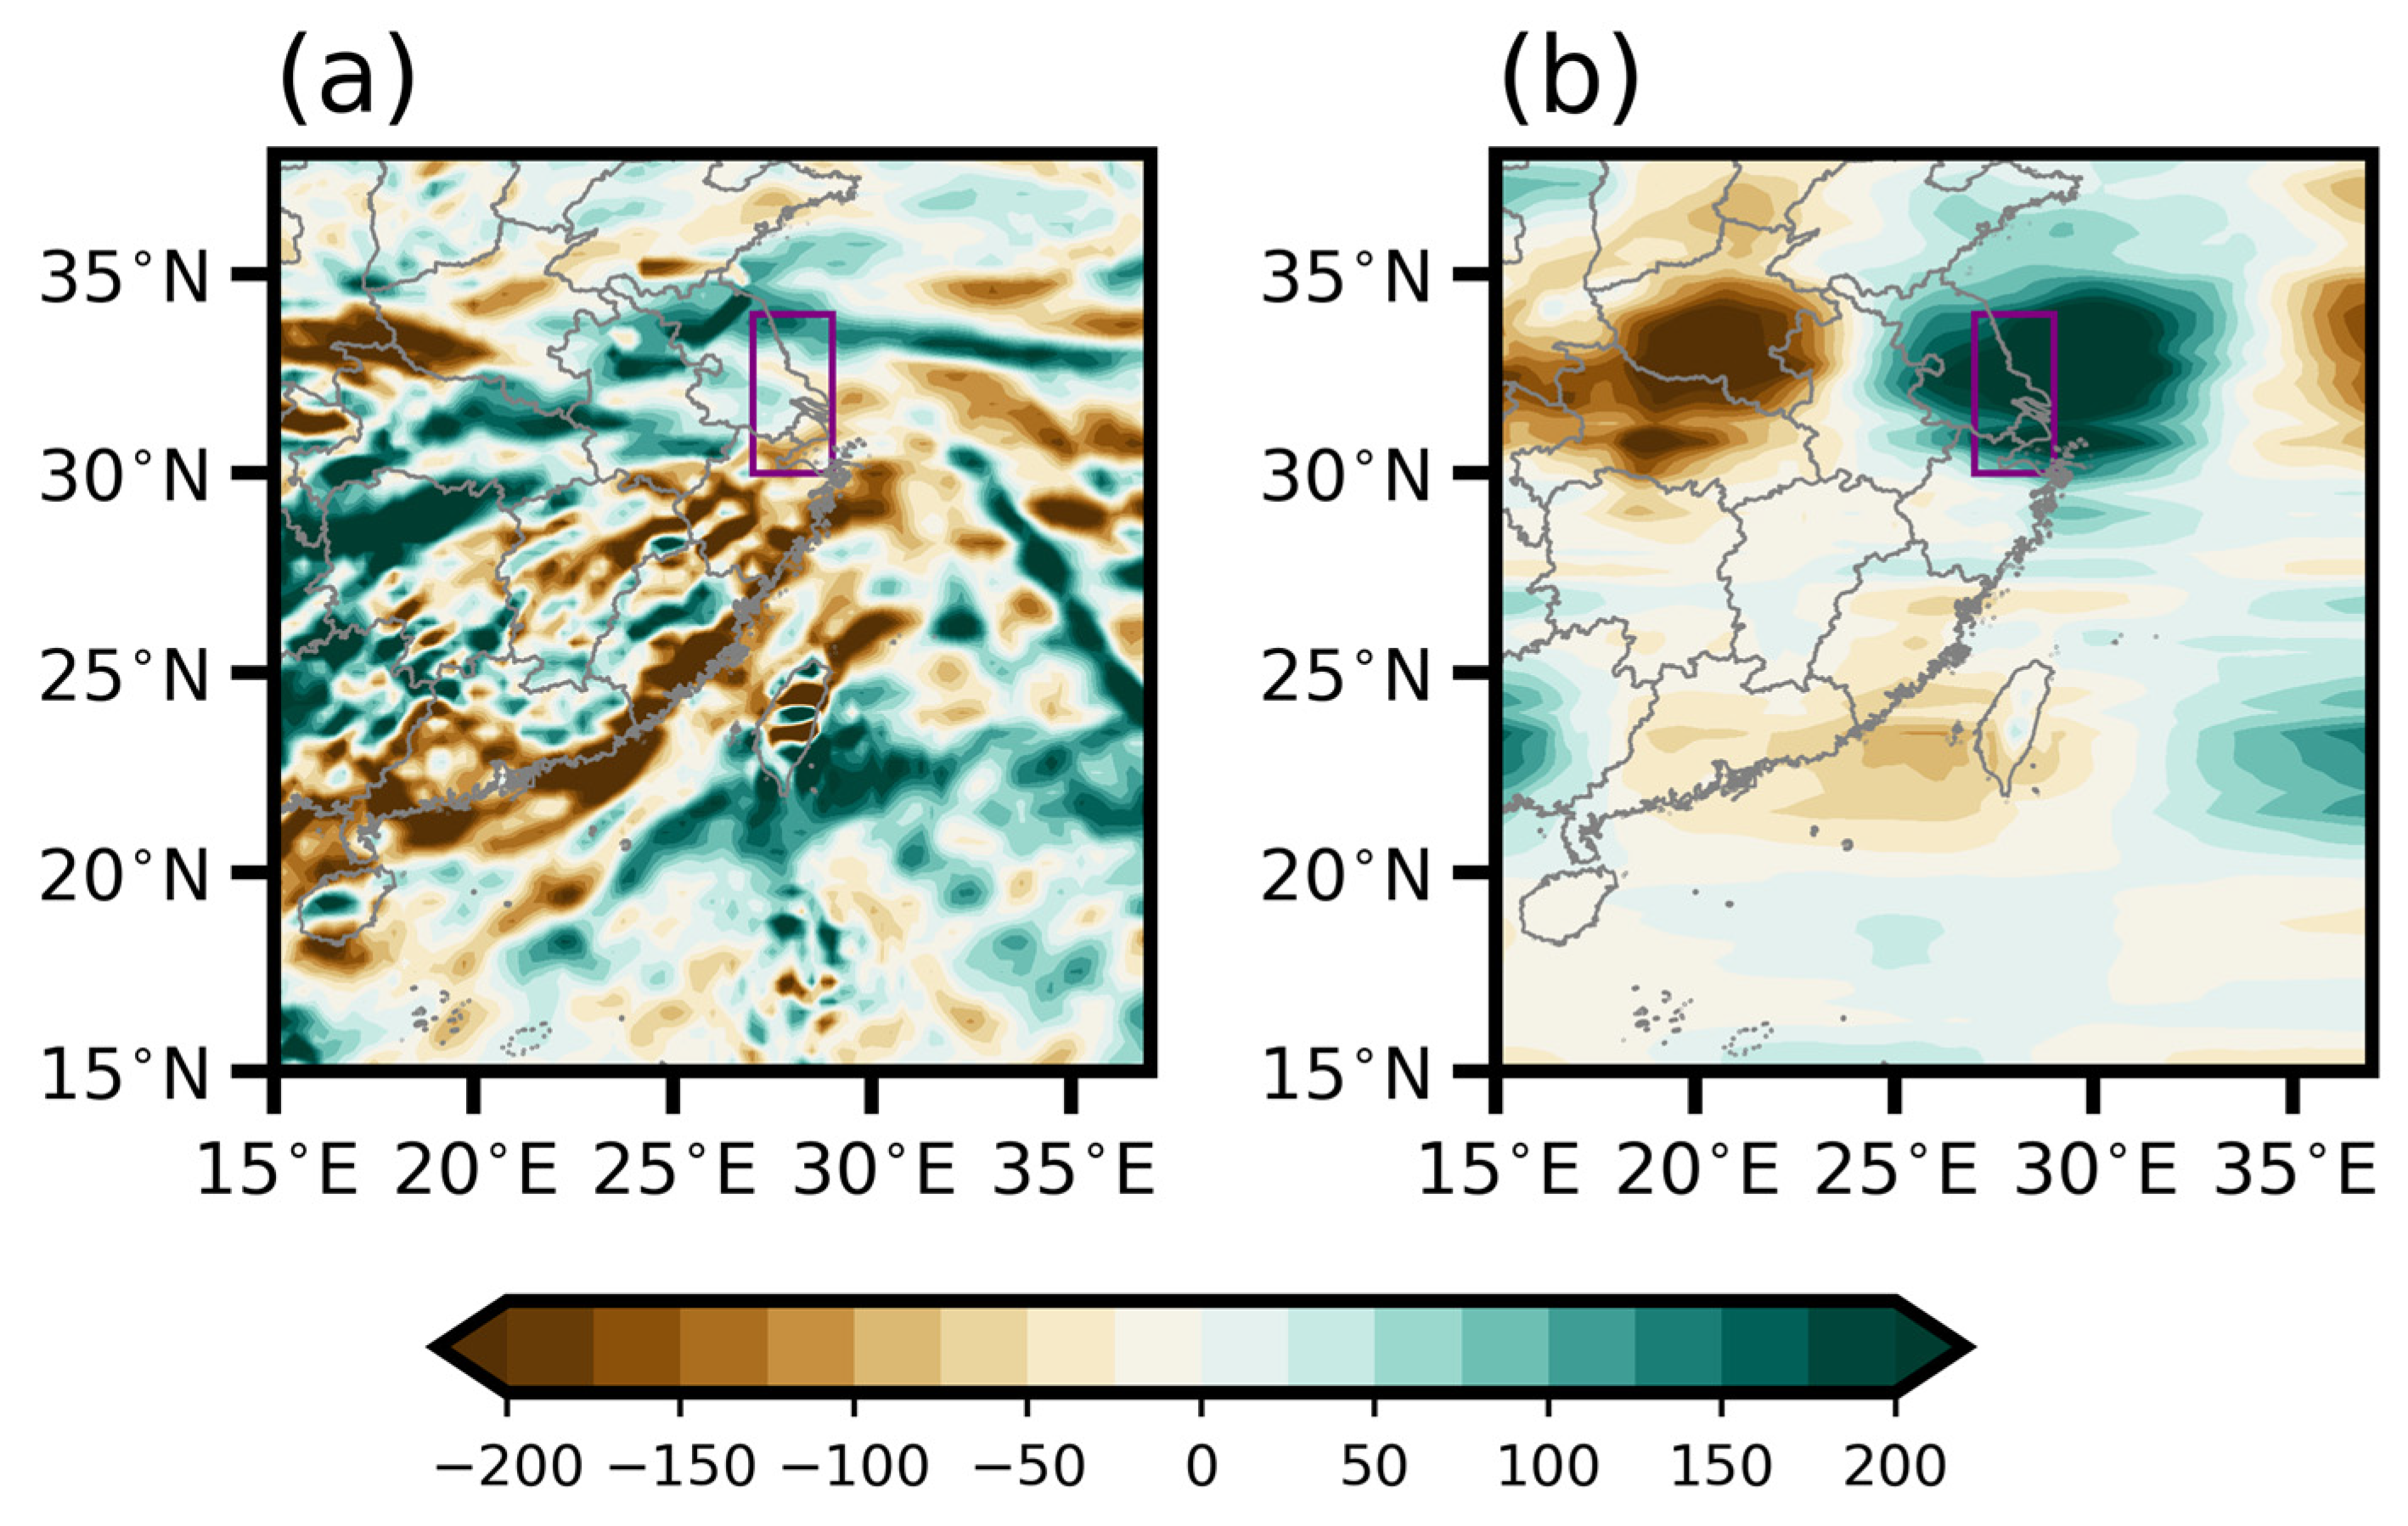
In conclusion, for nocturnal WSWR events, the increase in MSE is predominantly driven by meridional latent energy advection. Therefore, a scale analysis for the meridional latent energy advection was further performed. As illustrated in Figure 7b, it is evident that the advection resulting from the combination of disturbance meridional wind and mean specific humidity is significant. A pronounced positive center was observed over the YHCA, indicating robust latent energy advection. This leads to the conclusion that the mesoscale dynamic system plays a crucial role.

4.2.2. Non-Nocturnal WSWR

For the five WSWR events occurring during daytime, the vertical integrated MSE tendency was also investigated (Figure 8). During the period spanning 12 h prior to the onset of non-nocturnal WSWR, the vertical integrated MSE tendency is consistently positive, averaging around 200 W/m² for most of that duration. This reveals that there is energy accumulation prior to the precipitation onset. However, as the rainfall continues and depletes the energy, a declining trend is observed one hour after the onset. Interestingly, from eight hours before to one hour after the onset of precipitation, in contrast to the nocturnal WSWR where moist enthalpy advection is predominant, it is the net energy flux that primarily drives the increase in MSE. The value of net energy flux significantly exceeds that of the moist enthalpy advection, which is the second important term. One hour after the onset, the moist enthalpy advection overtakes net energy flux. By analyzing the moist enthalpy advection budget (Figure 9), we observed that before the onset of WSWR cases, internal energy advection is significantly more dominant than the latent energy advection, and meridional internal energy advection plays a pivotal role.
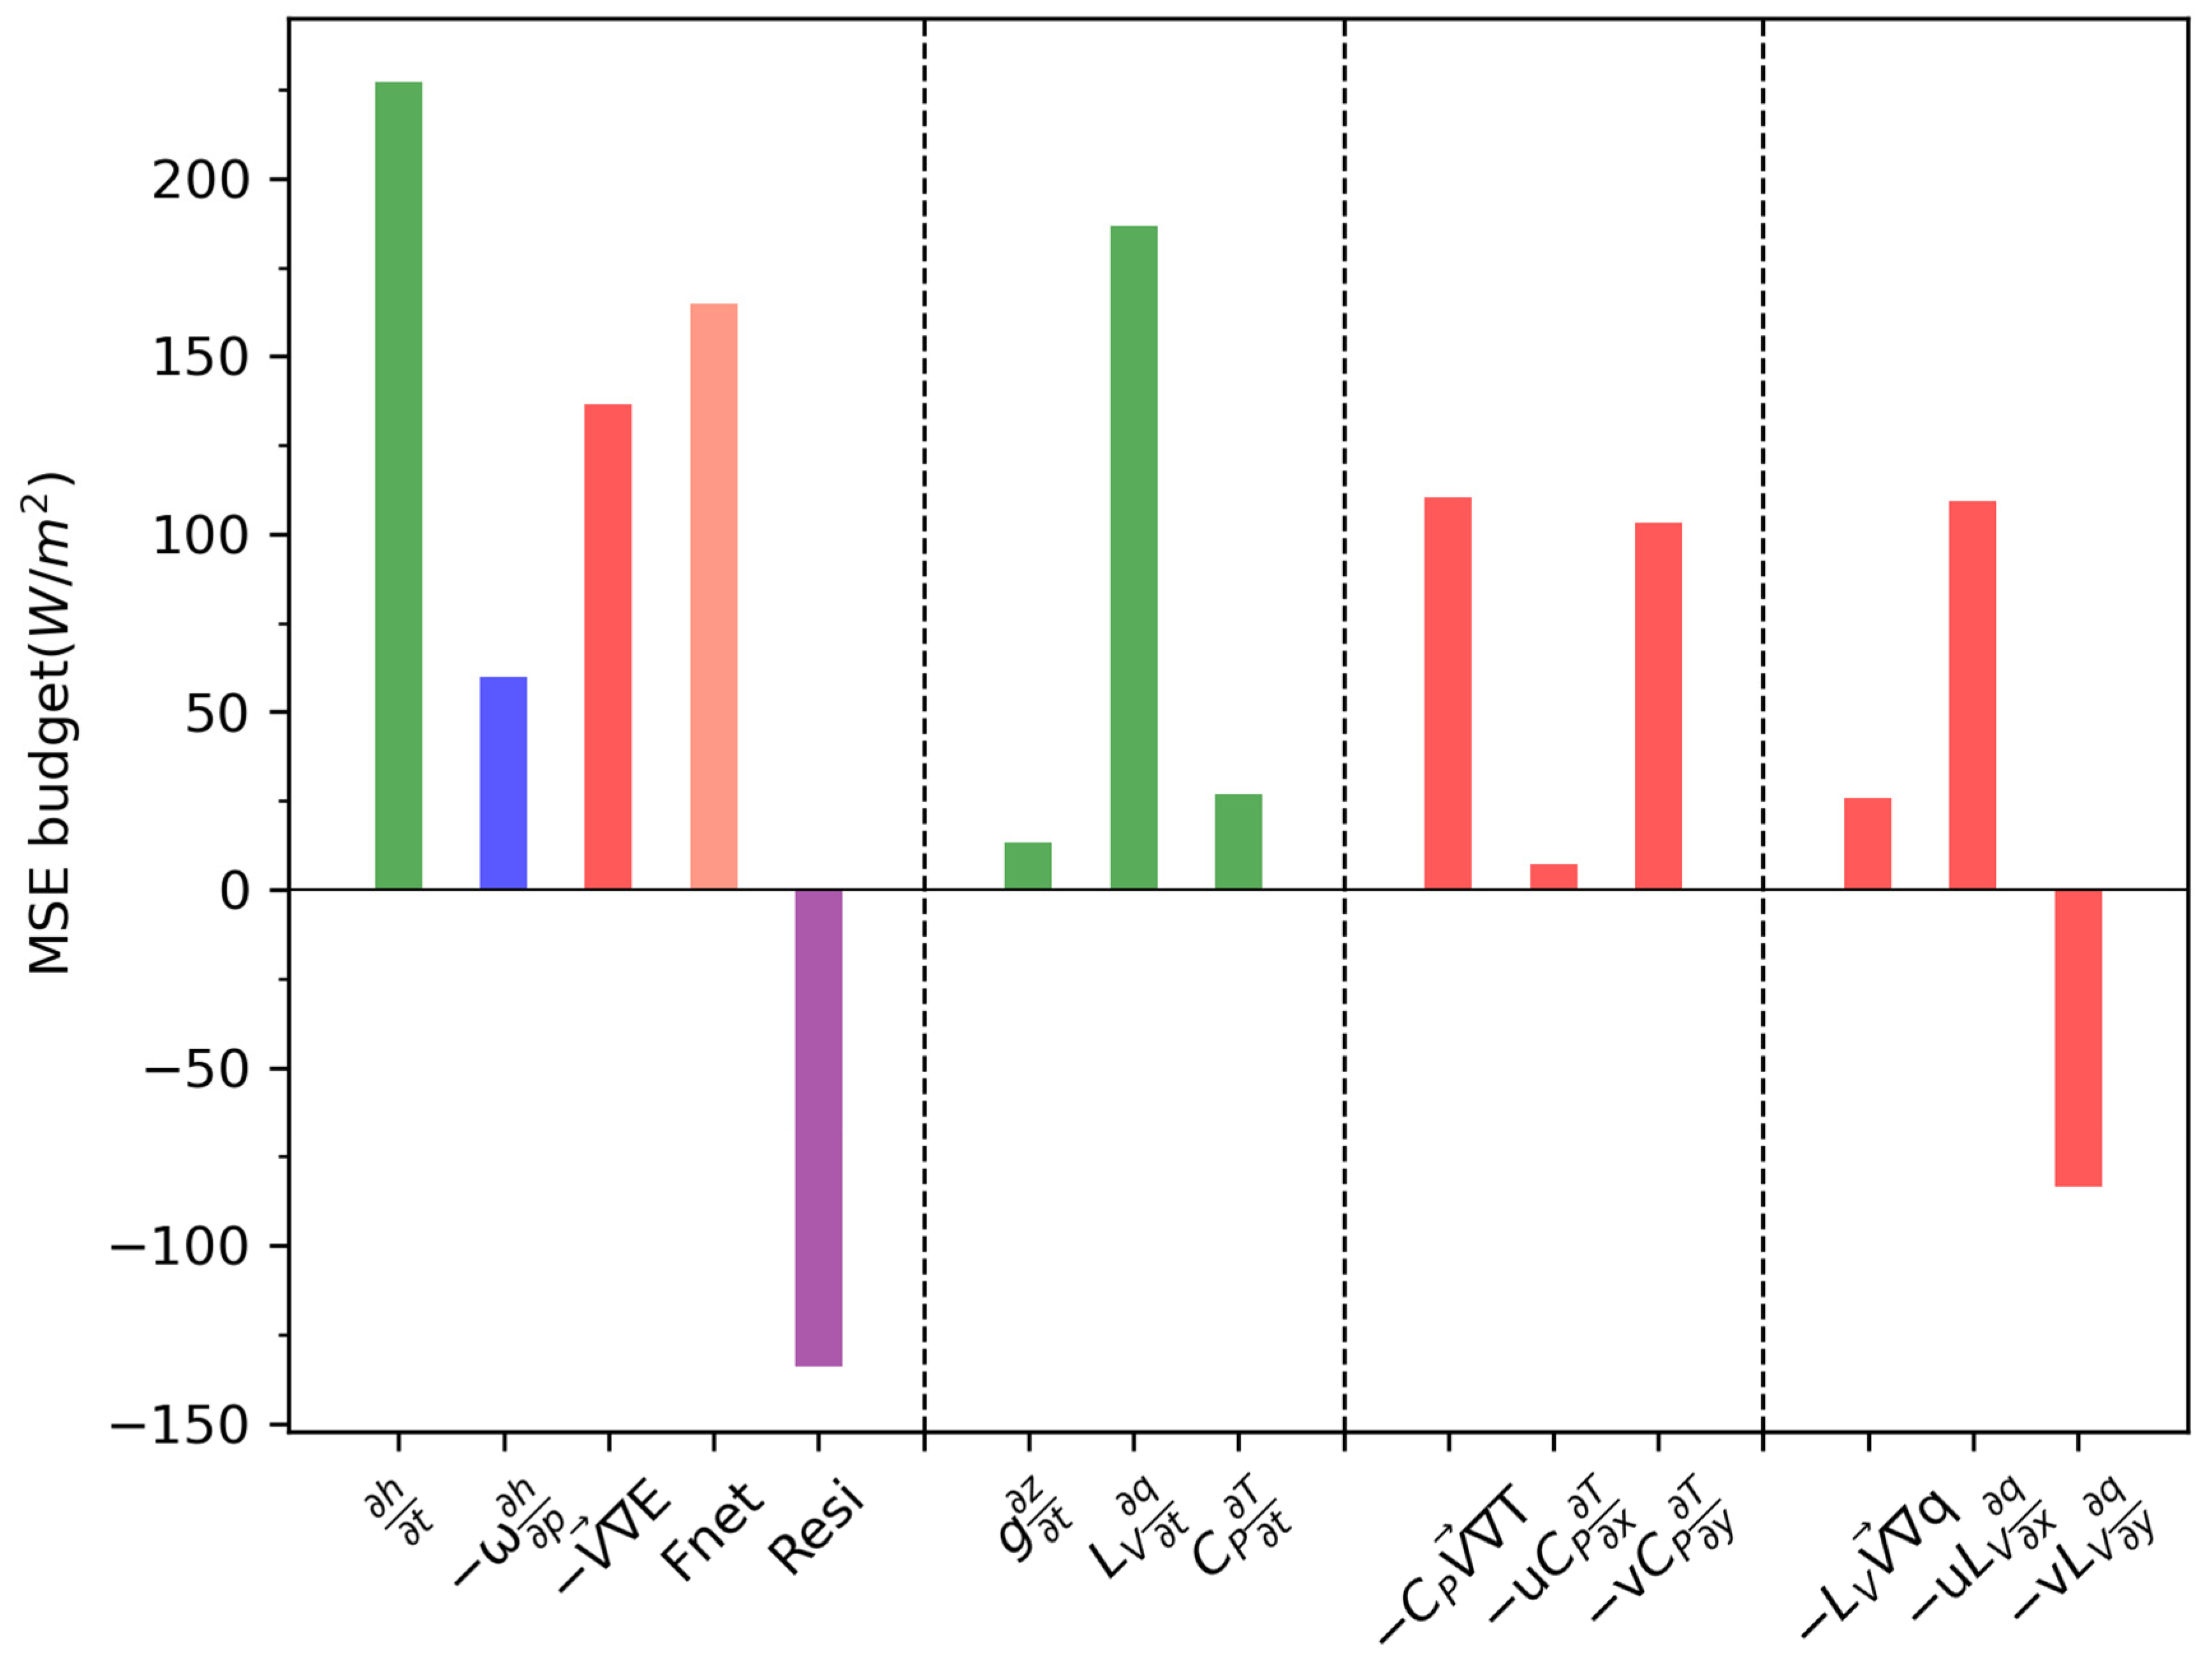
To better understand the contribution of each term to the onset time of non-nocturnal WSWR events, the budget was investigated (Figure 10). The value of the vertical integrated MSE tendency is 227 W/m², which is much bigger than that for nocturnal WSWR events (73 W/m²) in Figure 6. This indicates that for WSWR occurring during daytime, the accumulated energy is more significant. The net energy flux (165 W/m²) drives the increase in MSE, followed by moist enthalpy advection (136 W/m²) and vertical MSE advection (59 W/m²). In breaking down the moist enthalpy advection, the internal energy advection (111 W/m²) is larger than the latent energy advection (26 W/m²), and the meridional component (103 W/m²) dominates the increase in internal energy advection.
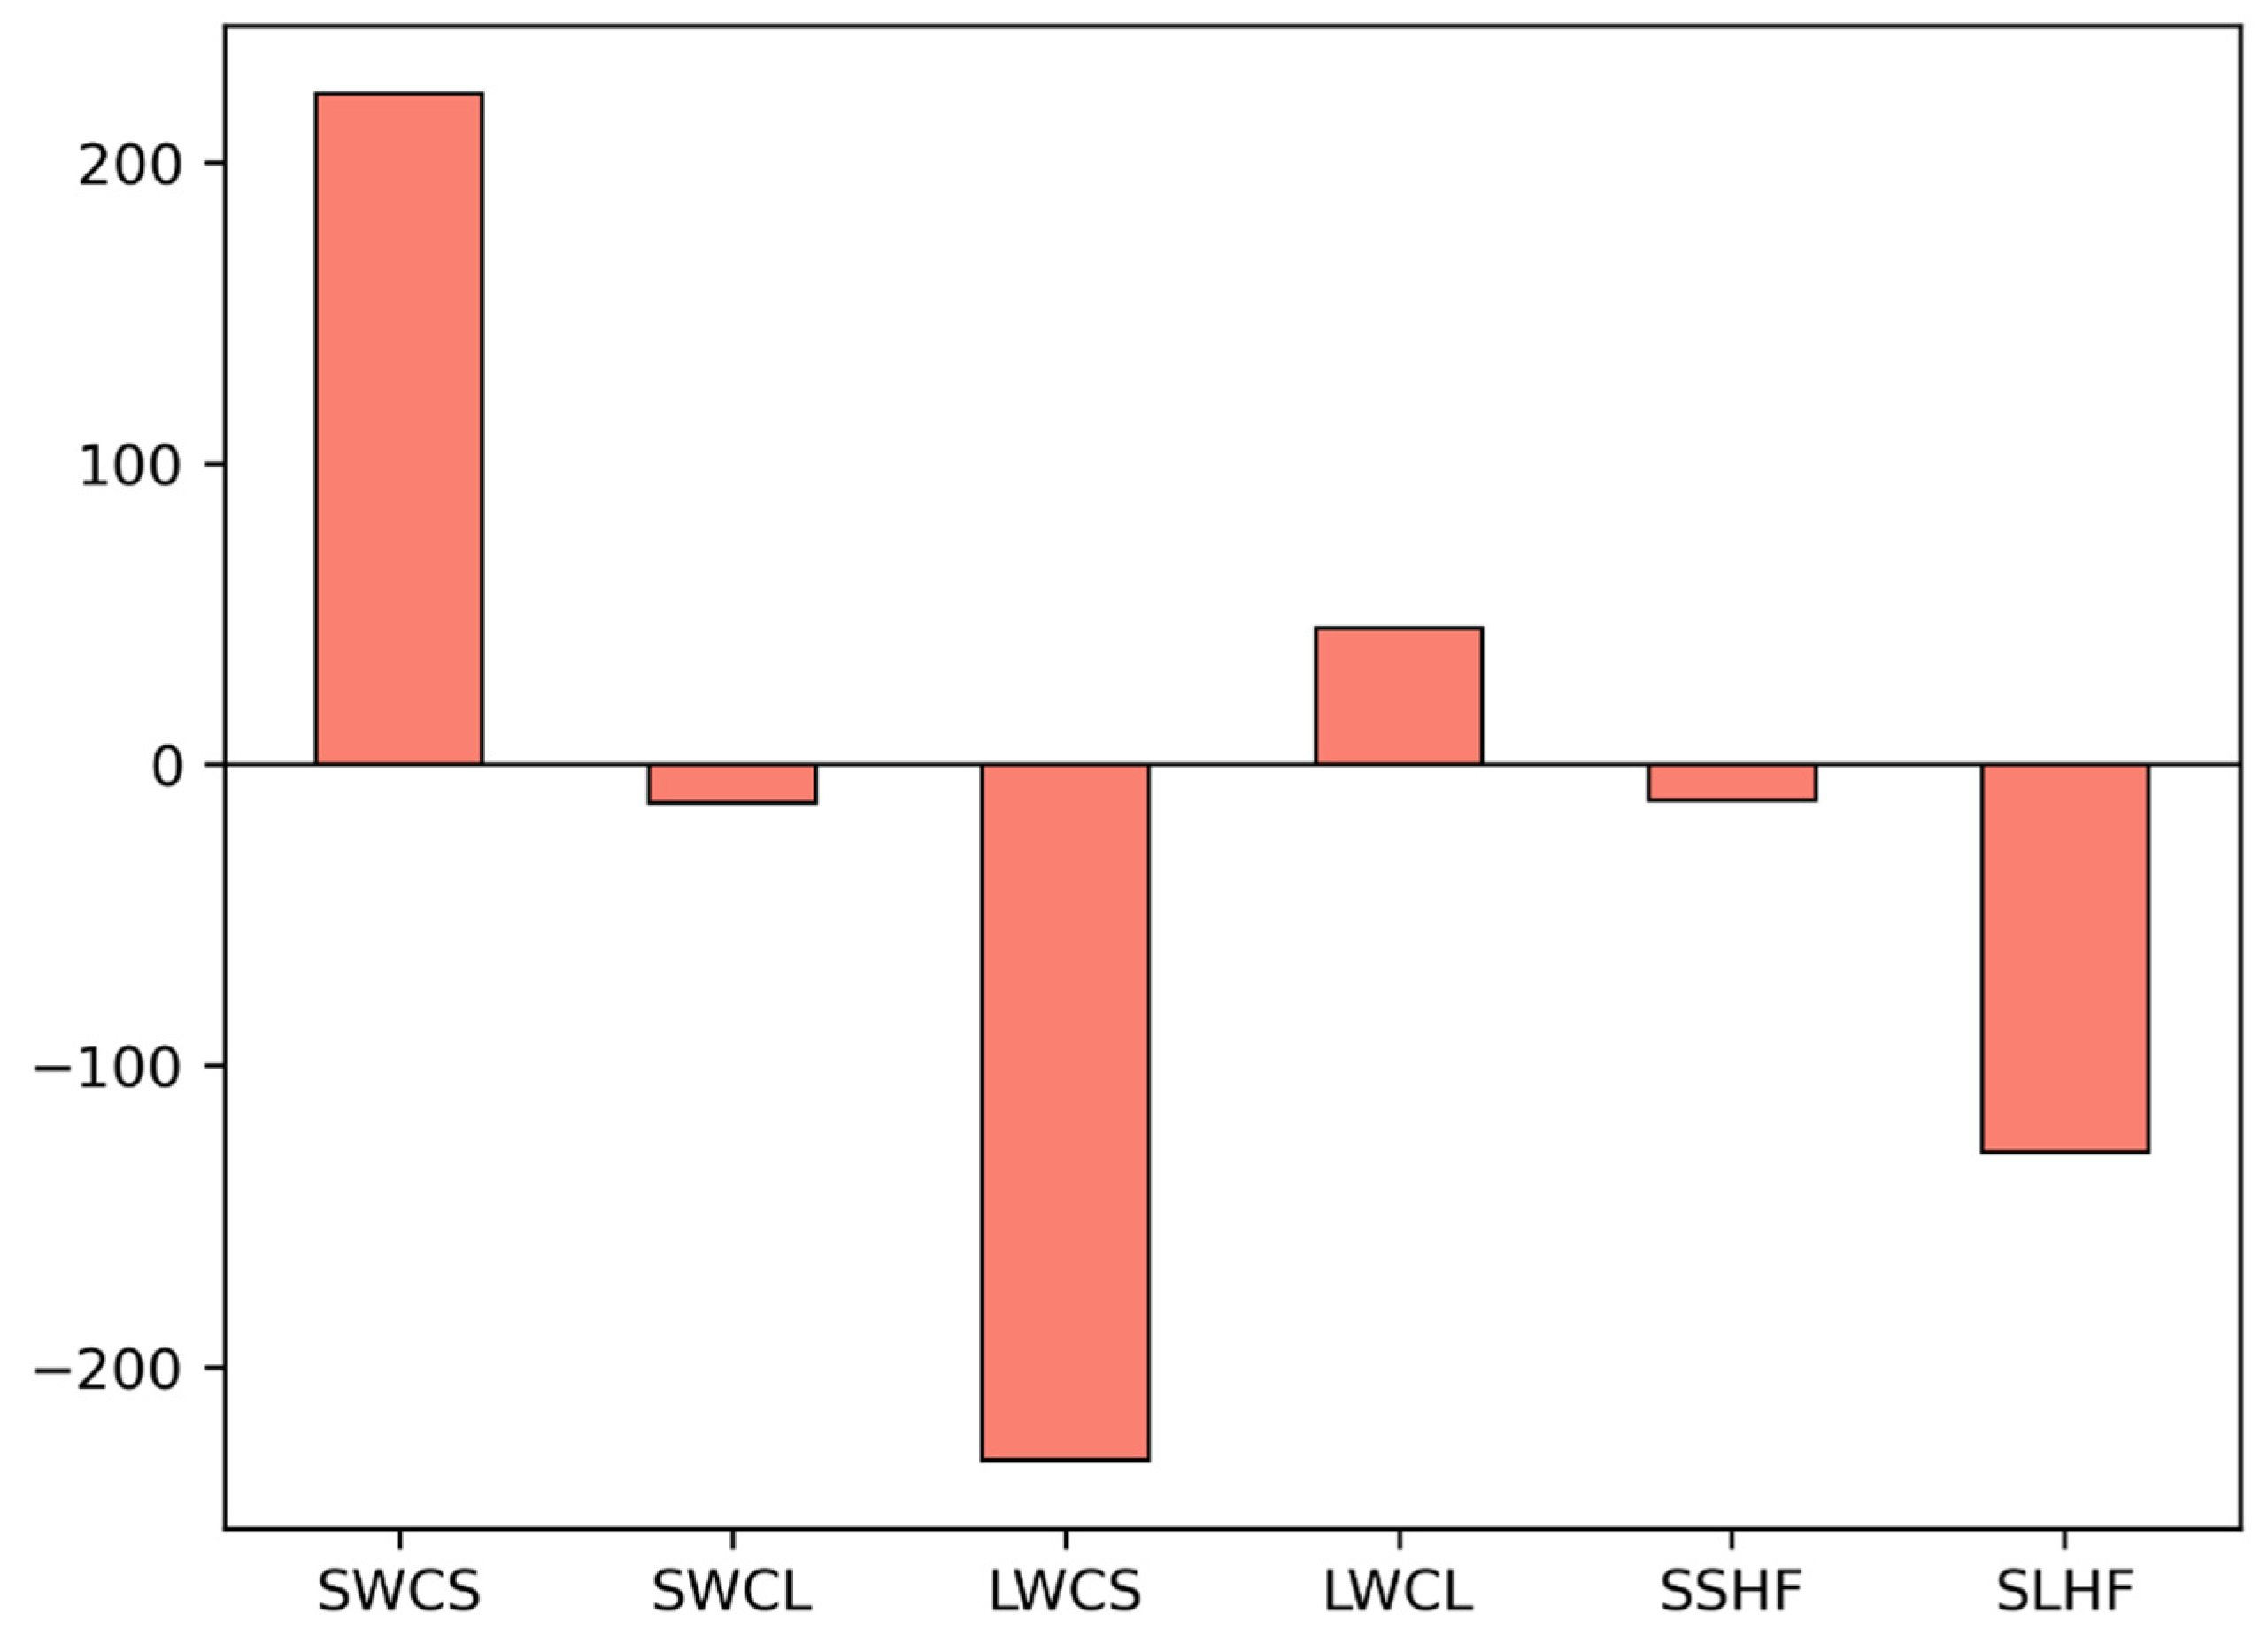
In conclusion, for the non-nocturnal WSWR events, the vertical integrated MSE tendency is greater than that for nocturnal WSWR cases; net energy flux drives the increase in MSE, followed by moist enthalpy advection. The internal energy advection is larger than latent energy advection, with meridional internal energy advection being the main driver for the increase in internal energy advection. Due to the dominant role of net flux energy, it is necessary to study its budget (Figure 11). The net energy flux budget shows that SWCS (223 W/m²) is the most dominant.
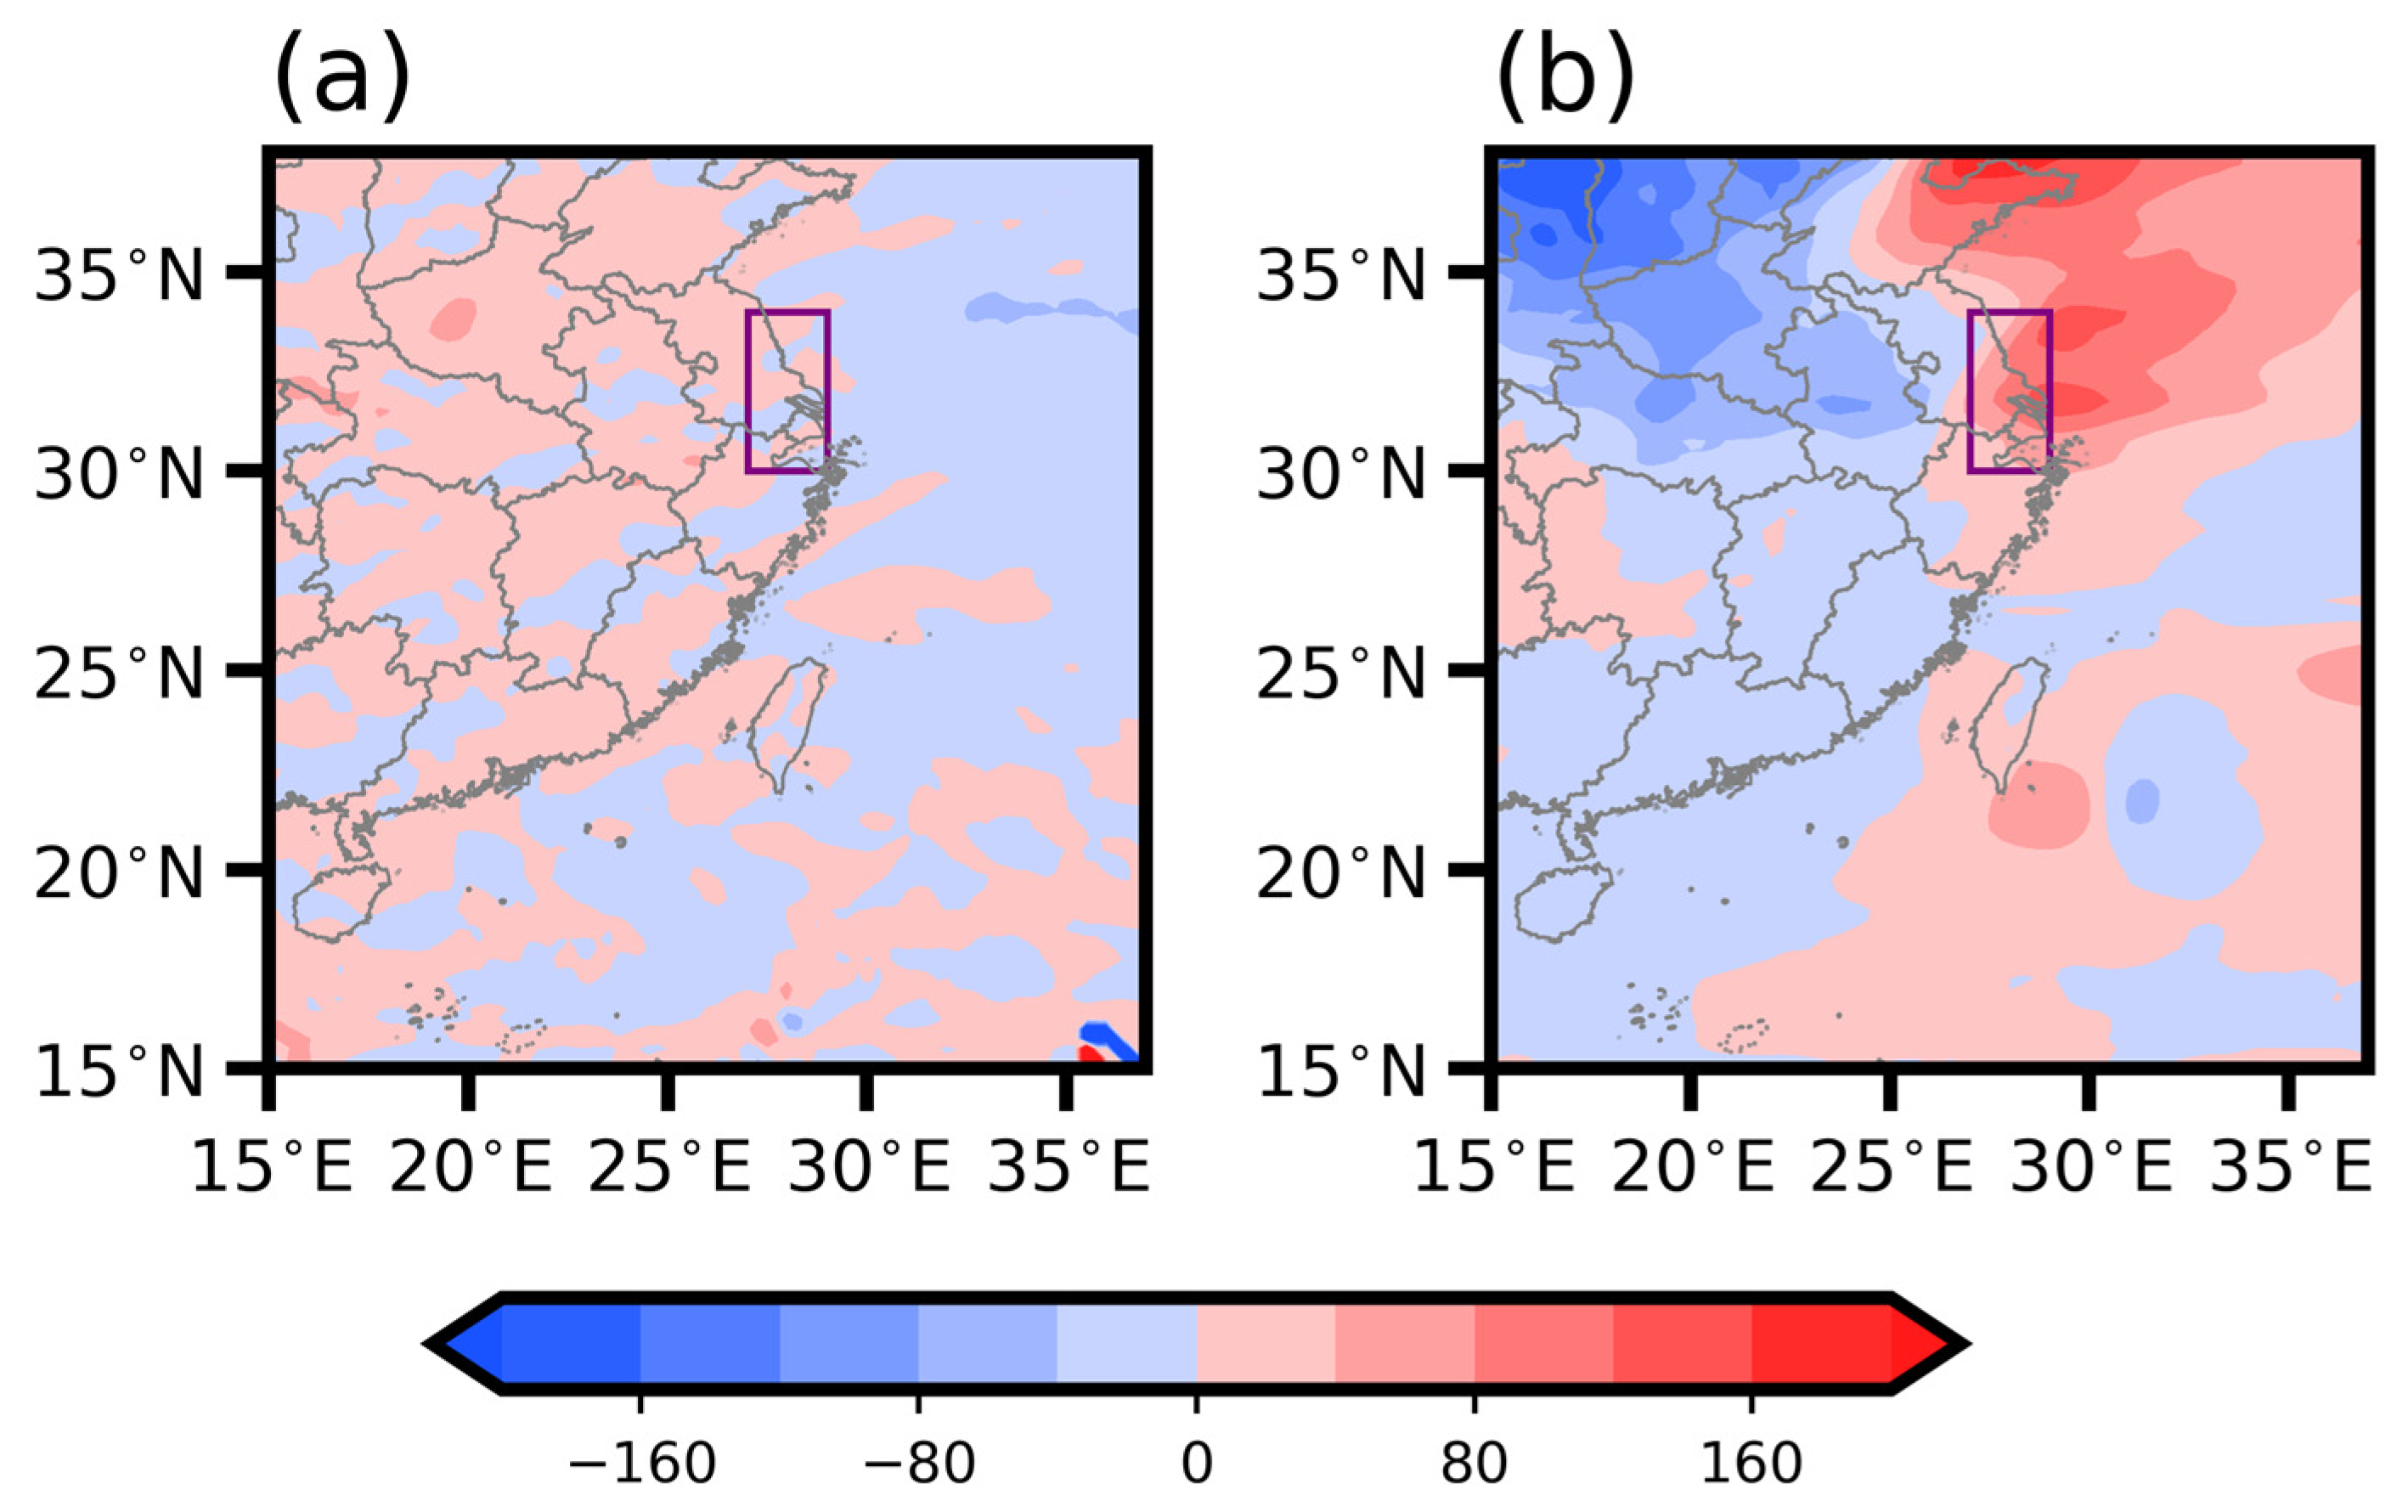
Given the significant role of meridional internal energy advection, a scale analysis was further conducted. As displayed in Figure 12b, a pronounced positive center is evident above the YHCA, constituted by disturbance meridional wind and mean temperature. This indicates strong meridional internal advection near the YHCA.

5. Conclusions and Discussion

The occurrence, maintenance, and dissipation of warm-sector heavy rainfall with warm shear (WSWR) have a close relationship with an unstable atmosphere. Moist static energy (MSE) contains the main energy process, enabling an analysis of precipitation characteristics and timing from the perspective of energy conservation and transformation.
The vertical integrated MSE tendency shows a peak before the precipitation reaches its maximum, indicating the rapid energy accumulation prior to the onset of WSWR. An examination of the vertical integrated MSE tendency budget revealed that for the onset of WSWR, moist enthalpy advection plays an important role in increasing the MSE. Additionally, the negative vertical advection of MSE suggests that upward motions and rainfall events can act as energy-dissipative forces.
By dividing the WSWR events into nocturnal rain and non-nocturnal rain, new insights into the two types of WSWR events are further provided from the perspective of energy. The increase in MSE for nocturnal WSWR is primarily attributed to moist enthalpy advection. This rise is facilitated by the robust meridional latent energy advection. This is because the north–south boundary layer jet efficiently transports abundant moist air. Scale analysis revealed strong meridional latent energy advection above the YHCA, which was calculated from the mesoscale disturbance meridional wind and mean specific humidity. For non-nocturnal WSWR cases, due to the solar radiation during the daytime, the vertical integrated MSE tendency is greater than that for the nocturnal WSWR events. The increase in MSE is mainly driven by the net energy flux, with SWCS having a significant influence in augmenting this net energy flux. Upon examining the moist enthalpy advection, which is the second most dominant term, the internal energy advection was found to exceed the latent energy advection before the onset of precipitation. Notably, meridional internal energy advection significantly contributes to this increase in internal energy advection. This was determined using the disturbance meridional wind, which signifies the mesoscale disturbance field, in conjunction with the mean temperature, which represents the large-scale field.
The research presented above contributes to a deeper knowledge of WSWR from the perspective of energy along the YHCA. However, it is important to note that our study focused solely on southerly WSWR events in this region, indicating the need for further investigation into various types of WSWR phenomena. In future studies, our goal is to more precisely quantify the roles of both meridional latent energy advection and meridional internal energy advection. We plan to identify a series of objective thresholds for these physical variables through statistical analysis and numerical simulations. This effort aims to explore how they can be effectively applied to improve WSWR forecasting over the YHCA. Additionally, numerical experiments will be crucial in assessing the contribution of each factor, thereby deepening our understanding of the underlying atmospheric mechanisms.

Author Contributions

Conceptualization, L.Z.; methodology, L.Z. and Y.Y.; software, Y.Y.; validation, Y.Y.; formal analysis, Y.Y.; investigation, L.Z.; resources, L.Z.; data curation, Y.Y.; writing—original draft preparation, Y.Y.; writing—review and editing, L.Z.; visualization, Y.Y.; supervision, L.Z.; funding acquisition, L.Z. All authors have read and agreed to the published version of the manuscript.

Funding

This study was jointly supported by the National Key R&D Program of China (Grant No. 2017YFC1502002).

Institutional Review Board Statement

Not applicable.

Informed Consent Statement

Not applicable.

Data Availability Statement

The CMORPH precipitation data that support the findings of this study are available at https://doi.org/10.1002/2013JD020686 (accessed on 1 October 2021) [34]. The Era5 hourly reanalysis data on the pressure level are available at https://cds.climate.copernicus.eu/cdsapp#!/dataset/reanalysis-era5-pressure-levels (accessed on 1 October 2021) The Era5 radiation data are available at https://cds.climate.copernicus.eu/cdsapp#!/dataset/reanalysis-era5-single-levels?tab=form (accessed on 1 October 2021) [35]. The authors declare no potential conflict of interest with respect to the research, authorship, and/or publication of this article.

Acknowledgments

We would like to express our gratitude to Zeyi Wang for her assistance with the radiation calculations and to Lin Ouyang for his help in debugging our code.

Conflicts of Interest

The authors declare no conflict of interest.

References

  1. Huang, S.S. The Heavy Rain during the Pre-Summer Period Over Southern China (In Chinese); Guangdong Technology Press: Guangzhou, China, 1986. [Google Scholar]
  2. Zhang, L.; Ma, X.; Zhu, S.; Guo, Z.; Zhi, X.; Chen, C. Analyses and Applications of the Precursor Signals of a Kind of Warm Sector Heavy Rainfall over the Coast of Guangdong, China. Atmos. Res. 2022, 280, 106425. [Google Scholar] [CrossRef]
  3. Luo, Y.; Sun, J.; Li, Y.; Xia, R.; Du, Y.; Yang, S.; Zhang, Y.; Chen, J.; Dai, K.; Shen, X.; et al. Science and Prediction of Heavy Rainfall over China: Research Progress since the Reform and Opening-Up of New China. J. Meteorol. Res. 2020, 34, 427–459. [Google Scholar] [CrossRef]
  4. Sun, J.; Zhang, Y.; Liu, R.; Fu, S.; Tian, F. A Review of Research on Warm-Sector Heavy Rainfall in China. Adv. Atmos. Sci. 2019, 36, 1299–1307. [Google Scholar] [CrossRef]
  5. Zhang, M.; Meng, Z. Warm-Sector Heavy Rainfall in Southern China and Its WRF Simulation Evaluation: A Low-Level-Jet Perspective. Mon. Weather Rev. 2019, 147, 4461–4480. [Google Scholar] [CrossRef]
  6. Luo, Y.; Zhang, R.; Wan, Q.; Wang, B.; Wong, W.K.; Hu, Z.; Jou, B.J.; Lin, Y.; Johnson, R.H.; Chang, C.; et al. The Southern China Monsoon Rainfall Experiment (SCMREX). Bull. Am. Meteorol. Soc. 2017, 98, 999–1013. [Google Scholar] [CrossRef]
  7. Xu, D.S.; Chen, H.W.; Leung, J.C.; Huang, H.; Zhang, B.L. Sensitivity of Nocturnal Warm Sector Rainfall Simulation to the Configuration of Initial and Lateral Boundary Conditions: A Case Study in Southern China Based on the Operational TRAMS Model. JGR Atmos. 2023, 128, e2022JD038452. [Google Scholar] [CrossRef]
  8. Pu, Y.; Hu, S.; Luo, Y.; Liu, X.; Hu, L.; Ye, L.; Li, H.; Xia, F.; Gao, L. Multiscale Perspectives on an Extreme Warm-Sector Rainfall Event over Coastal South China. Remote Sens. 2022, 14, 3110. [Google Scholar] [CrossRef]
  9. Du, Y.; Shen, Y.; Chen, G. Influence of Coastal Marine Boundary Layer Jets on Rainfall in South China. Adv. Atmos. Sci. 2022, 39, 782–801. [Google Scholar] [CrossRef]
  10. Li, S.; Meng, Z.; Wu, N. A Preliminary Study on the Organizational Modes of Mesoscale Convective Systems Associated with Warm-Sector Heavy Rainfall in South China. JGR Atmos. 2021, 126, e2021JD034587. [Google Scholar] [CrossRef]
  11. Han, B.; Du, Y.; Wu, C.; Liu, X. Microphysical Characteristics of the Coexisting Frontal and Warm-Sector Heavy Rainfall in South China. J. Geophys. Res. Atmos. 2021, 126, e2021JD035446. [Google Scholar] [CrossRef]
  12. Dong, F.; Zhi, X.; Zhang, L.; Ye, C. Diurnal Variations of Coastal Boundary Layer Jets over the Northern South China Sea and Their Impacts on Diurnal Cycle of Rainfall over Southern China during the Early-Summer Rainy Season. Mon. Weather Rev. 2021, 149, 3341–3363. [Google Scholar] [CrossRef]
  13. Du, Y.; Chen, G.; Han, B.; Bai, L.; Li, M. Convection Initiation and Growth at the Coast of South China. Part II: Effects of the Terrain, Coastline, and Cold Pools. Mon. Weather Rev. 2020, 148, 3871–3892. [Google Scholar] [CrossRef]
  14. Du, Y.; Chen, G. Heavy Rainfall Associated with Double Low-Level Jets over Southern China. Part II: Convection Initiation. Mon. Weather Rev. 2019, 147, 543–565. [Google Scholar] [CrossRef]
  15. Wu, N.; Ding, X.; Wen, Z.; Chen, G.; Meng, Z.; Lin, L.; Min, J. Contrasting Frontal and Warm-Sector Heavy Rainfalls over South China during the Early-Summer Rainy Season. Atmos. Res. 2020, 235, 104693. [Google Scholar] [CrossRef]
  16. Wang, Z.; Chen, X.; Zhou, T. The onset and seasonal march of East Asian summer monsoon from perspective of moist static energy. Chin. Sci. Bull. 2021, 66, 3744–3756. [Google Scholar] [CrossRef]
  17. Zhang, Y.; Fueglistaler, S. How Tropical Convection Couples High Moist Static Energy Over Land and Ocean. Geophys. Res. Lett. 2020, 47, e2019GL086387. [Google Scholar] [CrossRef]
  18. Zheng, T.; Feng, T.; Xu, K.; Cheng, X. Precipitation and the Associated Moist Static Energy Budget off Western Australia in Conjunction with Ningaloo Niño. Front. Earth Sci. 2020, 8, 597915. [Google Scholar] [CrossRef]
  19. Wang, T.; Li, T. Diagnosing the Column-Integrated Moist Static Energy Budget Associated with the Northward-Propagating Boreal Summer Intraseasonal Oscillation. Clim. Dyn. 2020, 54, 4711–4732. [Google Scholar] [CrossRef]
  20. Adames, Á.F.; Ming, Y. Moisture and Moist Static Energy Budgets of South Asian Monsoon Low Pressure Systems in GFDL AM4.0. J. Atmos. Sci. 2018, 75, 2107–2123. [Google Scholar] [CrossRef]
  21. Inoue, K.; Back, L. Column-Integrated Moist Static Energy Budget Analysis on Various Time Scales during TOGA COARE. J. Atmos. Sci. 2015, 72, 1856–1871. [Google Scholar] [CrossRef]
  22. Kiranmayi, L.; Maloney, E.D. Intraseasonal Moist Static Energy Budget in Reanalysis Data: Intraseasonal Mse Budget in Ncep and Era. J. Geophys. Res. 2011, 116, D21. [Google Scholar] [CrossRef]
  23. Maloney, E.D. The Moist Static Energy Budget of a Composite Tropical Intraseasonal Oscillation in a Climate Model. J. Clim. 2009, 22, 711–729. [Google Scholar] [CrossRef]
  24. Back, L.E.; Bretherton, C.S. Geographic Variability in the Export of Moist Static Energy and Vertical Motion Profiles in the Tropical Pacific. Geophys. Res. Lett. 2006, 33, L17810. [Google Scholar] [CrossRef]
  25. Fontaine, B.; Philippon, N.; Camberlin, P. An Improvement of June-September Rainfall Forecasting in the Sahel Based upon Region April-May Moist Static Energy Content (1968–1997). Geophys. Res. Lett. 1999, 26, 2041–2044. [Google Scholar] [CrossRef]
  26. Privé, N.C.; Plumb, R.A. Monsoon Dynamics with Interactive Forcing. Part I: Axisymmetric Studies. J. Atmos. Sci. 2007, 64, 1417–1430. [Google Scholar] [CrossRef]
  27. Neelin, J.D.; Held, I.M. Modeling Tropical Convergence Based on the Moist Static Energy Budget. Mon. Weather Rev. 1987, 115, 3–12. [Google Scholar] [CrossRef]
  28. Neelin, J.D.; Chou, C.; Su, H. Tropical Drought Regions in Global Warming and El Niño Teleconnections. Geophys. Res. Lett. 2003, 30, 24. [Google Scholar] [CrossRef]
  29. Neelin, J.D.; Su, H. Moist Teleconnection Mechanisms for the Tropical South American and Atlantic Sector. J. Clim. 2005, 18, 3928–3950. [Google Scholar] [CrossRef]
  30. Chou, C.; Neelin, J.D. Mechanisms Limiting the Northward Extent of the Northern Summer Monsoons over North America, Asia, and Africa. J. Clim. 2003, 16, 406–425. [Google Scholar] [CrossRef]
  31. Chen, J.; Bordoni, S. Orographic Effects of the Tibetan Plateau on the East Asian Summer Monsoon: An Energetic Perspective. J. Clim. 2014, 27, 3052–3072. [Google Scholar] [CrossRef]
  32. Yao, J.; Zhou, T.; Guo, Z.; Chen, X.; Zou, L.; Sun, Y. Improved Performance of High-Resolution Atmospheric Models in Simulating the East Asian Summer Monsoon Rain Belt. J. Clim. 2017, 30, 8825–8840. [Google Scholar] [CrossRef]
  33. Joyce, R.J.; Janowiak, J.E.; Arkin, P.A.; Xie, P. CMORPH: A Method That Produces Global Precipitation Estimates from Passive Microwave and Infrared Data at High Spatial and Temporal Resolution. J. Hydrometeor 2004, 5, 487–503. [Google Scholar] [CrossRef]
  34. Shen, Y.; Zhao, P.; Pan, Y.; Yu, J. A High Spatiotemporal Gauge-Satellite Merged Precipitation Analysis over China. J. Geophys. Res. Atmos. 2014, 119, 3063–3075. [Google Scholar] [CrossRef]
  35. Hersbach, H.; Bell, B.; Berrisford, P.; Hirahara, S.; Horányi, A.; Muñoz-Sabater, J.; Nicolas, J.; Peubey, C.; Radu, R.; Schepers, D.; et al. The ERA5 Global Reanalysis. Q. J. R. Meteorol. Soc. 2020, 146, 1999–2049. [Google Scholar] [CrossRef]
  36. Song, L.; Zhang, L. Objective Identification and Analysis of Warm-Sector Rainstorm with Warm Shear Pattern over Yangtze-Huaihe River Region. Chin. J. Atmos. Sci. 2022, 47. [Google Scholar] [CrossRef]
  37. Zhang, L.; Song, L.; Zhu, S.; Guo, Z.; Wang, H.; Zhou, L.; Chen, C.; Zhi, X. Forecasts of the Warm-Sector Heavy Rainfall with a Warm Shear Pattern Over Coastal Areas of the Yangtze–Huaihe River in a Regional Business Forecast Model. Front. Earth Sci. 2022, 10, 938336. [Google Scholar] [CrossRef]
  38. Fu, J.; Zhang, F.; Hewson, T.D. Object-Oriented Composite Analysis of Warm-Sector Rainfall in North China. Mon. Weather Rev. 2020, 148, 2719–2735. [Google Scholar] [CrossRef]
  39. Ji, L.; Zhi, X.; Simmer, C.; Zhu, S.; Ji, Y. Multimodel Ensemble Forecasts of Precipitation Based on an Object-Based Diagnostic Evaluation. Mon. Weather Rev. 2020, 148, 2591–2606. [Google Scholar] [CrossRef]
  40. Vizy, E.K.; Cook, K.H. Mesoscale Convective Systems and Nocturnal Rainfall over the West African Sahel: Role of the Inter-Tropical Front. Clim. Dyn. 2018, 50, 587–614. [Google Scholar] [CrossRef]
  41. Chen, H.; Yu, R.; Li, J.; Yuan, W.; Zhou, T. Why Nocturnal Long-Duration Rainfall Presents an Eastward-Delayed Diurnal Phase of Rainfall down the Yangtze River Valley. J. Clim. 2010, 23, 905–917. [Google Scholar] [CrossRef]
  42. Holton, J.R. The Diurnal Boundary Layer Wind Oscillation above Sloping Terrain. Tellus 1967, 19, 200–205. [Google Scholar] [CrossRef]
  43. Nicolini, M.; Waldron, K.M.; Paegle, J. Diurnal Oscillations of Low-Level Jets, Vertical Motion, and Precipitation: A Model Case Study. Mon. Weather Rev. 1993, 121, 2588–2610. [Google Scholar] [CrossRef]
  44. Huang, L.; Luo, Y.; Bai, L. An Evaluation of Convection-Permitting Ensemble Simulations of Coastal Nocturnal Rainfall Over South China During the Early-Summer Rainy Season. J. Geophys. Res. Atmos. 2022, 127, e2021JD035656. [Google Scholar] [CrossRef]
  45. Zhang, Y.; Xue, M.; Zhu, K.; Zhou, B. What Is the Main Cause of Diurnal Variation and Nocturnal Peak of Summer Precipitation in Sichuan Basin, China? The Key Role of Boundary Layer Low-Level Jet Inertial Oscillations. J. Geophys. Res. Atmos. 2019, 124, 2643–2664. [Google Scholar] [CrossRef]
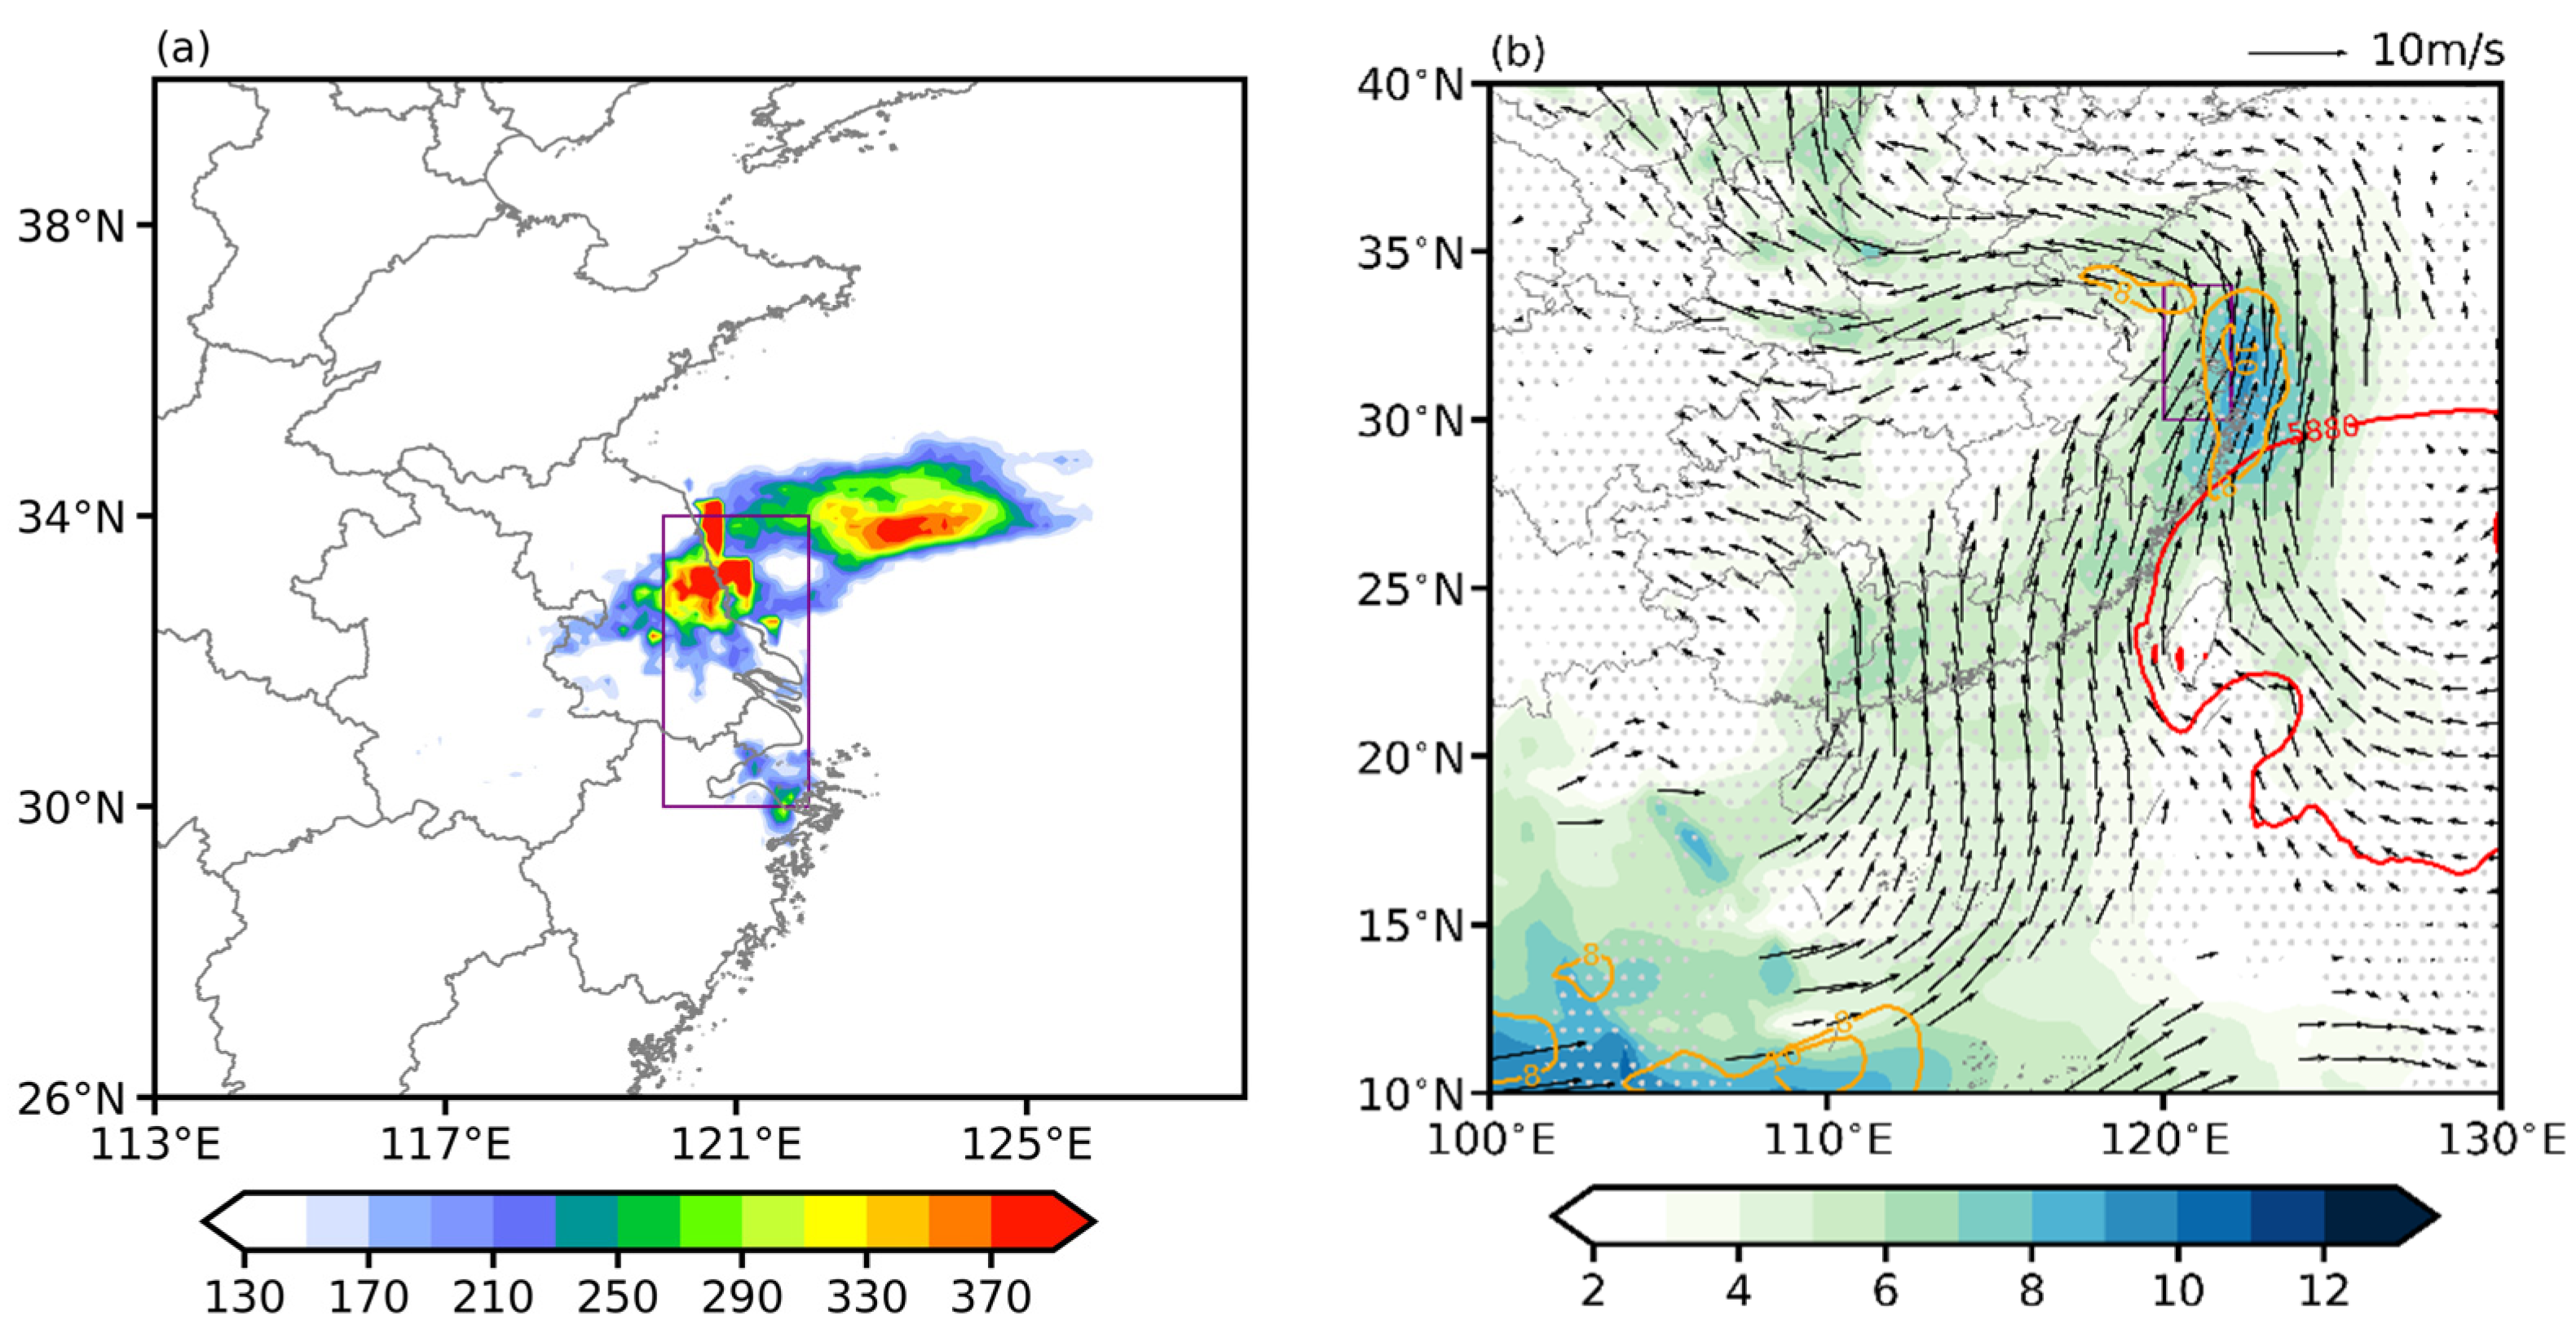
Figure 1. The accumulated rainfall (mm) (a) and the composite horizontal wind (b) at 850 hPa (arrow, ms−1, arrow fields are statistically significant at a 95% confidence level) and at 950 hPa (orange contour). The red solid line refers to 5880 contours of geopotential height (gpm) at 500 hPa at WSWR peak moments. The purple rectangle refers to the YHCA.
Atmosphere 14 01730 g001
Figure 2. Composite of vertical integrated MSE tendency (curve line) (W/m²) and precipitation (bar) (mm/h) averaged over the YHCA (120–122° E, 30–34° N) (a) and Hangzhou Bay (121–122° E, 30–31° N) (b).
Atmosphere 14 01730 g002
Figure 3. Composite of the vertical integrated MSE tendency budget (W/m²). MSE tendency (a), moist enthalpy horizontal advection and 850 hPa horizontal wind (arrows, m/s) (b), vertical MSE advection (c), and net energy flux into the atmospheric column (d) at WSWR occurrence moments. The purple rectangle refers to the YHCA.
Atmosphere 14 01730 g003
Figure 4. Composite of the vertical integrated MSE budget averaged over the YHCA for nocturnal WSWR events. The red, green, blue, black, and purple lines refer to the vertical integrated MSE tendency, moist enthalpy horizontal advection, net energy flux into the atmospheric column, vertical MSE advection, and residue, respectively.
Atmosphere 14 01730 g004
Figure 5. Composite of the vertical integrated moist enthalpy horizontal advection budget averaged over the YHCA for nocturnal WSWR events. The red, green, blue, black, purple, orange, and magenta refer to the moist enthalpy horizontal advection, internal energy (temperature) advection, latent energy (moisture) advection, zonal internal energy advection, meridional internal energy advection, zonal latent energy advection, and meridional latent energy advection, respectively.
Atmosphere 14 01730 g005
Figure 6. Composite of the vertical integrated MSE tendency budget averaged over the YHCA for nocturnal WSWR occurrence moments. From left to right are the vertical integrated MSE tendency, vertical MSE advection, moist enthalpy horizontal advection, net flux energy, residue, gravitational potential energy tendency, latent heat energy tendency, internal energy tendency, internal energy (temperature) advection, zonal internal energy advection, meridional internal energy advection, latent energy (moisture) advection, zonal latent energy advection, and meridional latent energy advection at nocturnal WSWR occurrence moments.
Atmosphere 14 01730 g006
Figure 7. The meridional latent advection (W/m²) for nocturnal WSWR events at their occurrence moments is derived from the combination of the mean meridional wind and disturbance specific humidity (a), as well as the disturbance meridional wind and mean specific humidity (b). The purple rectangle refers to the YHCA.
Atmosphere 14 01730 g007
Figure 8. The same as Figure 4, but for non-nocturnal WSWR events.
Atmosphere 14 01730 g008
Figure 9. The same as Figure 5, but for non-nocturnal WSWR events.
Atmosphere 14 01730 g009
Figure 10. The same as Figure 6, but for non-nocturnal WSWR events.
Atmosphere 14 01730 g010
Figure 11. Area-averaged net energy flux budget over the YHCA for non-nocturnal WSWR events at their occurrence moments. From left to right are the clear-sky net shortwave radiation, cloud net shortwave radiation, clear-sky net longwave radiation, cloud net longwave radiation, surface sensible heat flux, and surface latent heat flux.
Atmosphere 14 01730 g011
Figure 12. The meridional internal energy advection (W/m²) for non-nocturnal WSWR events at their occurrence moments is derived from the combination of the mean meridional wind and disturbance temperature (a), as well as the disturbance meridional wind and mean temperature (b). The purple rectangle refers to the YHCA.
Atmosphere 14 01730 g012
Table 1. Classification results of the geometric center of the rain cluster at the peak moment (UTC) of south-type WSWR events along the YHCA.
Peak TimeTime SpanType
17 June 2011 15:0017 June 2011 13:00–17 June 2011 17:00Nocturnal rainfall
28 June 2011 17:0028 June 2011 14:00–28 June 2011 20:00Nocturnal rainfall
4 July 2014 18:004 July 2014 14:00–5 July 2014 05:00Nocturnal rainfall
31 August 2014 23:00 31 August 2014 19:00–1 September 2014 02:00 Nocturnal rainfall
10 August 2015 07:0010 August 2015 00:00–11 August 2015 13:00Nocturnal rainfall
29 September 2015 16:0029 September 2015 14:00–30 September 2015 03:00Nocturnal rainfall
26 April 2016 00:0025 April 2016 22:00–26 April 2016 04:00Nocturnal rainfall
2 August 2016 16:002 August 2016 13:00–2 August 2016 21:00Nocturnal rainfall
3 August 2016 02:002 August 2016 22:00–3 August 2016 05:00Nocturnal rainfall
24 August 2010 15:0024 August 2010 08:00–24 August 2010 18:00Non-nocturnal rainfall
2 August 2011 13:002 August 2011 10:00–2 August 2011 15:00Non-nocturnal rainfall
27 July 2014 10:0027 July 2014 07:00–27 July 2014 15:00Non-nocturnal rainfall
7 August 2014 17:007 August 2014 10:00–8 August 2014 06:00Non-nocturnal rainfall
16 September 2016 12:0016 September 2016 11:00–16 September 2016 16:00Non-nocturnal rainfall
Disclaimer/Publisher’s Note: The statements, opinions and data contained in all publications are solely those of the individual author(s) and contributor(s) and not of MDPI and/or the editor(s). MDPI and/or the editor(s) disclaim responsibility for any injury to people or property resulting from any ideas, methods, instructions or products referred to in the content.