Abstract
Heavy rainfall and flood disasters are frequent in mountainous watersheds in southwest China, and forecasting runoff floods in some mountainous watersheds is difficult. In this study, a typical watershed in the southwest mountainous region, the Qingyi River (13,000 km2), was selected for the lack of precipitation observation data in the watershed, and the BTOPMC (block-wise use of the topographic-based hydrologic model (TOPMODEL)) was used, using CMPA-Hourly (China Hourly Merged Precipitation Analysis combining observations from automatic weather stations, meteorological satellite, and weather radar at 0.05° × 0.05° grid) to improve the accuracy of flood forecasting. The results show that the Nash–Sutcliffe efficiency (NSE) of the flood forecast for the verification period in the Jiajiang section of the Qingyi River using CMPA-Hourly improved from 0.66 to 0.78, the flood error reduced from 18% to 9%, and the overall accuracy reached grade B or above. The results indicate that CMPA-Hourly, which integrates ground observation–radar–satellite precipitation, effectively combined the advantages of different sources of data to improve the resolution and accuracy of precipitation data, and then CMPA-Hourly can be used to improve the accuracy of runoff and flood forecasting.
1. Introduction
Storm floods have become a major disaster threatening our lives and affecting socioeconomic development. The frequency of storm floods and the severity of the damage are beyond comparison with most other disasters. China is located in the East Asian monsoon belt and is the country with the most frequent flooding caused by heavy rainfall and the most severe damage in the world, with more than half of China’s regions suffering from various degrees of flooding. With the development of the national economy and society and the gradual expansion and concentration of population size, the economic loss and death toll per unit of the affected area increase [1,2,3,4], resulting in higher requirements for flood prevention and control capacity building. Effective flood forecasting is an important means to reduce losses and impact. It can not only help to gain a valuable window period for emergency response, but also provide a scientific and reliable decision basis for flood control and dispatch, thereby achieving great socioeconomic benefits in disaster prevention and mitigation.
Precipitation is the key input data source for flood simulation, and high-quality live precipitation data and forecast products are extremely important for improving hydrological forecast accuracy. In practical hydrological applications, the spatial resolution of precipitation data needs to reach 10 km and below, and the temporal resolution needs to reach 1 h to satisfy the requirements of flood forecasting. Precipitation estimation with high spatial and temporal resolution has also become a research hotspot at home and abroad. Some precipitations have a high degree of spatial and temporal variability due to various factors, such as geographic undulating conditions, atmospheric circulation changes, and different subsurfaces [5,6]. Currently, three main ways are available to obtain precipitation information. First, rainfall stations observe precipitation. At present, complex networks of rainfall stations have been built worldwide, but many mountainous or less developed areas still have sparse networks of rainfall stations and greatly lack precipitation observation data, thereby causing difficulty in accurately reflecting the spatial structure of precipitation and satisfying the application requirements of high-precision hydrological simulation, especially flood simulation. Second, the satellite remote sensing inversion of precipitation is not limited by complex terrain, high altitude, and other harsh environments. It provides precipitation data with a continuous spatial and temporal distribution, wide spatial coverage, and finer resolution; it is convenient and efficient to obtain. The spatial and temporal resolution and accuracy of Quantitative Precipitation Estimation (QPE) products for the inversion of precipitation in satellite remote sensing systems have been further improved [7,8]. Some examples include the widely used Precipitation Estimation from Remotely Sensed Information using Artificial Neural Networks (PERSIANN) precipitation product [9], the more mature Climate Prediction Center Morphing Technique (CMORPH) precipitation product [10], the more sophisticated Climate Prediction Center Morphing Technique (CMORPH precipitation product) [11], the widely used Global Precipitation Measurement (GPM) precipitation product [12,13], Tropical Rainfall Measurement Mission (TRMM) Multi-satellite Precipitation Analysis (TMPA) precipitation products [14], and other products that have been used for a long time in water resource conservation and application, drought and flood control, and climate change [15,16,17]. However, although satellite inversion precipitation has a high spatial and temporal resolution, its accuracy still has a certain gap compared with ground-based rain gauge observations [18]. Third, in radar-estimated precipitation, the efficient data transmission and jigsaw network play a good role in enhancing the early warning and monitoring services of sudden disaster weather systems. However, the inversion of precipitation data by radar still has some problems [19], such as the need for a higher spatial and temporal resolution and better spatial continuity of precipitation data, a more accurate integration of radar inversion of precipitation with other precipitation data, the further optimization of the algorithm of radar inversion of precipitation, and the improvement in data assimilation techniques to improve the assimilation of remotely sensed water cycle variables.
Therefore, the further enhancement in the integration of these multiple sources of information, such as ground observations, radar measurements, and satellite remote sensing, is necessary, and their analysis, study, and application are important aspects of the current development of basin hydrological simulation and prediction forecasting techniques [18]. The National Weather Service’s Office of Hydrologic Development and NOAA’s National Severe Storms Laboratory jointly launched the National Mosaic and Multisensor QPE Project (NMQ) working pilot program with a view to improving the resolution and accuracy of precipitation data. With the support of this program, the fusion techniques of radar inversion, satellite remote sensing, ground observation, and other multisource data have developed rapidly [20]. The vast size of China and the very complex topography have caused practical difficulties in radar networking, which has created difficulties in developing satellite–radar observation triple-source fusion precipitation products [21,22]. The Meteorological Information Center of the China Meteorological Administration developed a multisource data fusion suitable for the distribution of a regional precipitation observation station network [23,24,25,26,27], as well as data-fused ground observation, radar inversion, and satellite remote sensing precipitation. This fused precipitation is more spatially representative than any single-source precipitation data and the ground–satellite two-source precipitation fusion product (two-source fusion) [24,28]. However, currently, these data are mainly used in the meteorological field; the applications in other fields are still relatively few and small, mainly for the analysis of a few regions [29,30]. This fused precipitation is more spatially representative than any single-source precipitation data and ground–satellite two-source precipitation fusion products [24,28], but currently, these data are mainly used in the meteorological field, and the applications in other fields are still relatively few and small, mainly for the analysis of few regions. The study area is the Qingyi River (13,000 km2), a typical watershed in the southwest mountainous region. The main tributaries of the Qingyi River are fan-shaped, and most of the floods in the basin tend to converge at the same time, resulting in frequent floods in the mainstream of the Qingyi River, characterized by the steep rise and fall of floods. The area is mountainous, and its geological conditions are fragile, which is very likely to cause geological disasters. At present, the research on flood forecasting in the Qingyi River basin is still weak, and the high-precision flood forecasting in this region is greatly important for water conservancy projects, flood control, and water resource management. We use CMPA precipitation and hourly observed precipitation from meteorological stations to drive the distributed hydrological model, the block-wise use of the topographic-based hydrologic model (TOPMODEL) (BTOPMC), and separately calibrate its parameters to study the effects of different precipitation products on the accuracy of flood forecasting in a typical watershed in the southwest mountainous region. Meanwhile, because CMPA precipitation data incorporate precipitation information from ground stations, the previous use of ground-observed precipitation to verify the accuracy of precipitation products becomes inapplicable, and the use of the runoff flood forecast effectiveness test can be an effective solution to test the quality of precipitation products. Figure 1 shows the research framework for this research paper.
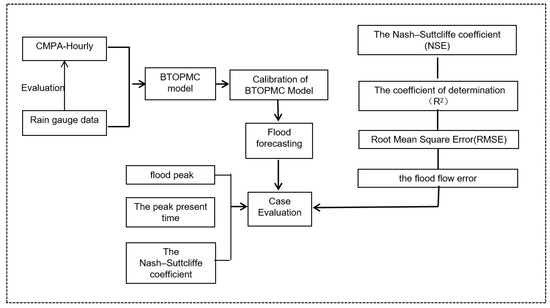
Figure 1.
The workflow of this study.
2. Materials and Methods
2.1. Study Area
We selected the typical watershed of the Qingyi River in the southwest mountainous region as the study area (Figure 2). It is a tributary of the upper reaches of the Yangtze River and belongs to the southwest mountainous region of China, located on the southeastern edge and under the background of the large topography of the Tibetan Plateau, under the combined influence of large, medium, and small composite topographies with steep valleys, a great variability in atmospheric characteristics, diverse weather and climate, very complex causes, frequent weather and climate disasters, frequent heavy rainfall, and flash floods, and it is a heavy-rainfall area far from the sea in China [26]. Hydrological forecasting in this region is extremely difficult due to the sparse representation of rainfall gauge stations in the area and the weak comprehensive observation capability. The water resources of the Qingyi River become abundant and stable due to adequate precipitation, and the annual water production of each major tributary in the Yangtze River basin ranks among the top three major rivers in China.
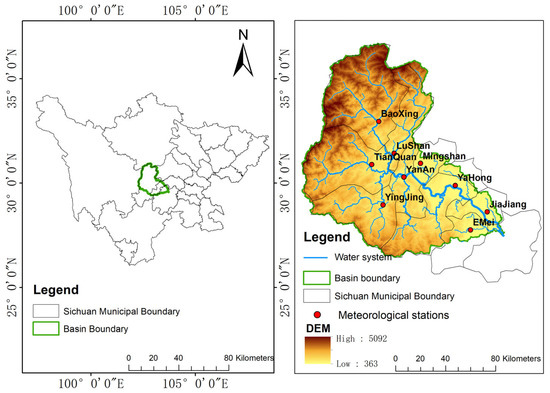
Figure 2.
Digital Elevation Model (DEM) and gauge stations in Qingyi River basin.
2.2. Data
2.2.1. Rain Gauge Data
Precipitation data from the observed ground were used, and the data source was http://data.cma.cn/(accessed on 21 June 2021). The Qingyi River basin has 10 rainfall gauge stations (Table 1, Figure 1), and the temporal resolution of precipitation is 1 h. The precipitation period is 2015–2020, and the gauge rainfall data have been quality-controlled. The hydrological station of Jiajiang at the outlet section of the Qingyi River basin was selected (Table 1, Figure 1), and hourly flow data from 2015 to 2020 were used. The discharge station data were obtained from the Sichuan Hydrological Bureau, which is authentic and reliable.

Table 1.
Station distribution of weather stations and hydrological stations in the Qingyi River.
2.2.2. CMPA-Hourly
The CMPA-Hourly precipitation product was obtained from the Meteorological Information Center of the China Meteorological Administration, hereafter referred to as CMPA, which has a temporal resolution of 1 h and a spatial resolution of 0.05° × 0.05° [25]. The coverage of the data includes the whole of China, the sequence length of the data is from 1 May 2015 to the present, and the spatial extent of the data is extracted from the range of 70°–140° E, 15°–60° N, where the Qingyi River basin is located at the time of this study.
CMPA-Hourly combines gauge rainfall data, satellite precipitation products, and radar precipitation products, including precipitation data from more than 40,000 automatic ground observation stations. The precipitation data from the automatic ground observation stations were subjected to strict quality control before the precipitation data grid analysis [31], in which the grid points with station observations in the 0.05° × 0.05° latitude and longitude grid were called “valid grid points” and could participate in the subsequent fusion analysis. CMORPH real-time satellite inversion precipitation products have a spatial resolution of 8 km at about 0.04° and temporal resolution of 30 min. The FY2 series satellite precipitation products have a temporal resolution of 1 h. CMORPH precipitation products have high accuracy in the Chinese region [32] and was developed by the Climate Prediction Center of the U.S. Environmental Prediction Center. FY2 series satellite inversion precipitation products with high timeliness are available from the China Satellite Meteorological Center for real-time release. The radar precipitation products were obtained by fitting the revised Z-I relationship in real-time based on the automatically observed hourly precipitation data with a temporal resolution of 1 h and a spatial resolution of 0.05° × 0.05°, and the information has high accuracy [33].
The algorithm for these fused data consists of the following: first, correcting for systematic biases in radar and satellite precipitation products; second, combining radar and satellite precipitations to form an optimal background field; finally, combining the OI method ground observations [24,34]. The algorithm for these fused data firstly corrects for systematic biases in radar and satellite precipitations; secondly, radar and satellite precipitations are combined to form an optimal background field; finally, the OI method surface observation data are combined [24]. Specific steps: In the first step, the systematic bias of radar and satellite precipitations is calibrated using the probability density matching method, and the systematic bias of satellite precipitation in the ground–satellite two-source precipitation fusion product of 0.1° × 0.1° is calibrated using the PDF matching method, which achieves a more obvious effect [24]. Therefore, under the current 0.05° × 0.05° resolution, the method is used to calibrate the systematic errors existing in radar and satellite remote sensing precipitations and to effectively reduce the systematic bias existing in radar inversion and satellite remote sensing precipitation products. In the second step, the Bayesian Mode Averaging (BMA) method [28] is used to generate the radar–satellite precipitation field: the BMA method is used to dynamically compute the radar and satellite precipitation errors under different spatial and temporal windows, which is used to obtain the optimal precipitation background field. Meanwhile, in the calculation process, the data weights are different in different time and different areas, which makes the local-scale data weight distribution more accurate, and thus the precipitation background field is more precise. In the third step, the Optimal Interpolation (OI) method is used to effectively combine the standard deviation of observation error, the standard deviation of background field error, and the standard deviation of background error and the background error co-correlation. At 0.05° × 0.05° spatial resolution, the observation standard error is a function of the density of gridded precipitation and stations, and the background error grows exponentially and decreasingly with distance.
The results of the independent sample test using data from 1 June 2014 to 30 June 2014 showed that the CMPA correlation coefficient was 0.72 for the satellite precipitation products using CMORPH, which had a root-mean-square error of 0.94 mm/h and a deviation of −0.004 mm/h. Pan et al. [23] showed that CMPA has a correlation coefficient of 0.718 with observed hourly precipitation in summer in China. It can reflect the actual precipitation conditions and can be used as a reference for evaluating model forecast performance. Whether averaged over the national surface or in terms of the sparseness of the precipitation network of weather station observations, ground observation–satellite precipitation product–radar precipitation product fusion is more spatially representative than any single-source precipitation data. It is also essentially more spatially representative than ground–satellite two-source precipitation fusion products [24,28].
To illustrate the effect of CMPA data in the Qingyi River basin, the CMPA data in the Qingyi River basin for the period of 2015–2020 were evaluated. Table 2 shows the comparison of the accuracy of the monthly average precipitation of CMPA data in the Qingyi River basin from 2015 to 2020. In the Qingyi River basin, the multiyear monthly average rainfall of CMPA data correlated well with the gauge rainfall data at the stations, with a correlation coefficient of 0.984. The RMSE index of CMPA data was 11.723 mm, which proves that CMPA can reflect the amount of rainfall in the Qingyi River basin.

Table 2.
Comparison of monthly average rainfall between gauge stations and CMPA in the Qingyi River basin from 2015 to 2020.
2.2.3. BTOPMC Input Data
The BTOPMC, which was used as a hydrological model in this study, requires a variety of input data such as Digital Elevation Model (DEM) [35], land cover [36], soil type [37], Normalized Difference Vegetation Index (NDVI) [38], and meteorological data (Table 3) [39]. All the datasets could be freely accessed on their official website and were resampled to 30 s (approximately 1 km) for BTOPMC simulation.

Table 3.
Datatype, description, and sources used in this study.
2.3. Methodology
2.3.1. Hydrological Model
The BTOPMC model is a distributed watershed hydrological model based on a physical mechanism [40,41]; it has evident advantages of requiring a small number of parameters for rate determination, and all parameters are physically meaningful. The BTOPMC model has been effectively promoted as well as more widely used worldwide [42], with better validation results obtained in watersheds, such as the Fuji River basin in Japan, the kaliBrantas basin in Indonesia, and a dozen small- and medium-sized watersheds in North America. The model uses TOPMODEL as the production flow model and the Muskingum–Conchie method as the sink flow model. At the same time, the submodels related to terrain resolution, such as depression treatment, river network generation, and natural sub-basin delineation developed by Ao et al. [43], were applied. The five main parameters of BTOPMC are as follows: saturated soil hydraulic conductivity decay factor m (m), saturated soil hydraulic conductivity D0 (m2/s), drying index α, average initial value of soil saturation difference SDbar0 (m), and Manning index noc, where D0 and m reflect the influence of soil type in the watershed, SDbar mainly reflects the influence of watershed topography, and noc reflects the influence of soil species and vegetation/land use effects. Among the parameters, α, m, noc, and SDbar represent the rate per “block”, whereas D0 is calibrated for different soil types in the whole watershed.
2.3.2. Evaluation Criteria
In this study, the effectiveness of the BTOPMC model for flood forecasting in the Qingyi River basin was evaluated using the coefficient of determination and the Nasi efficiency coefficient. The coefficient of determination (), which is the square of the correlation coefficient (CC), is calculated as follows:
where is the i-th measured value; is the average of all measured values; is the i-th simulated value; is the average of all simulated values; n is the number of measured values. When becomes closer to 1, the simulation effect is better, i.e., the simulated and the measured values are closer to the process line, and when becomes closer to 0, the simulation effect is worse.
The Nash–Suttcliffe coefficient (NSE) is calculated as follows [44,45,46]:
where the measured value is represented by and the simulated value is represented by . The number of real values is denoted by n; the average of real values is denoted by . Higher NSE value indicates better simulation effect.
For the forecast effectiveness of the field floods, the flood flow error and the peak present time difference are also used for evaluation [46]. The flood flow should not exceed 20% of the measured value, as shown in Equation (3), where and are the simulated flood flow and the measured flood flow, respectively.
The peak present time difference is the difference between the forecasted peak present time and the measured peak present time, as shown in Equation (4), where and are the simulated peak present time and the measured peak present time, respectively, with an allowable error of ±3 h.
According to these indicators, the accuracy level of the forecast can be evaluated, and the specific division rules are expressed in Table 4; Equation (5) is the formula for calculating the pass rate, where the number of qualified fields is expressed by n. Here, qualified indicates that all three indicators are qualified, and the total number of fields is expressed by m.

Table 4.
Flood forecast accuracy rating.
In addition to these indicators, root-mean-square error (RMSE), mean absolute error (MAE), and bias (BIAS) were used for error analysis for forecasting the effectiveness of discharge, calculated as follows:
where is the sample capacity, is the observed data, and is the simulated data. BIAS reflects the overall trend between the observed data and the simulated data. The average condition of the observed data and the simulated data is reflected by MAE, and the degree of dispersion of the dataset is indicated by RMSE.
3. Results
3.1. Topographic Preprocessing and Sub-Basin Classification of the Qing Yi River Using BTOPMC Model
We used the DEM data downloaded from the Geospatial Data Cloud (www.gscloud.cn/search, accessed on 10 June 2021). Considering the efficiency of model operation, the DEM data were resampled to a resolution of 1 km and cropped out of the area, where the Qingyi River basin is located, as shown in Figure 3.
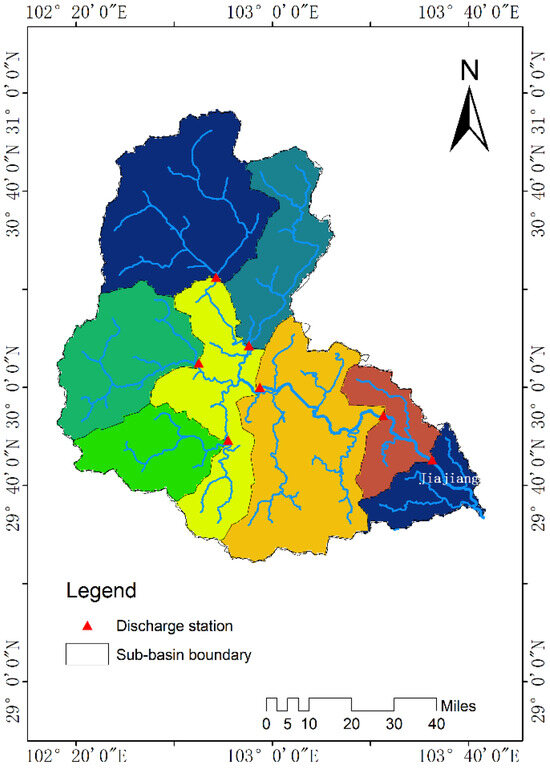
Figure 3.
BTOPMC topographic preprocessing. The natural basin boundary and main water system.
3.2. Calibration of BTOPMC Model
In this study, the BTOPMC model was driven by CMPA data and gauge rainfall data for flood forecasting. Prior to flood forecasting, multiple cases were selected for rate calibration of the five types of parameters in the BTOPMC model. The BTOPMC model’s own SCE-UA algorithm tool was used for the calibration, and the results are shown in Table 5.

Table 5.
Parameter rate determination for sub-basins using BTOPMC model for flood forecasting.
3.3. Flood Discharge Simulation Accuracy Analysis
3.3.1. General Evaluation
The CMPA data and gauge rainfall data were used for calibration and verification, and the highest peak flow floods of the Qingyi River from 2015 to 2019 were selected below for detailed analysis, as shown in Table 6.

Table 6.
Flood simulation effect using BTOPMC model.
The BTOPMC model used CMPA data and gauge rainfall data in multiple flood cases in the Qingyi River basin. The pass rate for the flood simulation was 100%, which reached Class A accuracy, and the determination coefficients were 0.76 and 0.72, which reached Class B accuracy.
The BTOPMC model can simulate the flood discharge and peak present time more accurately using CMPA data and gauge rainfall data in the Qingyi River. In the flood simulation, accurate prediction of the flood discharge and peak present time in relation to the impact range of the flood and the prediction of the disaster occurrence time is the most important; thus, the accuracy of the simulation is essential.
Analysis of the flood peak error demonstrates (Table 6) that the BTOPMC model simulations show more accurate flood flow simulations in higher flow peak floods, especially using CMPA data, probably because CMPA data incorporate the radar rainfall product and have higher spatial resolution for a more accurate description of heavy precipitation. The BTOPMC model simulates the floods in the study area using CMPA data and gauge data more accurately, and the errors of flood flow are less than 20%, which reaches the qualified standard. The average flow peak error for flood forecasting using precipitation information from weather stations is 15.2%, which is 9% greater than the flood flow error from CMPA data. This finding may be due to the fact that the CMPA data product integrates the gauge, the satellites, and the radar rainfall products, and the resolution of precipitation information for the study area is higher than that of actual rainfall measurements from the gauge rainfall data. In addition, the gauge rainfall data can accurately describe the precipitation situation at a single station, but the spatial description of precipitation is insufficient due to the limitation of the number of stations, such as the Tyson polygon used by the model to calculate the surface rainfall given the uneven distribution of weather stations. As a result, the peak-making effect of the storm center is weakened, and the simulated flood flow error is greater.
Analysis of the peak present time error (Table 6) shows that the BTOPMC model accurately simulates the peak present time of floods in the study area using CMPA data and gauge rainfall data and with less variation.
In the analysis of the peak occurrence time errors (Table 6), the BTOPMC model simulates the peak occurrence time of floods in the study area using the CMPA data and the gauge rainfall data with relatively accurate and small differences, and the peak occurrence time differences are within ±3 h, with a 100% compliance rate. Under the BTOPMC model, one simulation has no error, accounting for 20% of the total number of simulations, and the remaining simulations have a lag of 1–3 h from the actual peak.
3.3.2. Case Evaluation
The two flood cases during the validation period are mainly analyzed due to the limited space. The floods in different cases of the Qingyi River cross-section indicate that the flood flow in the cross-section is large and rises and falls rapidly, thereby adding difficulty to the hydrological simulation. In addition, the flood peak lags the precipitation extremes by 0–3 h, and the flood peak has a good correlation with the precipitation intensity.
The case of 6 August 2019 is a multipeak flood with a flood peak of 9470 m3/s. The NSE values of flood forecasting using CMPA data and gauge rainfall data are 0.74 and 0.84, respectively, and the accuracies are of class B. The slightly higher NSE for flood simulation using CMPA data may be mainly due to the better simulation of flood peaks (Figure 4). Combined with the temporal variation map of precipitation (Figure 5), the rainfall values calculated using the gauge data are smaller than those calculated using CMPA data during the strongest precipitation period of 6 August 2019 00:00 h–6 August 2019 06:00 h, indicating that the weak representativeness of the gauge rainfall data reduces the amount of rainfall. At the same time, the cumulative precipitation of the flood cases shows (Figure 6) that the gauge rainfall data are discretely distributed in the Qingyi River basin and are under-representative of the strongest rain bands in the basin.
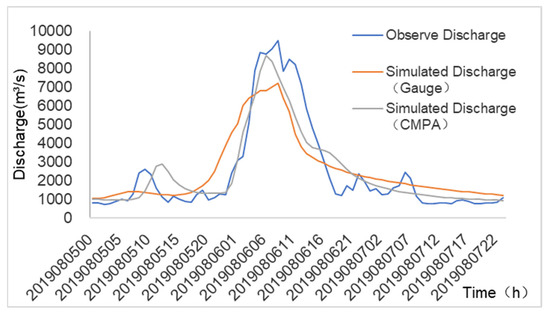
Figure 4.
BTOPMC model simulation results for the 06 August 2019 field flood.
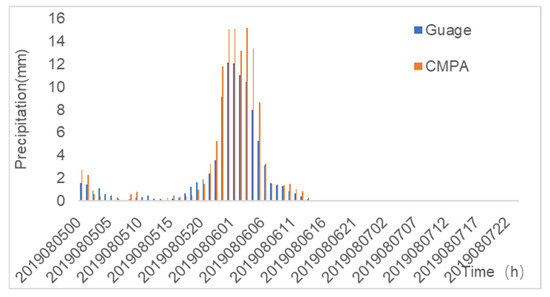
Figure 5.
Rainfall above Jiajiang cross-section using Tyson polygons for the 06 August 2019 field flood.
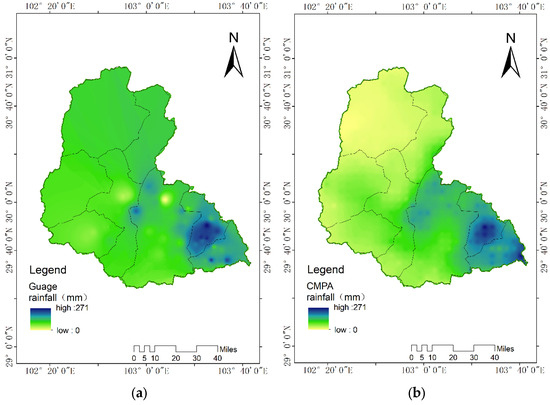
Figure 6.
Rainfall comparison of 06 August 2019 field floods: (a) weather station and (b) CMPA.
The case of 14 August 2019 is a single-peak flood with a flood peak of 6060 m3/s. The NSE values of the BTOPMC model simulations using CMPA data and gauge rainfall data driven by the BTOPMC model are 0.58 and 0.72, respectively, with an accuracy of B. The flood peak lags behind the precipitation peak by 1–2 h. The measured and forecasted flows (Figure 7) are compared. The results show that the forecasted flows are low for the flood peak, and the flood peak flow forecasted using CMPA data is higher than that forecasted using the gauge rainfall data. Combined with the temporal distribution of precipitation (Figure 8), the figure shows that the rainfall values calculated using CMPA data are stronger during peak precipitation hours than those observed using the gauge. The spatial distribution map of precipitation shows (Figure 9) that the weather stations are sparsely distributed in the Qingyi River basin, which is not representative of the strong precipitation in the basin.
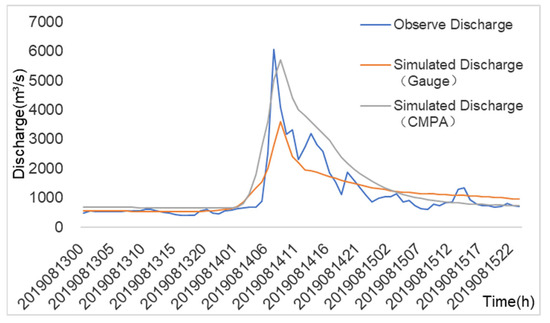
Figure 7.
BTOPMC model simulation results for the 14 August 2019 field flood.
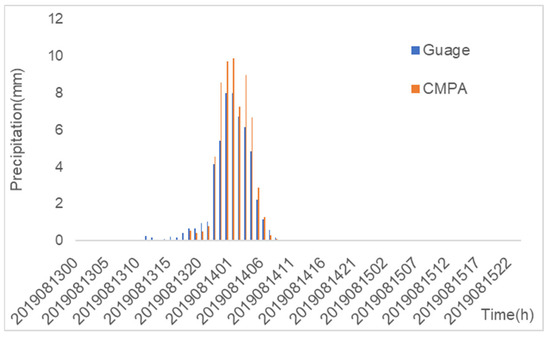
Figure 8.
Rainfall above Jiajiang cross-section using Tyson polygons for the 14 August 2019 field flood.
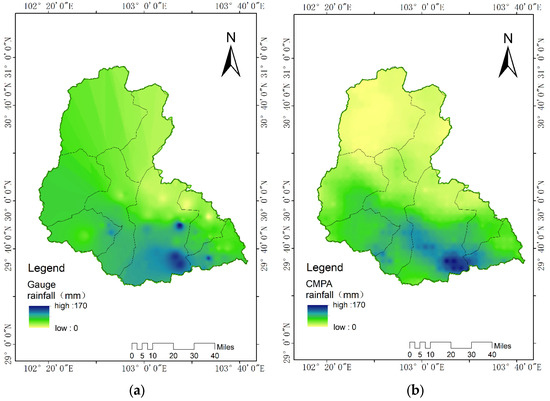
Figure 9.
Rainfall comparison of 14 August 2019 field floods: (a) weather station and (b) CMPA.
The differences in the peak-appearance times of flood forecasts using CMPA precipitation and the precipitation observed at weather stations are small, and both methods can forecast the peak-appearance times of floods effectively. However, the forecast of flood peaks using CMPA precipitation is more accurate, and the error of flood peaks is smaller, probably due to the sparse distribution of meteorological stations in the Qingyi River basin with a station network area of 1279 m3/station. And the surface rainfall of Qingyi River calculated using the Tyson polygon is not representative and underestimates the precipitation in the basin. However, CMPA precipitation incorporates a resolution of 1 h, a latitude of 0.01° × 0.01°, and a longitude grid. The CMPA precipitation incorporates the radar-estimated precipitation with a 1 h resolution and 0.01° × 0.01° latitude/longitude grid. Thus, the calculated surface rainfall becomes more representative and accurate in describing the heavy precipitation process.
In summary, the flood forecasts based on CMPA precipitation are more accurate, with smaller flood errors and a closer simulation of flood processes, indicating that the use of CMPA precipitation for flood forecasting under complex topographic conditions is feasible in southwest China and can effectively improve the flood simulation.
4. Discussion
Precipitation observation stations in the Qingyi River basin are limited by station maintenance and elevation, and the overall density of stations is sparse, which is not representative of the spatial distribution of precipitation in the whole basin. At the same time, when using the gauge rainfall data for flood simulation, the data are interpolated to flatten them, and the disadvantage of the uneven distribution of weather stations directly affects the hydrological forecasting results when the Tyson polygon is used to process the precipitation data. On the contrary, CMPA data, which integrate ground observation–radar–satellite precipitation, combine the respective advantages from different sources to improve the resolution and accuracy of precipitation data; for example, station precipitation can revise the systematic errors of radar- and satellite-estimated precipitations; satellite precipitation products can provide radar precipitation products in areas with incomplete spatial coverage due to terrain occlusion and other factors; and radar precipitation products can compensate for the spatial sampling caused by the station. Radar precipitation can compensate for the representative errors caused by the spatial sampling of stations, thereby effectively improving the accuracy of flood forecasting. Compared with the Qingyi River basin, China has a large number of mountainous basins, where the construction of weather stations is sparser. In fact, these watersheds are characterized by large volume; being flood-prone; frequent, serious flood damage; and a difficulty in scientific flood forecasting. Therefore, the accuracy of CMPA data should be improved in mountainous watersheds with sparse meteorological stations.
5. Conclusions
In this study, the Qingyi River (13,000 km2), a typical watershed in southwest China, is selected as the study area, and a daily runoff and flood forecasting method based on measured and various forecast precipitations is proposed for the problems of insufficient and unrepresentative precipitation observation data and a short flood forecasting period at the stations in the study area. Based on the BTOPMC model, a forecast scheme is constructed using CMPA data to improve forecast accuracy, and the following conclusions are obtained:
A flood simulation method is established based on CMPA data of Qingyi River, which effectively improves the forecast accuracy. The advantage of the surface rainfall accuracy of CMPA precipitation data is used to compensate for the shortcomings in the density and distribution of watershed stations. Therefore, using CMPA data for the simulation is more accurate than using weather stations alone to observe precipitation when the ground observations are not representative. The results show that in the flood simulation, the NSE of the Jiajiang cross-section during the validation period improved from 0.66 to 0.78, the flood error reduced from 18% to 9%, and the overall accuracy reached grade B or above. CMPA precipitation incorporates ground-observed precipitation data; hence, the previous use of observed precipitation to evaluate the effectiveness of precipitation data will no longer be applicable. Examining the effect of flood simulations based on CMPA data can be effective to test the effect of precipitation data.
Author Contributions
Conceptualization, T.C., Y.Y. and K.Y.; methodology, T.C. and Y.Y.; software, T.C.; formal analysis, T.C., Y.Y. and K.Y.; writing—original draft preparation, T.C.; writing—review and editing, T.C. and T.A.; visualization, Y.Y. and K.Y.; funding acquisition, T.C. All authors have read and agreed to the published version of the manuscript.
Funding
This research was financially supported by the Chengdu University of Information Engineering Scientific Research Fund Grant Results (no. KYTZ202129), and the Chengdu Heavy Rain and Drought-Flood Disasters in Plateau and Basin Key Laboratory of Sichuan Province (no. SZKT202201).
Institutional Review Board Statement
Not applicable.
Informed Consent Statement
Not applicable.
Data Availability Statement
Data sharing not applicable due to the data is obtained by registering and applying through the official website.
Acknowledgments
The authors thank the anonymous referees for their valuable comments and suggestions.
Conflicts of Interest
The authors declare no conflict of interest.
References
- Todini, E. Flood Forecasting and Decision Making in the new Millennium. Where are We? Water Resour. Manag. 2017, 31, 3111–3129. [Google Scholar] [CrossRef]
- Beniston, M. Trends in joint quantiles of temperature and precipitation in Europe since 1901 and projected for 2100. Geophys. Res. Lett. 2009, 36, L07707. [Google Scholar] [CrossRef]
- Wang, C.P.; Huang, M.T.; Zhai, P.M. Change in drought conditions and its impacts on vegetation growth over the Tibetan Plateau. Adv. Clim. Change Res. 2021, 12, 9. [Google Scholar] [CrossRef]
- Shi, J.; Cui, L.; Tian, Z. Spatial and temporal distribution and trend in flood and drought disasters in east china. Environ. Res. 2020, 185, 109406. [Google Scholar] [CrossRef] [PubMed]
- Jing, W.; Yang, Y.; Yue, X.; Zhao, X. A Spatial Downscaling Algorithm for Satellite-Based Precipitation over the Tibetan Plateau Based on NDVI, DEM, and Land Surface Temperature. Remote Sens. 2016, 8, 655. [Google Scholar] [CrossRef]
- Xue, X.; Hong, Y.; Limaye, A.S.; Gourley, J.J.; Huffman, G.J.; Khan, S.I.; Dorji, C.; Chen, S. Statistical and hydrological evaluation of TRMM-based Multi-satellite Precipitation Analysis over the Wangchu Basin of Bhutan: Are the latest satellite precipitation products 3B42V7 ready for use in ungauged basins? J. Hydrol. 2013, 499, 91–99. [Google Scholar] [CrossRef]
- Chen, J.; Huang, G.; Chen, W. Towards better flood risk management: Assessing flood risk and investigating the potential mechanism based on machine learning models. J. Environ. Manag. 2021, 293, 112810. [Google Scholar] [CrossRef]
- Huffman, G.J.; Bolvin, D.T.; Nelkin, E.J.; Wolff, D.B.; Adler, R.F.; Gu, G.; Hong, Y.; Bowman, K.P.; Stocker, E.F. The TRMM multisatellite precipitation analysis (TMPA): Quasi-global, multiyear, combined-sensor precipitation estimates at fine scales. J. Hydrometeorol. 2007, 8, 38–55. [Google Scholar] [CrossRef]
- Nesbitt, S.W.; Cifelli, R.; Rutledge, S.A. Storm Morphology and Rainfall Characteristics of TRMM Precipitation Features. Mon. Weather. Rev. 2015, 134, 2702–2721. [Google Scholar] [CrossRef]
- Joyce, R.J.; Janowiak, J.E.; Arkin, P.A.; Xie, P. CMORPH: A Method that Produces Global Precipitation Estimates from Passive Microwave and Infrared Data at High Spatial and Temporal Resolution. J. Hydrometeorol. 2004, 5, 287–296. [Google Scholar] [CrossRef]
- Tomoo, U.; Kazushi, S.; Takuji, K.; Shoichi, S.; Ken’Ichi, O.; Kazumasa, A. A Kalman Filter Approach to the Global Satellite Mapping of Precipitation (GSMaP) from Combined Passive Microwave and Infrared Radiometric Data (2. Global Satellite Mapping of Precipitation (GSMaP) Project, Precipitation Measurements from Space). J. Meteorol. Soc. Jpn. Ser. II 2009, 87, 137–151. [Google Scholar]
- Hou, A.Y.; Skofronick-Jackson, G.; Stocker, E.F. The Global Precipitation Measurement (GPM) Mission: Overview and U.S. Science Status. Bull. Am. Meteorol. Soc. 2013, 98, 1679–1695. [Google Scholar]
- Yang, M.; Liu, G.; Chen, T.; Chen, Y.; Xia, C. Evaluation of GPM IMERG precipitation products with the point rain gauge records over Sichuan, China. Atmos. Res. 2020, 246, 105101. [Google Scholar] [CrossRef]
- Huffman, G.J.; Adler, R.F.; Bolvin, D.T.; Nelkin, E.J. The TRMM Multi-Satellite Precipitation Analysis (TMPA). J. Hydrometeor. 2010, 3–22. [Google Scholar] [CrossRef]
- Sahoo, A.K.; Sheffield, J.; Pan, M.; Wood, E.F. Evaluation of the Tropical Rainfall Measuring Mission Multi-Satellite Precipitation Analysis (TMPA) for assessment of large-scale meteorological drought. Remote Sens. Environ. 2015, 159, 181–193. [Google Scholar] [CrossRef]
- Liew, S.C.; Chia, A.S.; Kwoh, L.K. Spatio-Temporal Analysis of Climate Change Parameters Using Satellite Data for the Southeast Asian Region. In Proceedings of the 34th International Symposium on Remote Sensing of Environment-The GEOSS Era: Towards Operational Environmental Monitoring, Sydney, Australia, 10–13 April 2011. [Google Scholar]
- Prat, O.P.; Nelson, B.R. Mapping the world’s tropical cyclone rainfall contribution over land using the TRMM Multi-satellite Precipitation Analysis. Water Resour. Res. 2013, 49, 7236–7254. [Google Scholar] [CrossRef]
- Gebregiorgis, A.S.; Hossain, F. Understanding the Dependence of Satellite Rainfall Uncertainty on Topography and Climate for Hydrologic Model Simulation. IEEE Trans. Geosci. Remote Sens. 2013, 51, 704–718. [Google Scholar] [CrossRef]
- Borga, M.; Anagnostou, E.N.; Frank, E. On the use of real-time radar rainfall estimates for flood prediction in mountainous basins. J. Geophys. Res. Atmos. 2000, 105, 2269–2280. [Google Scholar] [CrossRef]
- Seo, D.J. Real-time estimation of rainfall fields using radar rainfall and rain gage data. J. Hydrol. 1998, 208, 37–52. [Google Scholar] [CrossRef]
- Djs, A.; Jpb, A.; Erj, B. Real-time estimation of mean field bias in radar rainfall data. J. Hydrol. 1999, 223, 131–147. [Google Scholar]
- Seo, D.J.; Breidenbach, J.P. Real-Time Correction of Spatially Nonuniform Bias in Radar Rainfall Data Using Rain Gauge Measurements. J. Hydrometeorol. 2002, 3, 93–111. [Google Scholar] [CrossRef]
- Pan, Y.; Shen, Y.; Yu, J.J.; Xiong, A.Y. An experiment of high-resolution gauge-radar-satellite combined precipitation retrieval based on the Bayesian merging method. Acta Meteorol. Sin. 2015, 73, 177–186. [Google Scholar]
- Yu, J.J.; Shen, Y.; Pan, Y.; Zhao, P.; Zhou, Z.J. Improvement of Satellite-based Precipitation Estimates over China Based on Probability Density Function Matching Method. J. Appl. Meteorol. Sci. 2013, 24, 544–553. [Google Scholar]
- Shen, Y.; Pan, Y.; Yu, J.J.; Zhao, P.; Zhou, Z.J. Quality assessment of hourly merged precipitation product over China. Trans. Atmos. Sci. 2013, 36, 37–46. [Google Scholar]
- Shen, Y.; Zhao, P.; Pan, Y.; Yu, J. A high spatiotemporal gauge-satellite merged precipitation analysis over China. J. Geophys. Res. Atmos. 2014, 119, 3063–3075. [Google Scholar] [CrossRef]
- Zhan, X.; Houser, P.R.; Walker, J.P.; Crow, W.T. A method for retrieving high-resolution surface soil moisture from hydros L-band radiometer and Radar observations. IEEE Trans. Geosci. Remote Sens. 2006, 44, 1534–1544. [Google Scholar] [CrossRef]
- Xie, P.; Xiong, A.Y. A conceptual model for constructing high-resolution gauge-satellite merged precipitation analyses. J. Geophys. Res. Atmos. 2011, 116, D21106. [Google Scholar] [CrossRef]
- Li, H. Integration of satellite precipitation data and deep learning for improving flash flood simulation in a poor-gauged mountainous catchment. Remote Sens. 2021, 13, 5083. [Google Scholar]
- Adnan, R.M.; Petroselli, A.; Heddam, S.; Santos, C.A.G.; Kisi, O. Comparison of different methodologies for rainfall–runoff modeling: Machine learning vs conceptual approach. Nat. Hazards 2021, 105, 2987–3011. [Google Scholar] [CrossRef]
- Zhou, Q.; Li, Y.; Jiang, X.W.; Zhang, J. Analysis on the Climatic Characteristics of the Precipitation Variations at “Ya’an Sky-leakage”. J. Nat. Resour. 2016, 31, 343–353. [Google Scholar]
- Ren, Z.H.; Zhao, P.; Zhang, Q.; Zhang, Z.F.; Cao, L.J.; Yang, Y.R.; Zou, F.L.; Zhao, Y.F.; Zhao, H.M.; Chen, Z. Quality Control Procedures for Hourly Precipitation Data from Automatic Weather Stations in China. Meteorol. Mon. 2010, 36, 123–132. [Google Scholar]
- Wang, G.; Liu, L.; Ding, Y. Improvement of Radar Quantitative Precipitation Estimation Based on Real-Time Adjustments to Z-R Relationships and Inverse Distance Weighting Correction Schemes. Adv. Atmos. Sci. 2012, 3, 143–152. [Google Scholar] [CrossRef]
- Shen, Y.; Xiong, A.; Wang, Y.; Xie, P. Performance of high-resolution satellite precipitation products over China. J. Geophys. Res. Atmos. 2010, 115, D02114. [Google Scholar] [CrossRef]
- LP DAAC-SRTMGL3. Available online: https://lpdaac.usgs.gov/products/srtmgl3v003/ (accessed on 10 December 2020).
- LP DAAC-MCD12Q1. Available online: https://lpdaac.usgs.gov/products/mcd12q1v006/ (accessed on 10 December 2020).
- FAO Digital Soil Map of the World (DSMW). Available online: http://www.fao.org/land-water/land/land-governance/land-resources-planning-toolbox/category/details/en/c/1026564/ (accessed on 10 December 2020).
- NOAA Climate Data Record (CDR) of Normalized Difference Vegetation Index (NDVI), Version 4 (Version Superseded). Available online: https://www.ncei.noaa.gov/access/metadata/landing-page/bin/iso?id=gov.noaa.ncdc:C00813 (accessed on 10 December 2020).
- Harris, I.; Osborn, T.J.; Jones, P.; Lister, D. Version 4 of the CRU TS monthly high-resolution gridded multivariate climate dataset. Sci. Data 2020, 7, 109. [Google Scholar] [CrossRef]
- Ao, T. Development of a Distributed Hydrological Model for Large River Basins and Its Application to Southeast Asian Rivers. Ph.D. Thesis, University of Yamanashi, Kofu, Japan, 2001. [Google Scholar]
- Takeuchi, K.L.; Ao, T.; Ish Idaira, H. Introduction of Block-Wise Use of TOPMODEL and Muskingum-Cunge Method for the HydroEnvironmental Simulation of a Large Ungauged Basin. Hydrol. Sci. J. 1999, 44, 633–646. [Google Scholar] [CrossRef]
- Shrestha, S.; Bastola, S.; Babel, M.S.; Dulal, K.N.; Magome, J.; Hapuarachchi, H.A.P.; Kazama, F.; Ishidaira, H.; Takeuchi, K. The assessment of spatial and temporal transferability of a physically based distributed hydrological model parameters in different physiographic regions of Nepal. J. Hydrol. 2007, 347, 153–172. [Google Scholar] [CrossRef]
- Ao, T.; Ishidaira, H.; Takeuchi, K. Study of distributed runoff simulation model based on block type TOPMODEL and muskingum-cunge method. Proc. Hydr. Eng. 1999, 43, 7–12. [Google Scholar] [CrossRef]
- Beven, K.J.; Kirby, M. A Physically Based, Variable Contributing Area Model of Basin Hydrology. Hydrol. Sci. Bull. 1979, 24, 43–69. [Google Scholar] [CrossRef]
- Franke, B.R. Scattered data interpolation: Tests of some methods. Math. Comp. 1982, 38, 181–200. [Google Scholar]
- GB/T 22482-2008; Standard for Hydrological Information and Hydrological Forecasting.General Administration of Quality Supervision, Inspection and Quarantine of the People’s Republic of China. China National Standardization Administration: Beijing, China, 2009.
Disclaimer/Publisher’s Note: The statements, opinions and data contained in all publications are solely those of the individual author(s) and contributor(s) and not of MDPI and/or the editor(s). MDPI and/or the editor(s) disclaim responsibility for any injury to people or property resulting from any ideas, methods, instructions or products referred to in the content. |
© 2023 by the authors. Licensee MDPI, Basel, Switzerland. This article is an open access article distributed under the terms and conditions of the Creative Commons Attribution (CC BY) license (https://creativecommons.org/licenses/by/4.0/).