Article

Application of FY Satellite Data in Precipitation of Eastward-Moving Southwest China Vortex: A Case Study of Precipitation in Zhejiang Province

1
Quzhou Meteorological Bureau, Quzhou 324000, China
2
Key Laboratory of Meteorological Disaster, Ministry of Education (KLME), Collaborative Innovation Center on Forecast and Evaluation of Meteorological Disasters (CIC-FEMD), Joint International Research Laboratory of Climate and Environment Change (ILCEC), Nanjing University of Information Science & Technology, Nanjing 210044, China
3
Guangzhou Meteorological Observatory, Guangzhou 511430, China
*
Authors to whom correspondence should be addressed.
Atmosphere 2023, 14(11), 1664; https://doi.org/10.3390/atmos14111664
Submission received: 16 October 2023 / Revised: 1 November 2023 / Accepted: 3 November 2023 / Published: 9 November 2023

Abstract

:
Based on the high-resolution data from April to October (the warm season) during the 2010 to 2020 timeframe provided by the FY-2F geostationary meteorological satellite, the classification and application evaluation of the eastward-moving southwest vortex cloud system affecting Zhejiang Province was conducted using cloud classification (CLC) and black body temperature (TBB) products. The results show that: (1) when the intensity of the eastward-moving southwest vortex is strong, the formed precipitation is predominantly regional convective precipitation. The cloud system in the center and southeast quadrant of the southwest vortex is dominated by cumulonimbus and dense cirrus clouds with convective precipitation, while the other quadrants are mainly composed of stratiform clouds, resulting in stable precipitation; (2) The original text is modified as follows: By using the TBB threshold method to identify stratiform and mixed cloud rainfall, we observed a deviation of one order of magnitude. This deviation is advantageous for moderate rain. However, the precipitation results from mixed clouds identified by the TBB threshold method are being overestimated; By means of the application of stratiform and mixed cloud rainfall identified by the TBB threshold method, an order of magnitude deviation was identified (3) The TBB can be consulted to estimate the precipitation, above which there is a large error. Moreover, the dispersion of precipitation produced by deep convective clouds is the largest, while the dispersion of precipitation produced by stratiform clouds is the smallest and has better predictability. Compared to CLC products, cloud type results based on TBB identification are better for convective cloud precipitation application.

1. Introduction

The southwest vortex (SWV) is a low-pressure system that forms under specific geographical and circulation conditions [1]. Once formed in the southwest region of China, nearly 40% of these systems migrate away from the source area and affect other regions [2,3]. The SWVs primarily follow eastward, northeastward, and southeastward paths [4]. Currently, there is no consistent definition for SWVs [5], and the movement paths vary across different sources [6,7,8]. The variations in their paths result in differences in meridional precipitation distribution, with eastward paths mainly affecting the Jianghuai region, northeastward paths influencing North China and Northeast China, and southeastward paths primarily impacting South China and coastal areas [9,10].
Previous research by Chinese experts mainly focused on utilizing synthetic analysis methods based on reanalysis data to investigate the precipitation associated with SWVs along different paths [11]. However, there have been far fewer studies that have classified and identified precipitation cloud systems associated with SWVs using satellite data, let alone quantitatively analyzing SWV precipitation (SWVP). With the continuous development of new observational instruments, many studies have started using various observational data to investigate the structural characteristics, precipitation formation mechanisms, and precipitation features of SWVs in recent years [12,13,14]. As remote sensing observation instruments with high spatial and temporal resolution of the global atmosphere, meteorological satellites enable fine-scale, grid-based, and continuous observations with comprehensive coverage [15,16]. Although many studies still rely on qualitative assessments of precipitation intensity changes by analyzing the development and evolution characteristics of mesoscale convective systems [17,18], satellite products have been used for quantitative precipitation forecasting [19,20], yielding certain results.
The FY-2F geostationary meteorological satellite was successfully launched in the first half of 2012. Besides routine observations, it can provide rapid scanning observations of specific areas as needed. The evolution characteristics of cloud types and top-of-cloud brightness temperatures (TBB) captured by FY-2F can reflect the cloud system types and lifecycle of precipitation cloud clusters, making it suitable for analyzing the characteristics and variations in precipitation associated with SWVs of different paths [21,22]. Furthermore, different TBB and cloud type correspondences lead to distinct cloud development heights, resulting in significant differences in precipitation efficiency. Forecasting experts mostly rely on these products to qualitatively analyze and determine SWVP [23], while direct quantitative estimation of precipitation using TBB or cloud type products is rarely conducted. The National Satellite Meteorological Center classifies cloud systems into seven types using cloud classification products, while Ren Jing et al. [24] divided the TBB thresholds to identify different levels of precipitation clouds for quantitative estimation of precipitation. However, further assessment and application are still needed to determine whether these two estimation methods are fully applicable to Zhejiang Province. Therefore, this study will compare and analyze the application and effectiveness of these two precipitation forecast methods in Zhejiang Province. Taking into account the continuity and completeness of the data, this study utilizes FY-2F satellite remote sensing data from 2010 to 2020, covering the months of April to October. Firstly, a qualitative analysis is conducted on four typical eastward-migrating SWVP events that affect Zhejiang Province, aiming to identify the distribution patterns of precipitation and cloud systems. Subsequently, a quantitative analysis is performed on 63 eastward-moving SWV events. Finally, the application effectiveness of cloud products in the prediction of SWVP is evaluated, aiming to provide a more reliable auxiliary forecast correction method for short-term nearshore SWVP forecasting in Zhejiang Province. Through an in-depth analysis of SWVP cloud systems, this study is expected to supplement the nearshore forecasting methods for SWV impacts on Zhejiang Province. SWVP is evaluated by combining satellite cloud classification products and the TBB threshold method, providing a theoretical basis for further improving SWVP forecasting in Zhejiang Province.

2. Materials and Methods

The data used in this study include ERA-Interim reanalysis data [25], covering the period from 2010 to 2020, with a horizontal resolution of 0.25° × 0.25° and a temporal resolution of 6 h; FY-2F meteorological geostationary satellite data, covering a range of 50° N–60° S and 55°–155° E, including cloud type (CLC) and TBB products with a temporal resolution of 1 h and a spatial resolution of 0.1° × 0.1°; hourly surface precipitation observations from the National Basic Station and Regional Automatic Weather Station downloaded from Zhejiang Meteorological Bureau database. The nearest TBB grid data that matched the ground precipitation observations were identified as reference data. The identification criteria for SWVs were based on the method proposed by Ma et al. [8], which requires (1) the presence of at least one closed contour on the 700 hPa or 850 hPa upper-level weather chart; (2) the formation of a low-pressure system or vortex within the range of the southwestern region of China (26°–33° N, 100°–108° E); (3) the presence of closed contours on upper-level charts at least at two consecutive time steps, with a 6 h interval. Using these criteria, a total of 108 cases of eastward-moving SWVs were selected from 2010 to 2020, and, among them, 63 cases were identified as eastward-moving SWVs that moved along the Yangtze River.
This study utilizes two methods to identify precipitation cloud types. The first method involves the classification method provided by the National Satellite Meteorological Center, using the FY-2F cloud classification (CLC) product (represented by “M”). This method classifies cloud systems on satellite images into seven types: clear oceans or clear lands (0 ≤ M ≤ 1), mixed pixels (M = 11), altostratus or nimbostratus cloud (M = 12), cirrostratus cloud (M = 13), cirrus dens cloud (M = 14), cumulonimbus cloud (M = 15), and stratocumulus or altostratus cloud (M = 21). The second method identifies cloud areas producing different levels of precipitation based on the top-of-cloud brightness temperature (TBB) approach. Following the classification of precipitation clouds by Ren et al., four critical temperature thresholds of −50 °C, −30 °C, −10 °C, and 20 °C are selected. Additionally, three empirical thresholds of −20 °C, −40 °C, and −70 °C are added. According to this method, the cloud systems on satellite images are classified into six types: non-precipitation area (−10 < TBB ≤ 20), thick layer clouds producing light rain (−20 < TBB ≤ −10), thick layer clouds producing moderate rain (−30 < TBB ≤ −20), mixed clouds producing heavy rain (−40 < TBB ≤ −30), weak convective clouds (−50 < TBB ≤ −40), convective clouds producing heavy rain (−70 < TBB ≤ −50), and deep convective clouds producing severe rain (TBB ≤ −70). The study utilizes an unmodified map of China released by the National Basic Geographic Information Center (http://www.geodata.cn, accessed on 2 November 2023), with the revision number GS(2020)4632.

3. Application of FY-2F Satellite Data

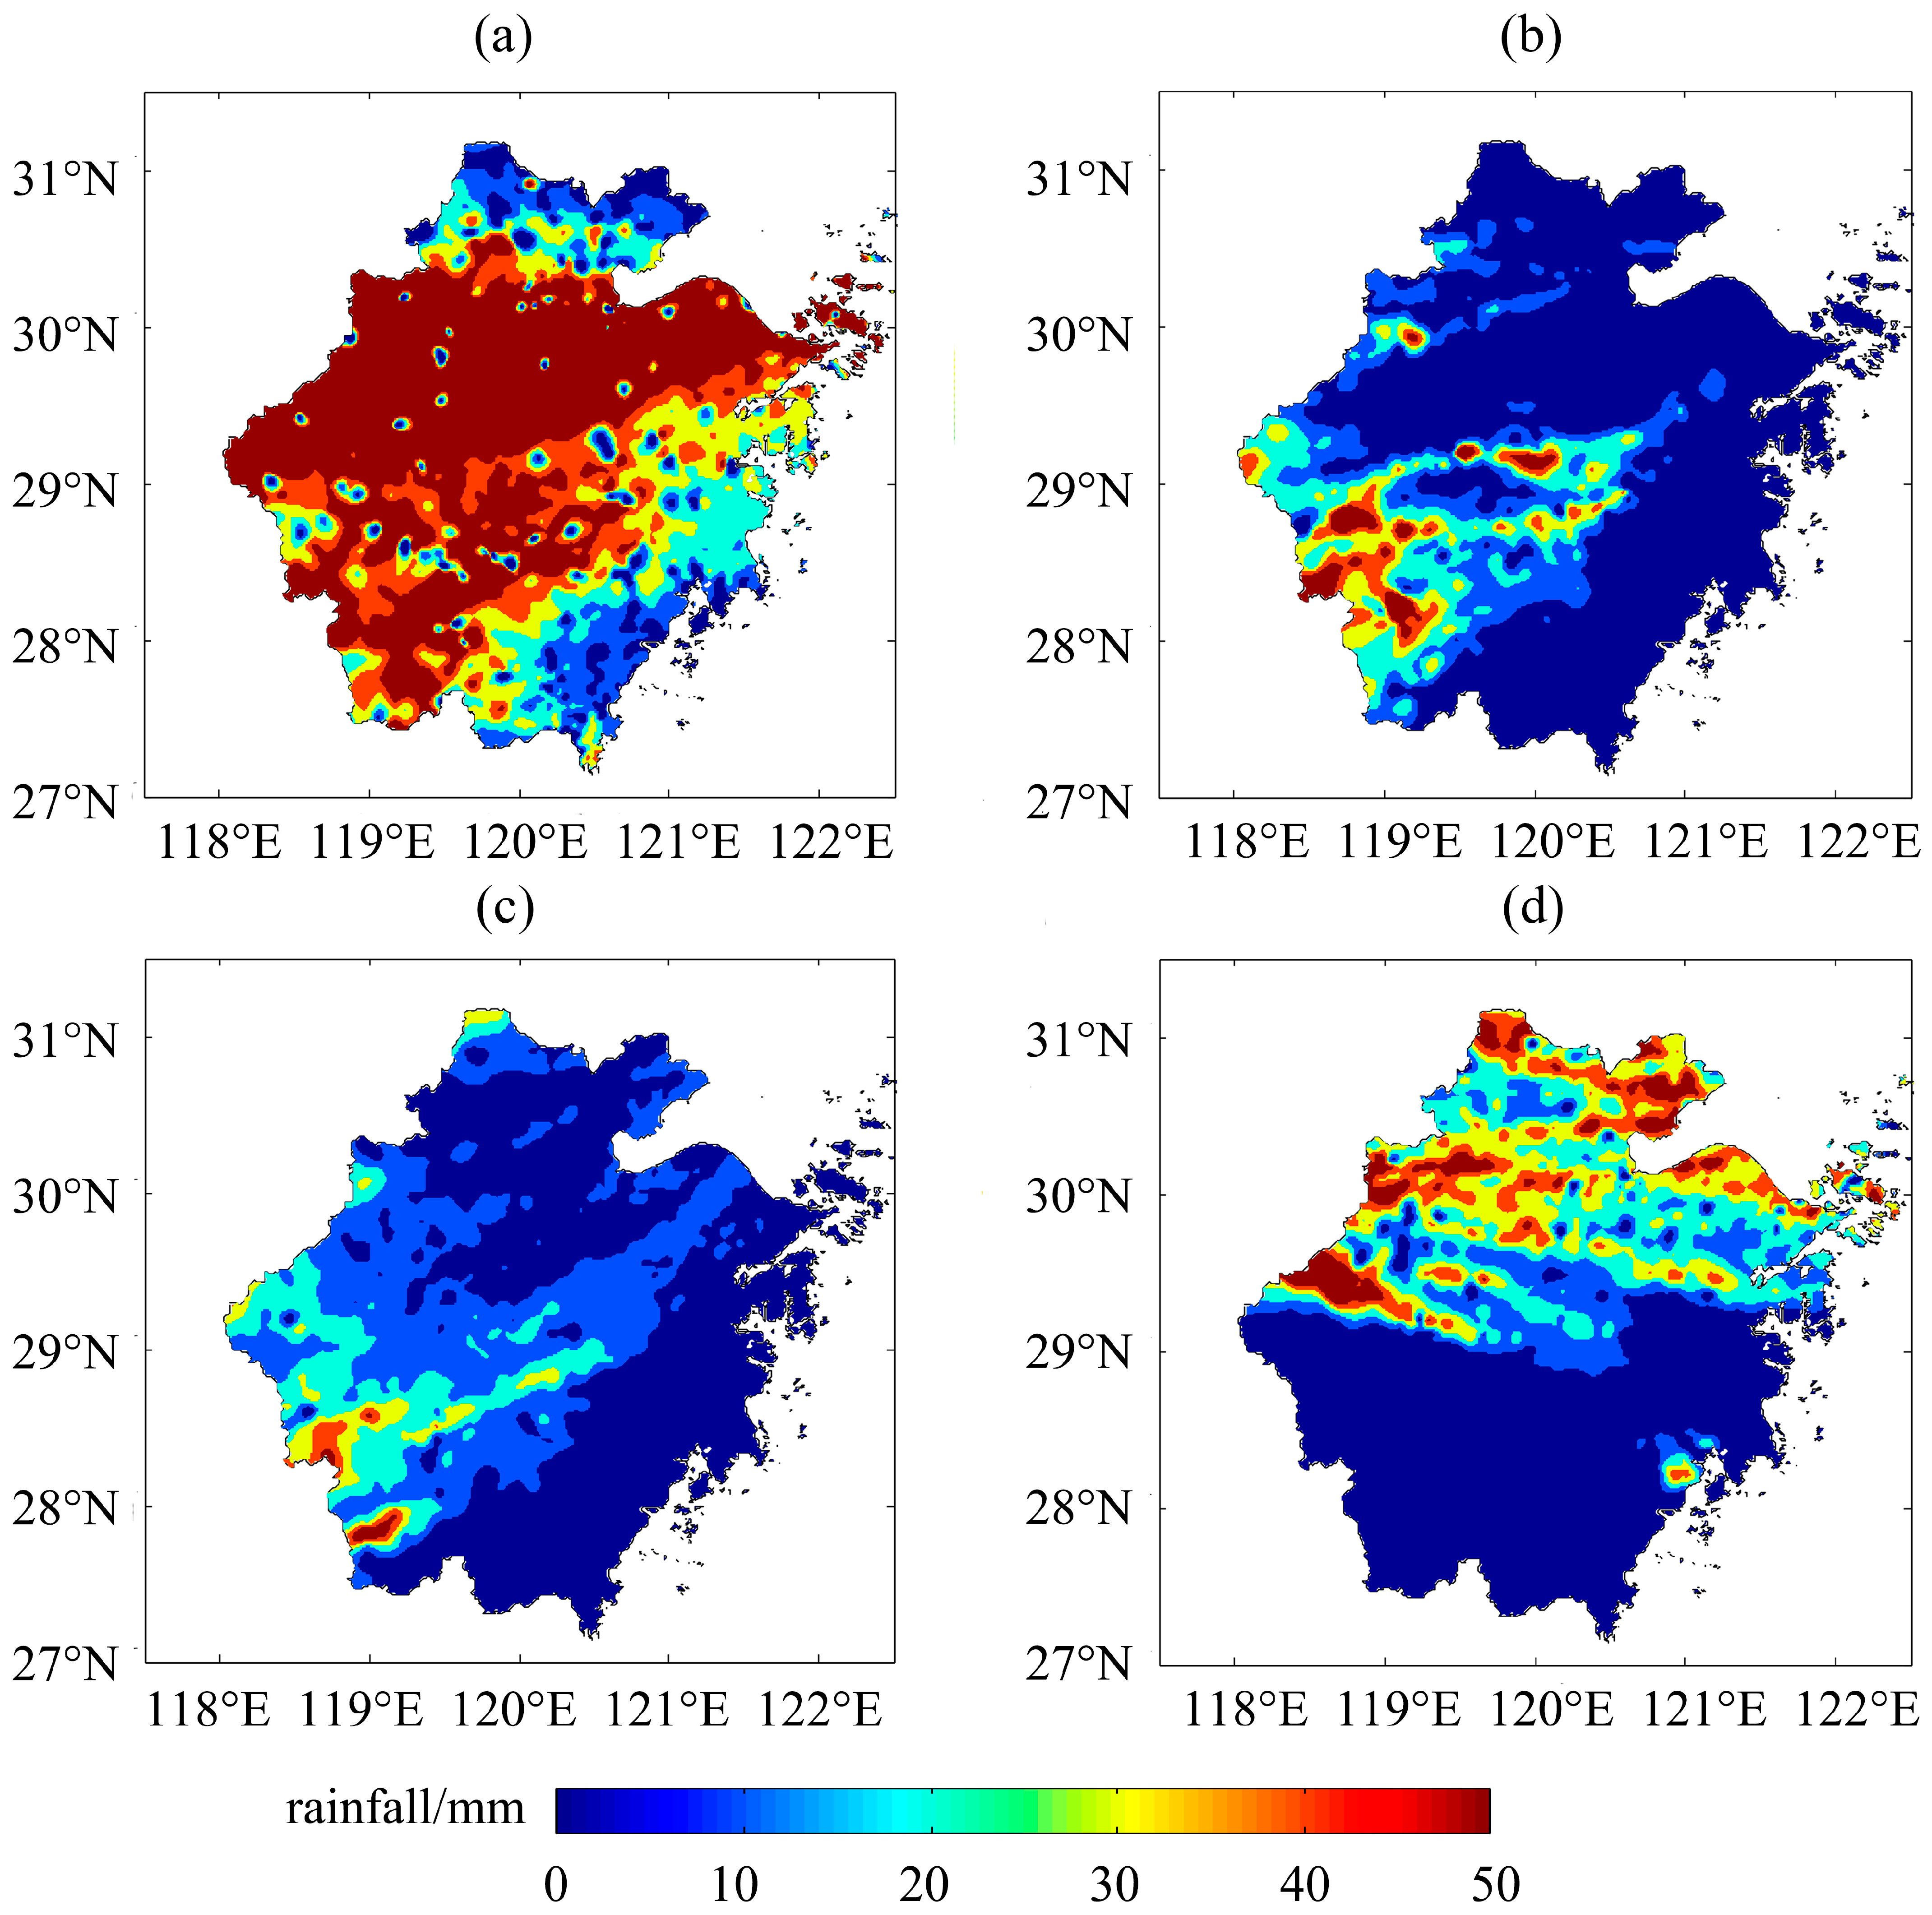
3.1. Spatial Differences in Precipitation

There are significant differences in the magnitude and spatial distribution of eastward-moving SWVP. Four typical processes have been selected for qualitative analysis, namely 29 April 2013 (referred to as “4.29”), 29 May 2015 (referred to as “5.29”), 11 May 2017 (referred to as “5.11”), and 25 May 2018 (referred to as “5.25”). The “4.29” process mainly affected Zhejiang province from 13:00 on 29 April to 23:00 on 30 April 2013. Most areas in Zhejiang experienced precipitation of more than 30 mm (Figure 1a), with 806 stations receiving more than 50 mm of rainfall and 102 stations with rainfall exceeding 100 mm. The highest rainfall was concentrated in the central and northern parts of Zhejiang. During this process, convective cloud clusters continuously formed and moved eastward, leading to the occurrence of the “train effect”. This process exhibited a strong precipitation intensity, large accumulated rainfall, a wide range of influence, and obvious regional characteristics. The “5.29” process occurred from 06:00 on 29 May 2015 to 07:00 on 30 May 2015. The precipitation center appeared in the southwest region of Zhejiang province, with accumulated rainfall ranging from 20 to 50 mm (Figure 1b). There were 22 stations with rainfall exceeding 50 mm, and one station exceeded 100 mm. The heavy rainfall was relatively concentrated and had a small impact area, exhibiting convective characteristics. The “5.11” process occurred from 18:00 on 11 May to 08:00 on 12 May 2017. The position of the SWV center influencing Zhejiang was similar to that of the “5.29” process, and the areas of heavy rainfall were also similar, located in the southwest region of Zhejiang (Figure 1c). However, the accumulated rainfall and precipitation coverage were smaller in this process. The “5.25” process occurred from 17:00 on 25 May to 17:00 on 26 May 2018, mainly affecting the central and northern parts of Zhejiang (Figure 1d). The convective clouds that generated heavy rainfall had a high development height, resulting in the formation of multiple intense precipitation centers. The accumulated rainfall during this process was around 30 to 50 mm.

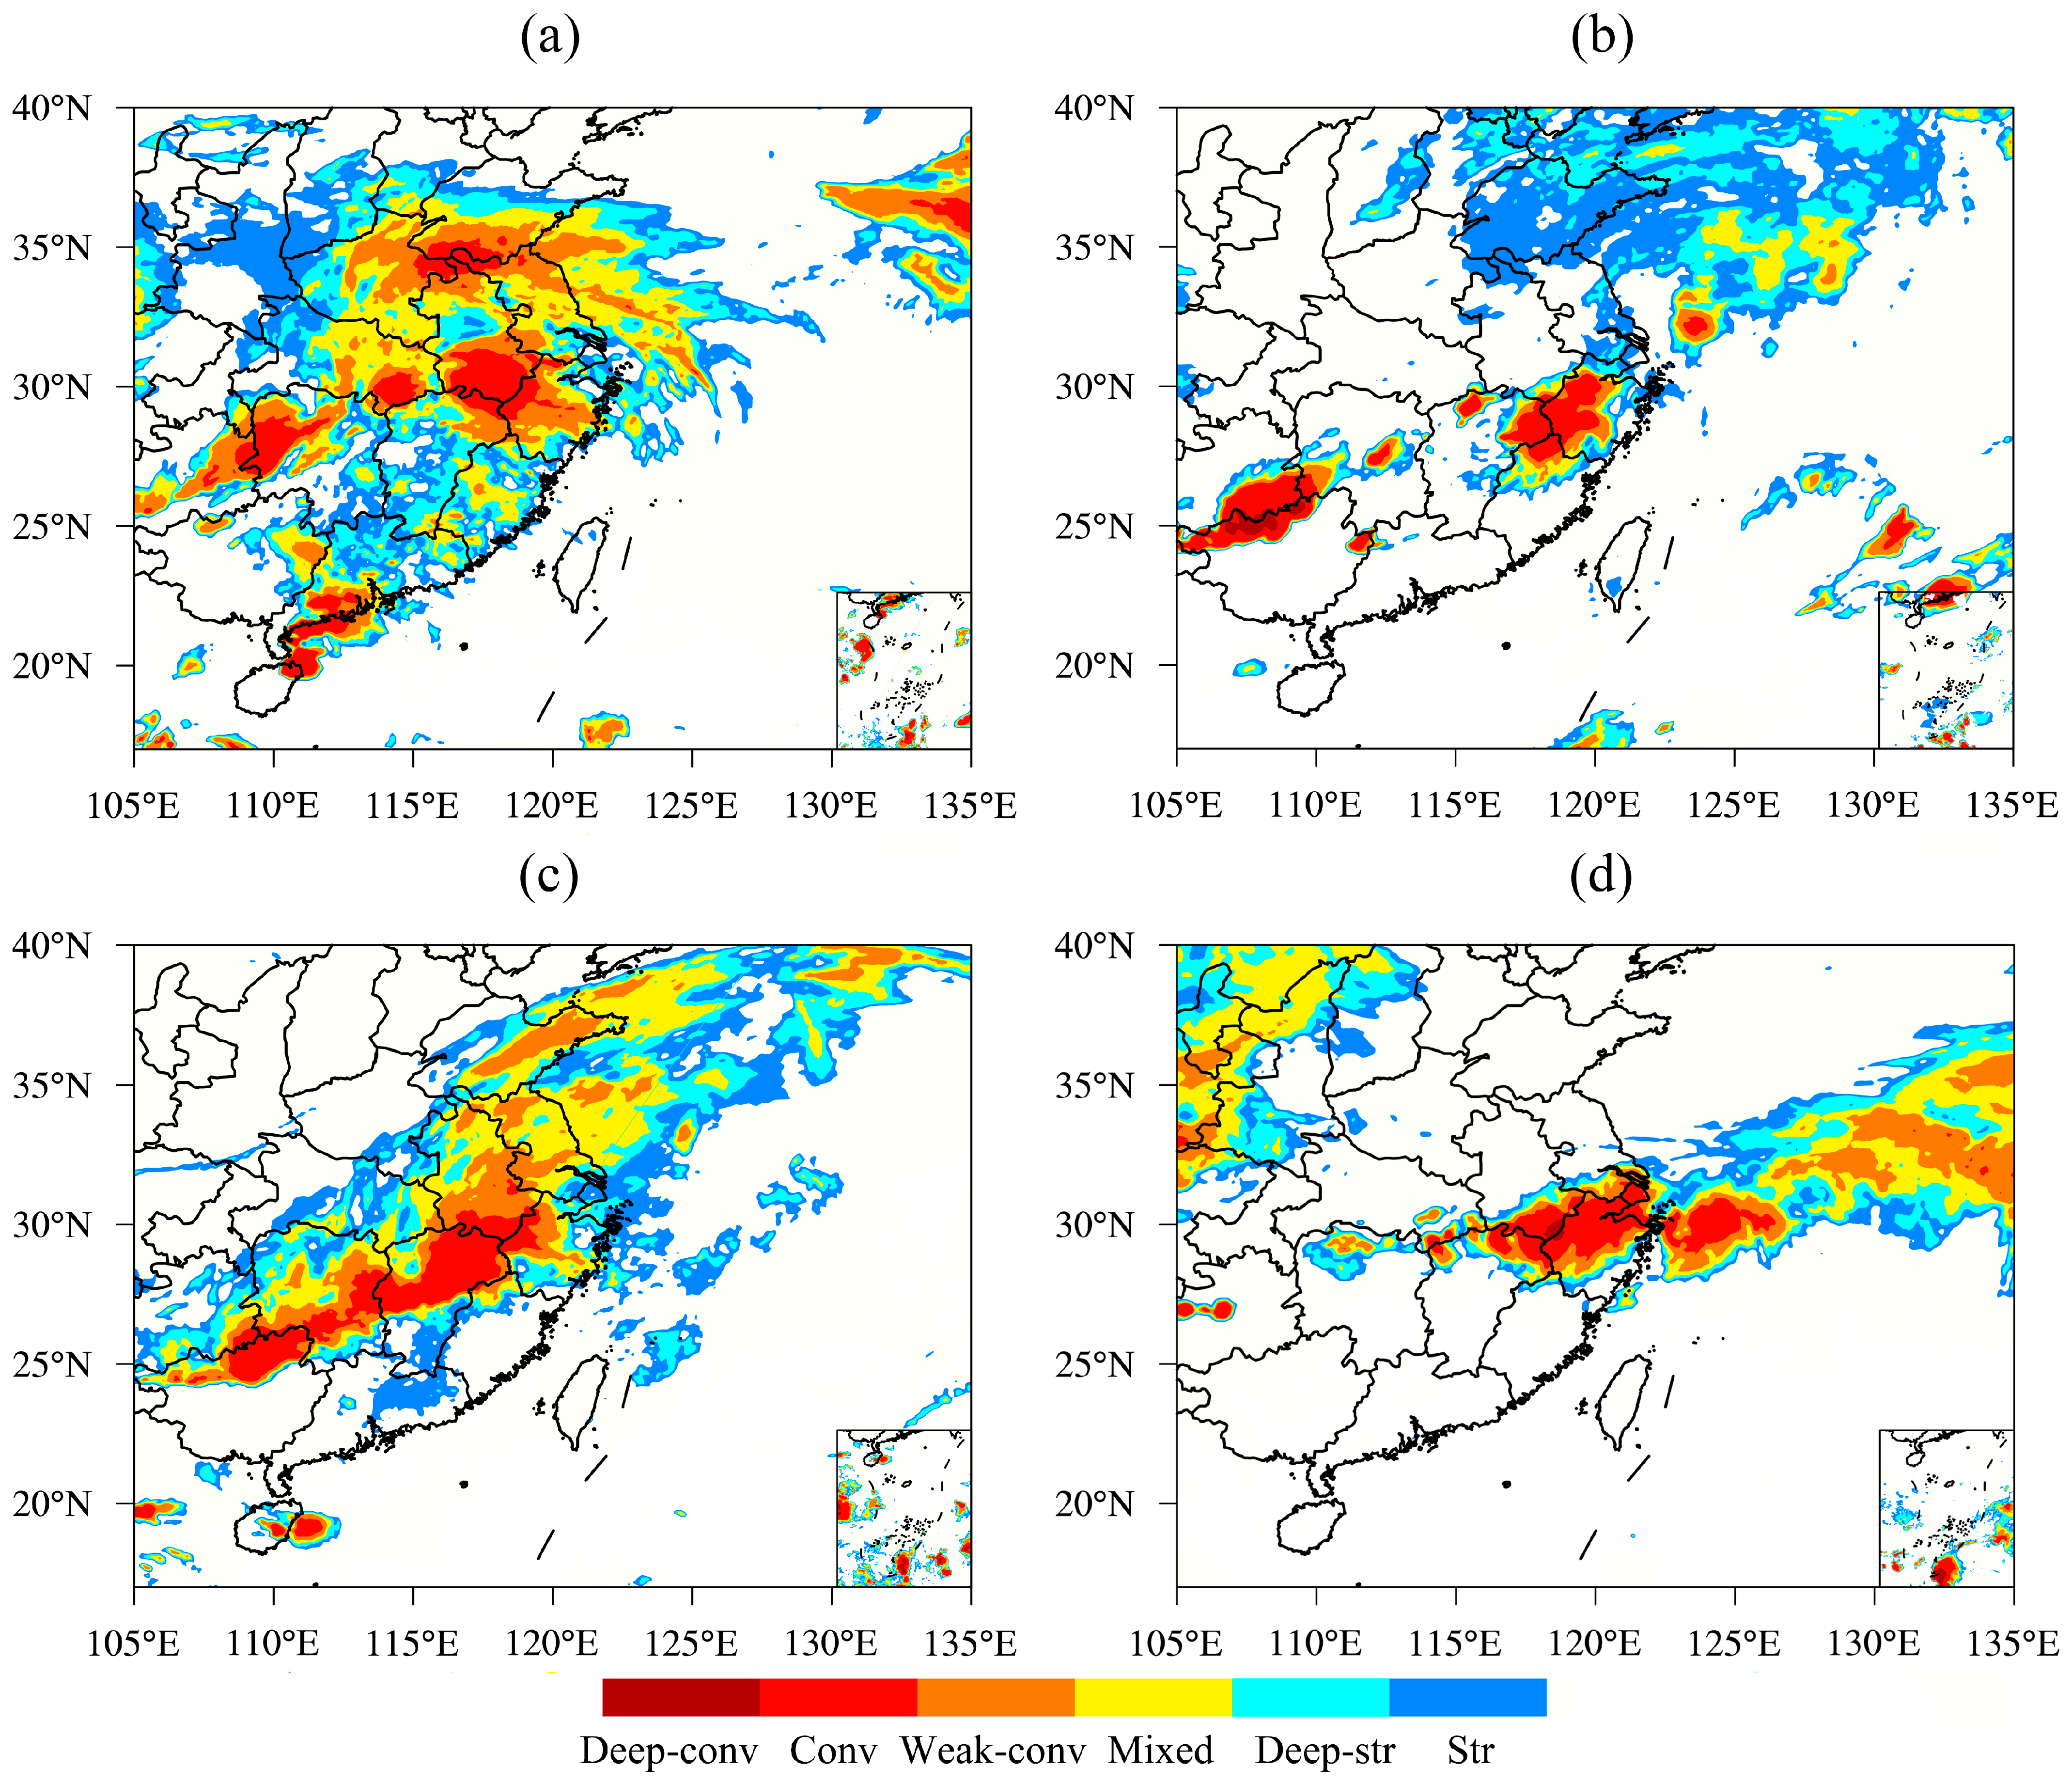
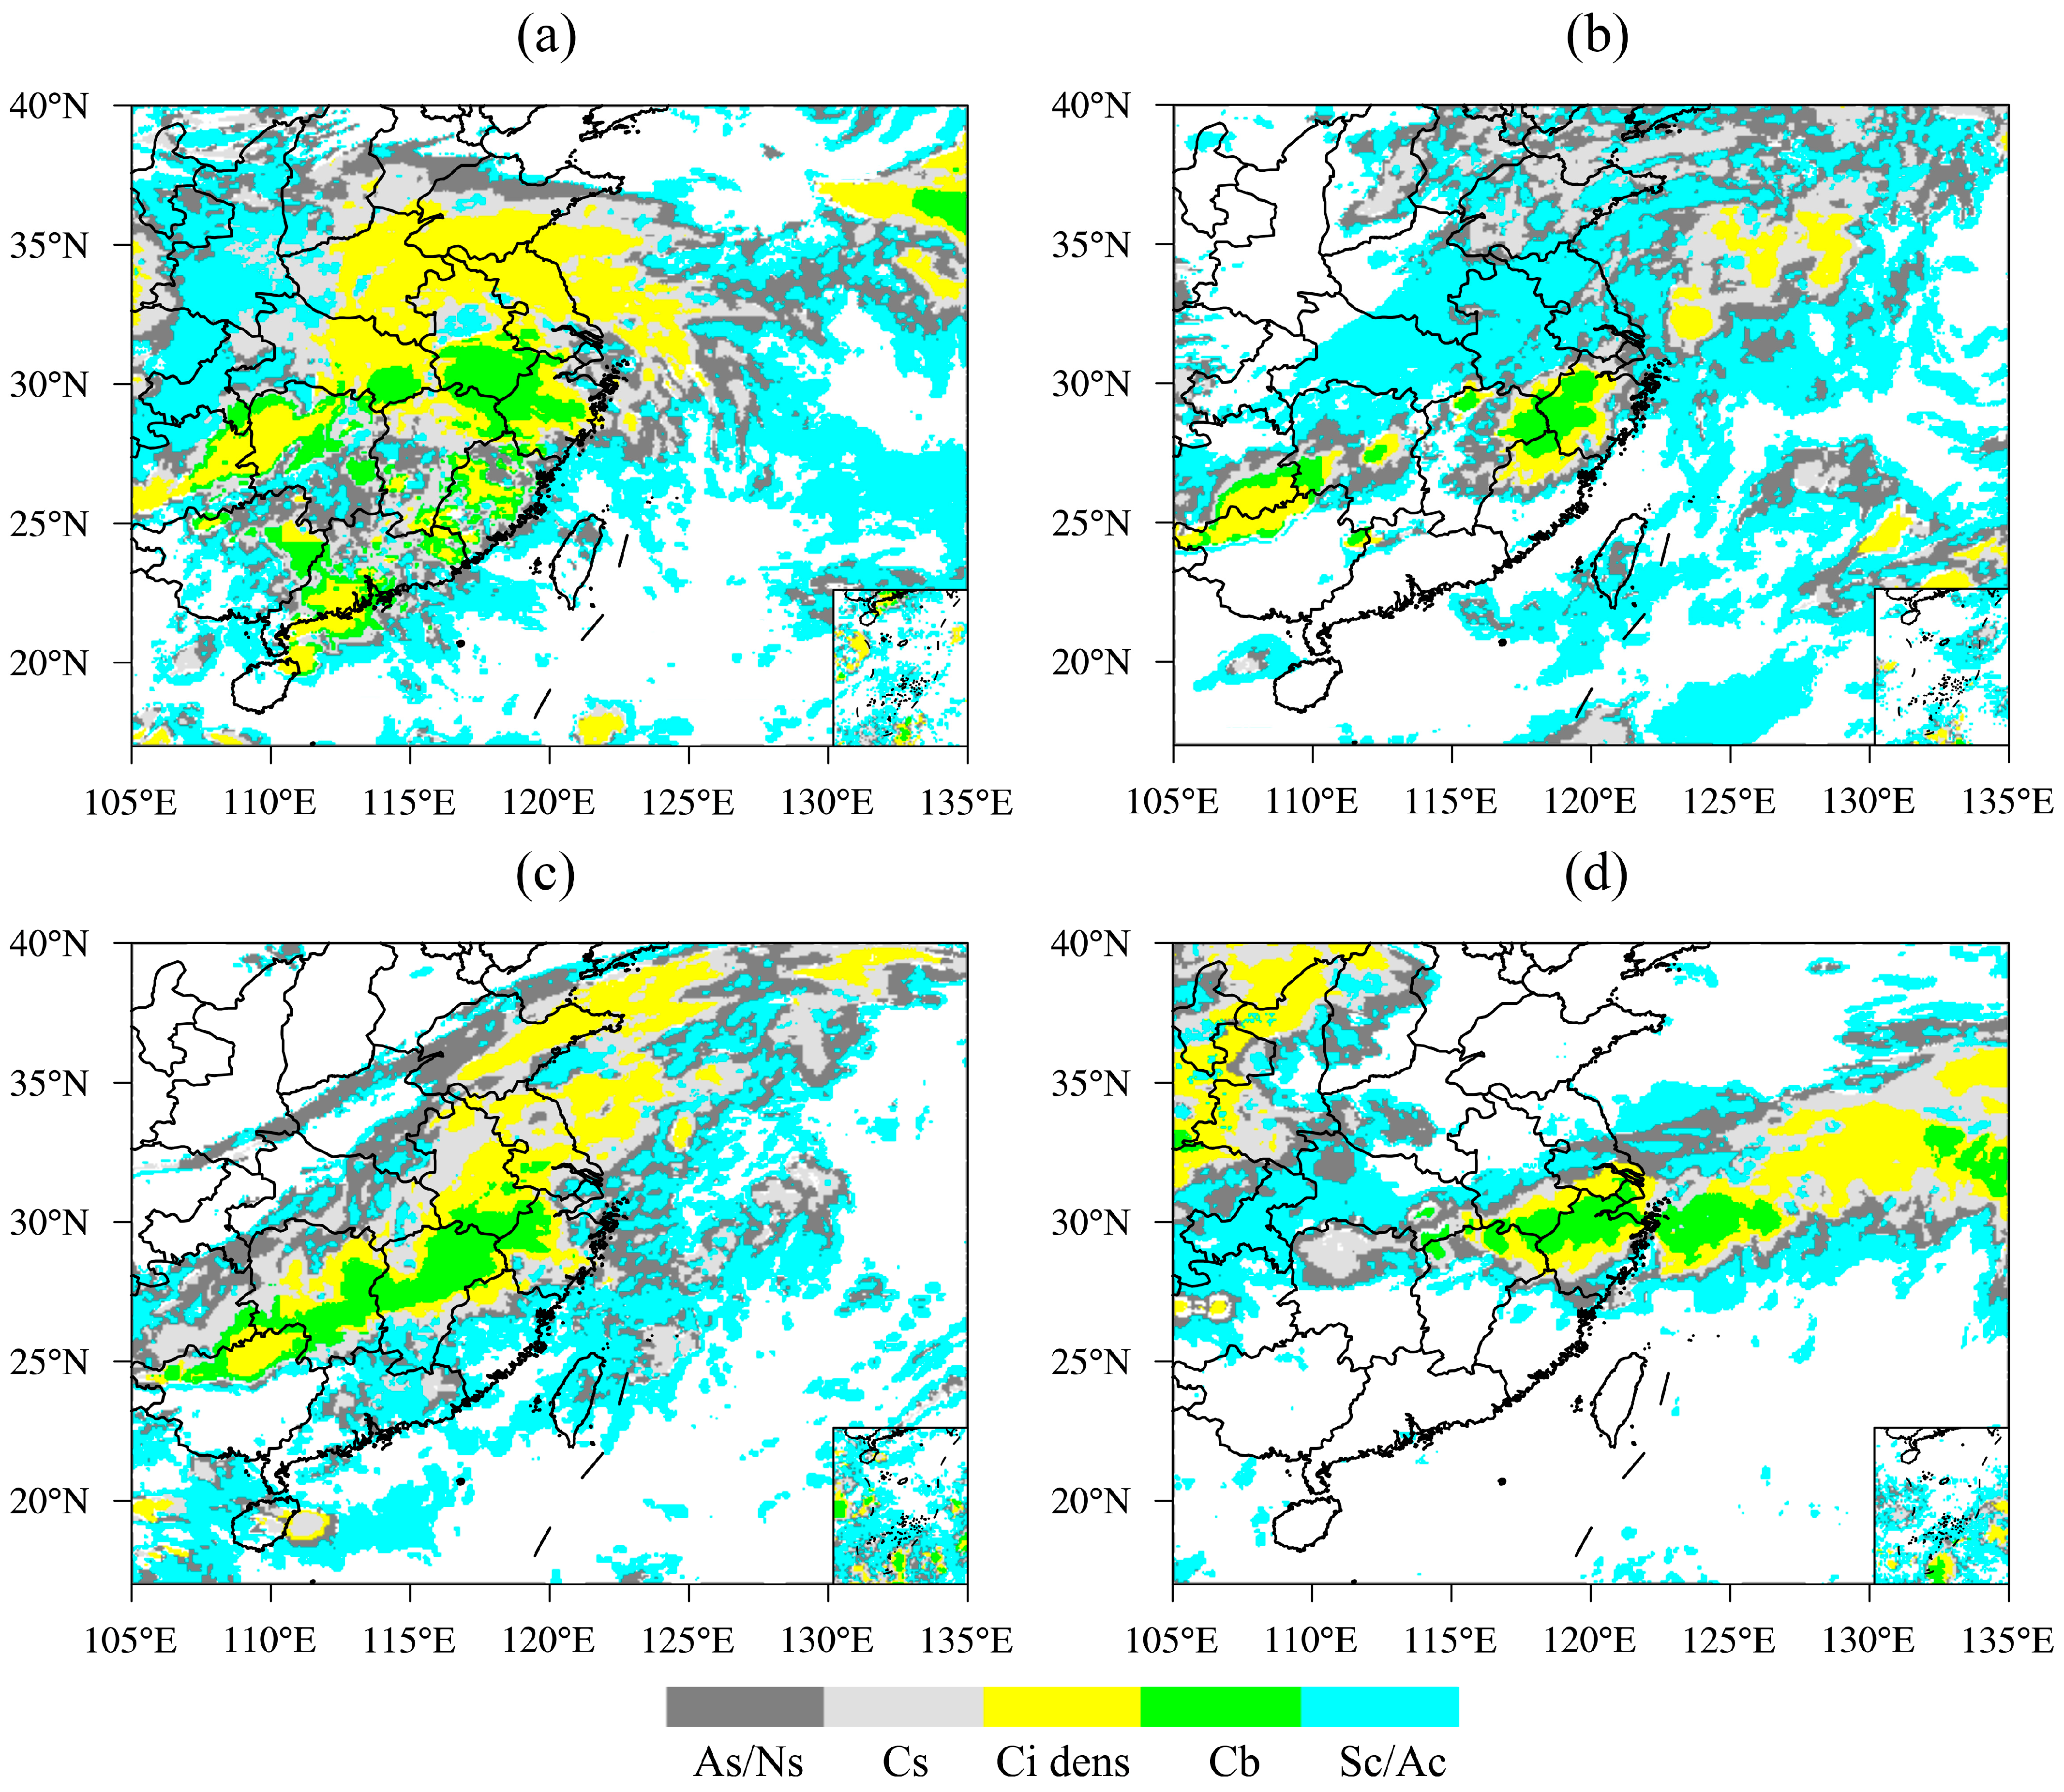
3.2. Discrimination of Precipitation Cloud Types

The distribution characteristics of cloud types associated with SWV rainfall vary among the four mentioned processes. In the “4.29” process, from 14:00 on 29 April to 14:00 on 30 April, when the eastward-moving SWV affected Zhejiang, the eastern part of China between 25° and 30° N was predominantly covered by dense cirrus clouds, cumulonimbus clouds, and stratocumulus clouds. Specifically, from 18:30 to 21:30 on the 29th, the Jiangnan region experienced thick cumulonimbus and dense cirrus clouds (Figure 2a). The vortex had a relatively slow movement speed, and convective cloud precipitation was dominant in its eastern and southern sectors. During the “5.29” event, the period that affected Zhejiang was primarily from 20:00 on 28 May to 08:00 on 30 May 2015. During this period, at 22:30 on the 29th, there were deep cumulonimbus clouds in the central and western parts of Zhejiang (Figure 2b), continuously supplemented by strong convective cloud systems from upstream regions. In the “5.11” event, after the SWV formed in its source region, it moved eastward along the middle and lower reaches of the Yangtze River, accompanied by the development of deep cumulonimbus and dense cirrus clouds in the southwestern region, which also moved eastward. After 10:00 on 11 May 2017, the intensity weakened, and stratocumulus clouds prevailed with relatively low cloud-top heights, resulting in stable precipitation. At 14:00, the cloud system merged and intensified, transforming into cumulonimbus and dense cirrus clouds. At 19:00, it affected the western part of Zhejiang, and, at 22:00, it developed into a continuous east-west cloud band (Figure 2c). Northern Guangxi and the northern part of Jiangnan experienced cumulonimbus clouds, while the central and southern parts of Zhejiang had stratocumulus or dense cirrus clouds. The precipitation was relatively weak. During the “5.25” event, which occurred from 14:00 on 25 May to 13:00 on 26 May 2018, the cloud systems associated with the SWV were mainly composed of dense cirrus clouds, cumulonimbus clouds, and stratocumulus clouds (Figure 2d). Before 00:00 on the 26th, the vortex cloud system mainly affected the central and northern parts of Zhejiang, gradually moving eastward and pressing southward after 00:00. By around 04:00, the southwest vortex cloud system affected the entire Zhejiang region, with strong convection developing in most areas. Later, around 08:00, clustered cumulonimbus clouds developed in western Zhejiang. During its eastward movement, the clouds gradually weakened, and the precipitation decreased accordingly, with stable precipitation primarily.
In summary, during these four events, cumulonimbus clouds and dense cirrus clouds prevailed in the low vortex center and the southeastern quadrant. The cloud systems were deep, compact, and eastward-moving, resulting in efficient convective precipitation. The heavy rainfall was primarily concentrated in the 25° to 30° N region. On the other hand, cloud systems in the northwest and southwest quadrants were relatively scattered and primarily consisted of stratiform clouds, leading to less efficient precipitation in the form of stable rainfall. The strongest precipitation occurred when the cloud systems were the deepest, while precipitation significantly weakened when the cloud systems transitioned into loose stratiform clouds. In conclusion, when the SWV was relatively strong, its cloud system had a wider impact range and a more compact structure (as observed in the “4.29” process), while weaker vortex intensity resulted in smaller affected areas and fragmented cloud systems (as observed in the “5.29” event).
Another method for identifying precipitation cloud types is to differentiate them based on the threshold of the TBB. In Figure 3a, the SWV cloud system was observed on 30 April 2013, at 18:30. The cloud types and cloud structure identified through the TBB were similar to the CLC product, and their coverage areas were also similar. The cloud system over the Jianghuai region was a typical vortex cloud system. At the same time, weak convective clouds were observed over most of Zhejiang Province, while, in the northwest region, there were severe convective clouds, corresponding to cumulus clouds and dense cirrus clouds in the CLC product (Figure 2a). In southern Shandong, there were mixed clouds, weak convective clouds, and convective clouds, corresponding to dense cirrus clouds in the CLC product. In Figure 3b, at 22:30 on 29 May 2015, the central and western parts of Zhejiang Province were classified as convective clouds capable of producing heavy rainfall based on the TBB threshold. The corresponding CLC product identified cumulus clouds and dense cirrus clouds, indicating favorable conditions for intense precipitation (Figure 2b). There were thick clouds and stratiform clouds that only produced light or moderate rain in the north of 32° N, which corresponded to stratiform or stratocumulus clouds in the CLC product. The two methods showed relatively consistent classification of precipitation cloud systems. In Figure 3c, during the middle of May 2017, the precipitation event caused by the combined influence of an SWV and a trough occurred. At 22:00 on 11 May, there was a typical “baroclinic leaf” cloud system in central and eastern China, while there were mixed clouds and rainstorm convective clouds inlaid in the northwest of Zhejiang, weak convective clouds in the central region, and stratiform clouds in the eastern region. The corresponding cloud types in the CLC products, from west to east, were cumulonimbus clouds, dense cirrus clouds, and stratiform clouds or stratocumulus clouds. Figure 3d shows a precipitation event caused by an SWV in late May 2018. At 01:00 on 26 May, the central and northern parts of Zhejiang Province were basically covered by massive convective clouds that produced heavy rainfall, and the edges of the convective cloud clusters in the northern and southern parts were covered by stratiform clouds or stratocumulus clouds. The CLC product identified cumulonimbus clouds and dense cirrus clouds for most areas of Zhejiang Province, and cirrostratus clouds, stratocumulus clouds, or altocumulus clouds for the southern part of Jiangsu Province and the northern part of Fujian Province.
In summary, when convective development is vigorous, the TBB threshold corresponds to convective clouds in the CLC product, specifically cumulonimbus clouds and stratocumulus clouds. When convective development is relatively weak, the TBB shows thick clouds and stratiform clouds, which correspond to stratiform clouds or stratocumulus clouds in the CLC product. When mixed clouds and weak convective clouds are observed in the TBB, the corresponding CLC product identifies dense cirrus clouds. The simultaneous presence of cumulonimbus clouds and dense cirrus clouds indicates the occurrence of heavy precipitation, while the presence of only dense cirrus clouds usually corresponds to weak convective or mixed precipitation. The consistent display of stratiform clouds or altostratus clouds indicates the occurrence of weak or stable precipitation.

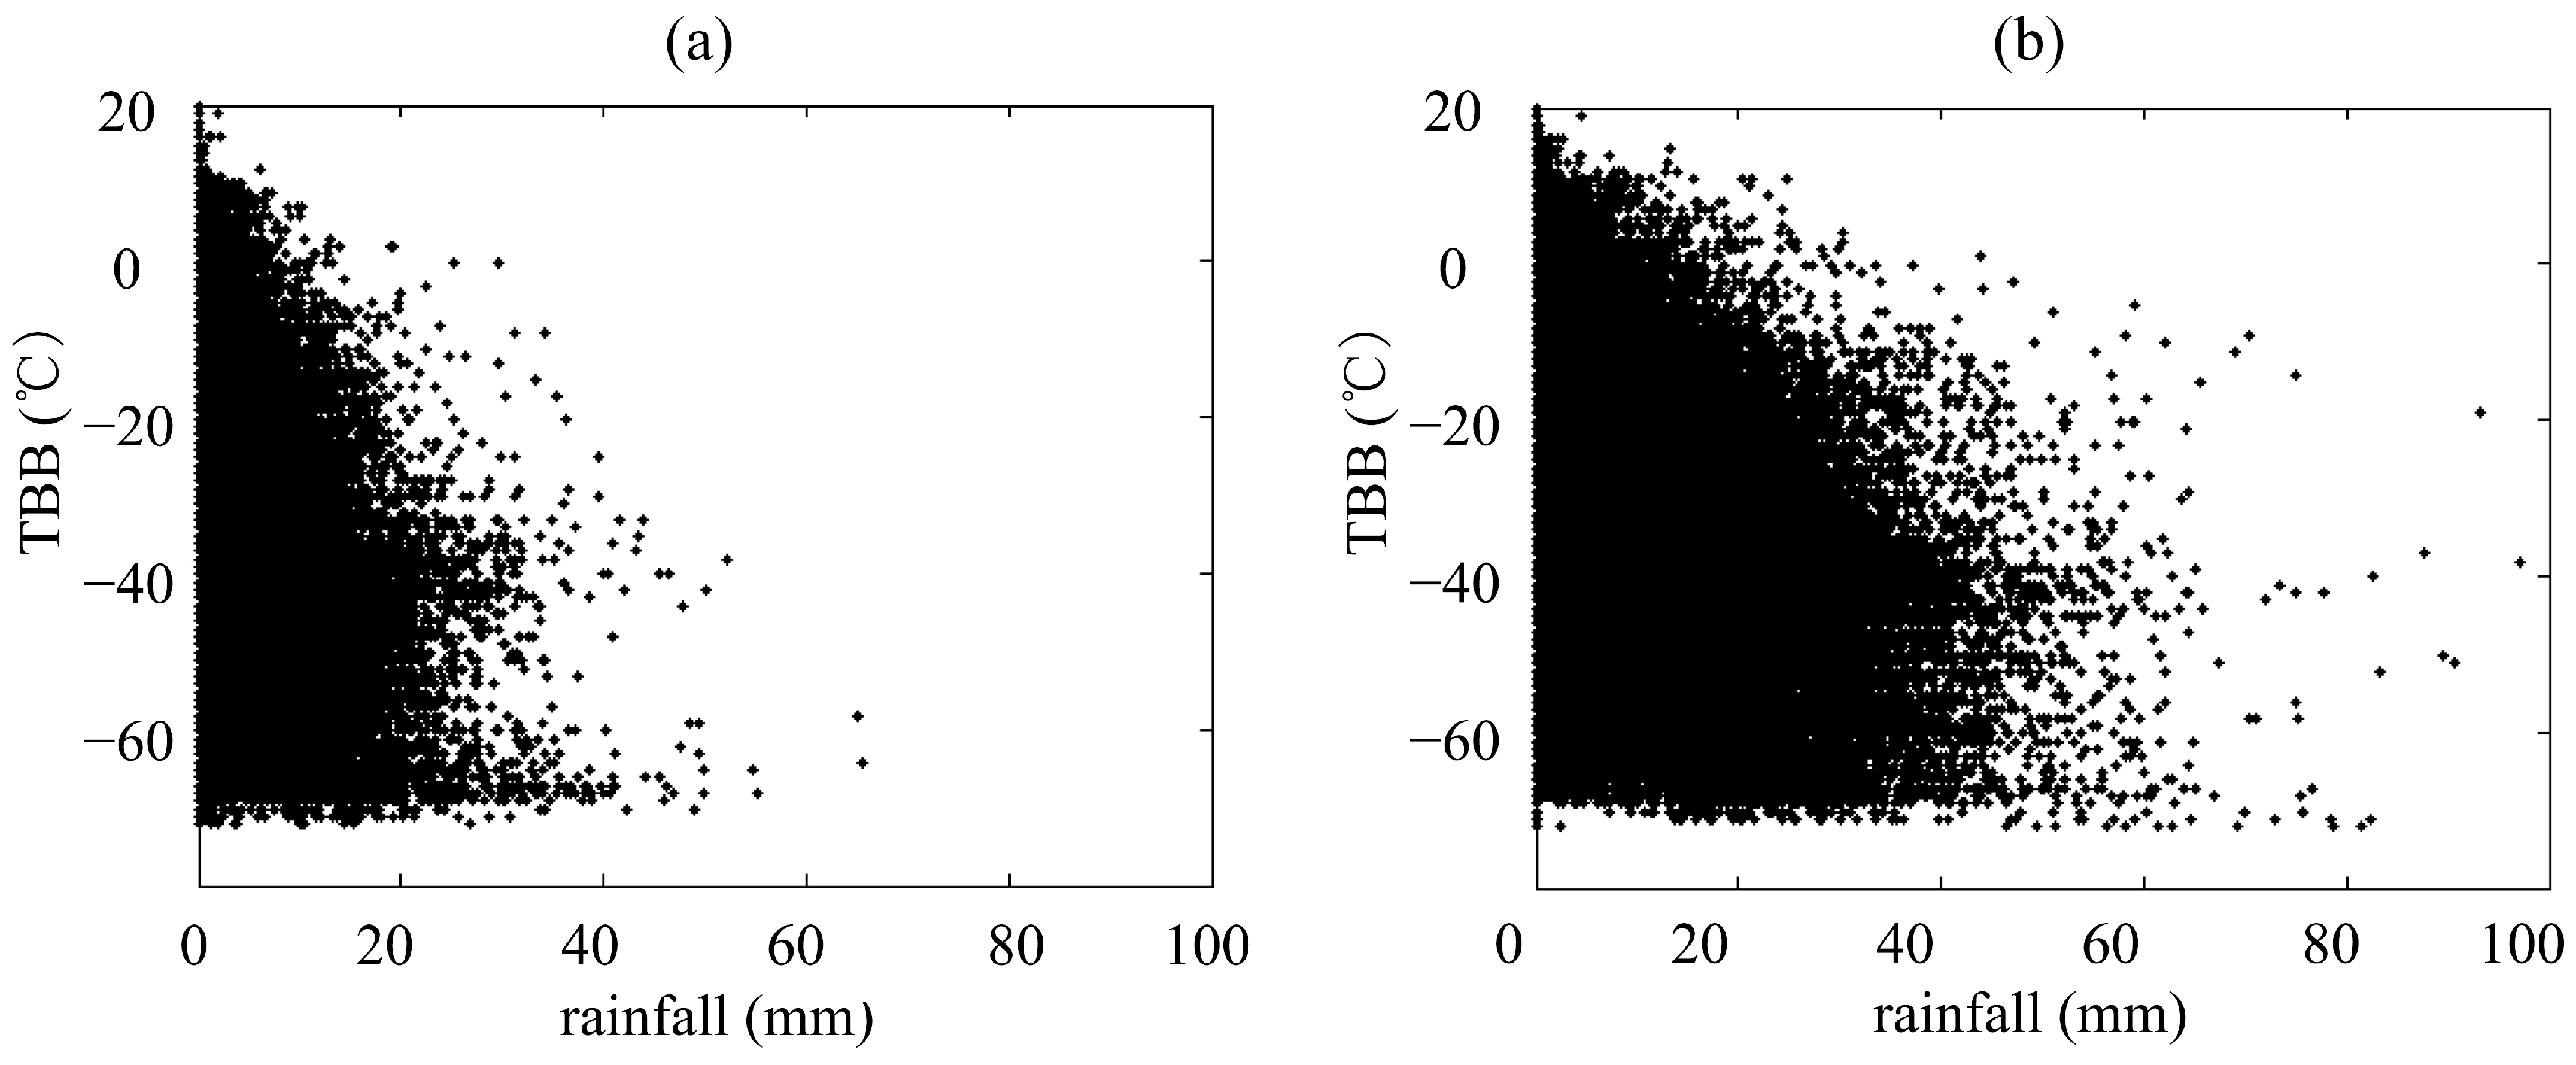
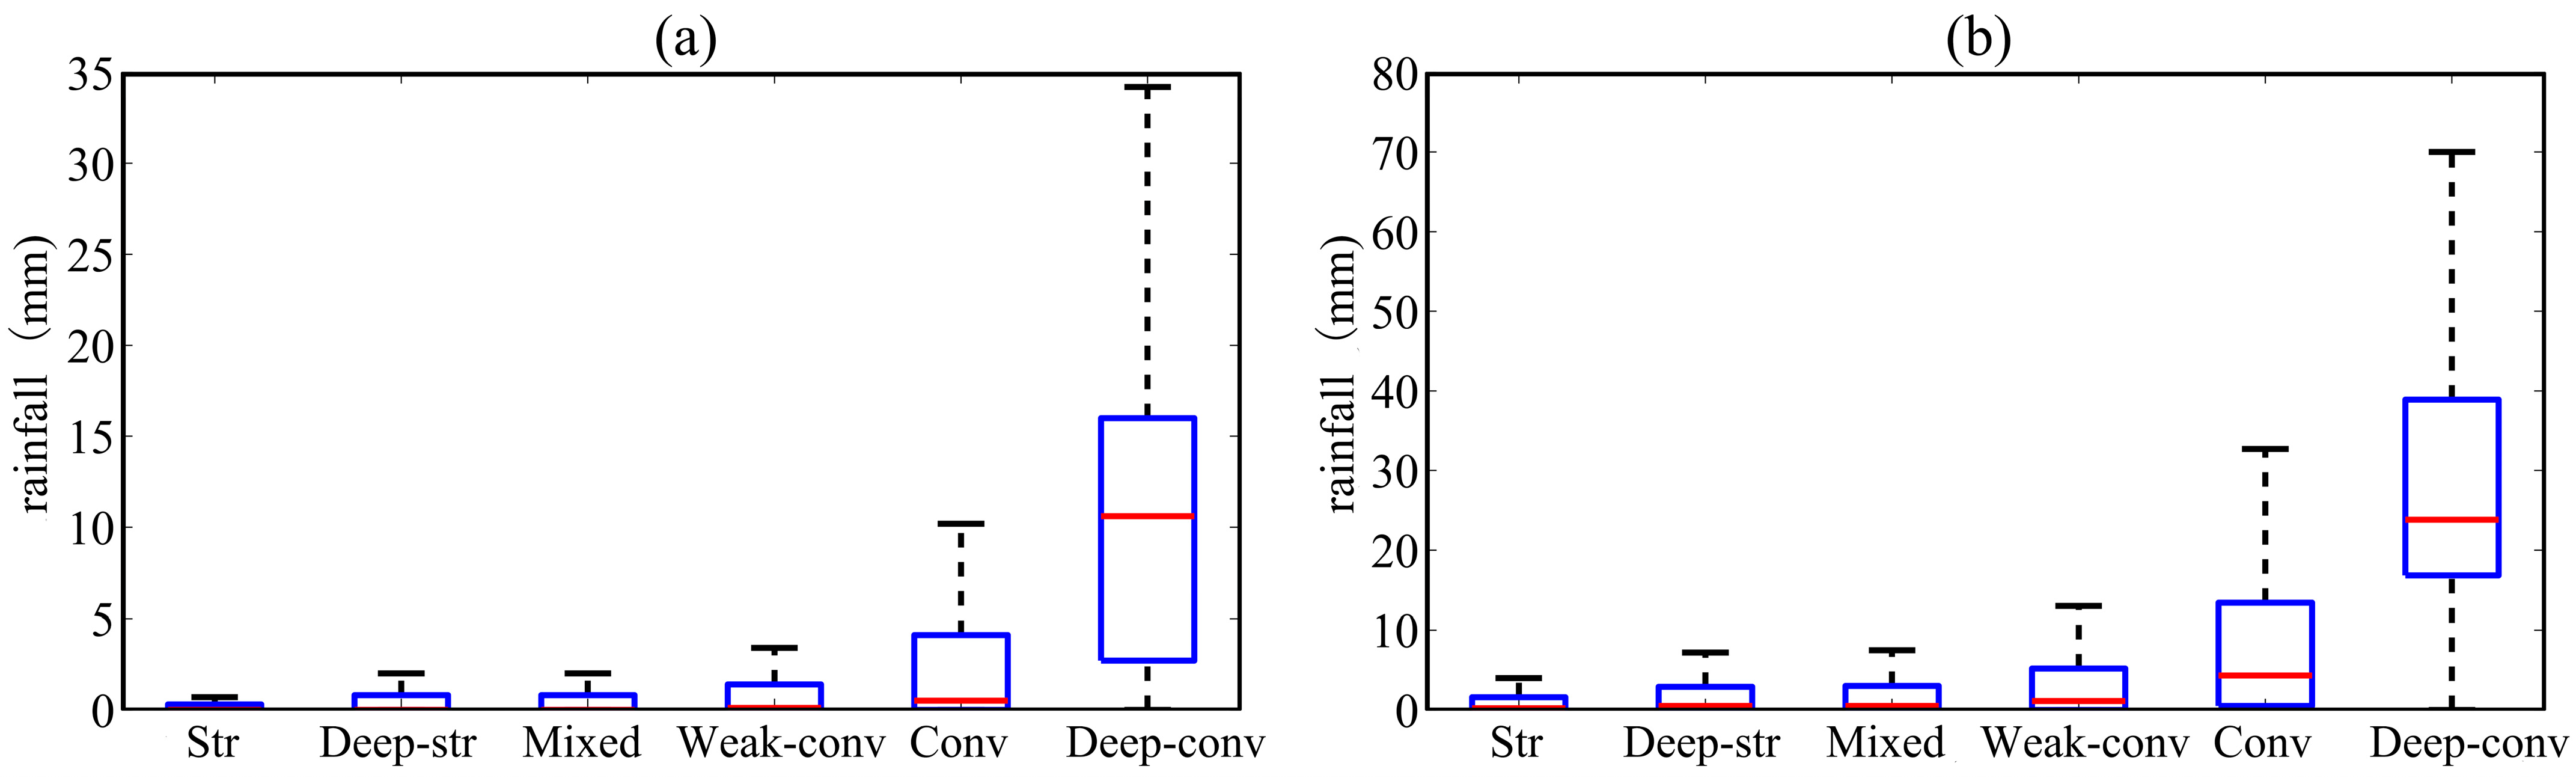
3.3. Quantitative Precipitation Application

The aforementioned analysis indicates a close relationship between the TBB and precipitation during the process of the eastward-moving southwest vortex cloud system affecting Zhejiang. In this study, 63 cases of eastward-moving SWV processes were selected, and statistical analyses were conducted to examine the hourly TBB values (280 data points) and corresponding precipitation amounts at each station for the following 1 h and 3 h. Density scatter plots were created to visualize the relationship between 1 h and 3 h precipitation amounts and the TBB values within the designated region. The results show an inverse relationship between the magnitude of the TBB and the corresponding changes in precipitation. When the TBB increases to a certain point, precipitation will not occur. For instance, when the TBB is above 20 °C, there is basically no precipitation. When the TBB is greater than −20 °C, the maximum 1 h precipitation is less than or equal to 20 mm, and the maximum 3 h precipitation is less than or equal to 30 mm. When the TBB is between −60 °C and −40 °C, the maximum 1 h precipitation is less than or equal to 25 mm, and the maximum 3 h precipitation is less than or equal to 40 mm (Figure 4a,b). This reveals a negative correlation between the TBB values and precipitation, with lower and more persistent TBB values associated with stronger precipitation intensity and larger accumulated precipitation. Therefore, the TBB threshold can serve as an important indicator for monitoring and forecasting precipitation intensity and accumulation during the southwest vortex processes.
Different quadrants of the SWV exhibit various precipitation cloud systems, resulting in variations in precipitation characteristics. To evaluate the quantitative application of the two classification methods mentioned above on SWV-induced precipitation in Zhejiang, this study established a corresponding relationship between cloud types based on the TBB threshold method and rainfall (Table 1). It is evident from Table 1 that the forecasting accuracy for convective clouds and precipitation is significant, whereas the differences in precipitation among stratiform clouds are relatively small. When stratiform clouds occur, the average rainfall amount for 1 h or 3 h is 0.5 mm or 1.7 mm. If the same cloud continues to affect the area within 24 h, the daily average precipitation is about 12 mm to 13.6 mm, corresponding to light rain, which is significantly smaller compared to the actual observations. This underestimates the actual rainfall, indicating a significant deviation. When deep stratiform clouds occur, the observed average rainfall for 1 h or 3 h is 0.8 mm or 2.5 mm. If the same cloud persists for 24 h, the predicted daily average rainfall is approximately 19.2 mm to 20 mm, indicating moderate rainfall, aligning with the expected outcomes of deep stratiform clouds producing moderate rainfall. For mixed clouds, the average rainfall for 1 h or 3 h is 0.9 mm or 2.7 mm. If the same cloud system continues to impact the area for 24 h, the daily average precipitation is expected to be 21.6 mm. Therefore, if the TBB method is used to predict mixed clouds, it may overestimate the rainfall, as the actual precipitation may only reach moderate rain. When convective clouds occur, the average rainfall for 1 h or 3 h is 3.0 mm or 8.4 mm. If the convective cloud cluster remains stable, the daily average precipitation is estimated to be 67.2 mm to 72.0 mm, indicating good predictive accuracy, which is close to the actual observation. When deep convective clouds persistently impact the area, the observed average rainfall for 1 h or 3 h is 11.0 mm or 30.0 mm. Based on this, it can be predicted that the 24 h precipitation will exceed 250 mm, and TBB threshold method is also effective in predicting extreme heavy rainfall.
In summary, the TBB threshold method can assist in quantitatively predicting the precipitation caused by different clouds during the SWV process to a certain extent. It shows good predictive accuracy for convective clouds and deep cloud systems, providing reference for early warnings. However, the prediction effect is limited for stratiform clouds due to their relatively small differences. When making predictions, cloud system evolution and dynamic factors should be considered, and a comprehensive judgment of possible precipitation should be made to avoid excessive reliance on the relationship between cloud systems and precipitation, which may lead to prediction errors.
According to the cloud types classified by the TBB threshold, it is found that the 1 h precipitation generated by stratiform clouds is below 40 mm, especially within 20 mm (Figure 5a), accounting for 18.85% of the total (Table 2). In contrast, mixed clouds (31.24% coverage) can generate a maximum of 50 mm of precipitation in 1 h, while convective clouds (6.08% coverage) can generate a maximum of 70 mm of precipitation in 1 h, primarily within 50 mm. It is worth noting that the average 1 h precipitation generated by deep convective clouds in this study is even lower than that of convective clouds. This is primarily attributed to the fact that there are only 119 instances of grid point data available for deep convective clouds in the selected cases, accounting for 0.02% coverage. As a result, there are significant uncertainties in precipitation. Moreover, the rapid evolution of cloud systems or the swift movement of systems can also result in localized one-hour rainfall, which may not be representative of the overall conditions.
Based on the cloud classification using the infrared temperature threshold, it can be seen that the 25th percentile value of the 1 h precipitation for deep convective clouds is 4 mm, indicating that 25% of the grid points have a small 1 h precipitation for deep convective clouds. The average precipitation of deep convective clouds is the highest at 11 mm, and the precipitation dispersion for this cloud type is the largest, ranging from 0 to 34 mm. The 1 h precipitation of convective clouds ranges from 0 to 10 mm, with an average of 1 mm. The 75th percentile value is 4 mm, meaning that 25% of the grid points have a 1 h precipitation above 4 mm. As shown in Figure 5a, stratiform clouds have the smallest precipitation dispersion, and the average 1 h precipitation is close to 0 mm, indicating the weakest occurrence of precipitation for stratiform clouds. Similarly, the average 3 h precipitation of convective clouds and deep convective clouds is around 8 mm and 22 mm, respectively, with 25% of the grid points having a 3 h precipitation of greater than or equal to 15 mm and 40 mm. The average 3 h precipitation of weak convective clouds and mixed clouds is about 4 mm and 3 mm, respectively. Assuming the cloud system remains unchanged at a certain point, it can produce heavy rain or moderate rain on average within one day (Figure 5b). The cloud classification product of the CLC shows similar average precipitation for different cloud types within 1 h but with a large dispersion, resulting in limited application performance (figure omitted).
In conclusion, the infrared temperature threshold method can be used to determine the precipitation characteristics produced by different cloud systems within 1 h or 3 h. Deep convective clouds and convective clouds have the potential to produce larger amounts of precipitation, while stratiform clouds produce weaker precipitation. However, considering the changes in cloud system evolution and rapid movement that may cause local effects, the representativeness of precipitation is relatively limited. More case studies of the SWV combined with comprehensive analysis and calculations using other observation instruments are necessary, especially for deep convective clouds, to reduce calculation errors and improve accuracy.

4. Conclusions

Using high-resolution satellite remote sensing data from FY-2F, cloud classification and quantitative precipitation estimation were applied to study the eastward-moving SWV that affected Zhejiang Province during the warm season from April to October between 2010 and 2020. The conclusions are as follows:
  • The variations in the intensity and position of the eastward-moving SWV often result in significant differences in precipitation intensity and distribution. Localized precipitation dominates in the SWV that affects Zhejiang, resulting in heavy rainfall and long duration. The SWV with convective precipitation as the main type often has multiple precipitation centers. The stronger the southwest vortex, the stronger and wider the development of convective clouds near the center, with stratiform or stratocumulus clouds dominating in the periphery. The center and southeast quadrant of the vortex are dominated by cumulonimbus and dense cirrus clouds, with high cloud-top heights and heavy precipitation, mainly in the form of convective precipitation. Other quadrants are dominated by stratiform or stratocumulus clouds, resulting in stable precipitation with lower rainfall amounts.
  • The infrared brightness temperature threshold method can effectively identify cloud types within the SWV, providing an important reference for precipitation forecasting. When the TBB is below −70 °C (indicating deep convective clouds), both the forecast and observations indicate severe rainstorms. When the TBB is between −70 °C and −50 °C (indicating convective clouds), both the forecast and observations indicate heavy rainfall. Therefore, the TBB threshold method shows good predictive performance for forecasting moderate rain, heavy rain, and extremely heavy rain, based on the classification of thick cloud, convective cloud, and deep convective cloud. However, it tends to overestimate the precipitation for mixed clouds (forecasting heavy rain as severe rain) and underestimate the precipitation for stratiform clouds (forecasting moderate rain as light rain).
  • There are significant differences in precipitation amounts produced by different cloud types, but a rough estimation can be made through a combination of qualitative and quantitative analysis. The different cloud types classified based on the TBB threshold show significant differences in precipitation within Zhejiang province. It is challenging to accurately forecast short-term precipitation. Deep convective clouds have the largest dispersion, with an average precipitation of 11 mm and 30 mm for 1 h and 3 h periods, respectively. Estimating short-term precipitation for different processes requires the use of other precipitation observation products for comprehensive analysis. Stratiform clouds have the smallest dispersion and the least precipitation, with the least variability. Under the assumption that cloud systems remain unchanged in the short term, the precipitation amounts produced by different cloud types can be roughly estimated.
In conclusion, the TBB threshold method can provide a rough estimation of hourly rainfall during the eastward-moving southwest vortex process, with certain advantages for forecasting moderate rain, heavy rain, and extremely heavy rain. It can be used as an auxiliary tool for near-term precipitation estimation in Zhejiang province. For more detailed precipitation forecasts, the use of multiple observation products in combination is required.

Author Contributions

Conceptualization, H.L.; data curation, L.G.; formal analysis, C.M.; funding acquisition, Z.G.; methodology, Y.Q.; project administration, J.L.; supervision, C.Z.; writing—original draft, C.M.; writing—review and editing, Y.Q. and Z.Q. All authors have read and agreed to the published version of the manuscript.

Funding

This research was funded by the Special Project for Review and Summation of China Meteorological Administration (FPZJ2023-055) and the Key Project of Zhejiang Meteorological Bureau (2022ZD29).

Institutional Review Board Statement

Not applicable.

Informed Consent Statement

Not applicable.

Data Availability Statement

The data presented in this study are available on request from the corresponding author. The data are not publicly available due to privacy.

Acknowledgments

We would like to acknowledge the reviewers and editor for their helpful comments and suggestions.

Conflicts of Interest

The authors declare no conflict of interest.

References

  1. Wang, Q.W.; Tan, Z.M. Multi-scale topographic control of southwest vortex formation in Tibetan Plateau region in an idealized simulation. J. Geophys. Res. Atmos. 2014, 119, 11543–11561. [Google Scholar] [CrossRef]
  2. Wu, G.X.; Chen, S.J. The effect of mechanical forcing on the formation of a mesoscal vortex. Q. J. R. Meteorol. Soc. 1985, 111, 1049–1070. [Google Scholar] [CrossRef]
  3. Li, L.; Zhang, R.H. Evolution mechanisms, impacts, and variations of the vortices originated from the Tibetan Plateau. Earth-Sci. Rev. 2023, 242, 104463. [Google Scholar] [CrossRef]
  4. Feng, X.Y.; Liu, C.H.; Fan, G.Z.; Liu, X.D.; Feng, C.Y. Climatology and Structures of Southwest Vortices in NCEP Climate Forecast System Reanalysis. J. Clim. 2016, 29, 7675–7701. [Google Scholar] [CrossRef]
  5. Fu, S.M.; Li, W.L.; Sun, J.H.; Zhang, J.P.; Zhang, Y.C. Universal evolution mechanisms and energy conversion characteristics of long-lived mesoscale vortices over the Sichuan Basin. Atmos. Sci. Lett. 2015, 16, 127–134. [Google Scholar] [CrossRef]
  6. Yu, S.H.; Gao, W.L.; Xiao, D.X.; Peng, J. Observational facts regarding the joint activities of the southwest vortex and plateau vortex after its departure from the Tibetan Plateau. Adv. Atmos. Sci. 2016, 33, 34–46. [Google Scholar] [CrossRef]
  7. Li, G.P.; Chen, J. New progresses in the research of heavy rain vortices formed over the southwest China. Torrential Rain Disasters 2018, 37, 293–302. (In Chinese) [Google Scholar] [CrossRef]
  8. Ma, X.D.; Zhi, X.F.; Wang, J.; Chen, J.; Feng, H.Z. Analysis of the Southwest Vortex activities in summer and their relationship with precipitation during the period of 1979–2016. Trans. Atmos. Sci. 2018, 41, 198–206. (In Chinese) [Google Scholar] [CrossRef]
  9. Li, J.; Chen, H.M.; Rong, X.Y.; Su, J.Z.; Xin, Y.F.; Furtado, K.; Milton, S.; Li, N. How Well Can a Climate Model Simulate an Extreme Precipitation Event: A Case Study Using the Transpose-AMIP Experiment. J. Clim. 2018, 31, 6543–6556. [Google Scholar] [CrossRef]
  10. Chen, Y.R.; Li, Y.Q.; Zhao, T.L. Cause Analysis on Eastward Movement of Southwest China Vortex and Its Induced Heavy Rainfall in South China. Adv. Meteorol. 2015, 2015, 481735. [Google Scholar] [CrossRef]
  11. Luo, Y.L.; Wu, M.W.; Ren, F.M.; Li, J.; Wong, W.K. Synoptic Situations of Extreme Hourly Precipitation over China. J. Clim. 2016, 29, 8703–8719. [Google Scholar] [CrossRef]
  12. Xiang, S.Y.; Li, Y.Q.; Li, D.; Yang, S. An analysis of heavy precipitation caused by a retracing plateau vortex based on TRMM data. Meteor. Atmos. Phys. 2013, 122, 33–45. [Google Scholar] [CrossRef]
  13. Fu, S.M.; Tang, H.; Sun, J.H.; Zhao, T.B.; Li, W.L. Historical rankings and vortices’ activities of the extreme Mei-yu seasons: Contrast 2020 to previous Mei-yu seasons. Geophys. Res. Lett. 2022, 49, e2021GL096590. [Google Scholar] [CrossRef]
  14. Liu, H.S.; Huang, X.G.; Fei, J.F.; Zhang, C.; Cheng, X.P. Spatiotemporal features and associated synoptic patterns of extremely persistent heavy rainfall over China. J. Geophys. Res.-Atmos. 2022, 127, e2022JD036604. [Google Scholar] [CrossRef]
  15. Li, Y.Q.; Li, D.J.; Yang, S.; Liu, C.; Zhong, A.H. Characteristics of the precipitation over the eastern edge of the Tibetan Plateau. Meteor. Atmos. Phys. 2010, 106, 49–56. [Google Scholar] [CrossRef]
  16. Shou, Y.X.; Lu, F.; Liu, H.; Cui, P.; Shou, S.W.; Liu, J. Satellite-based Observational Study of the Tibetan Plateau Vortex: Features of Deep Convective Cloud Tops. Adv. Atmos. Sci. 2019, 36, 189–205. [Google Scholar] [CrossRef]
  17. Yu, Z.F. Physical and Optical Properties of Clouds in the Southwest Vortex from FY-4A Cloud Retrievals. J. Appl. Meteorol. Clim. 2022, 61, 1123–1138. [Google Scholar] [CrossRef]
  18. Wang, H.; Tan, L.Y.; Zhang, F.G.; Zheng, J.F.; Liu, Y.X.; Zeng, Q.Y.; Yan, Y.L.; Ren, X.Y.; Xiang, J. Three-Dimensional Structure Analysis and Droplet Spectrum Characteristics of Southwest Vortex Precipitation System Based on GPM-DPR. Remote Sens. 2022, 14, 4063. [Google Scholar] [CrossRef]
  19. Xiang, S.Y.; Li, Y.Q.; Zhai, S.X.; Peng, J. Comparative analysis of precipitation structures in two Southwest China Vortex events over eastern Sichuan Basin by TRMM. J. Atmos. Sol.-Terr. Phys. 2021, 221, 105691. [Google Scholar] [CrossRef]
  20. Zhao, H.G.; Yang, B.G.; Yang, S.T.; Huang, Y.C.; Dong, G.T.; Bai, J.; Wang, Z.W. Systematical estimation of GPM-based global satellite mapping of precipitation products over China. Atmos. Res. 2018, 201, 206–217. [Google Scholar] [CrossRef]
  21. Chen, K.Y.; Fan, J.; Xian, Z.P. Assimilation of MWHS-2/FY-3C 183 GHz Channels Using a Dynamic Emissivity Retrieval and Its Impacts on Precipitation Forecasts: A Southwest Vortex Case. Adv. Meteorol. 2021, 2021, 6427620. [Google Scholar] [CrossRef]
  22. Zhao, D.J.; Xu, H.X.; Yu, Y.B.; Chen, L.S. Identification of synoptic patterns for extreme rainfall events associated with landfalling typhoons in China during 1960–2020. Adv. Clim. Chang. Res. 2022, 13, 651–665. [Google Scholar] [CrossRef]
  23. Zhou, K.; Ran, L.K.; Zhou, L.B.; Zhao, T.B.; Chen, L.; Liu, H.W. The study of Fengyun4A temperature profile data assimilation in a southwest vortex heavy rainfall case. Atmos. Res. 2023, 283, 106566. [Google Scholar] [CrossRef]
  24. Ren, J.; Huang, Y.; Guan, L.; Ye, J.Y.; Ni, T. Application of FY-2 satellite data in radar rainfall estimation. Remote Sens. Inf. 2017, 32, 39–44. (In Chinese) [Google Scholar] [CrossRef]
  25. Zhang, Q.H.; Li, R.M.; Guo, L.J.; Sun, J.Z.; Lu, F.; Xu, J.; Zhang, F. A Review of Research on the Record-Breaking Precipitation Event in Henan Province, China, July 2021. Adv. Atmos. Sci. 2023, 40, 1485–1500. [Google Scholar] [CrossRef]
Figure 1. Spatial distribution of accumulated precipitation from 13:00 BST on 29 to 23:00 BST on 30 April 2013 (a), 06:00 BST on 29 to 07:00 BST on 30 May 2015 (b), 18:00 BST on 11 to 08:00 BST on 12 May 2017 (c), 17:00 BST on 25 to 17:00 BST on 26 May 2018 (d) in Zhejiang province (unit: mm).
Atmosphere 14 01664 g001
Figure 2. The FY-2F satellite CLC distribution of eastward-moving southwest vortex at 18:30 BST on 29 April 2013 (a), 22:30 BST on 29 May 2015 (b), 22:00 BST on 11 May 2017 (c), and 01:00 BST on 26 May 2018 (d).
Atmosphere 14 01664 g002
Figure 3. The FY-2F satellite cloud types corresponding to TBB thresholds during eastward-moving southwest vortex at 18:30 BST on 29 April 2013 (a), 22:30 BST on 29 May 2015 (b), 22:00 BST on 11 May 2017 (c), and 01:00 BST on 26 May 2018 (d).
Atmosphere 14 01664 g003
Figure 4. Scatter plots of 1 h precipitation (a) and 3 h precipitation (b) versus TBB from 2010 to 2020.
Atmosphere 14 01664 g004
Figure 5. Boxplots of 1 h precipitation (a) and 3 h precipitation (b) versus cloud types classified by TBB threshold (unit: mm). (The highest and lowest short horizontal lines represent the statistical maximum and the minimum, respectively; the upper and bottom box lines represent the upper and bottom quartile, respectively, and the line within the box represents the median).
Atmosphere 14 01664 g005
Table 1. Correspondence between cloud types classified by TBB threshold method and precipitation from 2010 to 2020 (unit: mm).
Cloud Types Classified by TBBStratiform
Clouds
Deep Stratiform
Clouds
Mixed CloudsWeak Convective CloudsConvective CloudsDeep Convective Clouds
PrecipitationLight rainModerate rainHeavy rainHeavy rainDownpourHeavy downpour
1 h precipitation0.50.80.91.33.011.0
3 h precipitation1.72.52.74.08.430.0
Table 2. Proportion of cloud types classified by TBB threshold method and CLC product during eastward-moving SWV.
TBBStratiform
Clouds
Deep Stratiform
Clouds
Mixed CloudsWeak Convective CloudsConvective CloudsDeep Convective Clouds
104,847 (18.85%)139,912 (25.15%)173,639 (31.24%)103,496 (18.66%)33,688 (6.08%)119 (0.02%)
CLCMixed CloudsStratiform CloudsCsCi DensCbSc
11,747 (3.84%)71,934 (23.52%)60,617 (19.82%)23,474 (7.67%)7564 (2.47%)130,567 (42.68%)
Disclaimer/Publisher’s Note: The statements, opinions and data contained in all publications are solely those of the individual author(s) and contributor(s) and not of MDPI and/or the editor(s). MDPI and/or the editor(s) disclaim responsibility for any injury to people or property resulting from any ideas, methods, instructions or products referred to in the content.

