

Study of the Sea Temperature Backgrounds to Tropical Cyclones Affecting Hainan Province in the Dry Season

Abstract
:1. Introduction
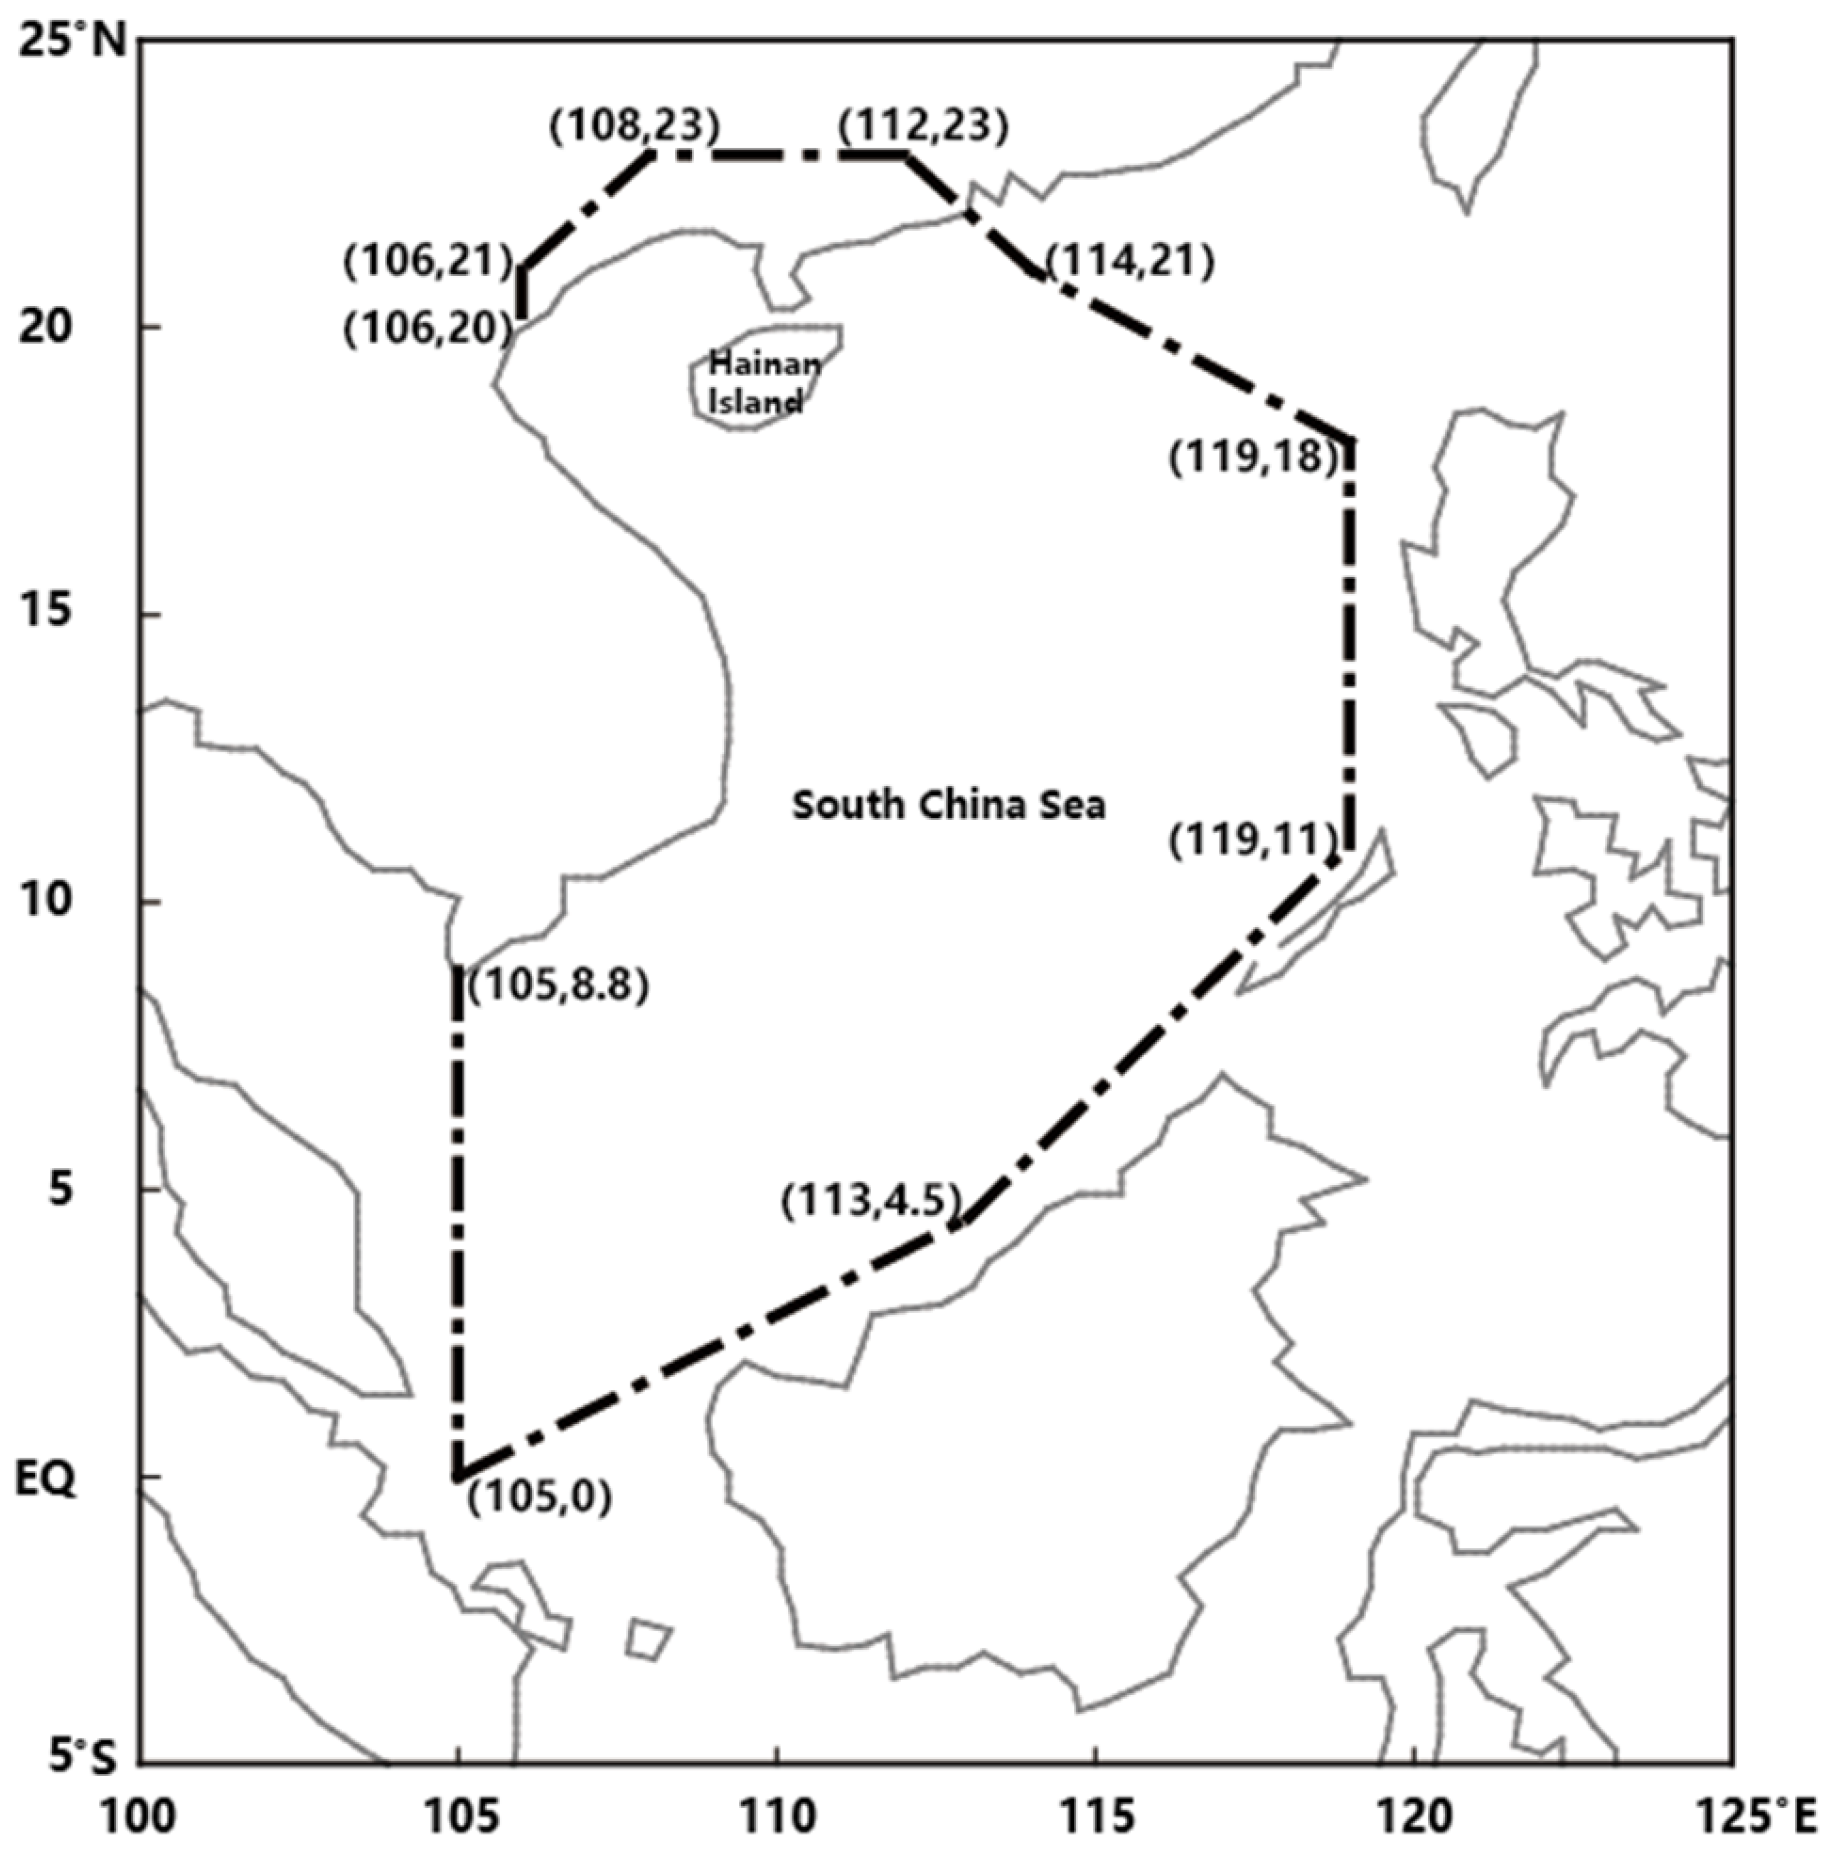
2. Data and Methods
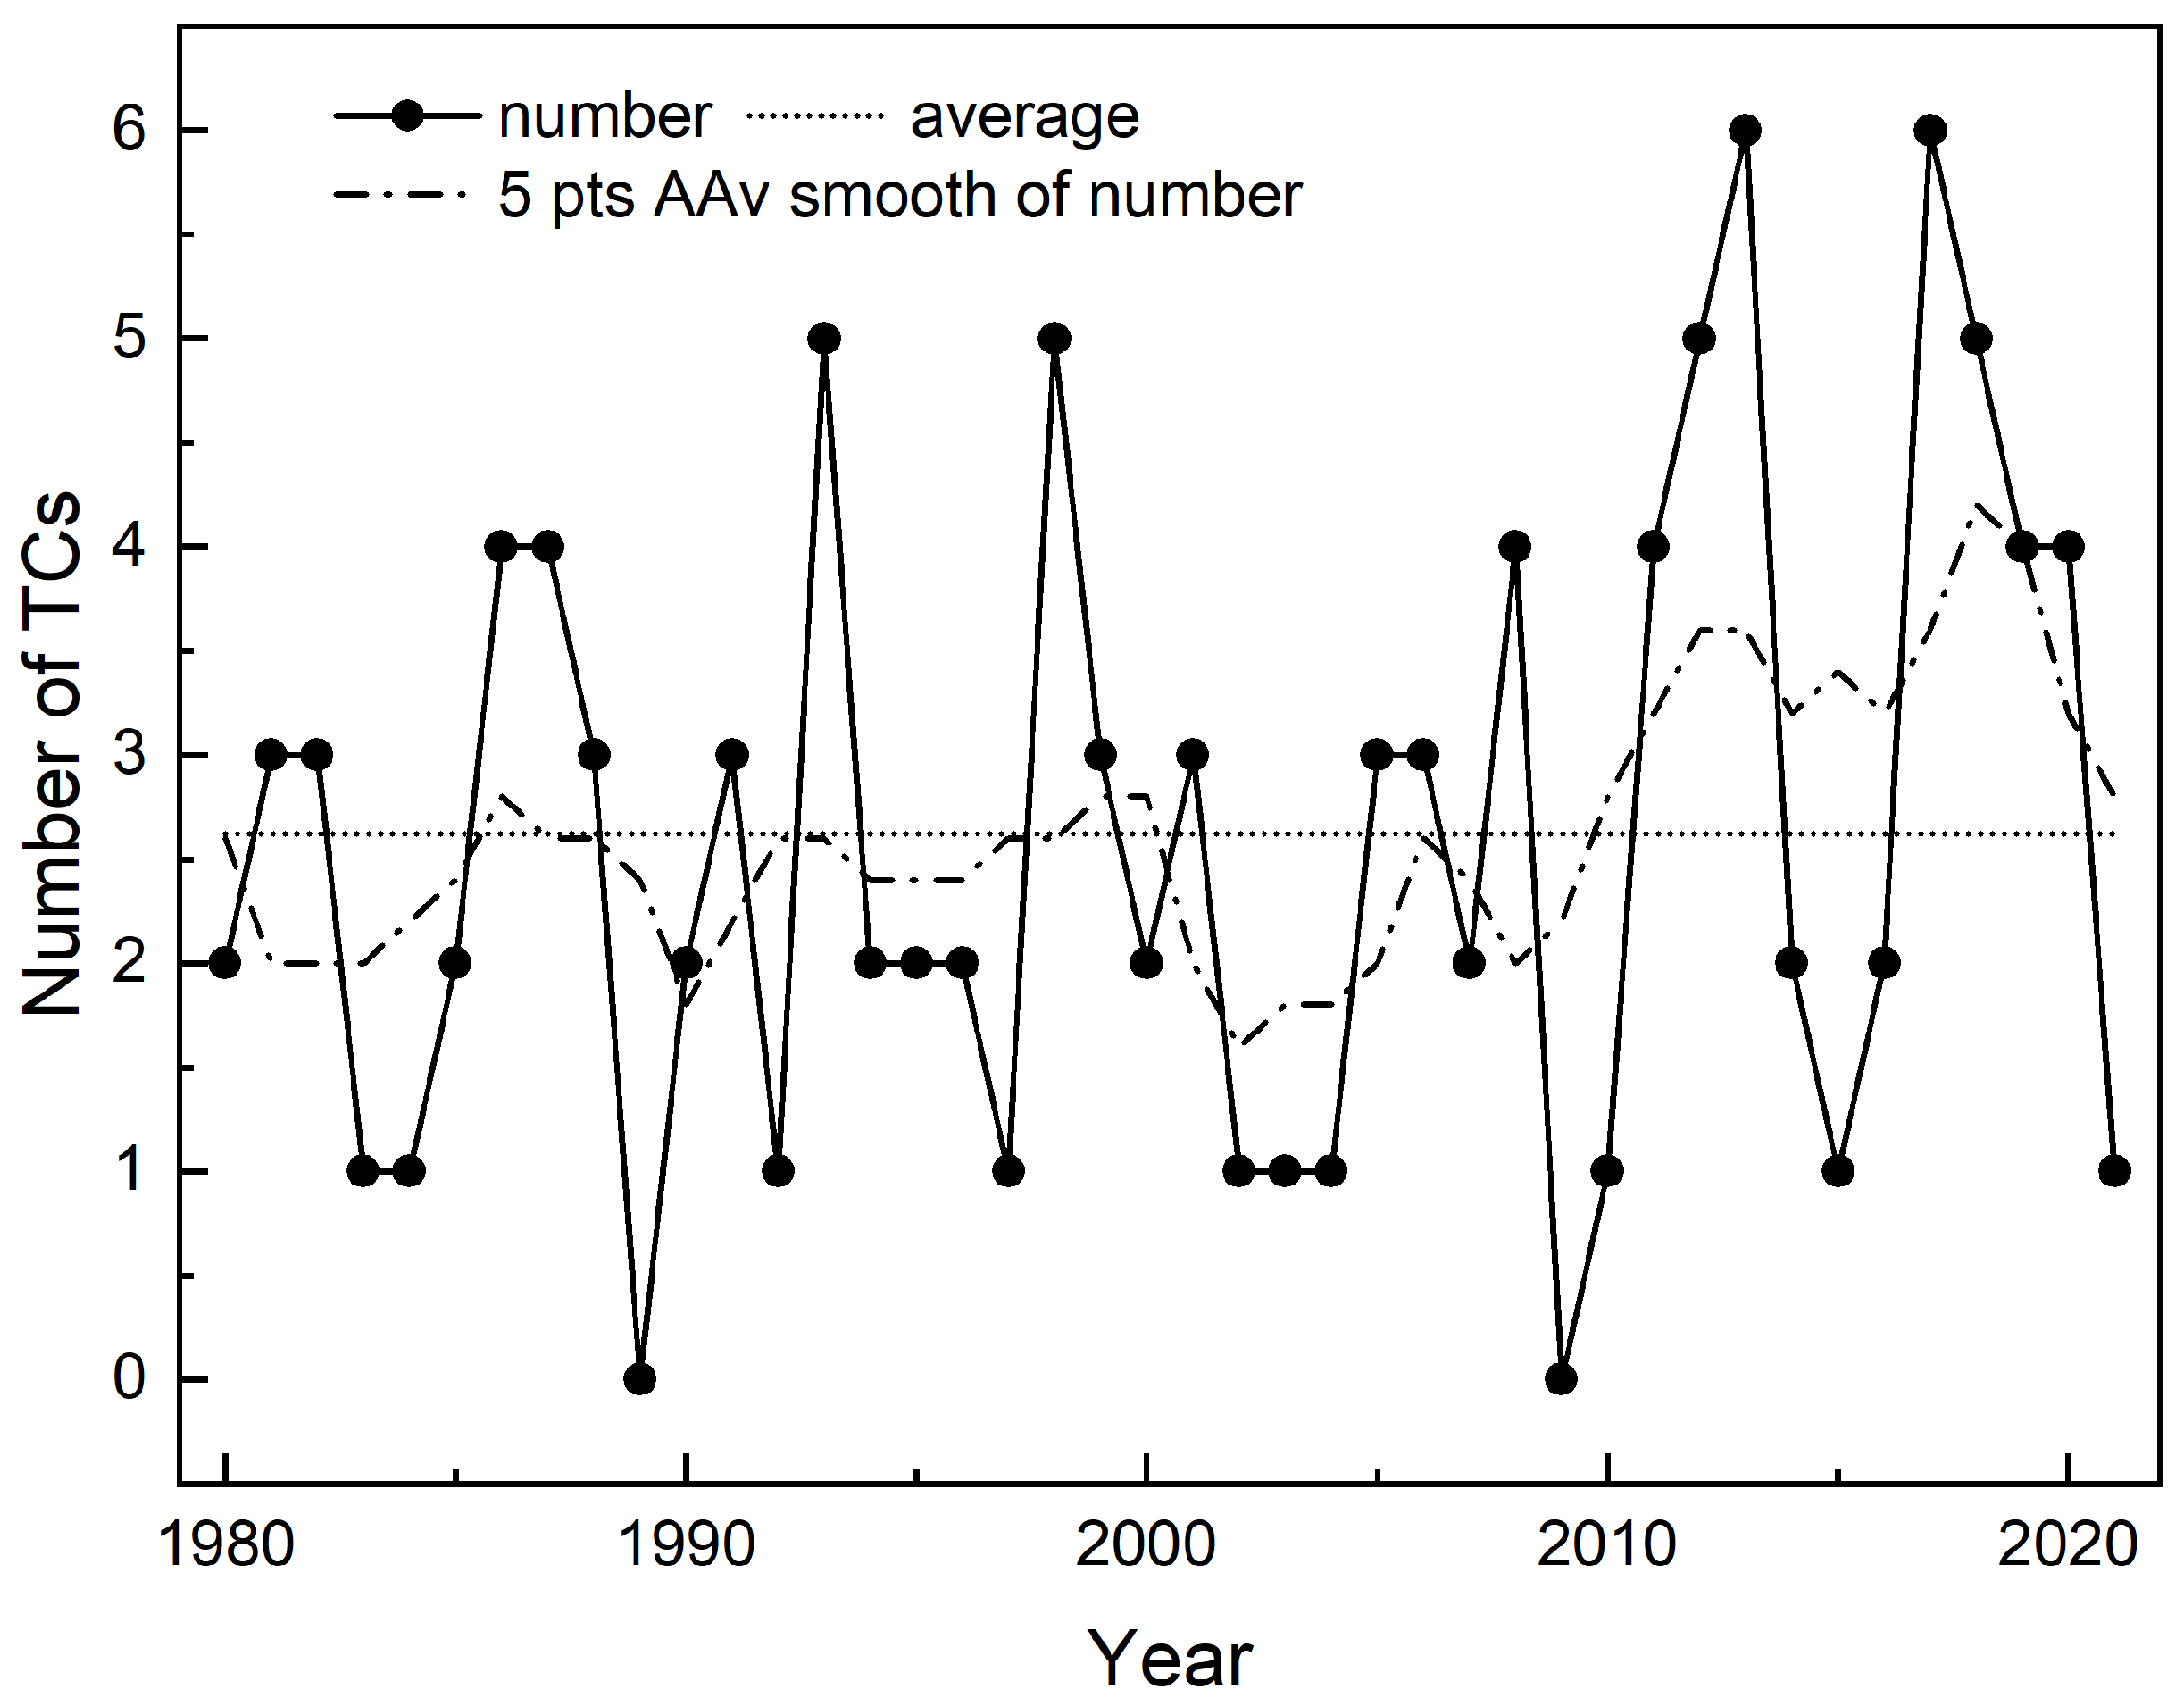
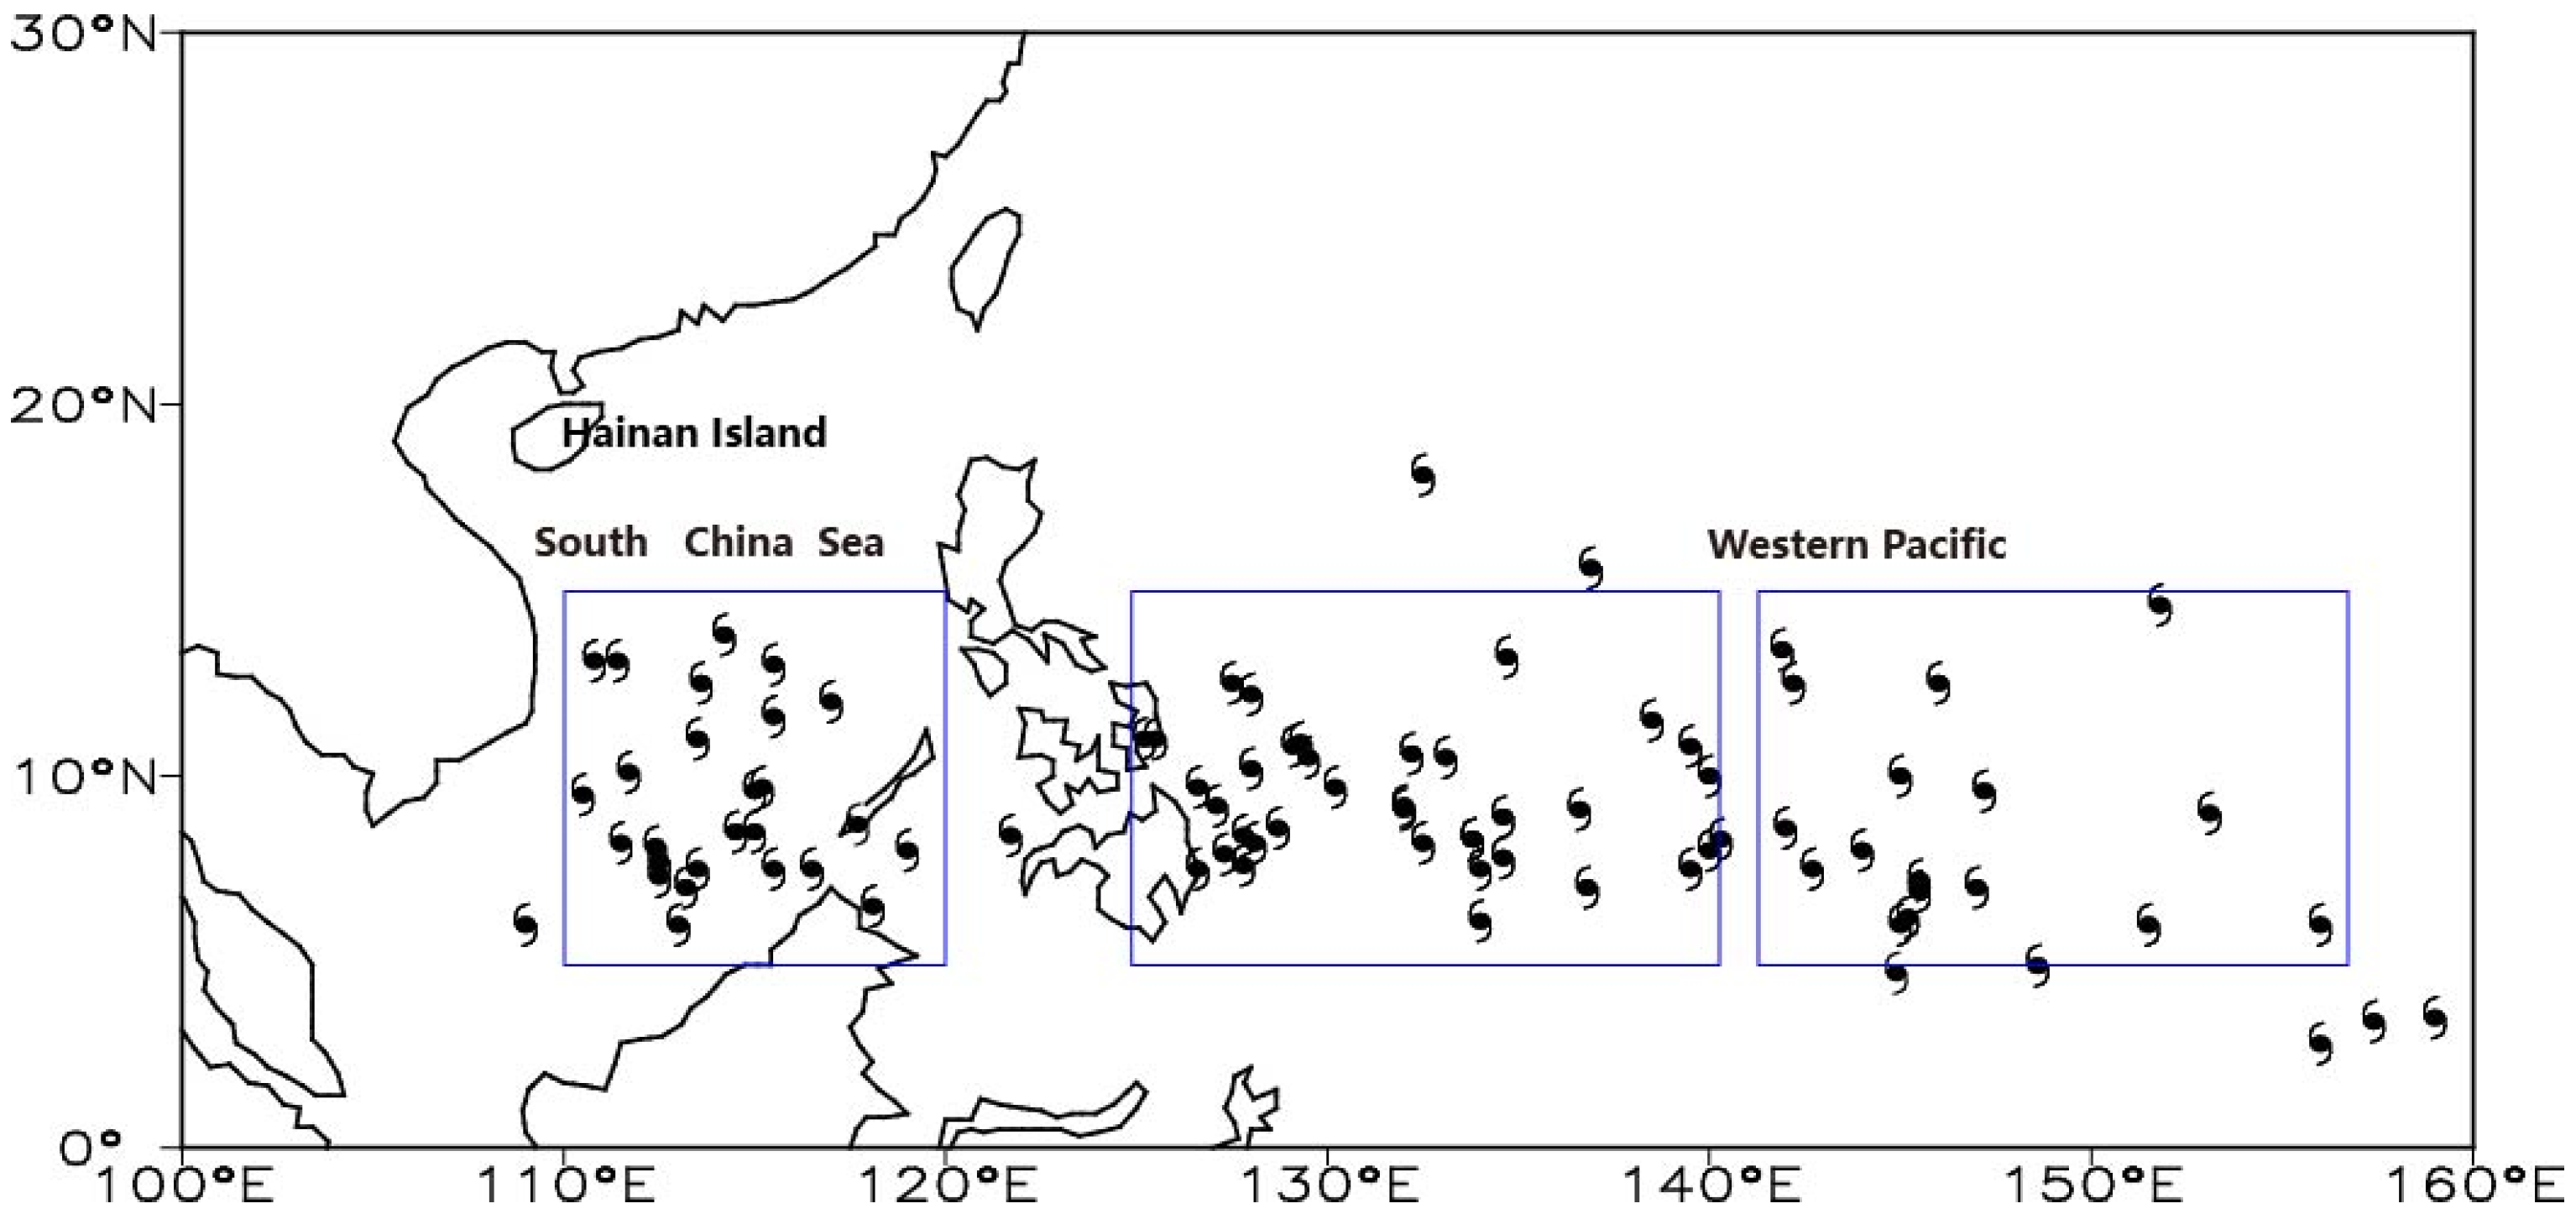
3. Characteristics of TC Sources in the Dry Season
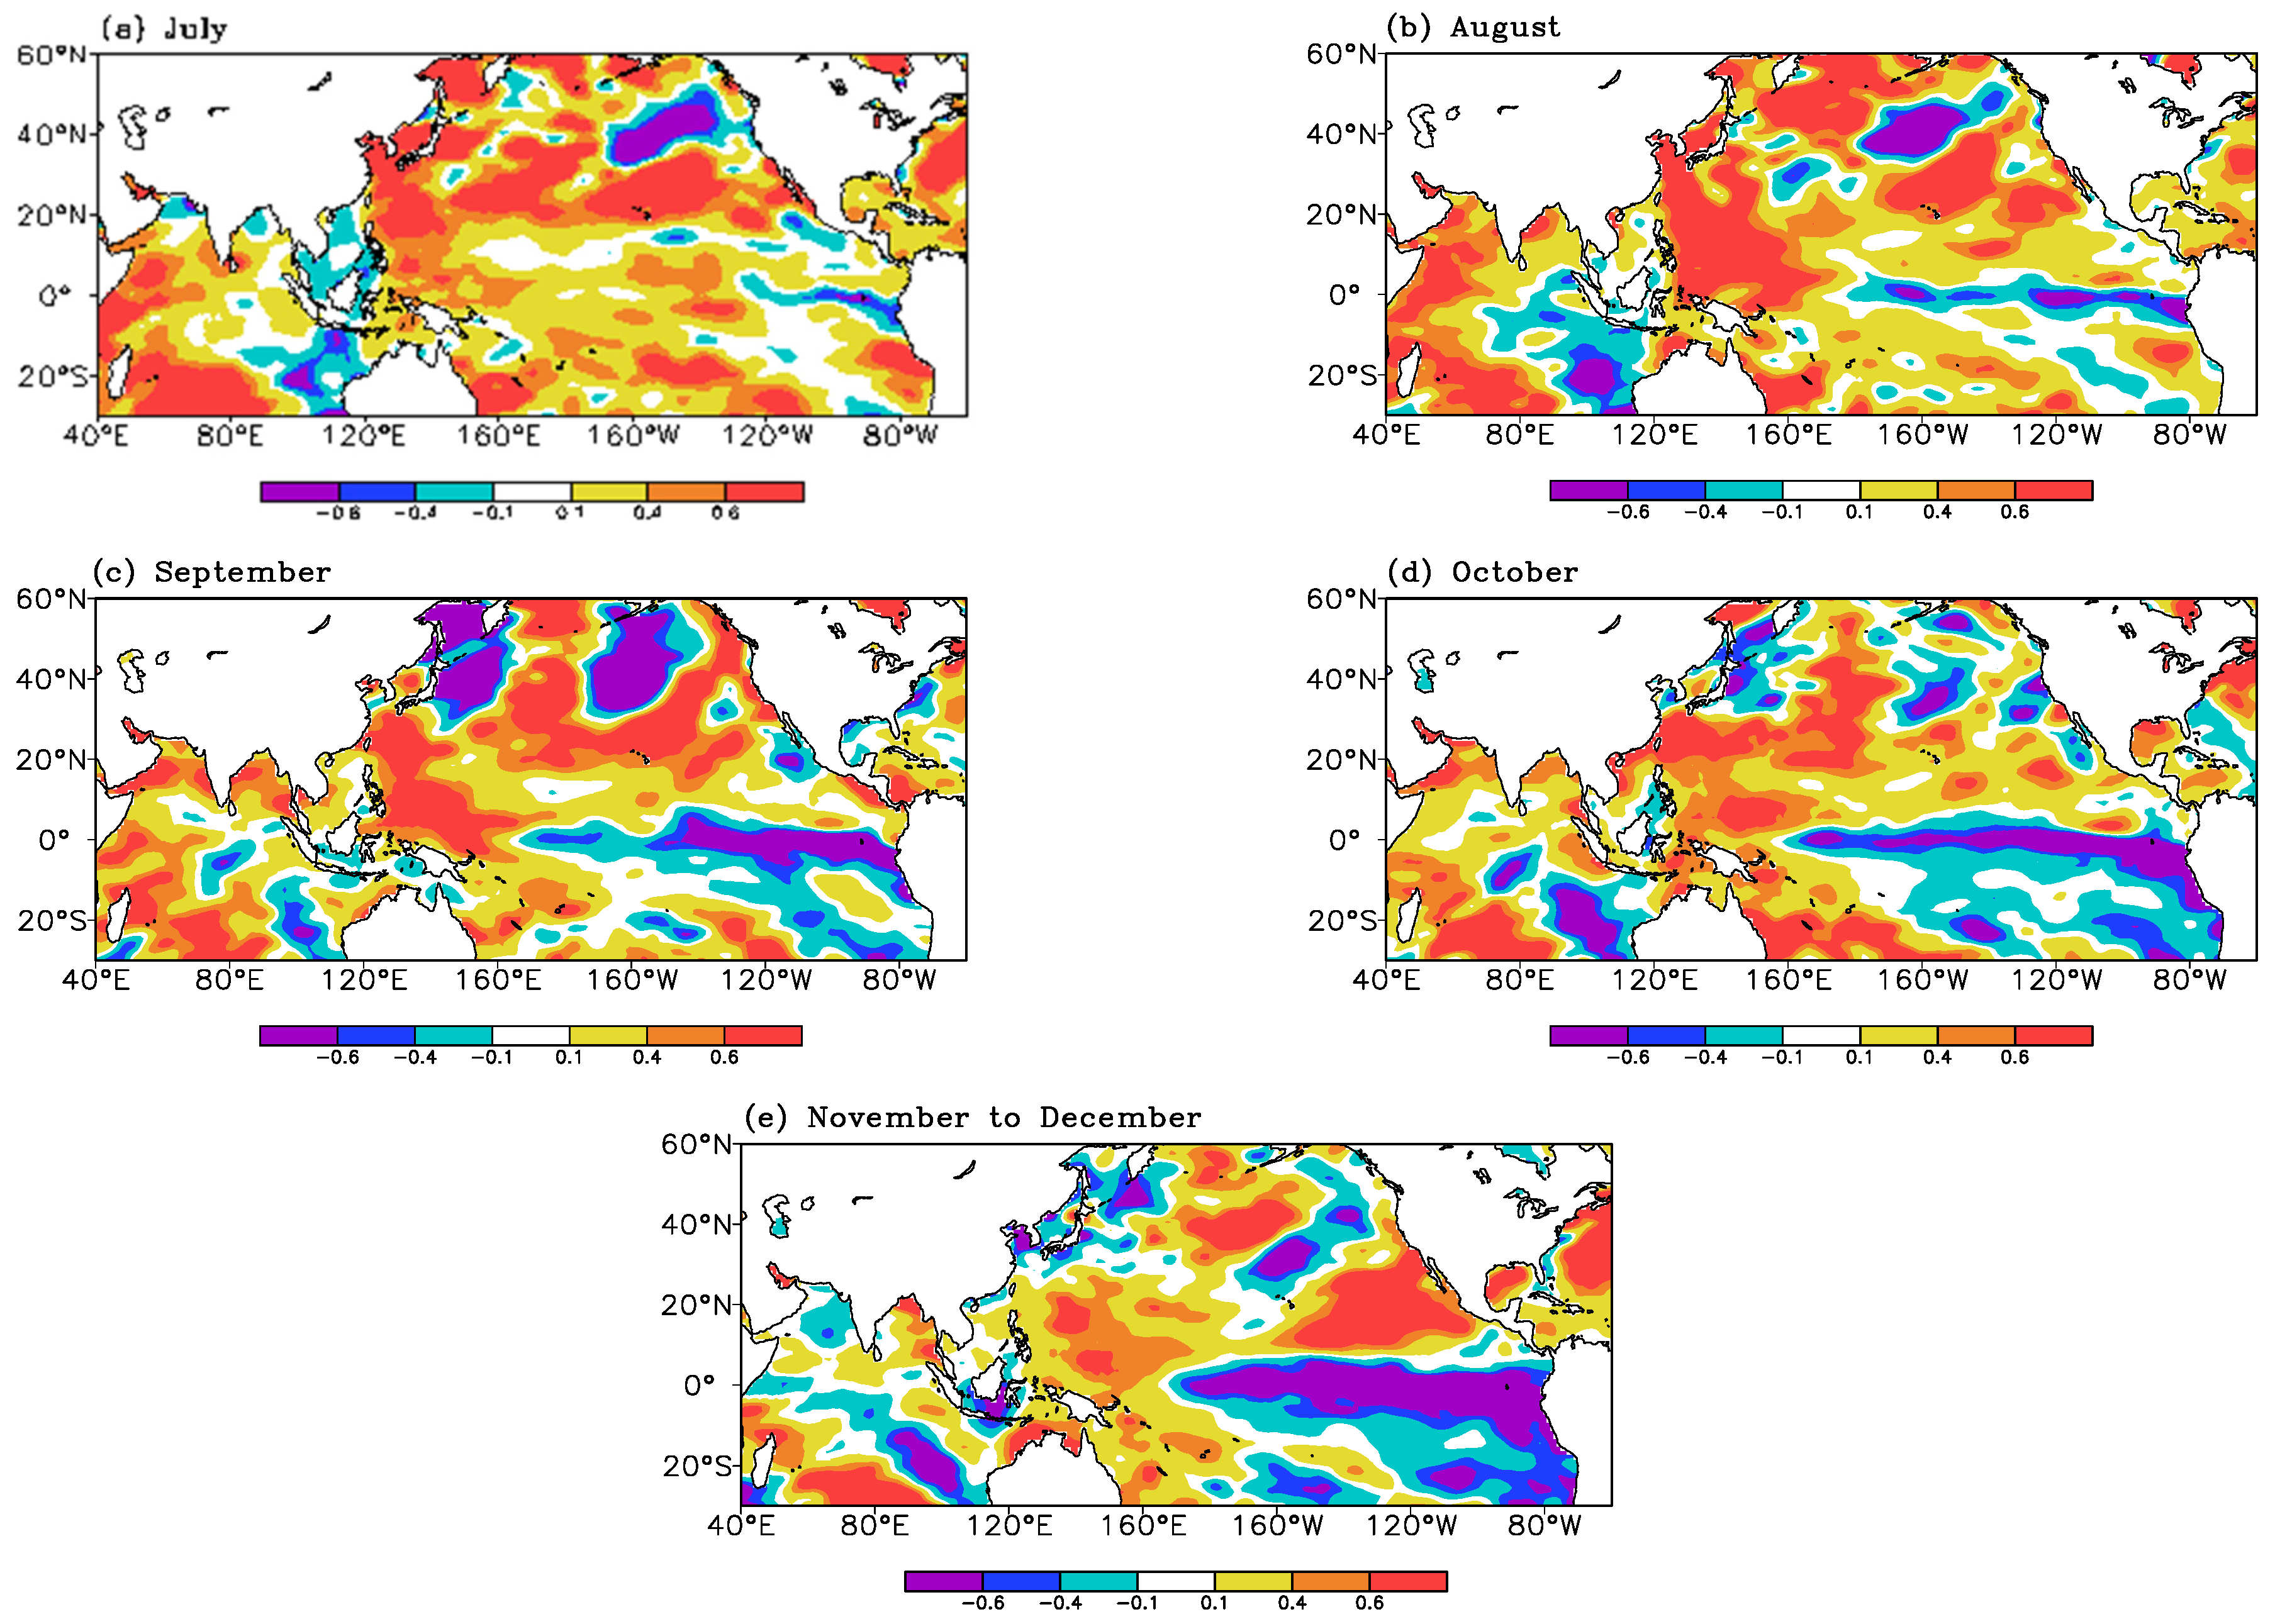
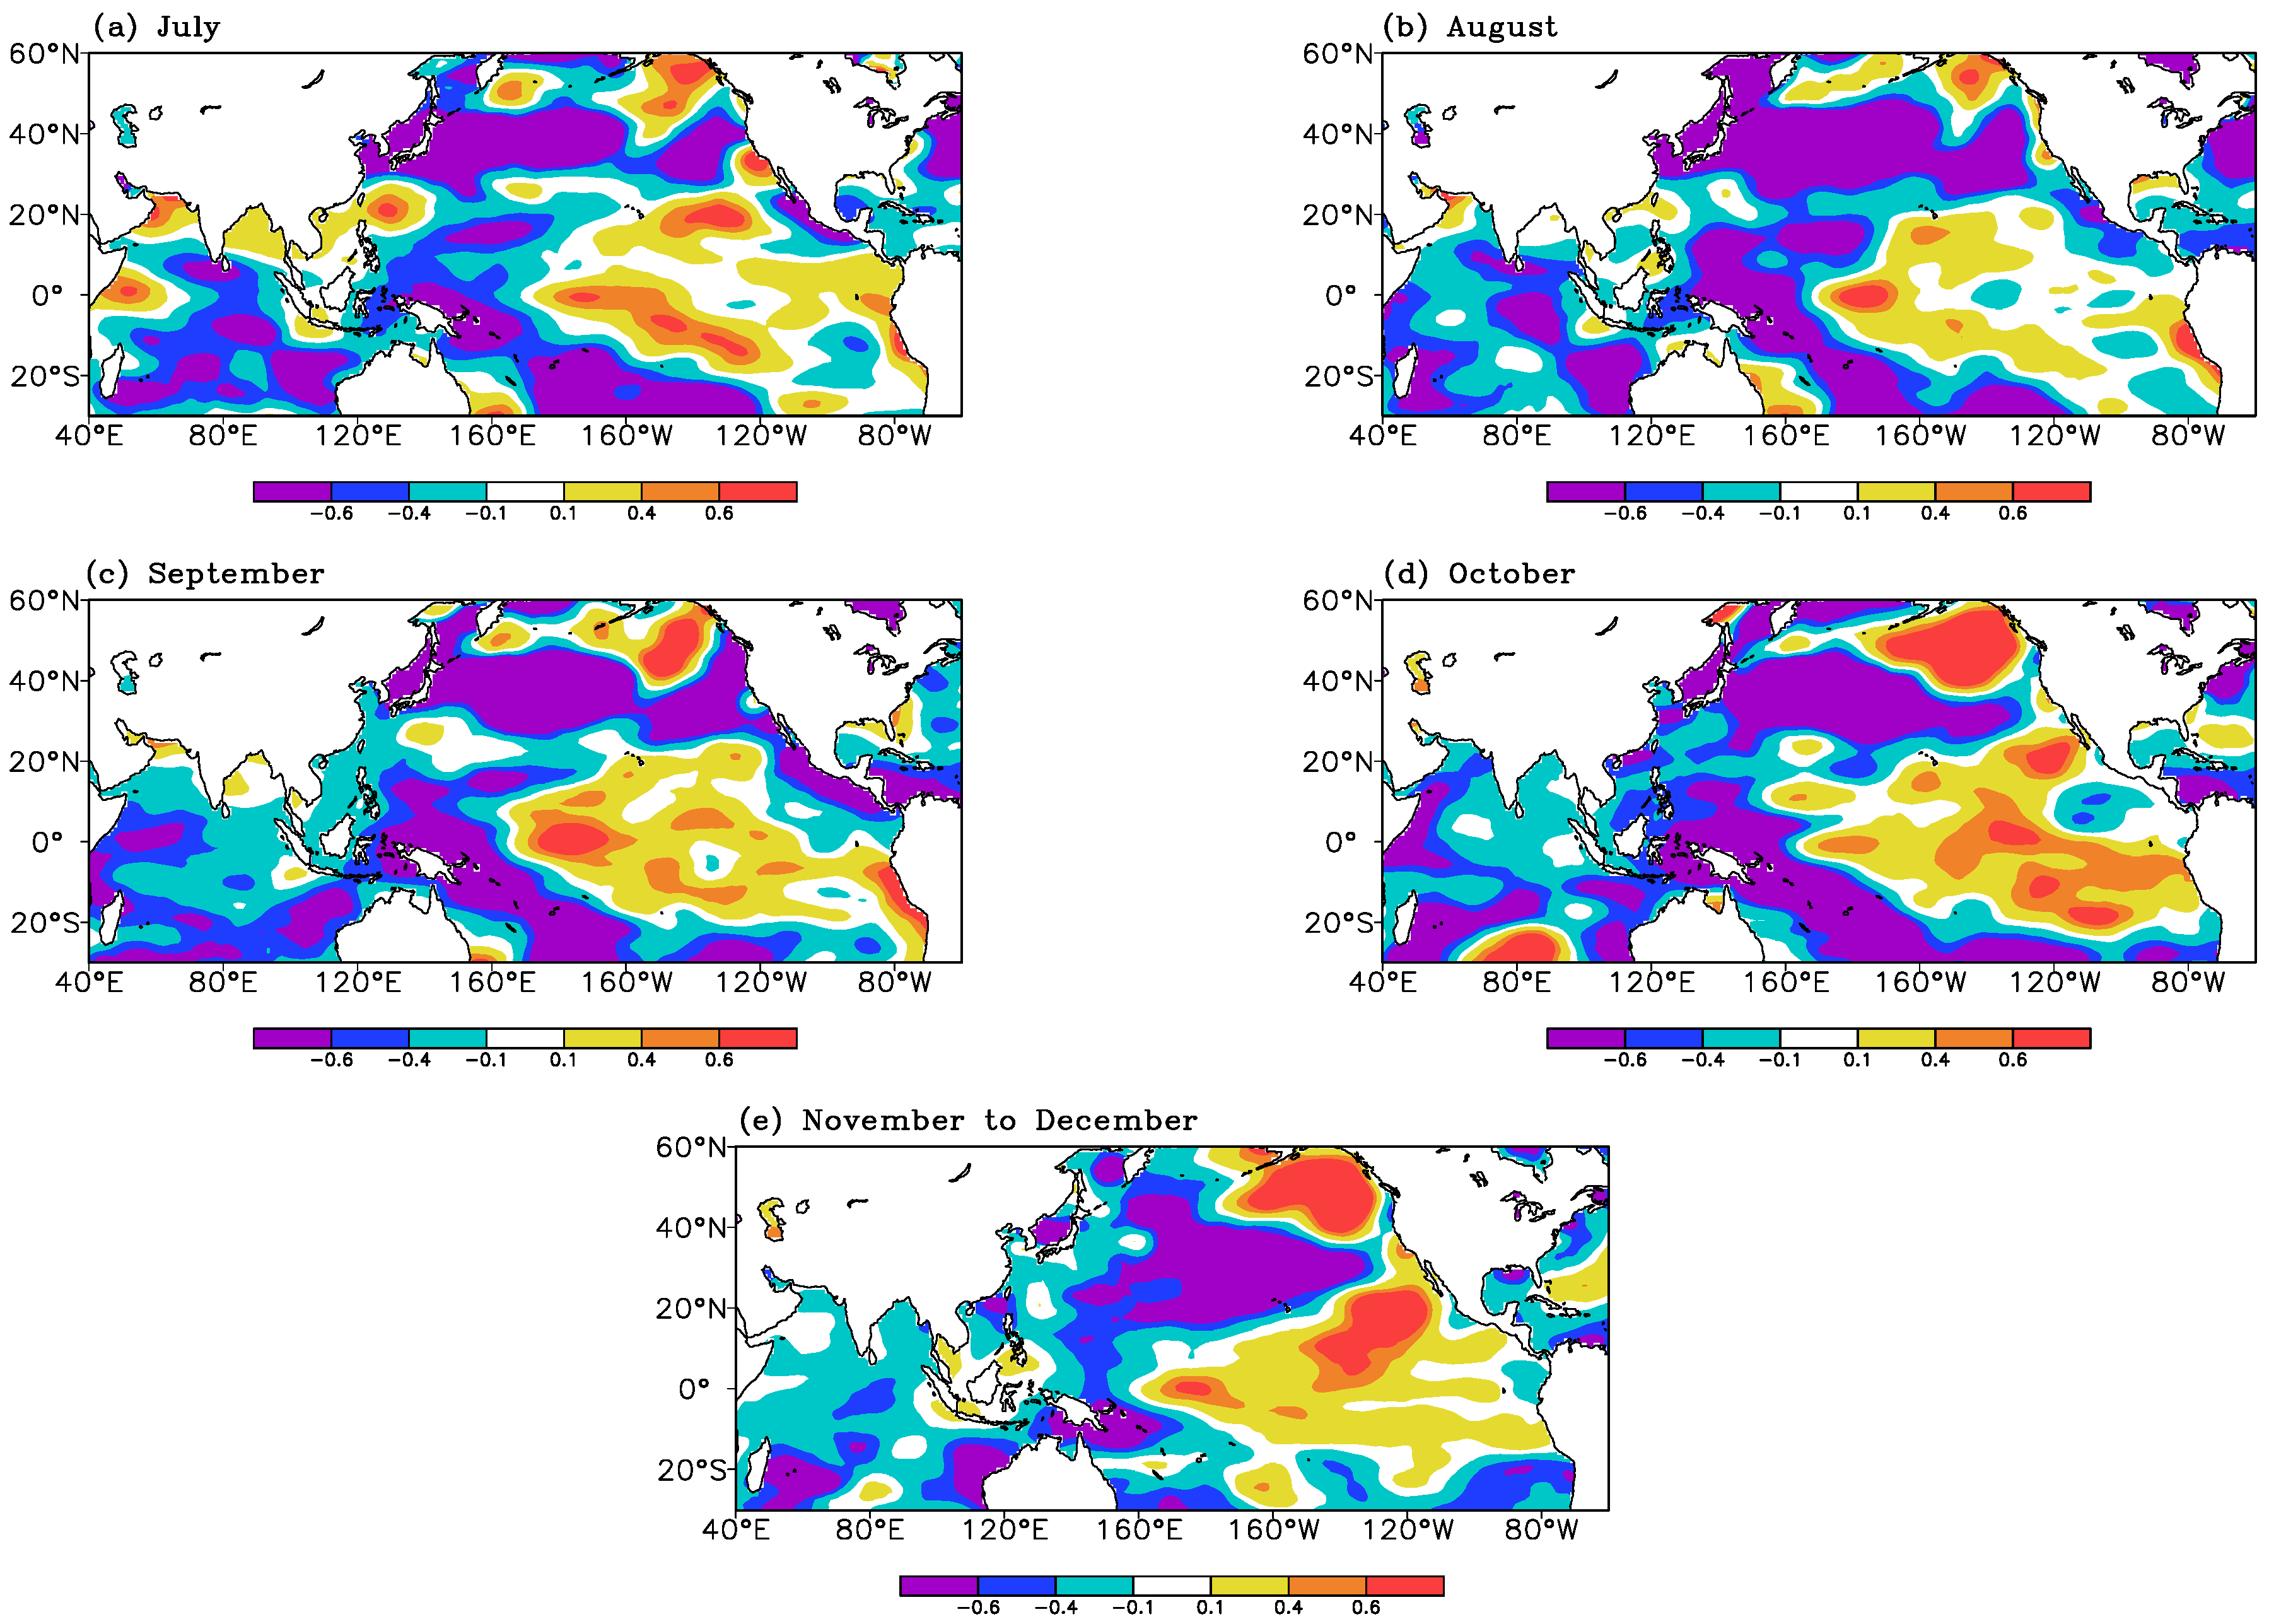
4. Sea Temperature Background Analysis
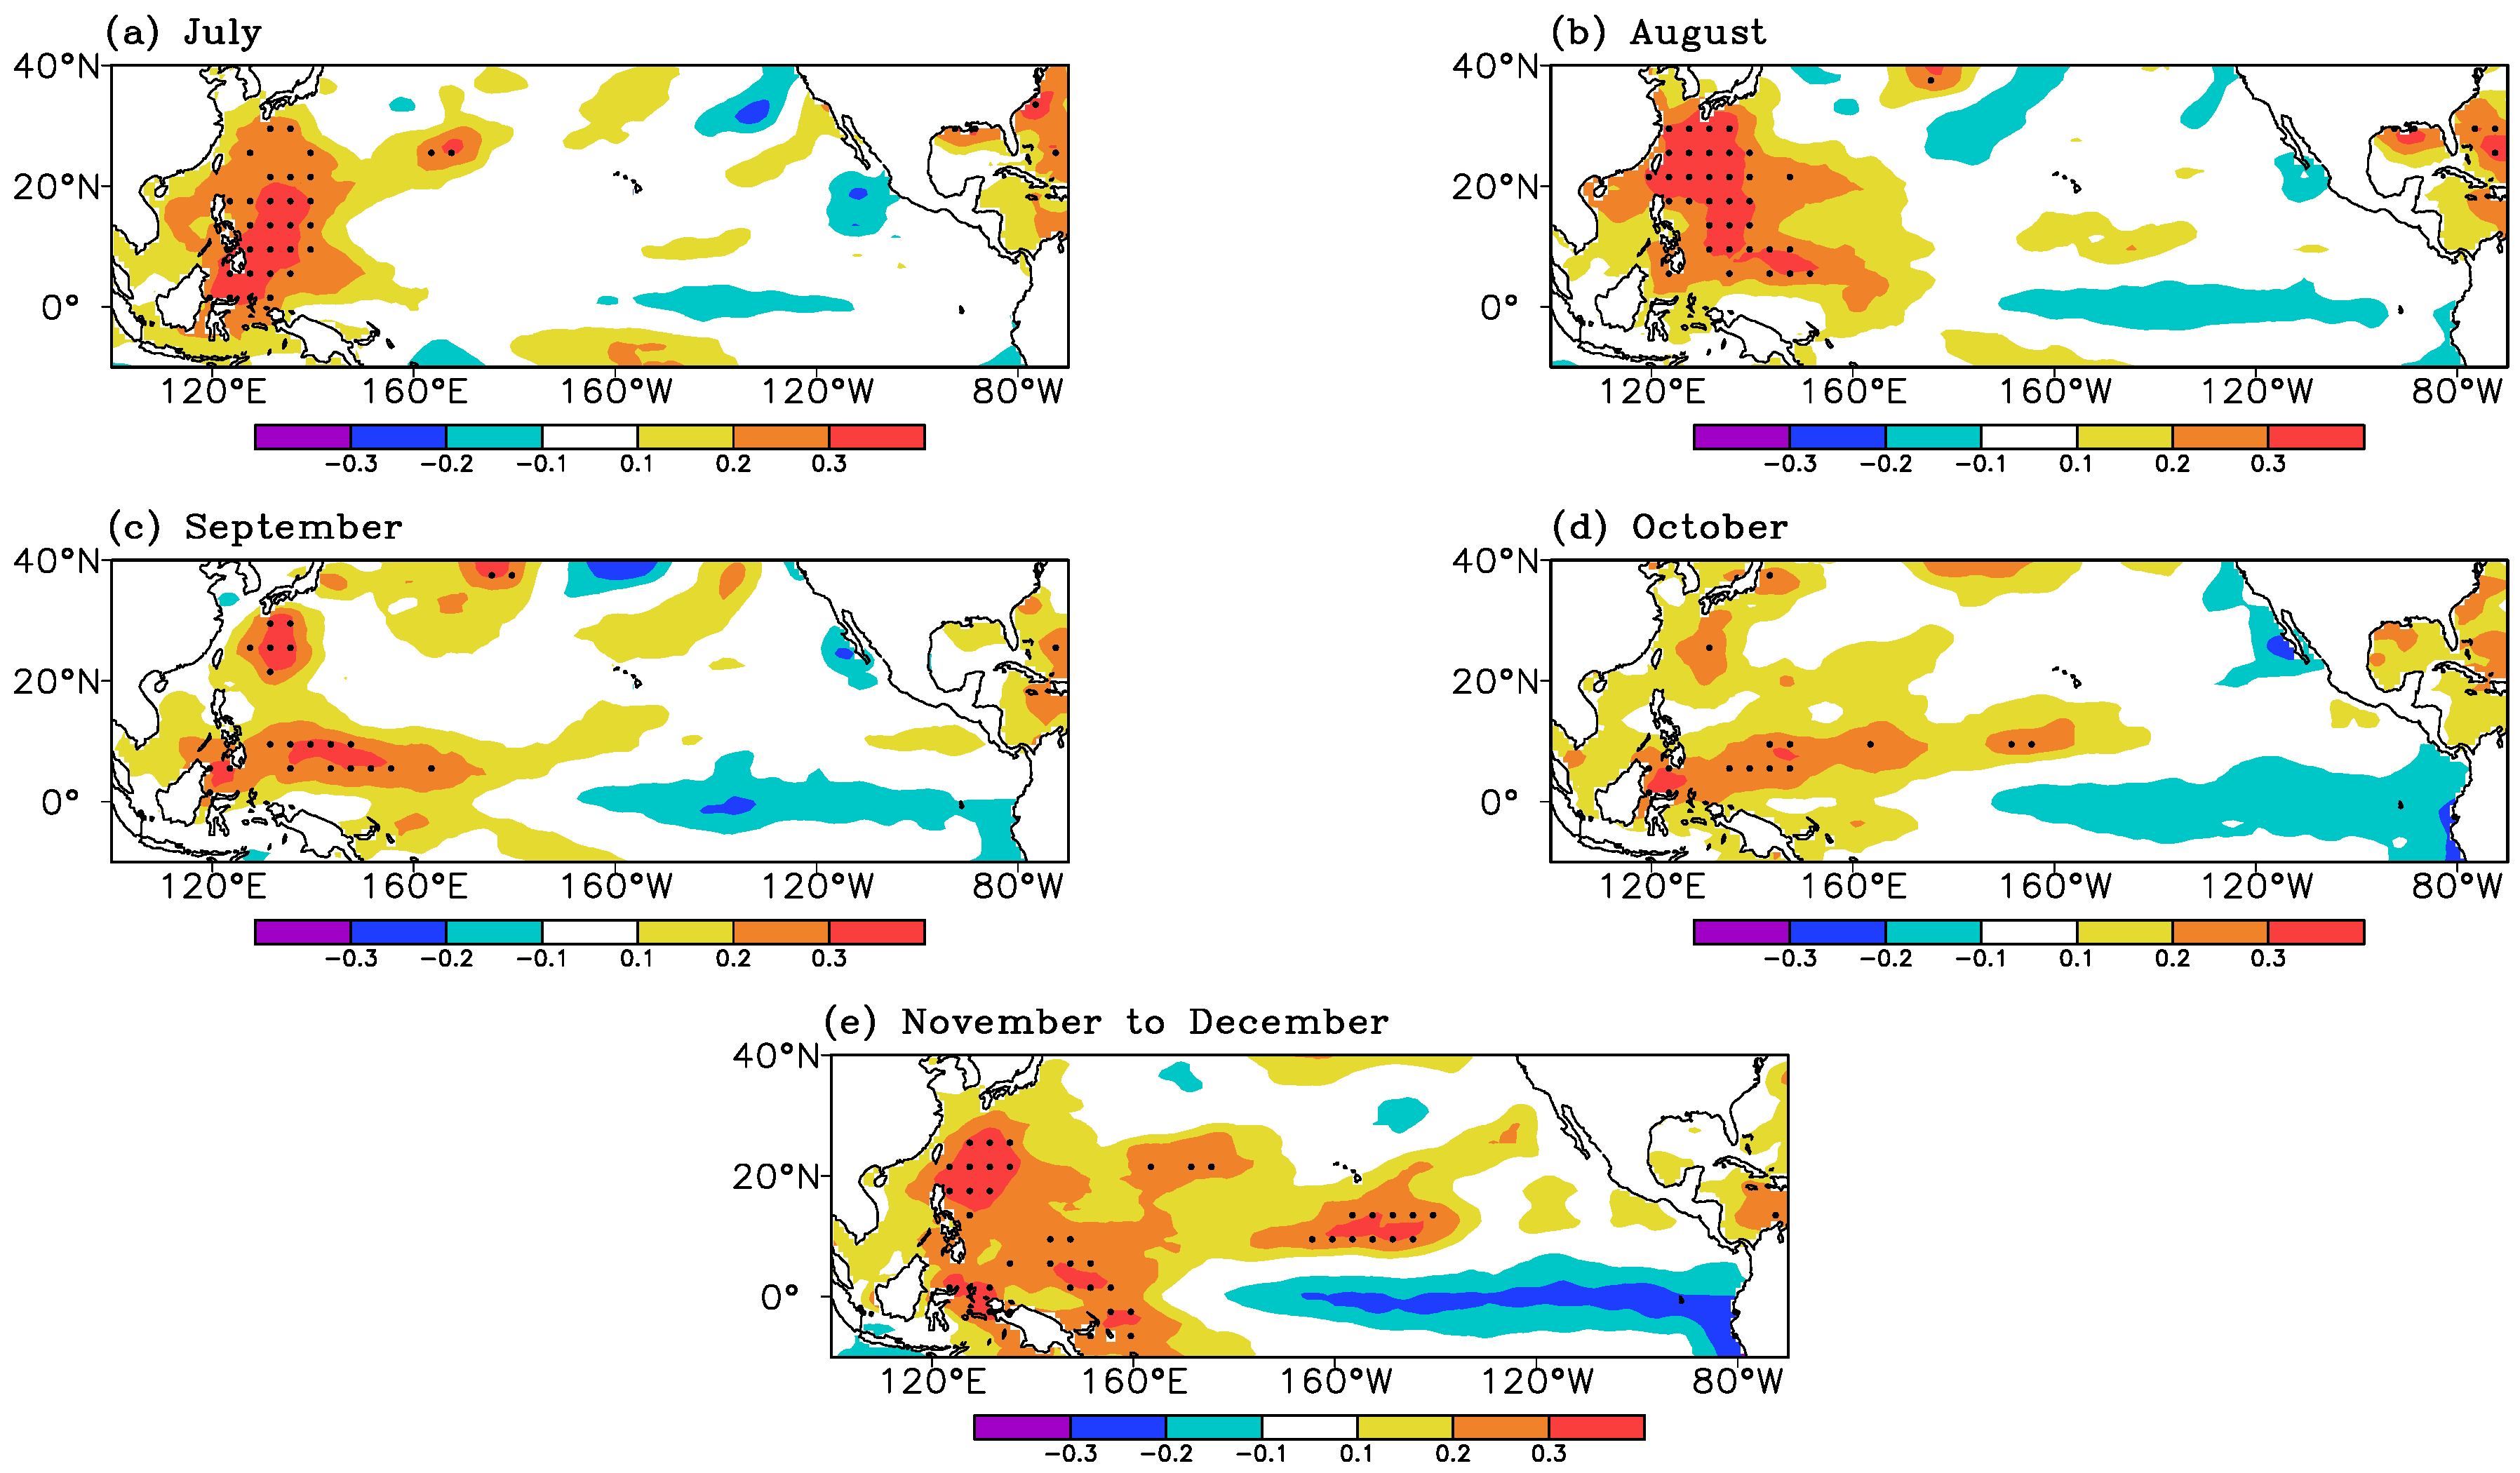
4.1. Correlation Analysis of the TC Number with the SST in Both the Previous Period and the Concurrent Period
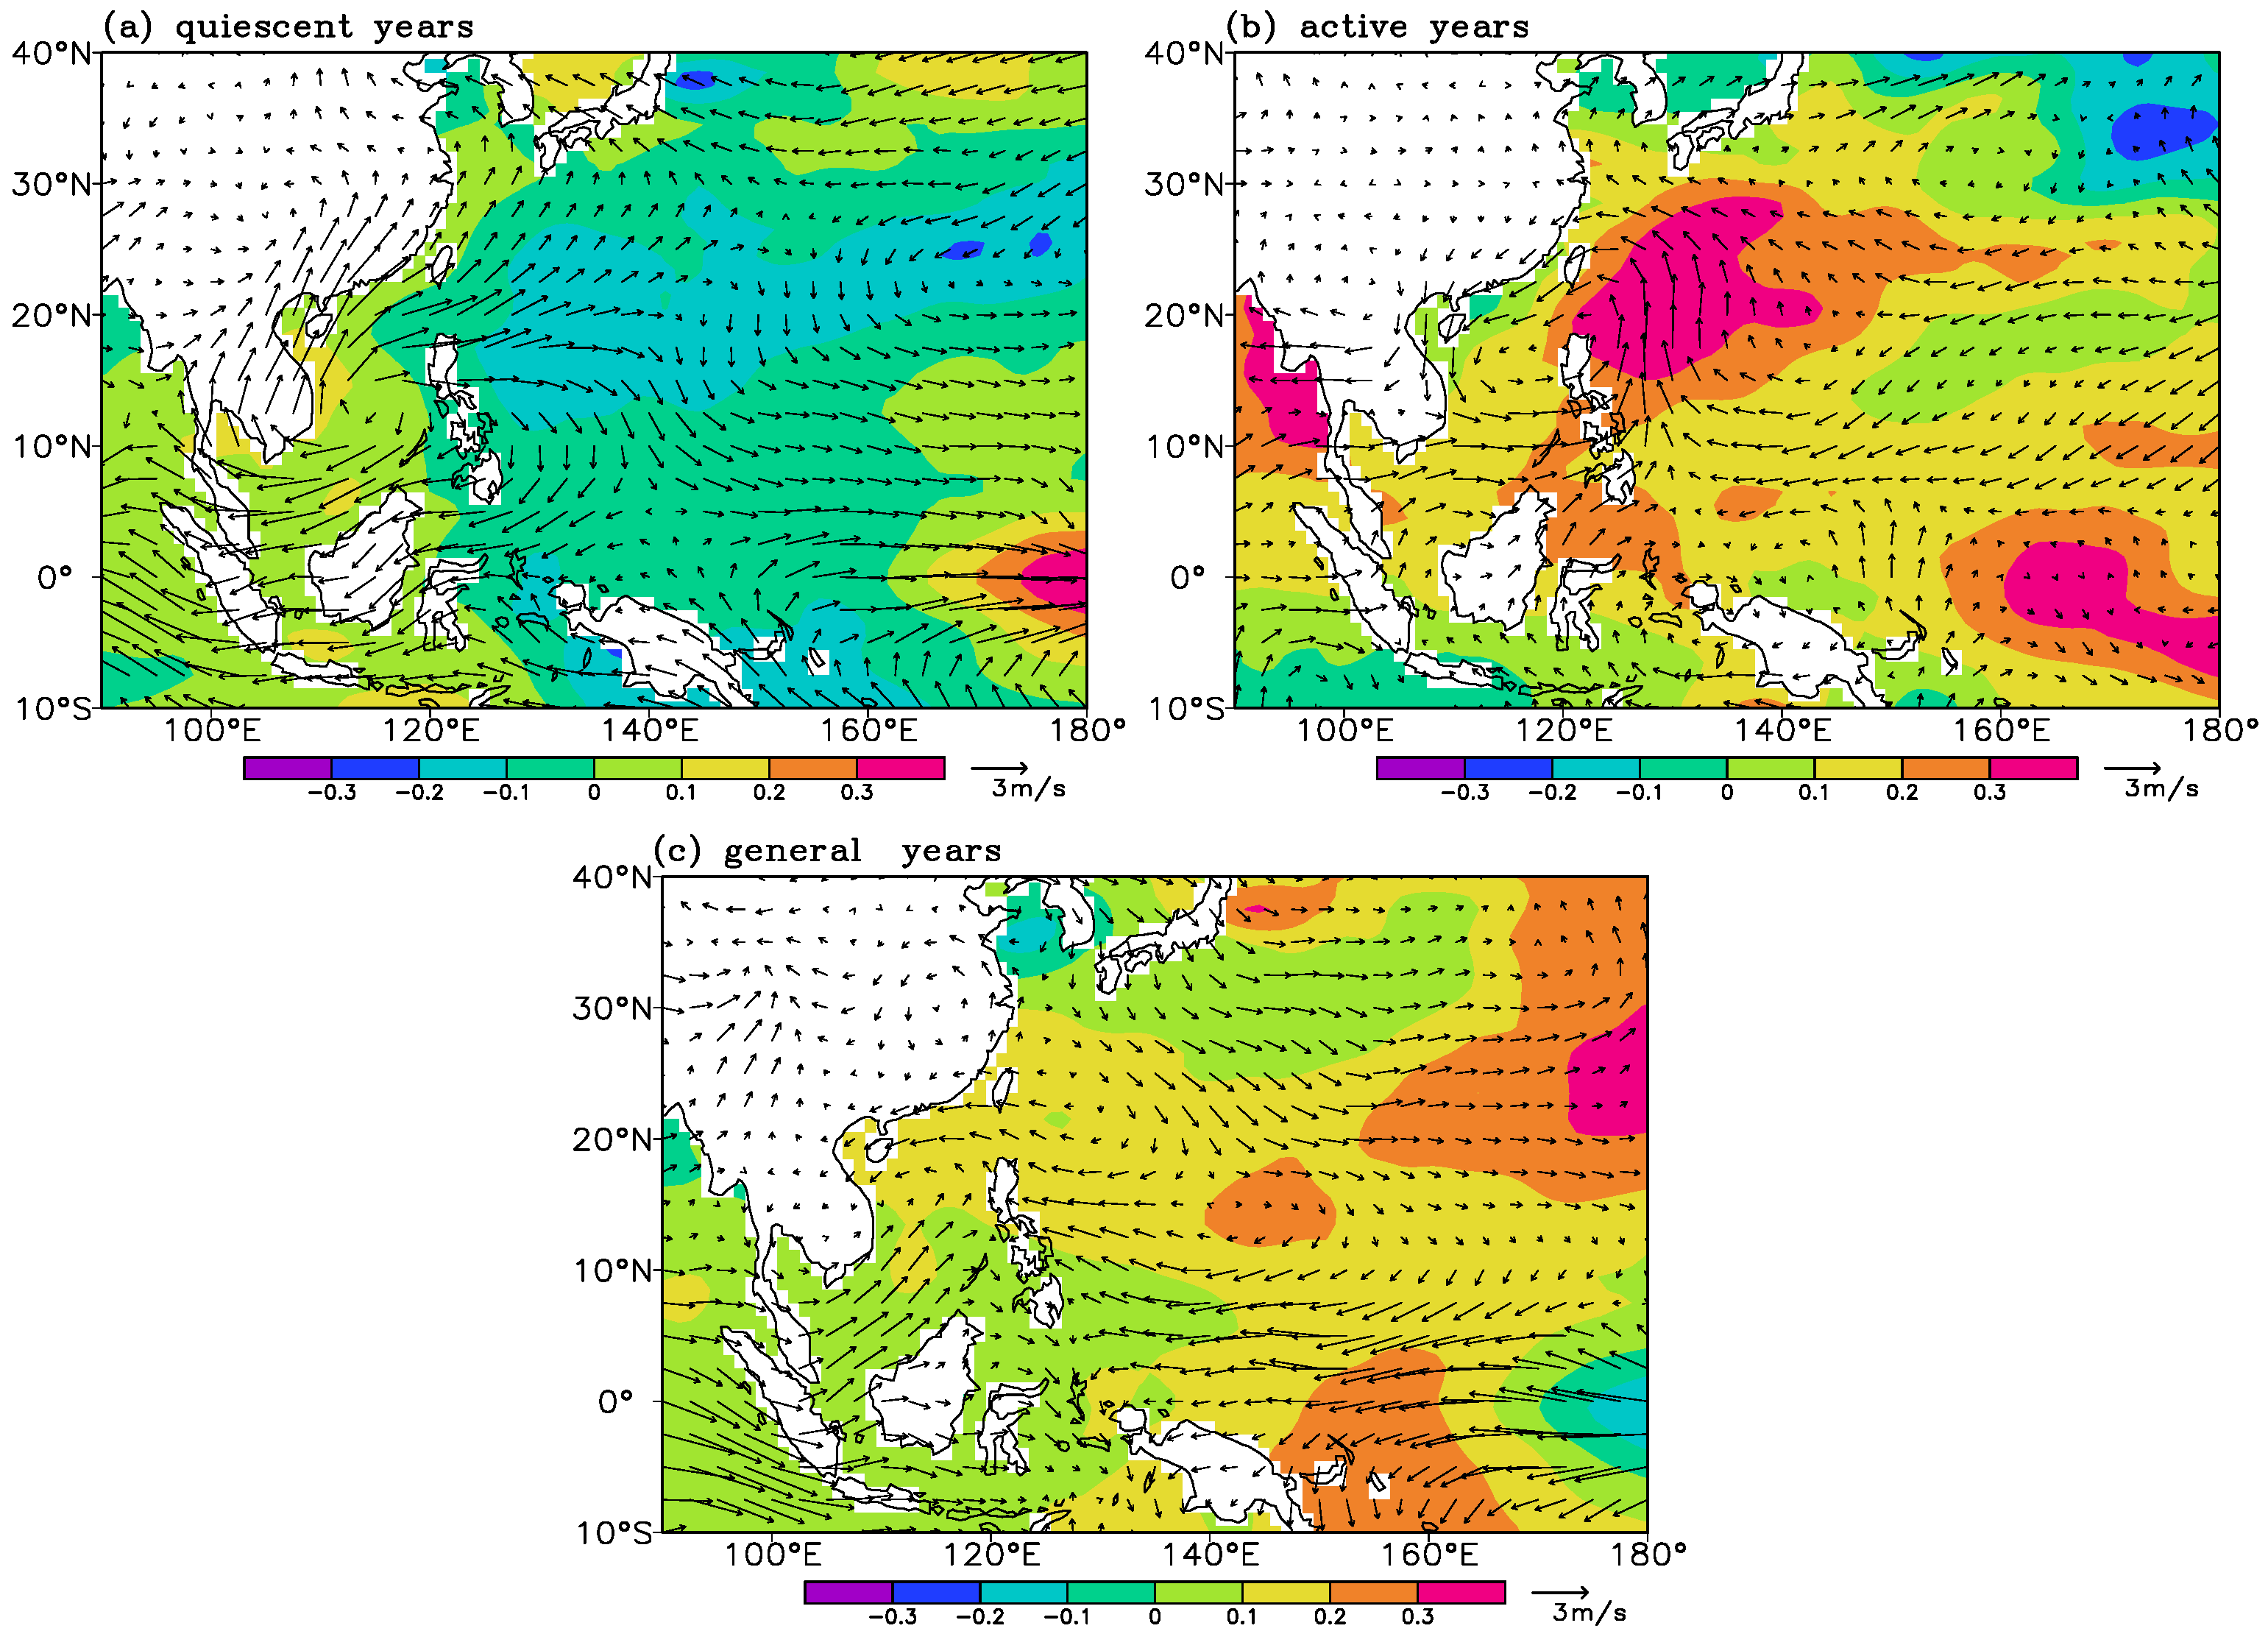
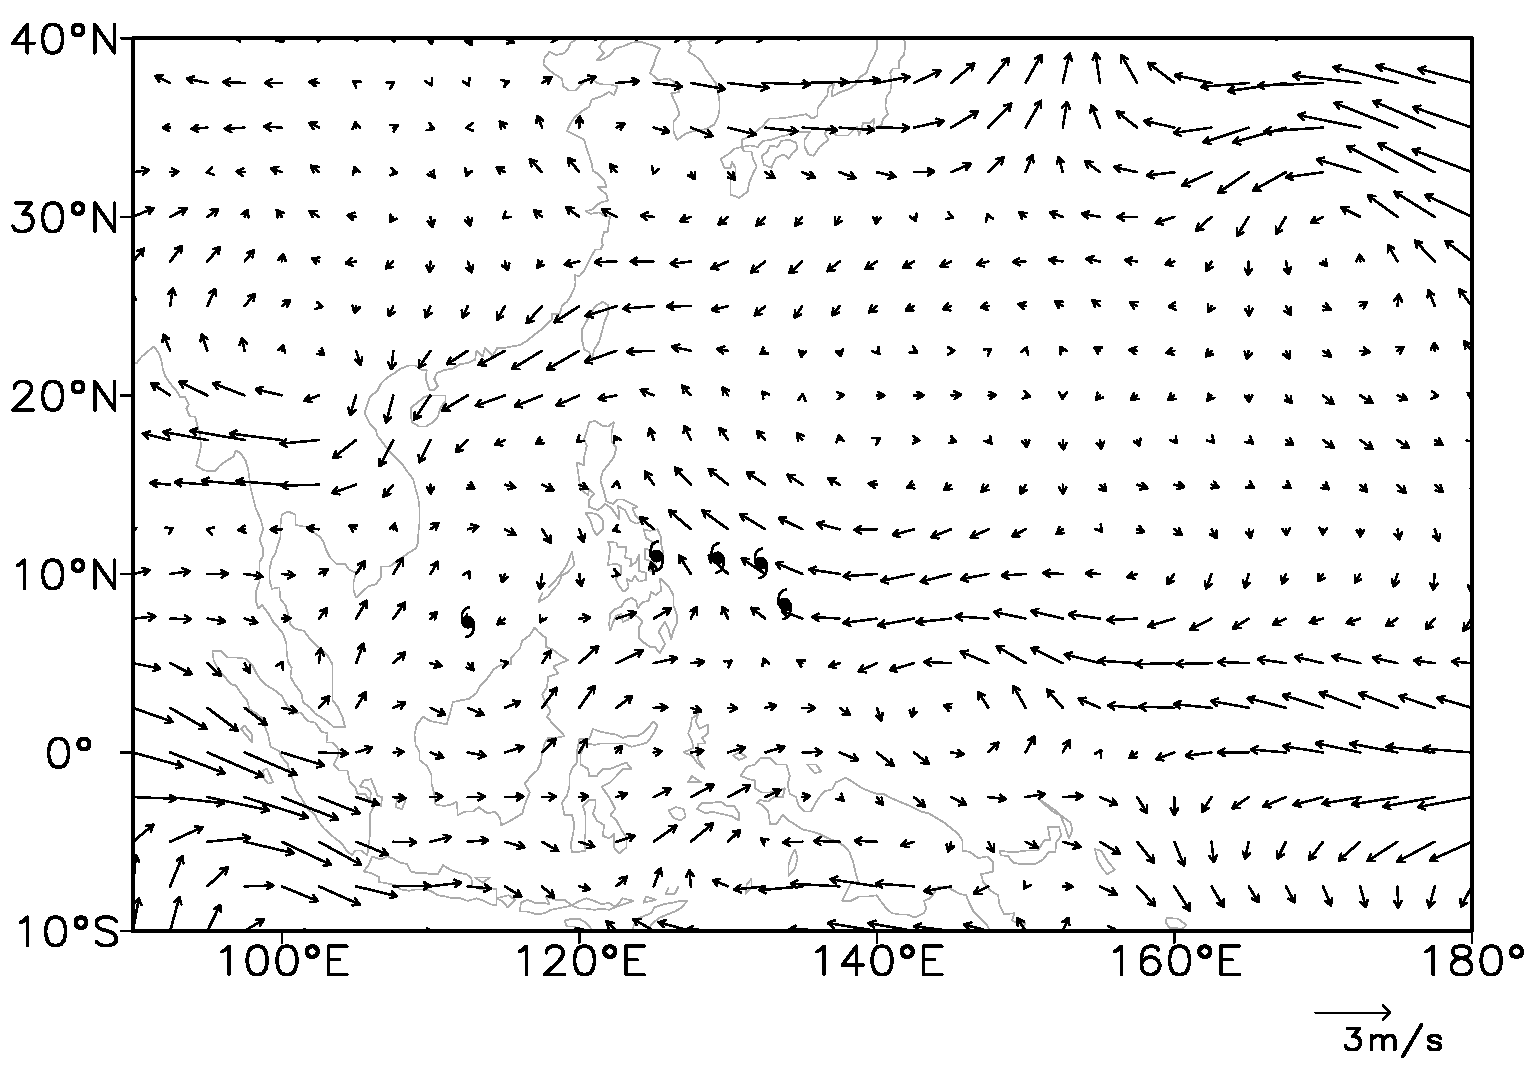
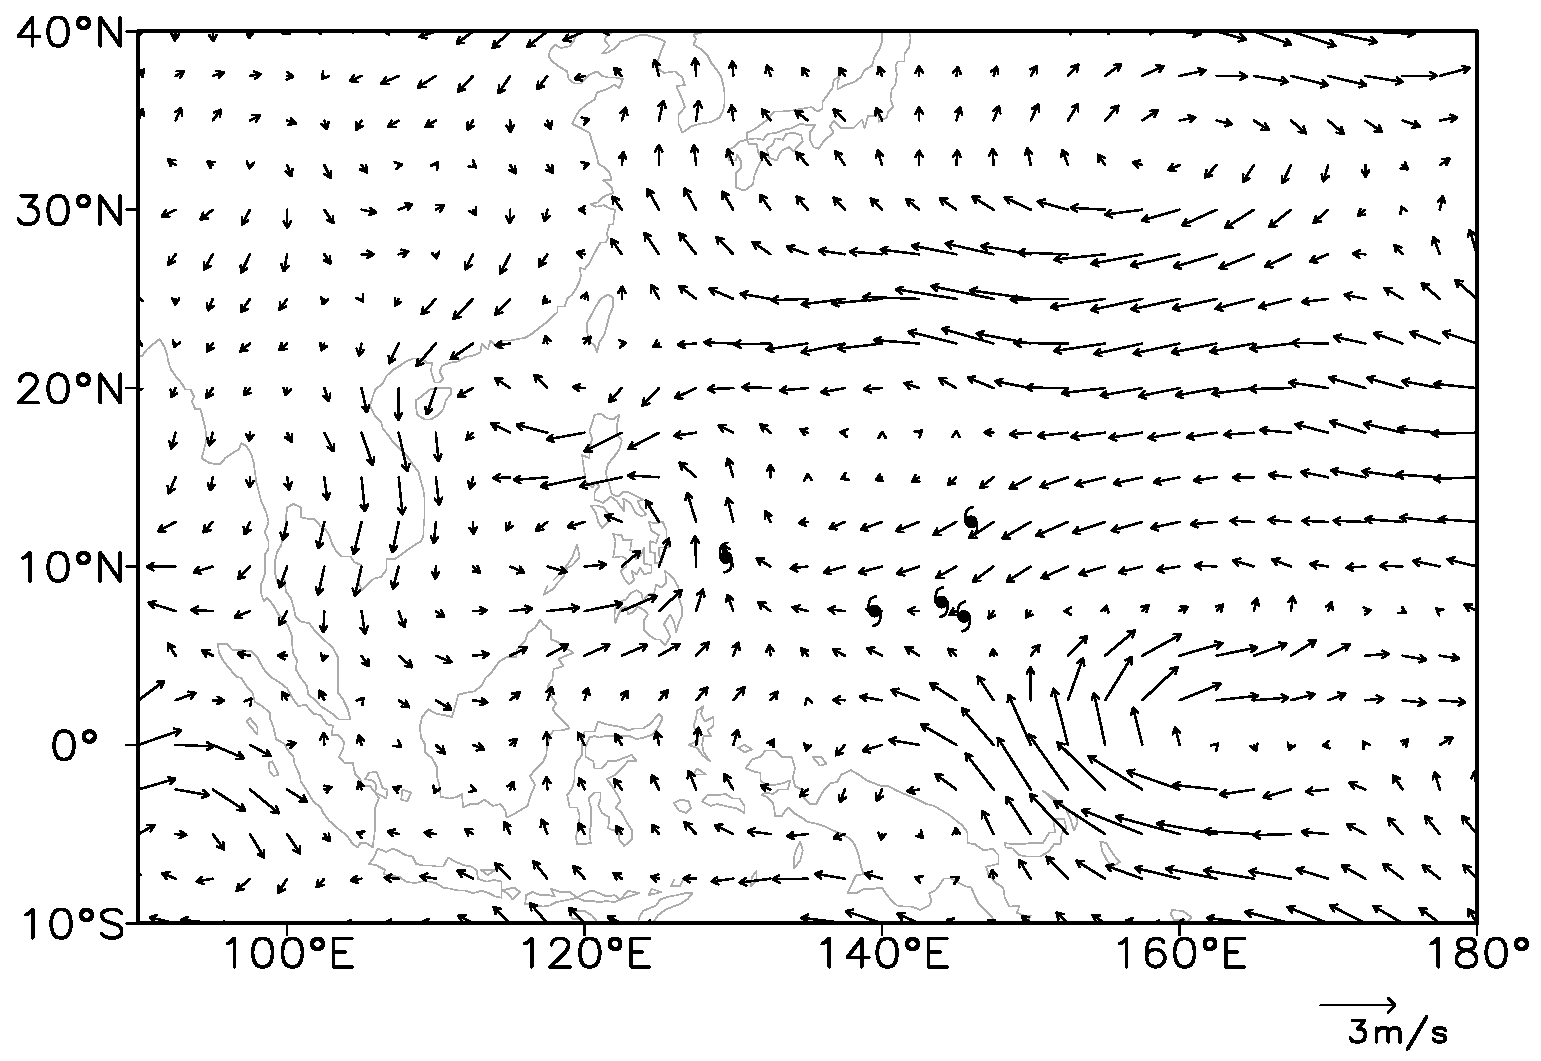
4.2. Analysis of the SST and the Circulation Background
4.3. Background Analysis of the Subsurface Sea Surface Temperature
5. Typical Case Analysis
6. Discussion and Conclusions
Author Contributions
Funding
Institutional Review Board Statement
Informed Consent Statement
Data Availability Statement
Conflicts of Interest
References
- He, L.; Yin, J.; Chen, T.; Luo, J. Analysis of Structure and Heavy Rain of Landfall Typhoon Maisha. Meteor. Mon. 2006, 32, 93–100. [Google Scholar]
- Chen, L.; Meng, Z. An Overview on Tropical Cyclone Research Progress in China during the Past Ten Years. Chin. J. Atmos. Sci. 2001, 25, 420–432. [Google Scholar]
- Chen, L.; Xu, X.; Luo, Z.; Wang, J. Introduction to Tropical Cyclone Dynamics; Meteorological Press: Beijing, China, 2002; pp. 25–26. [Google Scholar]
- Shen, F.; Min, J.; Xu, D. Assimilation of radar radial velocity data with the WRF Hybrid ETKF–3DVAR system for the prediction of Hurricane Ike (2008). Atmos. Res. 2016, 169, 127–138. [Google Scholar] [CrossRef]
- Shen, F.; Xu, D.; Min, J. Effect of momentum control variables on assimilating radar observations for the analysis and forecast for Typhoon Chanthu (2010). Atmos. Res. 2019, 230, 104622. [Google Scholar] [CrossRef]
- Liang, J.Y.; Chen, Z.T.; Wan, Q.L.; Ding, W.Y.; Liu, C.X.; Lin, A.L. Diagnostic analysis of the landfall process of tropical cyclone “VONGFONG”. J. Trop. Meteorol. 2003, 19, 45–55. [Google Scholar]
- Qian, Y.; Zhang, H. Analysis of Moving Track of Typhoon Sinlaku and Some Forecast Difficulty. Meteor. Mon. 2004, 30, 19–23. [Google Scholar]
- Li, Y.; Chen, L.; Wang, J. The diagnostic analysis on the characteristics of large scale circulation corresponding to the sustaining and decaying of tropical cyclone after it’s landfall. Acta Meteorol. Sin. 2004, 62, 167–179. [Google Scholar]
- Shen, F.; Xue, M.; Min, J. A comparison of limited-area 3DVAR and ETKF-En3DVAR data assimilation using radar observations at convective scale for the prediction of Typhoon Saomai (2006). Meteorol. Appl. 2017, 24, 628–641. [Google Scholar] [CrossRef]
- Chen, X. Inter-annul Variation and Tendency Prediction of Tropical Cyclones in Hainan Province. J. Trop. Meteorol. 2000, 16, 360–365. [Google Scholar]
- Yang, Y.; Ying, M.; Chen, B. The climatic changes of landfall tropic al cyclones in China over the past 58 years. Acta Meteorol. Sin. 2009, 67, 689–696. [Google Scholar]
- Wu, H. Climatic Features of Tropical Cyclone in Hainan Island and Its Relationship with ENSO. Meteor. Mon. 2005, 31, 61–64. [Google Scholar]
- Ye, Y.; Dong, B. Climate characteristics of tropical cyclones in the northwest Pacific Ocean in 1994/1995 and analysis of tropical oceanic and atmospheric circulation. Ocean. Forecast. 1997, 14, 44–52. [Google Scholar]
- Wei, N.; Li, Y.; Hu, S. Statistical characteristics and circulation background of tropical cyclone activity in mainland China from 1949 to 2008. J. Trop. Meteorol. 2013, 29, 17–27. [Google Scholar]
- Liang, H.; Liang, H.; Che, Z. Statistical characteristics analysis of tropical cyclones landfall in Hainan Province in the last fifty years. Ocean. Forecast. 2015, 32, 68–75. [Google Scholar]
- Huang, Y.; Jin, D.; Mireayi, T. Relationship of Nanjing summer precipitation anomaly and subtropical Northeast Pacific SSTA in 1991 and 1994 and its causes. Trans. Atmos. Sci. 2019, 42, 552–561. [Google Scholar]
- Wen, C. Impacts of EL Nino and La Nina on the cycle of the east Asian winter and summer monsoon. Chin. J. Atmos. Sci. 2002, 26, 595–610. [Google Scholar]
- Zhi, H.; Yu, Y.; Yan, L. Retrospective prediction in a coupled model over East Asia during EL Nino decaying phase. Acta Meteorol. Sin. 2012, 70, 779–788. [Google Scholar]
- Huang, Z. Changes of Dry-wet Climate in the Dry Season in Yunnan (1961–2007). Adv. Clim. Chang. Res. 2011, 2, 49–54. [Google Scholar] [CrossRef]
- Wu, S.; Zhang, Y.; Jiang, Z. The Variation Characteristics of Hainan-Influencing Tropical Cyclones Activity Off Rainy Seasons. J. Trop. Meteorol. 2006, 22, 301–307. [Google Scholar]
- Chen, M.; Chen, R. Interdecadal Change in the Relationship between Summer Tropical Cyclone Genesis Frequency over the Western North Pacific and Tropical Sea Surface Temperature. J. Trop. Meteorol. 2022, 38, 58–67. [Google Scholar]
- Shen, F.; Min, J. Assimilating AMSU-A radiance data with the WRF Hybrid En3DVAR system for track predictions of Typhoon Megi (2010). Adv. Atmos. Sci. 2015, 32, 1231–1243. [Google Scholar] [CrossRef]
- Zhang, Y.; Wang, H. A projection of future climate change over the western North Pacific related to typhoon activities. Acta Meteorol. Sin. 2010, 68, 539–549. [Google Scholar]
- Xu, D.; Min, J.; Shen, F.; Ban, J.; Chen, P. Assimilation of MWHS radiance data from the FY-3B satellite with the WRF Hybrid-3DVAR system for the forecasting of binary typhoons. J. Adv. Model. Earth Syst. 2016, 8, 1014–1028. [Google Scholar] [CrossRef]
- Chan, J.C. Comments on “Changes in tropical cyclone number, duration and intensity in a warming environment”. Science 2006, 311, 1713b. [Google Scholar] [CrossRef] [PubMed]
- Shen, F.; Xu, D.; Li, H.; Min, J.; Liu, R. Assimilation of GPM Microwave Imager Radiance data with the WRF hybrid 3DEnVar system for the prediction of Typhoon Chanhom (2015). Atmos. Res. 2021, 251, 105422. [Google Scholar] [CrossRef]
- Lei, X.; Xu, M.; Ren, F. A review on the impacts of global warming on tropical cyclone activities. Acta Meteorol. Sin. 2009, 67, 679–688. [Google Scholar]
- Ying, M.; Zhang, W.; Yu, H.; Lu, X.; Feng, J.; Fan, Y.; Zhu, Y.; Chen, D. An Overview of the China Meteorological Administration Tropical Cyclone Database. J. Atmos. Ocean. Technol. 2014, 31, 287–301. [Google Scholar] [CrossRef]
- Ishii, M.; Shouji, A.; Sugimoto, S.; Matsumoto, T. Objective analyses of sea-surface temperature and marine meteorological variables for the 20th century using ICOADS and the Kobe Collection. Int. J. Climatol. 2005, 25, 865–879. [Google Scholar] [CrossRef]
- Kalnay, E.; Kanamitsu, M.; Kistler, R.; Collins, W.; Deaven, D.; Gandin, L.; Iredell, M.; Saha, S.; White, G.; Woollen, J.; et al. The NCEP/NCAR 40-year reanalysis project. Bull. Amer. Meteor. Soc. 1996, 77, 437–471. [Google Scholar] [CrossRef]
- Bonsal, B.R.; Zhang, X.; Vincent, L.A.; Hogg, W.D. Characteristics of daily and extreme temperatures over Canada. J. Clim. 2001, 14, 1959–1976. [Google Scholar] [CrossRef]
- Sun, J.; Guan, Z.; Li, M.; Yu, Y. Anomalous circulation patterns in association with two types of regional daily precipitation extremes over South China from July to October. Acta Meteorol. Sin. 2019, 77, 43–57. [Google Scholar]
- Huang, R.; Sun, F. Impacts of the Thermal State and the Convective Activities in the Tropical Western Warm Pool on the Summer Climate Anomalies in East Asia. Chin. J. Atmos. Sci. 1994, 18, 141–151. [Google Scholar]
- Li, L.; Wang, P.; Li, H.; Ye, M. Analysis of inter-decadal anomaly relations between sub-surface sea temperature and sea level pressure over the north pacific. J. Trop. Meteorol. 2003, 19, 357–366. [Google Scholar]
- Qi, L.; Sun, Z.; Li, Z. Winter Subsurface Layer Thermal State Character of the North Pacific and Its Relationship with the Summer Climate in the East of China. Trans. Atmos. Sci. 2007, 30, 153–161. [Google Scholar]


| Month | TD | TS | STS | TY | STY | Super TY | Total |
|---|---|---|---|---|---|---|---|
| November | 9 | 13 | 12 | 9 | 10 | 5 | 58 |
| December | 4 | 9 | 2 | 6 | 6 | 6 | 33 |
| January | 1 | 2 | 0 | 0 | 1 | 0 | 4 |
| February | 1 | 2 | 0 | 0 | 0 | 0 | 3 |
| March | 2 | 0 | 3 | 0 | 1 | 0 | 6 |
| April | 2 | 0 | 2 | 2 | 0 | 0 | 6 |
Disclaimer/Publisher’s Note: The statements, opinions and data contained in all publications are solely those of the individual author(s) and contributor(s) and not of MDPI and/or the editor(s). MDPI and/or the editor(s) disclaim responsibility for any injury to people or property resulting from any ideas, methods, instructions or products referred to in the content. |
© 2023 by the authors. Licensee MDPI, Basel, Switzerland. This article is an open access article distributed under the terms and conditions of the Creative Commons Attribution (CC BY) license (https://creativecommons.org/licenses/by/4.0/).
Share and Cite
Zhu, J.; Zhao, X.; Wu, H.; Wu, S.; Hu, D.; Xing, C. Study of the Sea Temperature Backgrounds to Tropical Cyclones Affecting Hainan Province in the Dry Season. Atmosphere 2023, 14, 1663. https://doi.org/10.3390/atmos14111663
Zhu J, Zhao X, Wu H, Wu S, Hu D, Xing C. Study of the Sea Temperature Backgrounds to Tropical Cyclones Affecting Hainan Province in the Dry Season. Atmosphere. 2023; 14(11):1663. https://doi.org/10.3390/atmos14111663
Chicago/Turabian StyleZhu, Jingjing, Xiaoping Zhao, Hui Wu, Shengan Wu, Deqiang Hu, and Caiying Xing. 2023. "Study of the Sea Temperature Backgrounds to Tropical Cyclones Affecting Hainan Province in the Dry Season" Atmosphere 14, no. 11: 1663. https://doi.org/10.3390/atmos14111663
APA StyleZhu, J., Zhao, X., Wu, H., Wu, S., Hu, D., & Xing, C. (2023). Study of the Sea Temperature Backgrounds to Tropical Cyclones Affecting Hainan Province in the Dry Season. Atmosphere, 14(11), 1663. https://doi.org/10.3390/atmos14111663