Article

Prediction of Gas Emission in the Working Face Based on LASSO-WOA-XGBoost

College of Mining, Liaoning Technical University, Fuxin 123000, China
*
Author to whom correspondence should be addressed.
Atmosphere 2023, 14(11), 1628; https://doi.org/10.3390/atmos14111628
Submission received: 14 September 2023 / Revised: 27 October 2023 / Accepted: 28 October 2023 / Published: 30 October 2023
(This article belongs to the Section Atmospheric Techniques, Instruments, and Modeling)

Abstract

:
In order to improve the prediction accuracy of gas emission in the mining face, a method combining least absolute value convergence and selection operator (LASSO), whale optimization algorithm (WOA), and extreme gradient boosting (XGBoost) was proposed, along with the LASSO-WOA-XGBoost gas emission prediction model. Aiming at the monitoring data of gas emission in Qianjiaying mine, LASSO is used to perform feature selection on 13 factors that affect gas emission, and 9 factors that have a high impact on gas emission are screened out. The three main parameters of n_estimators, learning_rate, and max_depth in XGBoost are optimized through WOA, which solves the problem of difficult parameter adjustment due to the large number of parameters in the XGBoost algorithm and improves the prediction effect of the XGBoost algorithm. "When comparing PCA-BP, PCA-SVM, LASSO-XGBoost, and PCA-WOA-XGBoost prediction models, the results indicate that utilizing LASSO for feature selection is more effective in enhancing model prediction accuracy than employing principal component analysis (PCA) for dimensionality reduction." The average absolute error of the LASSO-WOA-XGBoost model is 0.1775, and the root mean square error is 0.2697, which is the same as other models. Compared with the four prediction models, the LASSO-WOA-XGBoost prediction model reduced the mean absolute error by 7.43%, 8.81%, 4.16%, and 9.92%, respectively, and the root mean square error was reduced by 0.24%, 1.13%, 5.81%, and 8.78%. It provides a new method for predicting the gas emission from the mining face in actual mine production.

1. Introduction

Gas concentration is an important indicator to measure the degree of coal mine gas hazards. Gas concentrations exceeding the limit are closely related to malignant coal mine incidents such as gas explosions, asphyxiation of underground personnel, and coal and gas outbursts. The underground environment is complex, and the change in gas concentration is not a simple static process but has a highly complex nonlinear relationship between its influencing factors. Through the investigation and cause analysis of coal mine gas accidents, it was found that failure to accurately grasp the changing laws of gas concentration is one of the main reasons for gas accidents. Therefore, accurately and efficiently predicting gas concentration is the top priority in preventing gas accidents. China is one of the countries with the worst gas disasters in the world. With the mining and utilization of coal resources, China’s coal development is rapidly shifting to the deep at a rate of 10–25 m per year, which makes the gas problem faced by coal mining more severe [1]. Accurate prediction of gas emission in mines can provide an important basis for mine ventilation and gas disaster prevention and control measures.
Many scholars have conducted in-depth research on the prediction of gas emission. The traditional prediction methods include the source prediction method, fuzzy comprehensive evaluation method, mine statistics method [2], gas geological statistics method, gray theory method [3], etc. [4]. In recent years, machine learning methods have been widely used in gas emission prediction. In 2012, LV Fu [5] first used principal component analysis (PCA) to reduce the dimensionality of the factors affecting gas emission in the mining face and performed multi-step linear regression prediction through the dimensionality-reduced principal components. The method reduces the number of predictive influencing factors and makes the calculation of the predicting process easier, but PCA dimensionality reduction changes the feature space structure of the original data, resulting in unclear meanings for new features. From 2015 to 2019, Lu Guobin [6], Li Bing [7], and Li Xinling [8] respectively combined PCA technology with BP neural networks, support vector machines (SVM), and extreme learning machines (ELM). The gas emission is predicted, and the prediction results show that the PCA data dimensionality reduction technology can improve the prediction accuracy and speed. In 2014, Xiang [9] proposed a coal mine gas concentration prediction model that combines wavelet transform and an extreme learning machine (ELM), which can realize one-step or multi-step advance prediction. However, the above models still have limitations: for example, the BP neural network is easy to fall into the local optimal solution, and the generalization ability is poor. The number of ELM hidden layer nodes has a great influence on the prediction effect, and improper selection will affect the prediction results. The choice of parameters and kernel functions is more sensitive. In 2022, Chen Qian [10] used the LASSO regression algorithm for the first time to predict the gas emission in the mining face, which showed that the LASSO regression algorithm was significantly better than the principal component analysis regression model. In 2023, Song [11] proposed a mine working face gas concentration prediction model based on LASSO-RNN by combining the Least Absolute Shrinkage and Selection Operator (LASSO) with the Recurrent Neural Network (RNN), showing that the LASSO effectively alleviates the problems of RNN overfitting and computational overhead.
In view of this, this paper proposes a gas emission prediction model that combines the Least Absolute Shrinkage and Selection Operator (LASSO), the Whale Optimization Algorithm (WOA), and Extreme Gradient Boosting (XGBoost). LASSO technology is used to select important factors affecting gas emission. This method ensures the preservation of the original data characteristics while simplifying the sample set. It leverages WOA to optimize XGBoost parameters, leading to the construction of a LASSO-WOA-XGBoost gas emission prediction model that enhances recovery. As a result, we introduce a novel approach for gas emission prediction at the working face.

2. Research Methods and LASSO-WOA-XGBoost Prediction Model Construction

2.1. LASSO Algorithm

The Least Absolute Shrinkage and Selection Operator (LASSO) was proposed by Robert Tibshirani in 1996 [12]. The feature selection of the LASSO algorithm is to remove irrelevant or redundant features from the original feature space and select an optimal feature subset. It is now widely used in various regression prediction fields [13,14,15,16]. The objective function of the LASSO algorithm Ǫ(β) is as follows:
Q ( β ) = Y n X n β 2 + λ β
In Equation (1), the Xn dependent variable is a matrix, Yn is an independent variable matrix, β is a coefficient matrix, and λ is a regularization parameter.

2.2. WOA Algorithm

Whale Optimization Algorithm (WOA) is a new heuristic optimization algorithm proposed by Mirjalili and Lewis in 2016 inspired by humpback whale predation behavior [17]. Compared with the Firefly Algorithm (FA) [18], the Fruit Fly Optimization Algorithm (FOA) [19] Particle Swarm Optimization (PSO) [20] WOA is more competitive in avoiding local optima in mathematical optimization and engineering optimization problems because of its power and better search ability [21,22,23].
When humpback whales hunt their prey, they will shrink to surround or swim towards the prey in a spiral form. The probability of the two ways happening is 50%. The mathematical model is described as follows:
X ( t + 1 ) = { X * ( t ) A D p < 0.5 X * ( t ) + D e b l cos ( 2 π l ) p 0.5
When p < 0.5 and A   < 1, the individual whale updates its position according to the contraction and encirclement method. The mathematical model is described as follows:
{ X ( t + 1 ) = X * ( t ) A D D = | C X * ( t ) X ( t ) | A = 2 a r 1 a C = 2 r 2 a = 2 2 t / t m a x
In Equation (3): X (t) and X *(t) are the current individual and the global optimal individual position, A and   C are coefficient vectors, D is the distance between the current whale individual and the optimal individual, a is the convergence factor, r 1 and r 2 are random numbers in [0, 1], t and tmax are the current and maximum iteration times.
When p ≥ 0.5, the individual whale updates its position in a spiral manner, and the mathematical model is described as follows:
{ X ( t + 1 ) = X * ( t ) + D e b l cos ( 2 π l ) D = | X * ( t ) X ( t ) |
In Equation (4): D is the distance between the current optimal individual and other individuals, b is the logarithmic spiral constant, and l is a random number between [–1, 1].
When p < 0.5 and   A ≥ 1, the individual whale randomly selects a whale individual from the current whale group to approach. This random selection avoids local optima. The mathematical model is described as follows:
{ X ( t + 1 ) = X r a n d ( t ) A D D = | C X r a n d ( t ) X ( t ) |
In Equation (5): X rand(t) is the random whale individual position in the current whale population.

2.3. XGBoost Algorithm

Extreme gradient boosting (eXtreme Gradient Boosting, XGBoost) is an efficient algorithm optimized on the basis of the gradient boosting iterative decision tree (GBDT) algorithm. The objective function is optimized by continuously adding new decision trees. Each tree is trained in sequence based on the residual of the previous tree. Every time a tree is added, the value of the loss function will continue to decrease. The prediction made by the model and the real value The smaller the deviation [24]; therefore, the XGBoost algorithm is widely used in wind power forecasting [25], wildfire disaster risk forecasting [26], stock forecasting [27], and other fields [28,29].
The objective function L(ϕ) of XGBoost includes two parts: the loss function and the constraint regularization term. The loss function indicates the degree to which the model fits the data, and the constraint regularization term is a penalty mechanism to prevent the model from overfitting.
L ( ϕ ) = i = 1 n l ( y ^ i , y i ) + k = 1 k Ω ( f k )
  Ω ( f k ) = γ T + 1 2 λ ω 2
In Equations (6) and (7), ŷi is the predicted value of sample xi, yi is the real value, k is the number of subtrees, fk is the output value of the kth subtree, Ω(fk) is the regular term of the kth tree, γ, λ is the hyperparameter, T is the number of leaf nodes of the tree, ω is the leaf node value, and l(ŷi, yi) is the training error of the sample xi.
y ^ i ( t ) = k = 1 t f k ( x i ) = y ^ i ( t 1 ) + f t ( x i )
k = 1 k Ω ( f k ) = k = 1 t - 1 Ω ( f k ) + Ω ( f t )
At the tth time, the objective function L(t) is:
L ( t ) = i = 1 n l ( y i , y ^ i ( t 1 ) + f t ( x i ) ) + Ω ( f t )
When the structure of the optimal tree is determined, the objective function L(t) is expanded through the second-order Taylor to obtain the optimal weight and the optimal objective function value on each leaf.

2.4. Construction of the LASSO-WOA-XGBoost Gas Emission Prediction Model

The model construction process is shown in Figure 1.
The idea of model construction is as follows:
(1) Gas emission data preprocessing. Feature selection is performed on the factors affecting gas emission through LASSO, and the data set after feature selection is divided into a training set and a test set.
(2) The optimal parameter combination of XGBoost is determined. Set the optimization range of the parameter values to be determined in XGBoost, and use WOA to adjust the parameters to determine the optimal parameter combination.
(3) XGBoost prediction model training. According to the optimal parameter combination determined in step (2), set the XGBoost parameter value and use the preprocessed training set in step (1) to train the LASSO-WOA-XGBoost prediction model.
(4) Gas emission forecast. Input the preprocessed test set in step (1) into the LASSO-WOA-XGBoost prediction model trained in step (3), and output the prediction results and regression model evaluation indicators.
The data on gas emission volume collected through the coal mine working face monitoring system was used as the research object, and predictive analysis was performed on the basis of maintaining the authenticity and integrity of the data as much as possible, achieving refined analysis of the gas emission data, which has important practical significance for strengthening the safety management of coal mine ventilation and improving the level of gas disaster prevention and control.

3. Application of the LASSO-WOA-XGBoost Gas Prediction Model

3.1. Sample Data Acquisition and Sample Data Correlation Analysis

Regarding the main natural factors and mining factors that affect the amount of gas eruption, the following principles should be followed when selecting influencing factors: (1) The value of the influencing factor is relatively stable; (2) The consistency of the influencing factor does not change with time; (3) The comprehensiveness and breadth of the influencing factors, fully covering the various factors that have a greater impact on gas emission, (4) The refinement of the influencing factors; under the premise of sufficient coverage, the number of influencing factors should be as small as possible to improve practical operability and reduce complexity; (5) Influencing factors can be quantified and analyzed. Referring to the above principles for selecting influencing factors and then referring to the theory of the separate source prediction method, this paper selected 13 factors that influence the gas emission amount of coal seams during coal mine working face mining. On the premise that the influencing factors have been selected, a prediction model for gas emission is established.
The sample data are the monitoring data of 30 groups of mining face gas emission in Qianjiaying Coal Mine [30]. X1 is the excavation depths (m), X2 is the coal seam thickness (m), X3 is the dip angle of coal seam (°), X4 is the original gas content of mining layer (m3∙t−1), X5 is the coal seam spacing (m), X6 is the height mining (m), X7 is the gas content of adjacent layer (m3∙t−1), X8 is the adjacent layer thickness (m), X9 is the interburden rock properties (m), X10 is the face length (m), X11 is the mining velocity (m∙d−1), X12 is recovery rate (%), X13 is daily output (t∙d−1), Y is gas emission (m3∙min−1), where X1–X13 are 13 influencing factors of gas emission and Y is the gas emission quantity. The specific data are shown in Table 1.
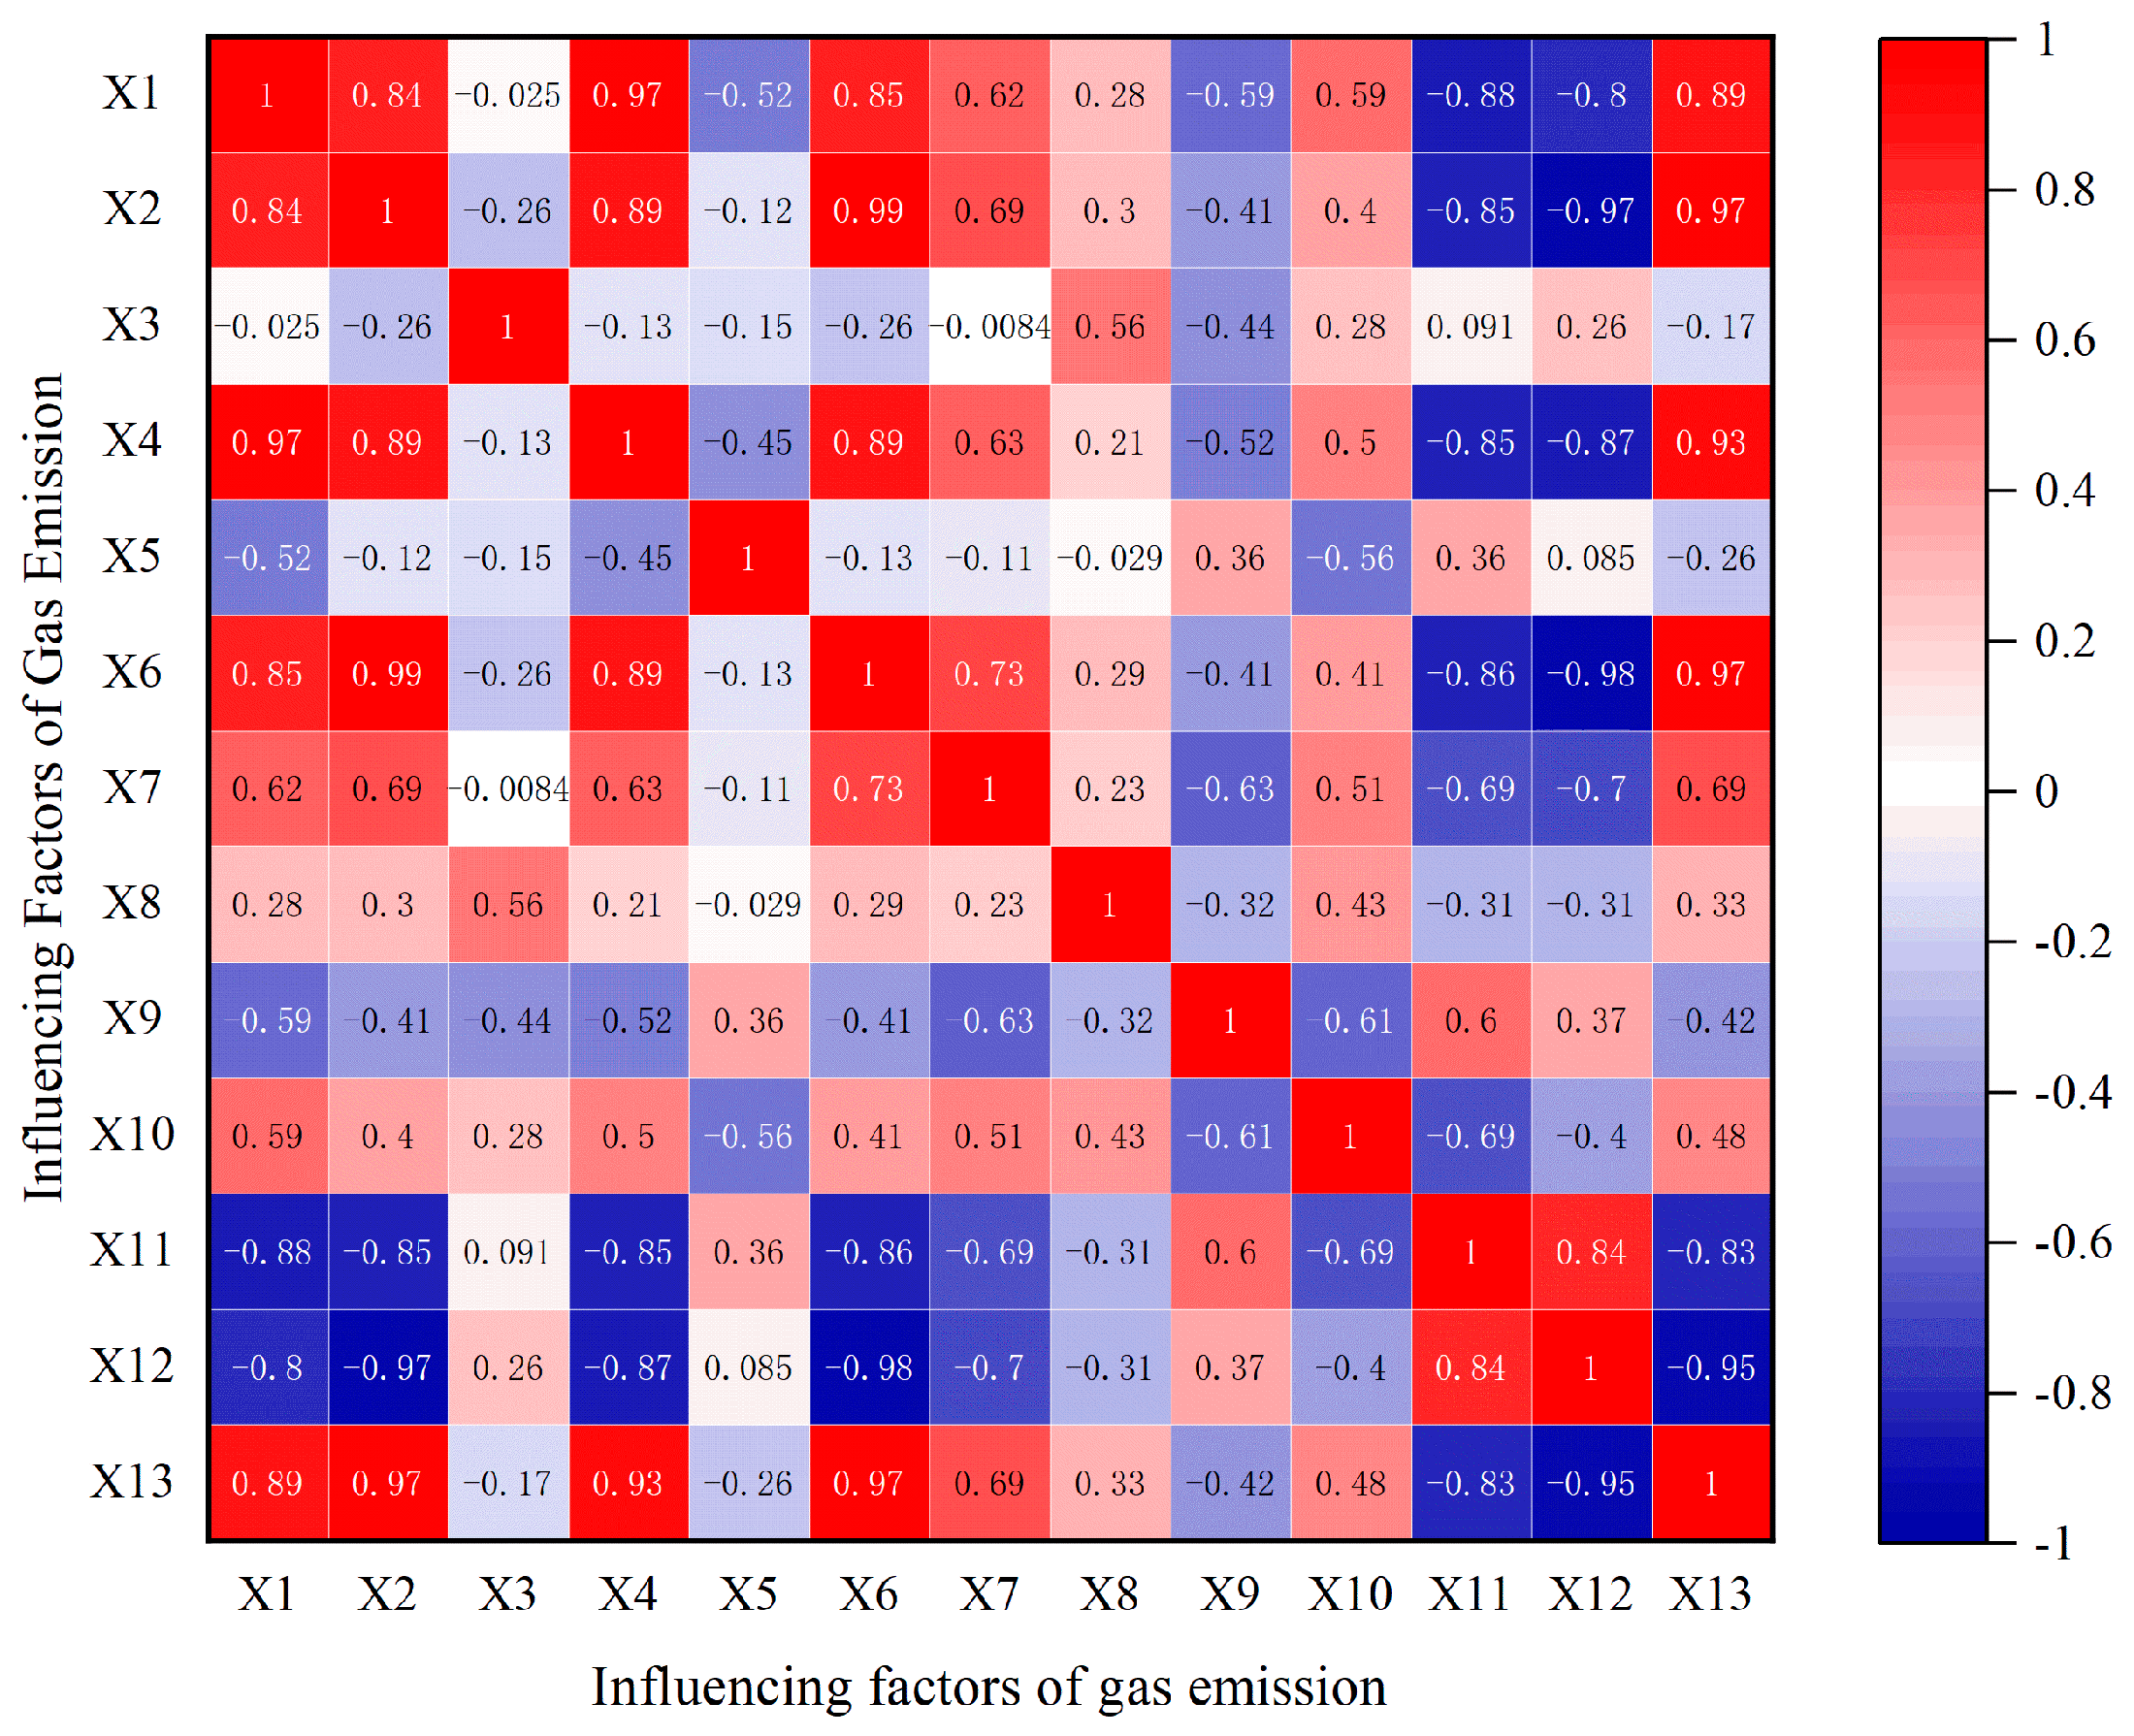
The Pearson correlation coefficient method was used to conduct correlation analysis on the 13 influencing factors of gas emission and generate a correlation heat map, as shown in Figure 2. The color of the heat map data grid represents the correlation between various influencing factors. Red indicates a positive correlation, blue indicates a negative correlation, and the darker the color, the stronger the correlation. It can be seen from Figure 2 that there is a strong correlation among multiple influencing factors, and it is suitable to use the LASSO algorithm for feature selection.

3.2. LASSO Algorithm Screening Factors

When predicting the amount of gas emission, there are many factors affecting the amount of gas emission. If all factors are directly substituted into the prediction model, the complexity of the model will be too high, which will affect the accuracy of the model [31]. Therefore, in order to reduce the complexity of the model, the LASSO algorithm is used to select the features of 13 factors that affect gas emission.
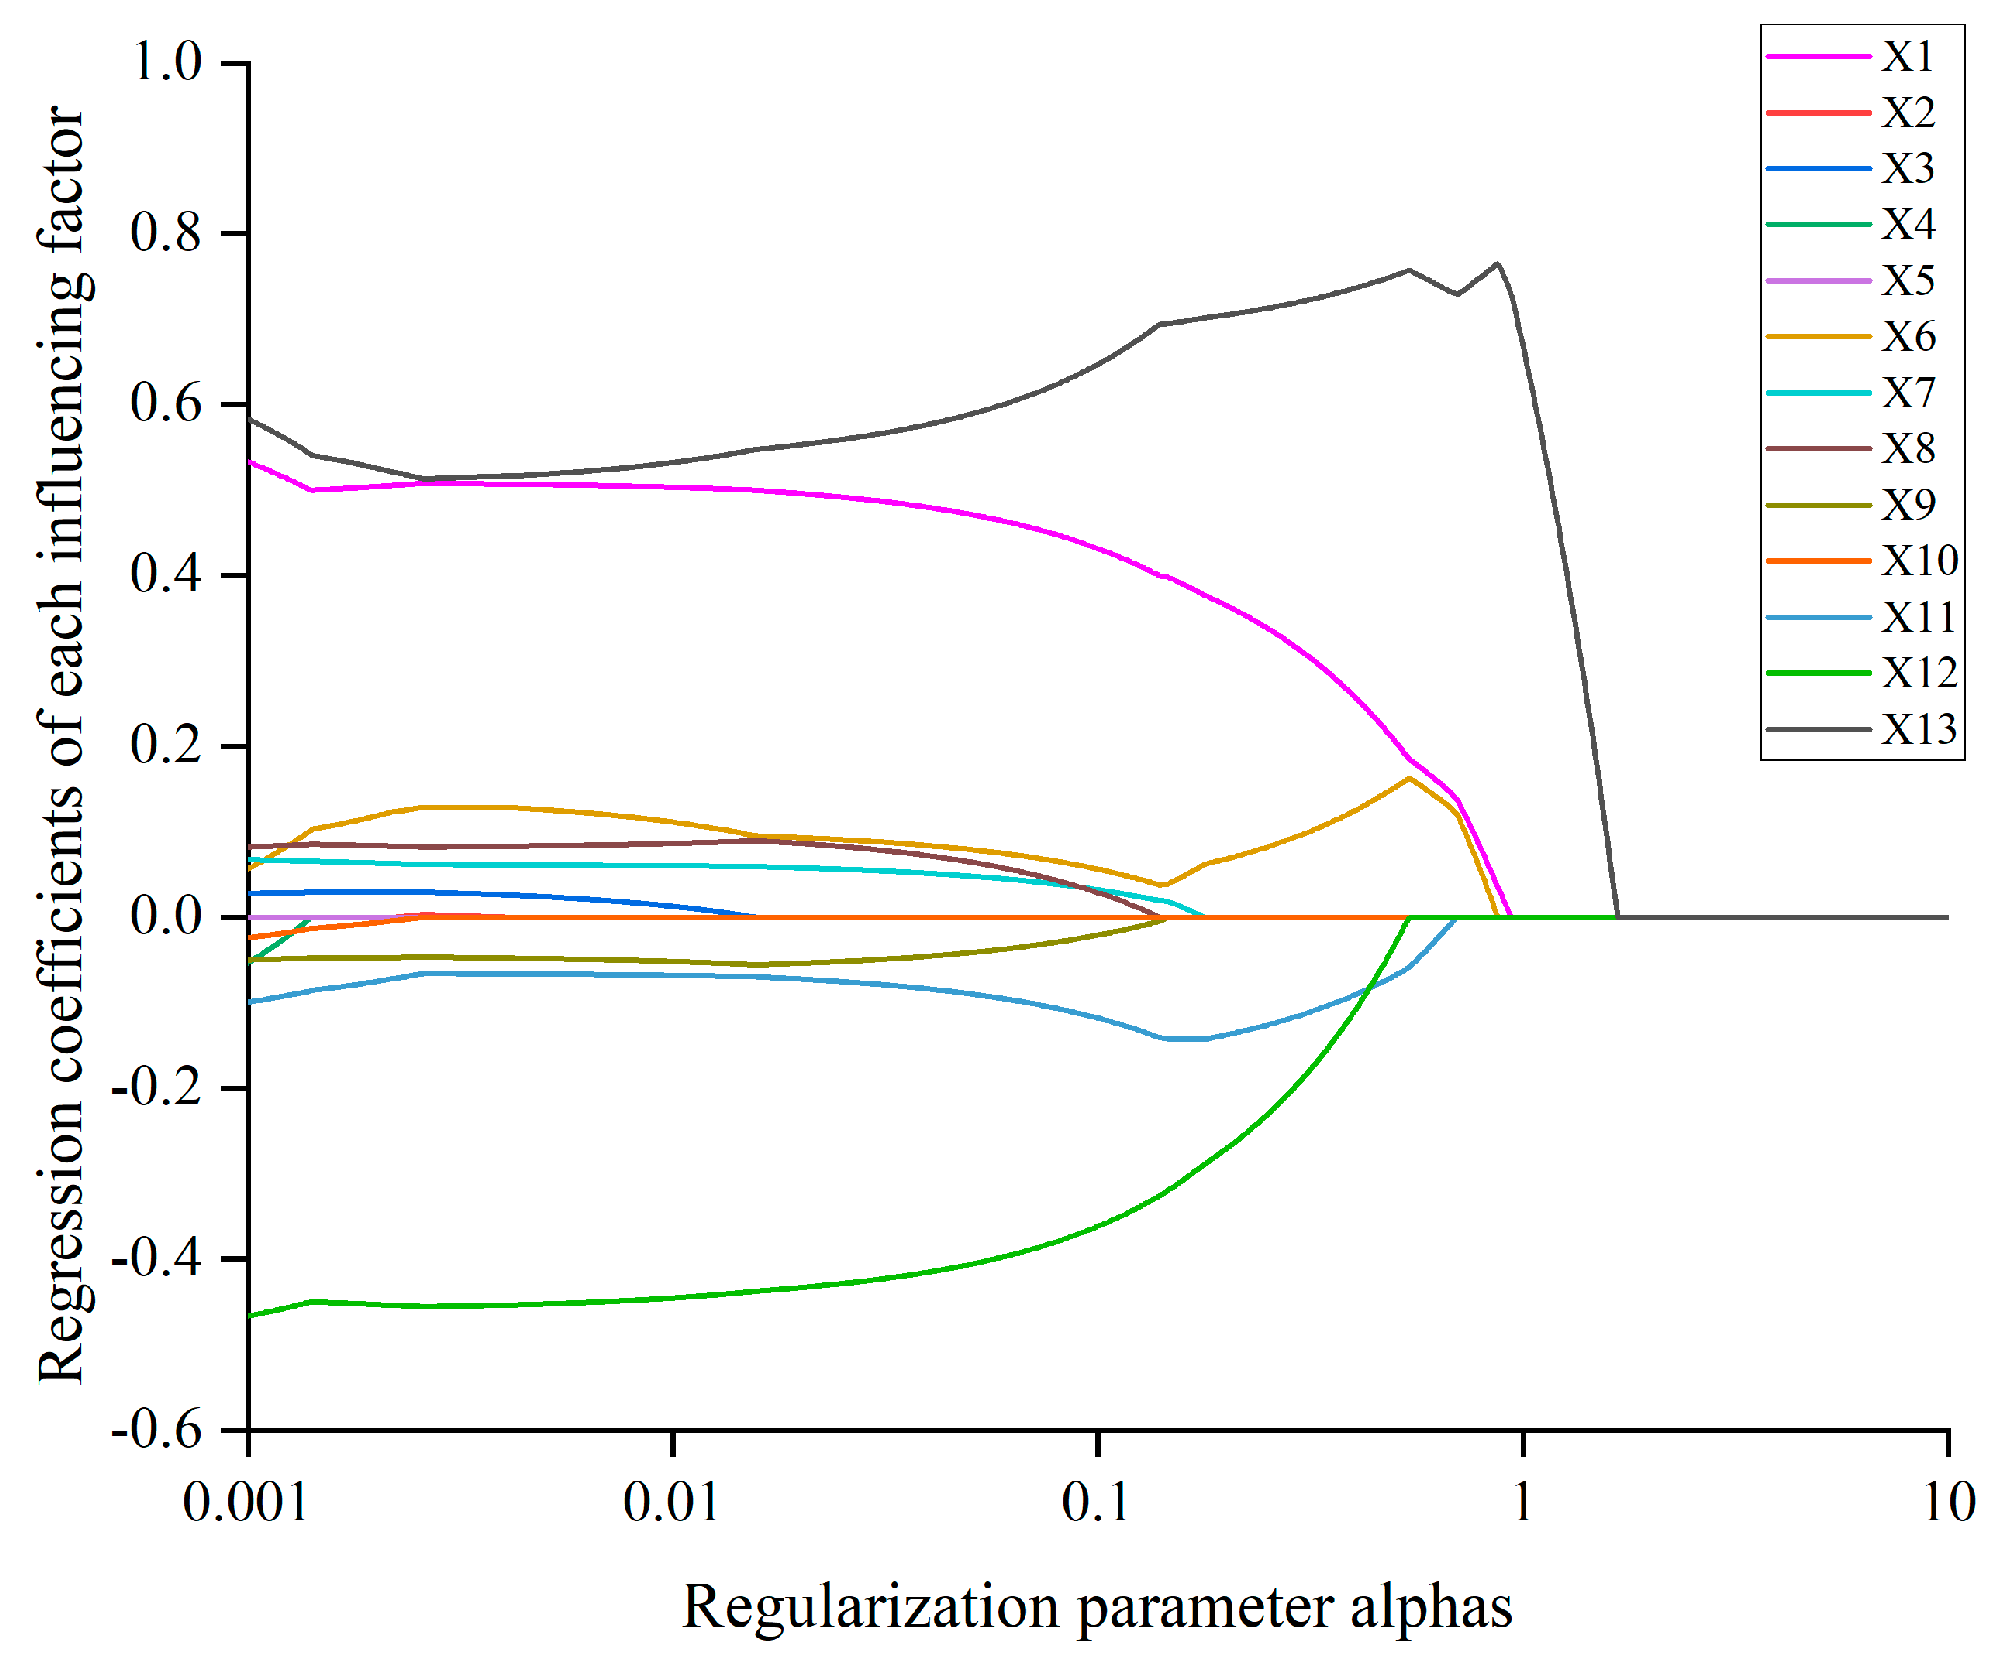
First, z-score normalization is performed on the data set (X1–X13) of factors affecting gas emission, and then LASSO is used for feature selection. The regression coefficients of the 13 feature factors vary with the regularization parameter alphas, as shown in Figure 3. It can be seen from Figure 3 that as the value of the regularization parameter alphas gradually increases, the regression coefficients of some features tend to zero, indicating that these The correlation between the feature (factors affecting gas emission) and the target variable (gas emission Y) is weak and can be eliminated.
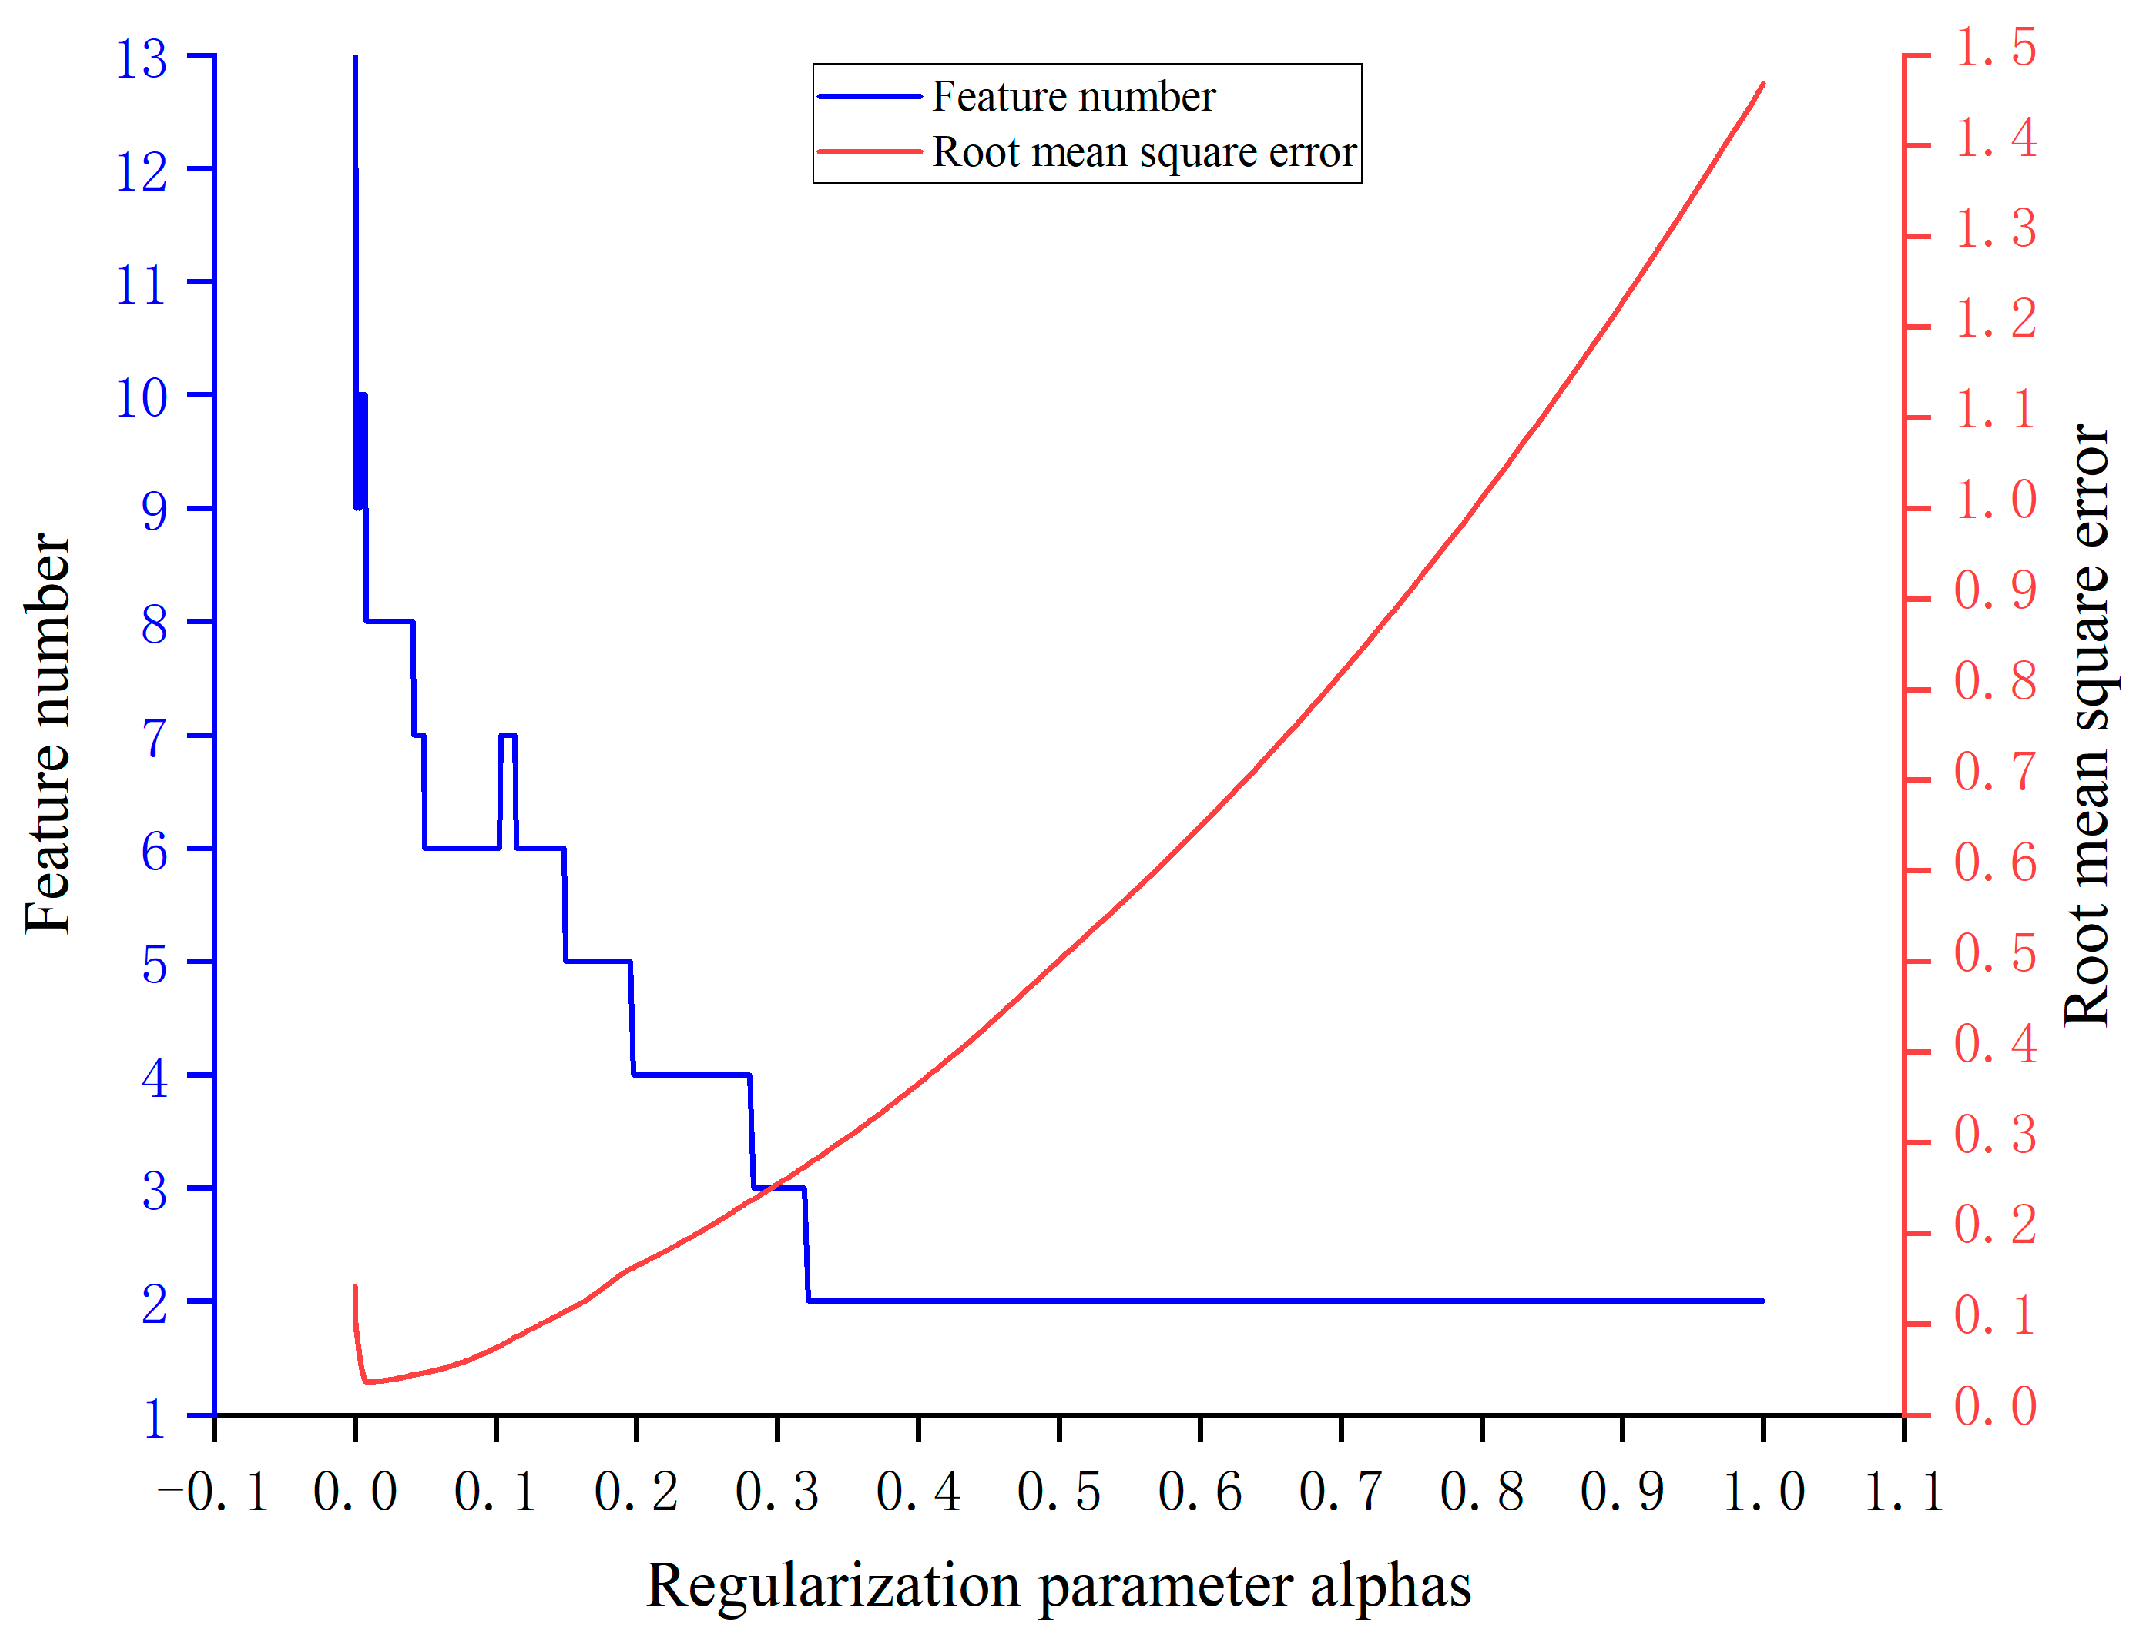
In order to determine the optimal alpha value, the root mean square error (RMSE) and the corresponding number of features under different alpha values were calculated through ten-fold cross-validation. The results are shown in Figure 4. It can be seen in Figure 4. When the value of the regularization parameter alphas is 0.0152, the root mean square error value is the smallest. At this time, the regression coefficients of four influencing factors (X2, X4, X5, X10) converge to 0, indicating that these four feature variables do not contribute positively to model training, so these four feature variables are eliminated. Reduce the 13 influencing factors for gas emission to 9.
LASSO was used for feature selection to screen out mining depth (X1), dip angle of coal seam (X3), height mining (X6), gas content of adjacent layer (X7), adjacent layer thickness (X8), interburden rock properties (X9), mining velocity (X11), recovery rate (X12), and daily output (X13), which are nine factors that have a greater impact on the amount of gas emission. The results of the regression coefficient values for each factor are shown in Table 2. The first 20 groups of the data set after feature selection are used as the training set, and the last 10 groups are used as the test set. See Table 3 and Table 4, respectively, for training and prediction of the continued model.

3.3. Optimization Settings of the Main Parameters of the XGBoost Algorithm

The XGBoost algorithm model contains a large number of parameters, and default values are usually used, but for specific data sets and problems, optimizing model parameters can improve the prediction effect of the model. This paper chooses WOA to optimize the three main parameters in the XGBoost algorithm. The specific parameter settings are shown in Table 5.

3.4. LASSO-WOA-XGBoost Model Prediction Analysis Comparison

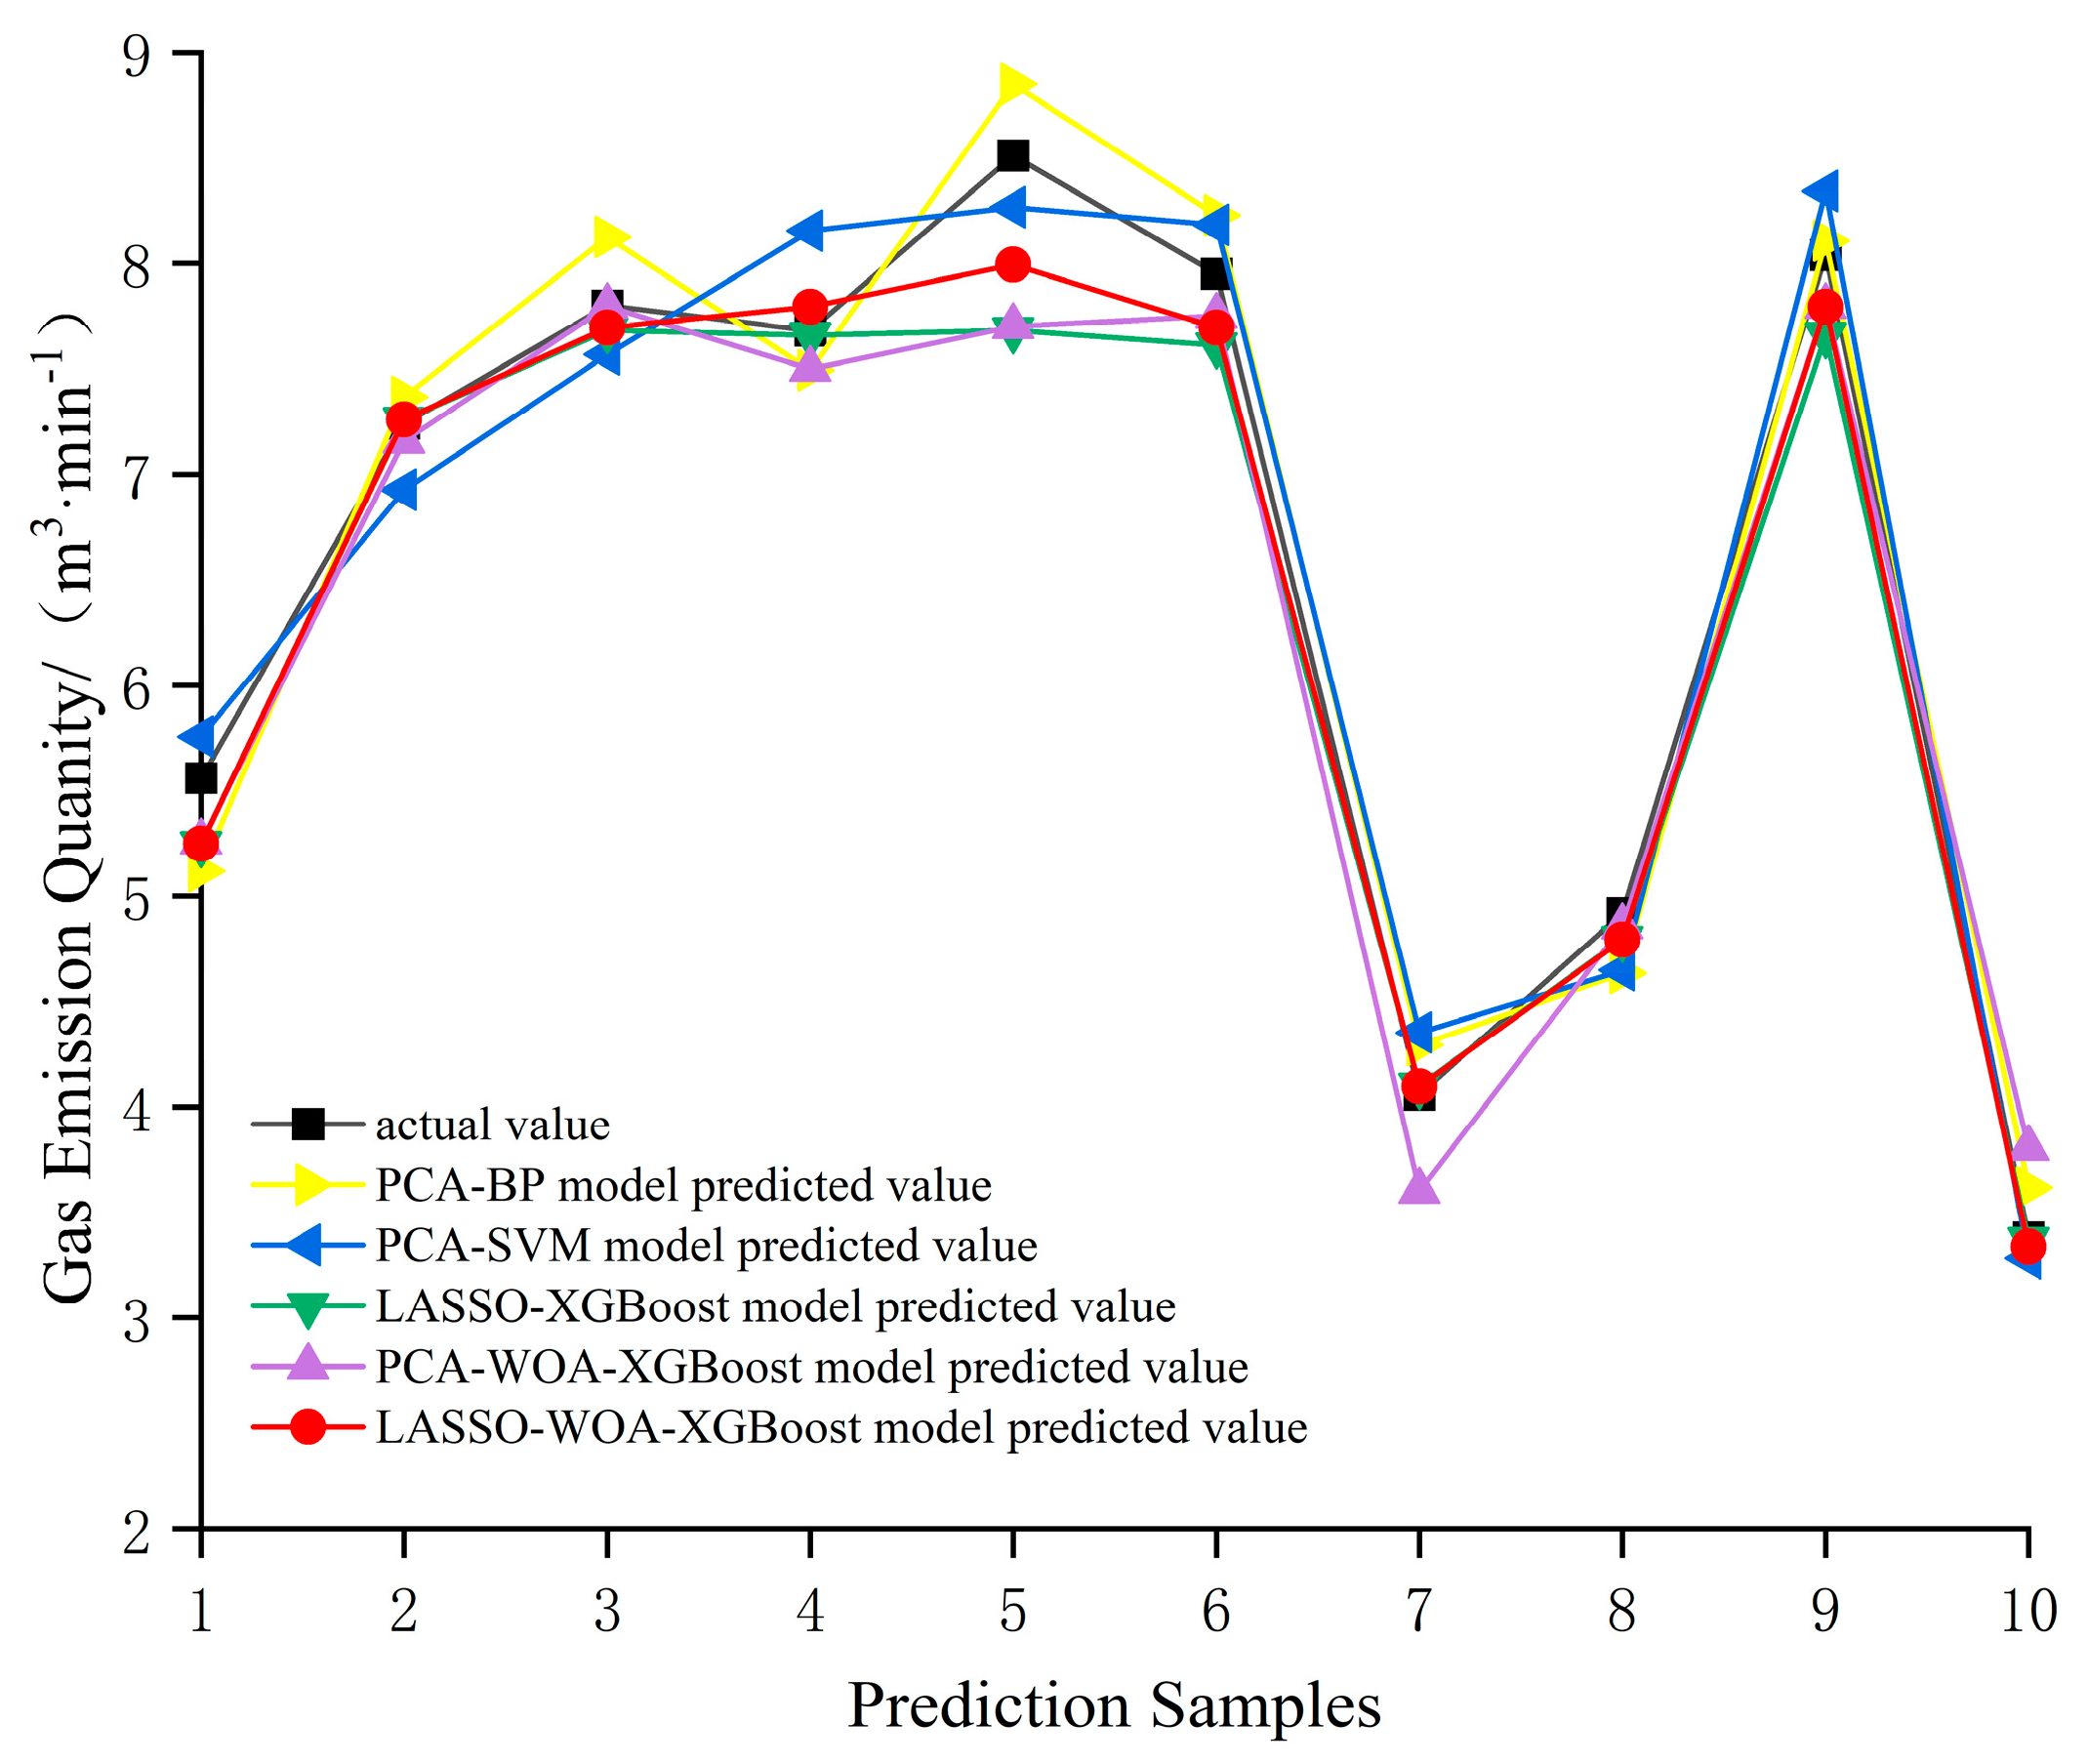
The PCA-BP, PCA-SVM, LASSO-XGBoost, PCA-WOA-XGBoost, and LASSO-WOA-XGBoost prediction models were respectively established. The PCA-BP model uses 3 principal components after PCA dimensionality reduction instead of the original 13. The influencing factors of gas emission are input into the BP model for prediction; the PCA-SVM model uses the 3 principal components after PCA dimensionality reduction to replace the original 13 influencing factors of gas emission, and is input into the SVM model for prediction. The LASSO-XGBoost model is input from the data set after LASSO feature selection into the XGBoost model for prediction, and XGBoost uses default parameters. The PCA-WOA-XGBoost model uses the 3 principal components after PCA dimensionality reduction to replace the original 13 gas emission factors, which are input into the XGBoost after parameter tuning by WOA for prediction. LASSO-WOA-XGBoost. The prediction model is that the data set after LASSO feature selection is input into XGBoost after parameter tuning by WOA for prediction. The prediction results of the five models are shown in Figure 5.
In order to further verify the prediction effect of the LASSO-WOA-XGBoost model on gas emission, two evaluation indexes, mean absolute error (MAE) and root mean square error (RMSE), were selected to compare the five prediction models. The lower the MAE and RMSE, the higher the accuracy of model predictions. The comparison of the evaluation index results of the five prediction models is shown in Table 6.
As can be seen from Table 6, the LASSO-WOA-XGBoost model optimized through WOA parameter adjustment has higher prediction accuracy than the LASSO-XGBoost model. Compared with PCA-WOA-XGBoost, the prediction accuracy of the LASSO-WOA-XGBoost model constructed after LASSO feature selection is higher, indicating that LASSO feature selection has more advantages than PCA dimensionality reduction in gas emission prediction. The mean absolute error of the LASSO-WOA-XGBoost prediction model is 0.1775, and the root mean square error is 0.2697. Compared with the other two prediction models, the LASSO-WOA-XGBoost model has the lowest MAE and RMSE and the best prediction effect.

4. Conclusions

(1) LASSO is used to select the factors affecting gas emission, and the optimal regularization parameters are determined by ten-fold cross-validation. It shows that when the regularization parameter alphas = 0.0152, the 13 factors affecting gas emission can be reduced to 9, which simplifies the data set and reduces the model training time.
(2) The three main parameters in XGBoost are optimized by the WOA algorithm, and the optimal parameter combination is determined. The results show that when the parameter combination values are n_estimators = 464, learning_rate = 0.2859, and max_depth = 8, the prediction accuracy of the XGBoost model is higher.
(3) Through the comparative analysis of the prediction results of the LASSO-XGBoost, PCA-WOA-XGBoost, and LASSO-WOA-XGBoost models, it can be seen that LASSO feature selection has more advantages than PCA dimensionality reduction in the gas emission prediction model. The mean absolute error of the LASSO-WOA-XGBoost prediction model is 0.1775, and the root mean square error is 0.2697, which is the same as other models. Compared with the four prediction models, the LASSO-WOA-XGBoost prediction model reduced the mean absolute error by 7.43%, 8.81%, 4.16%, and 9.92%, respectively, and the root mean square error was reduced by 0.24%, 1.13%, 5.81%, and 8.78%. Compared with the other four prediction models, this model has the lowest MAE and RMSE and the best prediction effect.

Author Contributions

Conceptualization, W.S.; methodology, X.H.; validation, X.H. and J.Q.; resources, W.S. and X.H.; writing—original draft preparation, X.H.; writing—review and editing, W.S., X.H. and J.Q. All authors have read and agreed to the published version of the manuscript.

Funding

This research received no external funding.

Institutional Review Board Statement

Informed consent was obtained from all subjects involved in this study.

Informed Consent Statement

Not applicable.

Data Availability Statement

The data used to support the findings of this study are available from the corresponding authors upon request. The data are not publicly available. The raw/processed data required to reproduce these findings cannot be fully shared at this time as the data also forms part of an ongoing study.

Conflicts of Interest

The authors declare no conflict of interest.

References

  1. Liu, F.; Cao, W.J.; Zhang, J.M.; Cao, G.M.; Guo, L.M. Current technological innovation and development direction of the 14th Five-Year Plan period in China coal industry. J. China Coal Soc. 2021, 46, 1–15. [Google Scholar] [CrossRef]
  2. Luo, X.Y.; Yu, Q.X. Prediction and evaluation of mine gas. China Saf. Sci. J. 1994, 3, 45–52. [Google Scholar] [CrossRef]
  3. Liu, X.X.; Zhao, Y.S. Predicting the Amount of Gas Gushed from Mine by Model GM(1,1) of Gray System Theory. China Saf. Sci. J. 2000, 4, 54–57. [Google Scholar] [CrossRef]
  4. Wang, X.L.; Ji, Z.G.; Xie, Y.T.; Yang, J.K.; Wu, P.; Wang, X.; Guo, X.Q. Present Situation and Development Trend of Gas Emission Prediction Technology in Coal Face. Sci. Technol. Eng. 2019, 19, 1–9. [Google Scholar] [CrossRef]
  5. Lv, F.; Lang, B.; Sun, J.W.; Wang, Y. Gas emission quantity prediction of working face based on principal component regression analysis method. J. China Coal Soc. 2012, 37, 113–116. [Google Scholar] [CrossRef]
  6. Lu, G.B.; Kang, J.K.; Bai, G.; Liu, J.; Xie, L.N. Application of PCA-BP to gas emission prediction of mining working face. J. Liaoning Tech. Univ. (Nat. Sci.) 2015, 34, 1329–1334. [Google Scholar]
  7. Li, B.; Zhang, C.H.; Li, X.J.; Wang, X.F. Prediction of Mine Gas Emission Based on PCA-ELM. World Sci.-Tech. Res. Dev. 2016, 38, 49–53. [Google Scholar] [CrossRef]
  8. Li, X.L.; Yuan, M.; Ao, X.J.; Long, N.Z.; Zhang, P. Application of PCA-SVM Model in Prediction of Coal Seam Gas Emission. Ind. Saf. Environ. Prot. 2019, 45, 35–39. [Google Scholar]
  9. Wu, X.; Qian, J.S.; Huang, C.H.; Zhang, L. Short-Term Coalmine Gas Concentration Prediction Based on Wavelet Transform and Extreme Learning Machine. Math. Probl. Eng. 2014, 2014, 858260. [Google Scholar] [CrossRef]
  10. Chen, Q.; Huang, L.B. Gas emission prediction from coalface based on Least Absolute Shrinkage and Selection Operator and Least Angle Regression. Coal Sci. Technol. 2022, 50, 171–176. [Google Scholar] [CrossRef]
  11. Song, S.; Chen, J.; Ma, L.; Zhang, L.; He, S.; Du, G.; Wang, J. Research on a working face gas concentration prediction model based on LASSO-RNN time series data. Heliyon 2023, 9, E14864. [Google Scholar] [CrossRef] [PubMed]
  12. Tibshirani, R. Regression shrinkage and selection via the lasso. J. R. Stat. Soc. Ser. B 1996, 58, 267–288. [Google Scholar] [CrossRef]
  13. Zang, Y. Prediction of Daily Fuel Consumption of Ship Based on LASSO. Navig. China 2022, 45, 129–132. [Google Scholar]
  14. Luo, Z.S.; Pan, K.C. Wax Deposition Rate Prediction of Waxy Crude Oil Pipelines Based on LASSO-ISAPSO-ELM Algorithm. Saf. Environ. Eng. 2022, 29, 69–77. [Google Scholar] [CrossRef]
  15. Oufdou, H.; Bellanger, L.; Bergam, A.; Khomsi, K. Forecasting Daily of Surface Ozone Concentration in the Grand Casablanca Region Using Parametric and Nonparametric Statistical Models. Atmosphere 2021, 12, 666. [Google Scholar] [CrossRef]
  16. Liu, S.; Liu, C.; Hu, Q.; Su, W.; Yang, X.; Lin, J.; Zhang, C.; Xing, C.; Ji, X.; Tan, W.; et al. Distinct Regimes of O3 Response to COVID-19 Lockdown in China. Atmosphere 2021, 12, 184. [Google Scholar] [CrossRef]
  17. Mirjalili, S.; Lewis, A. The Whale Optimization Algorithm. Adv. Eng. Softw. 2016, 95, 51–67. [Google Scholar] [CrossRef]
  18. Yang, X. Firefly algorithm, stochastic test functions and design optimisation. Int. J. Bio-Inspired Comput. 2010, 2, 78–84. [Google Scholar] [CrossRef]
  19. Pan, W.T. A new Fruit Fly Optimization Algorithm: Taking the financial distress model as an example. Knowl.-Based Syst. 2012, 26, 69–74. [Google Scholar] [CrossRef]
  20. Poli, R. Particle swarm optimization An overview. Swarm Intell. 2007, 1, 33–57. [Google Scholar] [CrossRef]
  21. Li, Y.L.; Wang, S.Q.; Chen, Q.R.; Wang, X.G. Comparative Study of Several New Swarm Intelligence Optimization Algorithms. Comput. Eng. Appl. 2020, 56, 1–12. [Google Scholar]
  22. Zhao, F.; Li, W. A Combined Model Based on Feature Selection and WOA for PM2.5 Concentration Forecasting. Atmosphere 2019, 10, 223. [Google Scholar] [CrossRef]
  23. Huang, S.; Yang, C.W.; Han, G.; Zhao, S.F.; Wang, M.Y. Optimal Design of a Controlled Diffusion Airfoil with the Whale Algorithm. J. Xi’an Jiaotong Univ. 2020, 54, 49–57. [Google Scholar]
  24. Chen, T.; Guestrin, C. XGBoost: A Scalable Tree Boosting System. In Proceedings of the 22nd ACM SIGKDD International Conference on Knowledge Discovery and Data Mining, San Francisco, CA, USA, 13–17 August 2016. [Google Scholar] [CrossRef]
  25. Wang, Y.S.; Guan, S.J.; Liu, L.M.; Gao, J.; Xu, Z.W. Wind power prediction method based on XGBoost extended financial factor. J. Zhejiang Univ. (Eng. Sci.) 2023, 57, 1038–1049. [Google Scholar] [CrossRef]
  26. Ren, C.; Yue, W.T.; Liang, X.Y.; Liang, Y.J.; Liang, J.Y.; Lin, X.Q. Risk assessment of wildfire disaster in Guilin based on XGBoost and combination weight method. J. Saf. Environ. 2023, 18, 1–9. [Google Scholar] [CrossRef]
  27. He, Y.; Li, H. Application of Improved NSGA-III-XGBoost Algorithm in Stock Forecasting. Comput. Eng. Appl. 2023, 47, 1–11. Available online: http://kns.cnki.net/kcms/detail/11.2127.TP.20230116.1550.003.html (accessed on 21 July 2023).
  28. Zamani, M. PM2.5 Prediction Based on Random Forest, XGBoost, and Deep Learning Using Multisource Remote Sensing Data. Atmosphere 2019, 10, 373. [Google Scholar] [CrossRef]
  29. Jin, Q.; Fan, X.; Liu, J.; Xue, Z.; Jian, H. Estimating Tropical Cyclone Intensity in the South China Sea Using the XGBoost Model and FengYun Satellite Images. Atmosphere 2020, 11, 423. [Google Scholar] [CrossRef]
  30. Feng, S.C.; Shao, L.S.; Lu, W.J.; Meng, T.R.; Gao, Z.B. Application of PCA-PSO-LSSVM model in gas emission prediction. J. Liaoning Tech. Univ. (Nat. Sci.) 2019, 38, 124–129. [Google Scholar]
  31. Lin, H.F.; Zhou, J.; Gao, F.; Jin, H.W.; Yang, Z.Y. Coal seam gas content prediction based on fusion of feature selection and machine learning. Coal Sci. Technol. 2021, 49, 44–51. [Google Scholar] [CrossRef]
Figure 1. Flow chart of gas emission prediction based on LASSO-WOA-XGBoost.
Atmosphere 14 01628 g001
Figure 2. Correlation heat map of various influencing factors of gas emission.
Atmosphere 14 01628 g002
Figure 3. The regression coefficient of each influencing factor changes with alphas.
Atmosphere 14 01628 g003
Figure 4. The number of features and the root mean square error change graph with alphas.
Atmosphere 14 01628 g004
Figure 5. A comparison chart of the results of the three forecasting models.
Atmosphere 14 01628 g005
Table 1. Data set of gas emission and influencing factors in the working face.
Number X1X2X3X4X5X6X7X8X9X10X10X12X13Y
14122.582.12242.02.11.534.781404.160.9601 5282.91
24231.5112.14171.42.551.624.751804.140.9501 7513.52
34362.3102.53142.22.401.484.911454.670.9452 0743.62
44592.4152.45242.32.421.784.751554.570.9442 1044.13
55112.8133.24142.42.211.724.781803.450.9302 2414.60
65152.3172.85172.52.771.874.511703.250.9401 9734.94
75562.793.37132.51.881.424.851653.680.9322 2874.78
85503.1123.67152.92.321.654.831554.010.9202 3525.25
95903.0113.68123.63.111.464.531753.530.9402 4105.26
105815.284.31175.93.471.574.761702.800.7973 1317.26
116116.794.05166.73.151.804.701752.640.8123 3547.80
124082.0101.92202.02.021.505.031554.420.9601 8253.34
134112.082.15222.02.101.214.871404.160.9501 5272.94
144201.8112.14191.82.641.624.751754.130.9501 7513.56
154322.3102.58172.32.401.484.911454.670.9502 0783.62
164562.2152.40202.22.551.754.631604.510.9402 1044.17
175162.8133.22122.82.211.724.781803.450.9302 2424.60
185272.5172.80112.52.811.814.511803.280.9401 9794.92
195312.993.35132.91.881.424.821653.680.9302 2884.78
205502.9123.61142.92.121.604.831554.020.9202 3525.23
215633113.68123.03.111.464.531753.530.9402 4105.56
225905.984.21185.93.401.504.771702.850.7953 1397.24
236046.294.03166.23.151.804.701802.640.8123 3547.80
246076.194.34176.13.021.744.621652.770.7853 0877.68
256346.5124.80156.52.981.924.551752.920.7733 6208.51
266406.3114.67156.32.561.754.601752.750.8023 4127.95
274502.2122.43162.22.001.704.841604.320.9501 9964.06
285442.7113.16132.72.301.804.901653.810.9302 2074.92
296296.4134.62196.43.351.614.631702.800.8033 4568.04
304012.0101.87252.42.141.785.121504.520.9501 8553.38
Table 2. The regression coefficient value of each feature after LASSO feature selection.
Influencing FactorsLASSO Regression Coefficient Influencing FactorsLASSO Regression Coefficient
X10.5004X80.0889
X20.0000X9−0.0548
X30.0025X100.0000
X40.0000X11−0.0692
X50.0000X12−0.4392
X60.0984X130.5444
X70.0595
Table 3. Dataset of gas emission and influencing factors after LASSO feature selection (training set).
Number X1 X3 X6X7 X8X9X11X12X13Y
141282.02.11.534.784.160.961 5282.91
2423111.42.551.624.754.140.951 7513.52
3436102.22.401.484.914.670.9452 0743.62
4459152.32.421.784.754.570.9442 1044.13
5511132.42.211.724.783.450.932 2414.60
6515172.52.771.874.513.250.941 9734.94
755692.51.881.424.853.680.9322 2874.78
8550122.92.321.654.834.010.922 3525.25
9590113.63.111.464.533.530.942 4105.26
1058185.93.471.574.762.800.7973 1317.26
1161196.73.151.804.702.640.8123 3547.80
12408102.02.021.505.034.420.961 8253.34
1341182.02.101.214.874.160.951 5272.94
14420111.82.641.624.754.130.951 7513.56
15432102.32.401.484.914.670.952 0783.62
16456152.22.551.754.634.510.942 1044.17
17516132.82.211.724.783.450.932 2424.60
18527172.52.811.814.513.280.941 9794.92
1953192.91.881.424.823.680.932 2884.78
20550122.92.121.604.834.020.922 3525.23
Table 4. Gas emission volume and influencing factors data set after LASSO feature selection (test set).
Number X1 X3 X6X7 X8X9X11X12X13Y
1563113.03.111.464.533.530.942 4105.56
259085.93.4.01.504.772.850.7953 1397.24
360496.23.151.804.702.640.8123 3547.80
460796.13.021.744.622.770.7853 0877.68
5634126.52.981.924.552.920.7733 6208.51
6640116.32.561.754.602.750.8023 4127.95
7450122.22.001.704.844.320.951 9964.06
8544112.72.301.804.903.810.932 2074.92
9629136.43.351.614.632.800.8033 4568.04
10401102.42.141.785.124.520.951 8553.38
Table 5. WOA-XGBoost model parameter settings.
Parameter NameDefaultsWOA Optimized ValuesRangesParameter Meaning
n_estimators100464[1, 500]number of trees
learning_rate0.10.2869[0, 1]learning rate
max_depth68[1, 10]tree depth
Table 6. Comparison of the evaluation index results of the three prediction models.
Model NameMean Absolute Error (MAE)Root Mean Square Error (RMSE)
PCA-BP0.25180.2721
PCA-SVM0.265550.2810
LASSO-XGBoost0.21910.3278
PCA-WOA-XGBoost0.27670.3575
LASSO-WOA-XGBoost0.17750.2697
Disclaimer/Publisher’s Note: The statements, opinions and data contained in all publications are solely those of the individual author(s) and contributor(s) and not of MDPI and/or the editor(s). MDPI and/or the editor(s) disclaim responsibility for any injury to people or property resulting from any ideas, methods, instructions or products referred to in the content.