1. Introduction
The main characteristic of the modern period in urban climate studies is the development of new analysis techniques, including more realistic models and studies encompassing different sizes of cities beyond the context of developed countries [
1]. This has led to a fresh perception of the urban surface and its contrast with the rural environment. The range of analytical possibilities is no longer confined to the rural versus urban dichotomy. Urban landscape diversities are increasingly being deliberated, pitting local specificities against previously established general definitions. Furthermore, there is also the need to align them to a representation that facilitates correlating the characteristics of different cities and expanding the scale of discussions (in both time and space).
The integration of these studies into urban and environmental planning remains a challenge for researchers, as it hinges upon a form of collaboration that encompasses various stakeholders and interests. The absence of such engagement contributes to the fact that urban climate continues to be overlooked in city planning, despite its direct influence on the population’s quality of life. Furthermore, in terms of climatic impacts on cities, the pluviometric effects are often more emphasized in Brazil compared to those related to urban heat, owing to the frequent and concentrated occurrence of extreme precipitation events.
Pluviometric events happen suddenly and intensely, causing significant impacts within a short period. On the other hand, urban heat occurs continuously and subtly, but it is equally harmful. The limited availability of temperature data collection points compromises both the characterization and analysis of urban heat dynamics and impacts. In this instance, the city of Recife (Brazil), presents a noticeable disparity in the number of data collection points for rainfall compared to temperature across the urban landscape. This asymmetry presents a significant challenge for urban climate studies, as it leads to an incomplete comprehension of the urban climatic phenomenon in this city.
Recife is the capital of the state of Pernambuco and the core of the most populated metropolitan region in the northeastern region of Brazil. Geographically, it is situated on the eastern coastal shoreline of this region and combines sensitive physical and socio-spatial factors. These include areas of low altitude juxtaposed with high declivity, elevated population density, concentrations of both intensely verticalized zones mostly covered by impermeable surfaces, and informal urban settlements inhabited by socially vulnerable populations. It is a city characterized by contrasts that are reflected and interacted with by the climate, leading it to be recognized as one of the most vulnerable cities to climate change worldwide [
2].
Although Recife stands out as the center of one of the main metropolitan regions in Brazil and as one of the most vulnerable cities to climate change in the world, the full extent of damages, both direct and indirect, from its urban heat is not easily noticeable. For this reason, this article consists of a descriptive literature review aimed at discussing the main studies on urban heat in Recife, covering a broader perspective of its conceptual aspects and practical implications. Subsequently, it offers valuable theoretical and methodological insights for prospective investigations.
A descriptive review of the urban climate in Recife provides a comprehensive and contextualized understanding of the city’s specific climate challenges. In addition to mapping local trends and solutions, this approach allows for a profound analysis of the complex interactions among the physical, social, and environmental elements of the urban landscape. This in-depth understanding not only benefits the local population by aiding in the formulation of more effective adaptation and mitigation strategies but also holds global implications. The lessons learned in Recife can be applied to other cities worldwide facing similar climate challenges and underrepresented in these studies. Furthermore, by highlighting gaps in existing research and influencing local policies, this review stimulates continuous progress in the field of urban climate, promoting a more holistic and sustainable approach to addressing climate challenges in 21st-century cities.
Apart from this introductory section, the text is divided into five main sections. The first one presents the material and methods and the second discusses the main concepts of urban climate in terms of urban heat scales. The third section portraits the historical and regional contexts of the current urban landscape of Recife. The fourth section explores the challenges in data acquisition and the main findings. The fifth and the last sections, respectively, discuss the current efforts with possible future developments of the research and final conclusions.
2. Materials and Methods
This study consists of a descriptive literature review to explore urban heat studies, concepts, methodologies, applications, and future perspectives in the context of Recife, Brazil. The primary research materials include scientific articles, dissertations, and theses, accessed from the following open databases: Scientific Electronic Library Online (SciELO), Google Scholar, and the Brazilian Digital Library of Theses and Dissertations (BDTD, Biblioteca Brasileira de Teses e Dissertações). The following keywords were considered in the search: “urban heat island”, “urban heat”, “climate change”, “landscape”, “Recife”, and “Brazil”, as search parameters with no timeframe.
In addition to academic sources, official documents, such as municipal laws and academic public calls, were also incorporated into our analysis. The nature of a descriptive review allowed the inclusion of these documents, providing a broader understanding of urban climate in Recife. The resulting descriptive review is presented in the following three chapters, of which the first focuses on general sources and presents the main concepts of urban climate and provides the main conceptual basis for the subsequent chapters, which are specifically directed to urban heat studies in Recife.
3. Background of Urban Heat: Exploring Concepts from Microscale to Climate Change
Climatology has played an indispensable role in investigating the physical processes of the atmosphere that interact with urban spaces at different scales. There are several scale classifications in climatology, but in general, there are three main spatiotemporal ones: macroscale, mesoscale and microscale.
The concept of climate and how it differs from weather already involves the temporal scale since weather refers to short-term observed meteorological conditions, and climate refers to the understanding of average (or normal) climatic conditions measured over a long period of time, formally 30 years, in a specific location. Positive or negative deviation of a particular observed weather parameter in relation to its long-term average (climatology) is understood as a climate anomaly. Additionally, climate variability is understood when these deviations are part of a normal and/or expected fluctuation of this parameter over time, and climate change occurs when there is a significantly sufficient climatic alteration to change the average climatic patterns, in other words, the climatic reference itself.
These deviations and changes can be triggered by both natural and artificial causes, and human activities are a major concern due to their potential impact on climate at several scales. In this sense, the urban climate has emerged from climatology as a new field of study. The nature of urban climate can be represented by Equation (1) [
3], where
M represents a given climate variable in a given urban location (
i), time (
t) and type of time (
x);
C,
L and
U represent, respectively, the regional, local and urban components. Thus, “the urban climate results from the interaction of urban factors with the regional climate and the pre-existing physical environment” [
4].
The term urban climate is a contraction of the phrase “urban meteorology and climatology” [
5], as it includes the study of meteorological processes, atmospheric phenomena, and their interactions over the long term, e.g., the climate subjected to urban development [
5]. From human perception, the urban climate can be explained as a system [
6], through the theoretical–methodological concept of the urban climate system (UCS), based on three perception channels: thermal comfort, air quality, and meteoric impact. The first refers to the thermodynamic subsystem of urban climate, which is pointed out as the basic input of the UCS [
6], crossing the entire structure of this system. The second is related to the physical–chemical subsystem, involving air pollution. The third covers the hydrometeoric subsystem, related to meteoric impact mechanisms, such as rainstorms.
The concept of thermal field converges with the thermodynamic subsystem. The temperature itself is associated with human senses, as it is the perception of heat. The term “field” can motivate a rich debate as it is a physics notion and can be understood both as the interaction between bodies at a given distance and as a mathematical function to describe physical properties of matter in cases where it is treated as continuous [
7]. Concerning the urban thermal field, the physical property of matter is the intrinsic temperature of the urban space.
The current diversity of landscapes within and between cities, as well as the growing influence of the city in the production of rural space, poses a challenge in representing these environments. To overcome the subjectivity of the rural versus urban dichotomy, current studies aim to understand the relationship between urban landscape diversity and its relationship with the intra-urban thermal field. The landscape, defined as “the local extension of land with physical and/or cultural characteristics that were shaped by physical and/or cultural agents” [
8], presents itself as the main geographical category in urban heat analysis.
The smallest unit of the urban structure is the urban canyon, at the microscale, which represents the common arrangement between the street and its adjacent buildings [
9]. In general, landscape has two main properties: surface coverage and surface structure [
8]: Surface cover refers to the characteristics of surface materials and their ability to modify the albedo, moisture, and heating and cooling potential of the soil. Examples of different types of surface cover include water bodies, vegetation, and impermeable surfaces. Surface structure is related to the three-dimensional component and spatial arrangement of urban elements, which interact directly with wind flow, atmospheric heat transport, and radiation balance [
8].
The urban heat island (UHI) is the main phenomenon of urban climate, characterized by the thermal gradient between urbanized areas and their rural surroundings resulting from urban expansion and human activities. The main causes that interact with the atmosphere and contribute to UHI formation are mainly related to the radiation balance in the urban canyon. UHI is a thermal anomaly with horizontal, vertical, and temporal dimensions [
9]. Within the scope of the UHI, the terms “island of freshness” and “park effect” (park cool island) refer to places where the temperature is lower than in the rural reference.
There are four UHI types [
10], each with its spatial and temporal dynamics, which make them methodologically complex: The surface UHI (UHIsup), the lower atmosphere UHI (UHIatm), the upper atmosphere UHI (UHIubl), and the subsurface UHI (UHIsub). The UHIsup covers the temperature gradient between urban and rural surfaces (in the surface level) and can be recorded both by sensors fixed to surfaces and remote sensors. The UHIatm is between the ground level and the average level of buildings and can be identified by means of sensors at fixed points and/or mobile transects. The UHIubl is the difference in layer air temperature located between the top of the urban canopy layer and the top of the atmospheric boundary layer and their similar elevations in the surrounding rural region. The UHIsub refers to the difference in temperature patterns recorded below the surface, including urban soils and underground buildings, taking the soil of the rural surroundings as a reference, and is still little explored in the literature.
In addition to surface cover and structure, their respective thermal and material properties, UHI can also result from anthropogenic heat flow and the urban greenhouse effect. The literature generally reports that UHI is mainly a nocturnal phenomenon and usually reaches its greatest intensity between six and seven hours after sunset [
11]. However, fine-scale temporal variability of UHI, with explicit spatial information, is still scarce in the literature [
12].
In addition to the physical elements of the urban landscape, the quantification of the spatial and temporal distribution of the urban heat island (UHI), as well as its adaptation and mitigation measures, should be applied carefully [
13]. In this regard, human biometeorology plays a role in integrating atmospheric and human variables at a microscale, thereby defining the quality of life and human health protection as research targets.
Furthermore, at the local scale, there is the challenge of understanding the implications of socio-spatial inequalities and diversities on the impact of urban climate on individuals [
14]. It becomes imperative to consider that discussing the urban climate in Recife, as well as in other metropolises of the Global South, should not necessarily follow the procedures addressed in European or North American cities, as they involve distinct realities of complex urban expansion processes based on spatial segregation and the vulnerability of social groups.
This is reflected individually in the low adaptive capacity of these vulnerable individuals to climate impacts. Collectively, discussing the thermal comfort level of a specific urban park becomes secondary when problems related to public insecurity prevent such urban facilities from being fully utilized by the population. The interaction between scale and the comprehension of urban climate becomes evident and challenging. This challenge emerges as scale should not be perceived merely as a confined or delimited scope for research. Urban inhabitants experience climate change twofold, on one hand, by UHI effects, and on the other, by the already unfolding impacts of climate change [
15]. Thus, addressing research scales means surpassing spatiotemporal boundaries, and taking a path of integration of approaches.
Just as it is crucial to find approaches that encompass the various scales of climate, it is equally important to recognize that urban climate extends beyond discussing its core concepts and describing the physical/morphological aspects of the urban landscape. This is especially true when dealing with urban environments shaped by the complex challenges and inequalities prevalent in Latin America.
Therefore, understanding the urban landscape beyond its physical elements becomes essential to support integrative approaches. Hence, the next chapter provides a brief overview of the regional and historical contexts that have contributed to shape the urban landscape of Recife within the realm of urban climate.
4. Urban Landscape of Recife: Historical and Regional Contexts
Urbanization is a worldwide process that involves the conversion of previously rural spaces into urban spaces through changes in occupation, culture, behavior, and lifestyle [
16]. In most Latin American states, urbanization has occurred in a disorganized and antagonistic way [
17]. Brazil is currently one of the world’s most industrialized countries [
18,
19] but most of its industrialized areas are traditionally concentrated in two main political regions: the Southeast and the South regions, where cities like São Paulo, Rio de Janeiro, Curitiba and Porto Alegre are located.
The northeast region of Brazil, despite having the oldest colonial settlement in the country, has undergone a more recent industrialization compared to the aforementioned regions, mainly due to the transformations resulting from the commercial opening of Brazil in the 1990s [
17]. This region has a mostly semi-arid climate, with a narrow area of humid tropical climates along the coastline, where most capital cities are located, including Recife (
Figure 1). The industrial concentration that occurs in this narrow coastal stretch, gathers 20 million people and 80% of the GDP of the entire region [
20].
Recife, the capital city of the state of Pernambuco, covers an area of 218.4 km
2 and has a population of approximately 1,653,461 inhabitants [
21]. The demographic density in Recife is around 7333 inhabitants per km
2, divided into 94 districts. The city has a high social, cultural, and economic diversity with a notable, diverse landscape.
Despite the industrial boost of the last decades, the formation of the urban space of Recife is closely linked to both the local and regional climate. Until the beginning of the 20th century, Recife’s compact urban spaces were limited to three districts (Recife, São José, and Santo Antônio, corresponding to Area 1 in
Figure 1) [
22]. At that moment, there were also two districts with sparse urbanized areas (Boa Vista and Santo Amaro, corresponding to Area 2 in
Figure 1) and all the others consisted of rural areas from former sugar cane plantations or coconut plantations with fishing settlements near the coastline.
The 20th century was marked by more significant urban changes in Brazil [
17]. Regarding Recife [
23] provides a detailed discussion on the urban legislations that guided its urban expansion from the early 20th century to the present day. This demographic expansion in Recife was mainly led by the migration of thousands of people from the northeast semiarid region due to severe droughts at the beginning of the 20th century. The newly arrived population inhabited precarious and irregular settlements, known as mocambos. These mocambos were located in risk areas, such as mangroves and flooded areas, so that the migrant population remained under environmental vulnerability. There were 16,347 mocambos registered in Recife in the year 1913. Twenty-six years later this number had risen to 45,581, representing 63.7% of all properties in Recife [
22].
Droughts are a natural and recurrent phenomenon in most of the northeast region of Brazil. Meanwhile, intense and extreme rainfall events are frequent on the coastline of this region, where Recife is located. The city of Recife has a high frequency of these events [
24,
25]. As the number of mocambo settlements in risk areas increased exponentially in Recife, floods began to affect an increasing number of people. Urban reforms that took place in Recife until the 1940s aimed to remove the mocambo settlements [
26]. However, the migrating population lacked assistance and informally began to inhabit the hills surrounding the city.
The resulting spatial growth of the metropolitan region of Recife occurred in both extensive and intensive ways [
26]. The extensive attribute is due to the extension of its “urbanizable” areas, and the intensive is because of the vertical densification along with the overload of irregular settlements. Regarding the simultaneous occurrence of these two processes, it is stated that “The spatial structure of Recife does not fit into a pre-defined model, but composes a hybrid form, sometimes with characteristics of a compact city, sometimes with characteristics of a diffuse city” [
27].
Both the districts of Boa Viagem and Pina, located on the coastline, represent the greatest expression of intensive (vertical) urban growth in Recife: initially occupied by fisherman settlements, these districts have changed into a summer resort from the 1920s onwards, and a few decades later were consolidated as a new commercial and business center in the city.
Verticalization also impacted another area of the city, further inland, located on the left bank of the Capibaribe River, which is the main river that runs through Recife. However, unlike the coastal districts, this area was subject to urban regulations through Law No. 16,719 (popularly known as the “Twelve Neighborhoods’ Law”), which aimed to preserve the area’s landscape by controlling the height of new buildings. The localized and partial nature of this law, only covers 12 of the 94 districts, corresponding to 4% of the physical area of the city (Nunes, 2017). Additionally, it caters to the demand of a portion of the population composed of residents with high economic power.
Currently, Recife is divided into two main zones by Law No. 17,511, 29 December 2008. The Built Environment Zone (BEZ) predominates with built-up surfaces of the city, while the Natural Environment Zone (NEZ) is characterized by protected areas mainly covered by water bodies and vegetation. There are three more special zones in these main zones (by Law No. 17,511, 29 December). The first one is the Special Zone of Social Interest (SZSI), which is specifically designed to cater to areas of high socio-environmental vulnerability. The second is the Special Zone of Historical Preservation (SZHP), which is dedicated to preserving the city’s rich history and culture. This zone contains areas and buildings of significant historical interest that must be protected and preserved for future generations. The third zone is the Special Zone of Specific Guidelines (SZSG), which marks commercial centers of the city. This zone is essential for the city’s economic growth and identifies the areas of businesses development.
Recife has undergone significant transformation due to urban expansion, which has followed the metropolization model adopted by many Brazilian cities. As a result, its urban surface is now mostly artificially impermeable, with the formation of urban canyon structures. This structure has been identified by experts as the main local agent in the formation of the thermal anomaly associated with the UHI. This growth led to the formation of the urban thermal field, which has had a significant impact on the local climate.
5. Urban Heat in Recife: Review of Different Approaches and Findings
Urban climate studies in Northeast Brazil, particularly in Recife, have been prominent since 2000 [
28]. This year also marks the beginning of the modern period of UHI studies worldwide [
29]. However, gaining a detailed understanding of urban heat in Recife remains a challenge due to the high spatial variability of both air and surface temperatures, coupled with a limited number of public data collection stations. The following chapters will delve into the primary sources of data acquisition, the challenges and obstacles in obtaining them, as well as provide an overview of the main results achieved thus far.
5.1. Urban Heat Data Acquisition in Recife
Recife has two main public institutes that collect thermo-hygrometric data from meteorological stations. The National Institute of Meteorology (Instituto Nacional de Meteorologia, INMET) has two time series. The first one is related to a conventional station (code 82900) and the second to an automatic station (code A301) both are interrupted due to technical problems. The Pernambuco Agency of Water and Climate (Agencia Pernambucana de Águas e Clima, APAC) also provides thermo-hygrometric data for Recife available from the meteorological station code 1137. In general, the number of thermo-hygrometric data points in Recife is very scarce compared to the pluviometric ones. The National Center for Natural Disaster Monitoring and Alerts (Centro Nacional de Monitoramento e Alertas de Desastres Naturais, Cemaden) has been expanding its network of pluviometric stations and currently has 17 points of observation in Recife. It is important to note that the asymmetry between pluviometric and thermo-hygrometric observations may have a negative impact on the comprehension of local climatic effects and their significance for risk management.
The use of multispectral satellite images is more suitable to research surface properties (such as UHIsup), although it is possible to estimate atmospheric heat information from these images, such as thermodynamic parameters, this process demands complex calculations [
30,
31,
32,
33]. Multispectral images are suitable for this purpose by using the combination of spectral channels to highlight specific properties of surface coverage and also to offer measurements of shortwave infrared radiation, which can be converted into surface temperature data. The widely used Landsat and Sentinel missions, with spatial resolutions ranging from 30 to 12 m, are adequate for spatial analysis at the urban scale. However, the disadvantage of using them in Recife, as well as in other urban areas along the northeast coast of Brazil, is the high cloud cover, which often renders the image unusable.
Climate reanalyses also provide useful data for urban heat studies, as they combine climate data from various sources. They have a much lower spatial resolution compared to multispectral images, ranging from tens to hundreds of kilometers, making them more suitable for larger study areas. Both satellite images and reanalyses data are built in raster format, which distributes the information in a continuous grid, facilitating spatial analysis processes in GIS. As for the use of raster data for landscape analysis, the Pernambuco Tridimensional Program (Programa Pernambuco Tridimensional—PE3D) provides photogrammetric mapping for the entire state of Pernambuco, derived from high-resolution laser profiling, allowing the generation of digital elevation models and high-resolution images (0.50 m), however, these data refer to the year 2013.
Considering that the urban landscape is also shaped by cultural factors, data from the demographic census, provided by the Brazilian Institute of Geography and Statistics (Instituto Brasileiro de Geografia e Estatística, IBGE), can play a crucial role in understanding both land use and the socioeconomic characteristics of the population. This data can offer valuable support in various ways, such as mapping land use patterns that contribute to urban heat issues and identifying groups socially vulnerable to urban heat, including the elderly, children, and individuals with physical comorbidities. By incorporating this demographic information, researchers and policymakers gain a more comprehensive understanding of the complex interactions between urban development, social factors, and the challenges posed by urban heat.
5.2. Main Urban Heat Findings and Public Interventions in Recife
The historical meteorological data series from INMET, spanning from the 1960s to 2020 for Recife, were analyzed [
34]. Concerning the thermodynamic variables, these authors revealed a trend of increasing annual maximum (Tmax) and minimum (Tmin) temperatures, along with a decrease in annual relative humidity (Ur). Tmax accumulated an upward rate of 0.23 °C per decade, and Tmin exhibited an increase of 0.13 °C per decade, indicating a trend to warmer nights. Ur showed a decreasing trend in all months of the year, with a reduction of 0.5% per decade. The summer and autumn seasons experienced more pronounced declines, particularly noteworthy is the month of May, which exhibited a reduction of 1.06% per decade. Concerning the probability density of extreme temperature values spanning the period from 1961 to 2019, a likelihood of elevation in both Tmax and Tmin values were detected [
34] (
Figure 2). The probability curves show that temperature anomalies in Recife are becoming more pronounced and more likely, resulting in an increased probability of heat waves. This is indicated by the flattening of the peaks and the broadening of the bases.
Satellite images were employed previously to observe and discuss various thermodynamic properties within the urban grid of Recife over the years. Spatial patterns of radiation variables together with daytime Landsat-5 TM images spanning from 1984 to 2007 were positioned [
35]. The Surface Energy Balance Algorithms for Land (SEBAL) model on Landsat-5 TM images (
Figure 3) was applied to analyze urban heat in correlation with the city’s urban surface [
36,
37,
38,
39].
Concerning UHI analysis, the limited availability of further public data collection points for thermo-hygrometric observations throughout the urban area of Recife means research studies often establish their own observation network, typically through the installation of thermo-hygrometric sensors. However, the number of sensors is still too few to capture the city’s landscape diversity, posing a challenge for selecting representative research locations.
The urban heat island (UHI) effect was analyzed using seven thermo-hygrometers placed in distinct landscape settings in the year 2018 [
42]. These authors identified two representative days for the UHI analysis during the study year (
Figure 4). One was 12 June 2012, corresponding to the rainy season, and the other was December 27, for the dry season. As the UHI phenomenon is primarily nocturnal, it was shown that during both periods, the highest UHI intensities in Recife occurred after sunset, specially between 2:00 and 3:00 a.m.
Due to its tropical nature, there are minimal variations in sunrise and sunset times in Recife throughout the year, (around 5:15 both a.m. and p.m., respectively). The daytime period had a milder UHI effect, with the presence of cool islands at certain times, particularly in the sensor located near the coastal area (TH03). This sensor stands out for displaying the greatest UHI amplitude among the others. Its proximity to the coastline allows constant oceanic winds. However, the coastline is the most verticalized in the city, as discussed in the previous chapter, resulting in more intense UHI effects during the nighttime, surpassing other points including the one located in the city center (TH04).
The urban landscape’s influence on the UHI effect in Recife was discussed by mapping the landscape using multispectral images from the Landsat mission and three-dimensional data from the PE3D project [
42]. This yielded continuous UHI map classes across the city. Topography, built density, vegetation mass, ground cover, and water bodies of Recife were mapped and overlaid onto the city’s urban zoning, aiming to define climatic zones as a tool to support urban planning. This overlay resulted in a climatic zone map (
Figure 5), identifying fourteen microclimates within three macrozones [
43].
The main characteristics of these zones include the greater influence of winds in the coastal macrozone and in the leeward hill areas, as well as in the unoccupied regions, constituting the classes of moderate amelioration climates [
43]. The plain and coastal macrozones, with higher built density, verticalization, and limited vegetation presence, exhibit the most significant heat accumulation impacts. There is a possibility for microclimates with heat accumulation zones to expand due to urban practices favored by the real estate market and allowed by regulations.
Beyond the physical parameters of the landscape, there has been a growing effort in recent years to understand the relationship between urban climate and society. These efforts go beyond the analysis of human comfort, focusing on the link between climate and the spread of epidemics, as well as the understanding of socio-spatial vulnerability to urban climate. Socio-spatial inequalities in Recife result in the segregation of the poorest population in unhealthy areas, and urban heat is recognized as one of the factors contributing to the proliferation of diseases and epidemics within the city.
Surface temperature were estimated from Landsat-8 satellite imagery by the use of [
44] air temperature and relative humidity data from five thermohydrometers, correlating them with demographic data and dengue notifications in Recife. Also, air temperature data from five thermohydrometers were correlated with data on precipitation and notifications of Dengue, Zika, and Chikungunya in Recife. This exposed the contribution of low thermal amplitude, high temperatures, and relative humidity in the formation of a favorable environment for the reproduction of arboviral vectors.
The impact of UHI in Recife was explained within the context of vulnerability analysis and its three components: exposure, sensitivity, and adaptive capacity [
14]. This author mapped both UHI and the sociodemographic characteristics of the city, highlighting that the neighborhoods most exposed to UHI in Recife are not necessarily the most vulnerable to this phenomenon (
Figure 6).
This occurs because the highest UHI exposures primarily happen in the densely verticalized areas of the city, namely the downtown and the coastal areas, following the classical understanding that UHI is more intense as it approaches urban centers. However, these urban centers concentrate high real estate value areas, and therefore a population with greater economic power and higher adaptive capacity. Addressing UHI vulnerability in Recife revealed critical areas of the city that do not stand out in a solely physical mapping of UHI. Despite these areas having low UHI exposure, they exhibit high vulnerability to its impact due to being under significant social vulnerability, meaning low adaptive capacity.
Vulnerability analysis can also serve as an avenue for dialogue, bridging various scales of climate (climate variability and climate change) and linking climatic studies with urban planning. This is because it involves understanding the broader impact of climate within a larger context. The Municipality of Recife follows Law No. 18.011/2014 concerning sustainability policies and climate change mitigation. Within this law, a specific guideline stands out regarding addressing heat-related challenges: “The implementation of measures that prevent or reduce the formation of urban heat islands as a consequence of urbanization”. This guideline underscores the connection between urban heat islands (UHI) and the broader context of climate change mitigation.
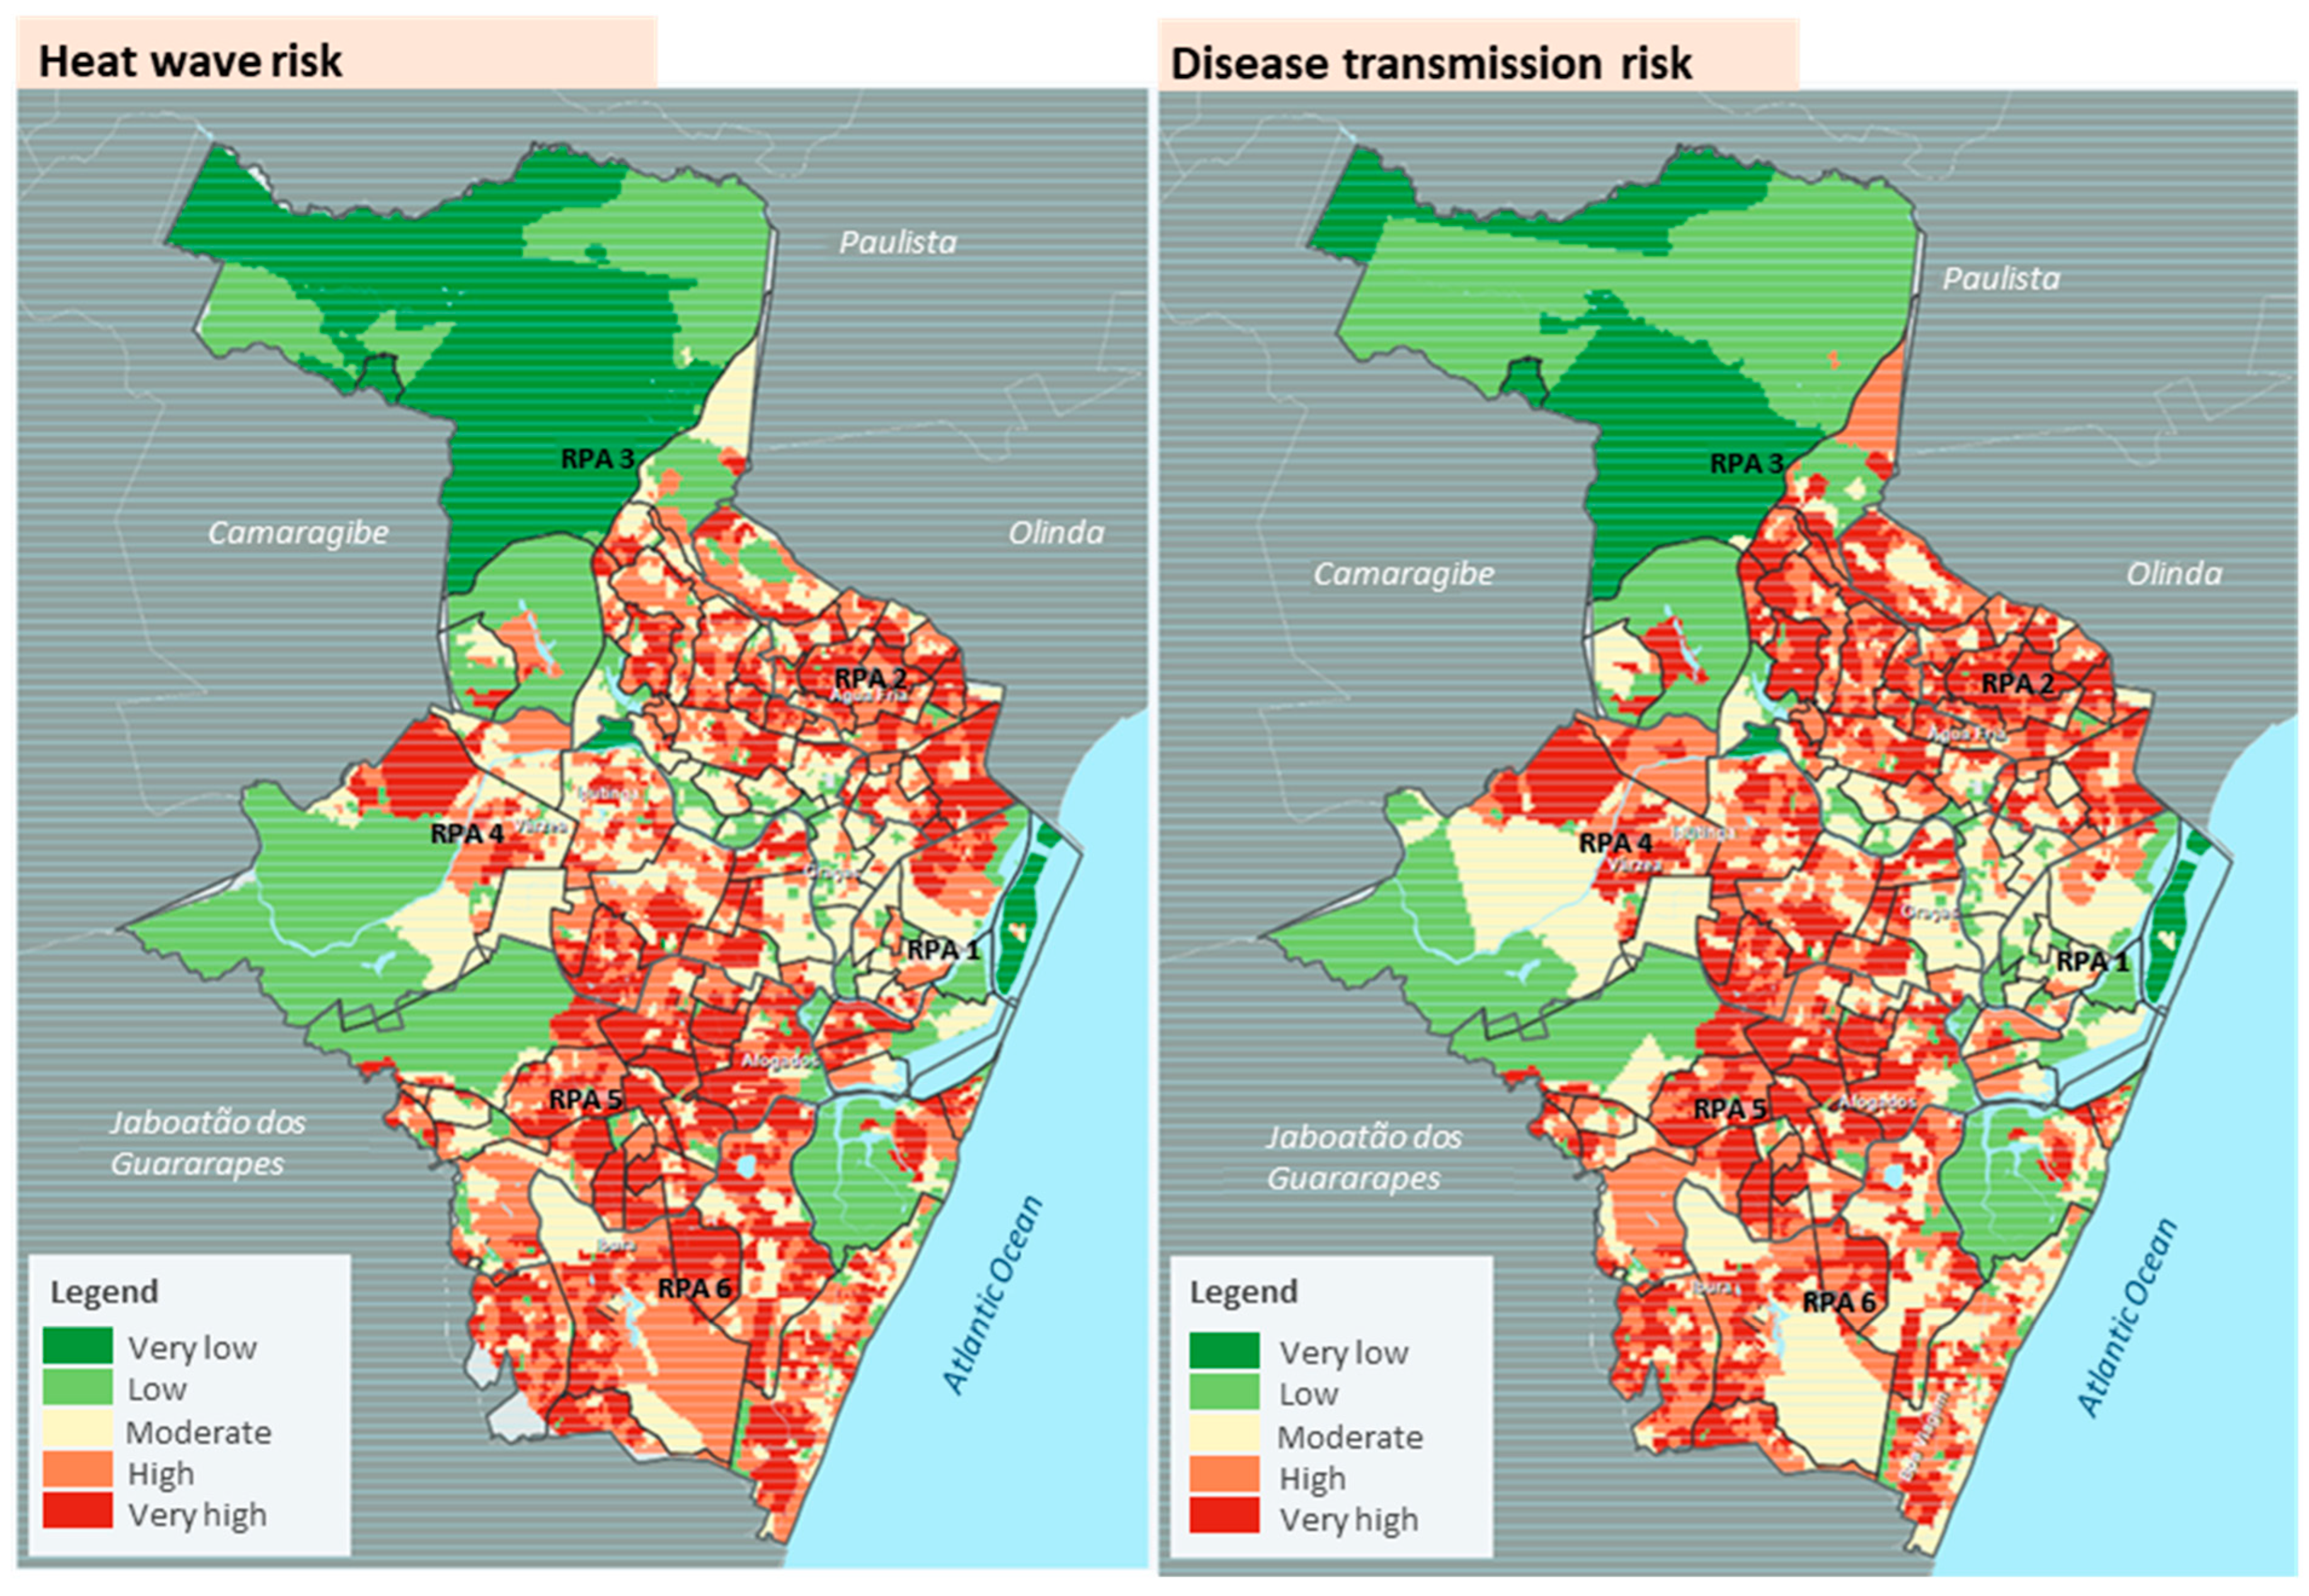
In addition to vulnerability analysis, risk analysis is also an effective tool in this regard. The climate change risk and vulnerability assessment in Recife was made by mapping various variables including the levels of risk associated with heatwaves [
41]. The study emphasizes a progressive upward trend in projected temperatures for the city. When comparing the heatwave risk map in Recife (
Figure 7) to the mapping of disease transmission risk due to climate change, also conducted by [
45], a spatial pattern similarity becomes evident. This underscores the need for comprehensive and integrated approaches to address the impacts of urban heat in Recife.
6. Current Efforts and Future Perspectives in Addressing Urban Heat in Recife
Urban heat studies in Recife have primarily centered on various aspects, including diurnal temporal analysis of surface radiation variable behavior, trends and variability of thermodynamic variables, physical characteristics of the UHI, its impacts on society, microclimate zoning, and the correlation between climatic variables and the occurrence of epidemics, including arboviruses. Concerning the observational infrastructure, the difficulty of implementing a network for observing atmospheric data throughout the urban fabric is not unique to Recife, but is prevalent in the context of countries within the Global South. Therefore, the overview of the main current initiatives and collaborations, as well as their prospects and future challenges, are presented in the following chapters [
46].
6.1. Ongoing Initiatives and Collaborations
In recent years, there has been a growing government concern regarding the understanding of climate impacts on Recife. The rains that occurred in May of the year 2022 [
47] prompted the creation of an integrated operations center (Recife Operations Center—ROC), aimed at encompassing all stages of crisis management processes, with immediate responses, particularly in emergency situations. The establishment of this center by the city Hall of Recife represents a significant stride in the integration of urban environmental information, yet it still needs further advancement, especially at the level of detail of microscale information.
Collaborations between research institutes and various levels of public administration are proving to be allies in overcoming this lack of observational infrastructure. Currently, Recife is home to the Porto Digital, the largest urban and open technology park in Brazil, which houses companies engaged in various technology, communication, and creative economy services, with a focus on shaping the future of cities through prototyping based on digital manufacturing and the Internet of Things (IoT). Alongside Porto Digital, the City of Recife collaborates with the Aries agency, which is actively engaged with public administration as a non-profit, non-partisan social innovation and strategy organization.
Among its objectives, Aries aims to develop technological solutions to urban challenges in Recife, including climate change. In this context, the CITinova project [
48], developed by Aries, has the objective of supporting urban planning to address climate change. Regarding the urban heat, this project aims to attend to the lack of microscale data collection points throughout the city, in collaboration with Porto Digital, the Recife municipality, the state government, the federal government, and the UNEP—UN Environment Programme. Within the scope of this project, there is the implementation of a network of microclimate monitoring stations and a sectoral plan for climate change adaptation.
The CITinova project currently has three pilot stations being implemented and fine-tuned as a precursor to the deployment of additional stations across the city. In terms of data integration and accessibility, this project aims to develop a collaborative online platform to converge data from various sources into a single interface, thereby facilitating research and planning access. The National Service for Industrial Apprenticeship (Serviço Nacional de Aprendizado Industrial, SENAI) provides technical assistance to develop and setup the sensors.
At the end of this project, the operational responsibility for both the microstations and the data availability platform will be transferred to the Pernambuco Water and Climate Agency (Agência Pernambucana de Águas e Clima, APAC). Furthermore, the extreme rains that occurred in Recife between the months of May and June in the year 2022 [
47] also spurred the launch of the FACEPE Call for Proposals No. 28/2022, aiming to support research addressing social inequalities and climate change in Recife. This initiative selected a project to establish an environmental monitoring network, involving the construction of 60 low-cost stations for measuring temperature, humidity, CO
2, CO, PM 2.5, NO
2, atmospheric pressure, and luminosity. This project is being developed by the Federal Institute of Education, Science, and Technology of Pernambuco (Instituto Federal de Educação, Ciências e Tecnologia de Pernambuco, IFPE) from December 2022 to July 2024.
6.2. Future Strategies and Challenges
From the ongoing initiatives and collaborations presented, Recife has the potential to overcome the lack of microscale data collection throughout its urban fabric in the short term. In addition to data collection, Recife has two guiding plans for its future strategies and challenges: the ‘Recife 500 Years Plan’ [
49] and the ‘Local Climate Action Plan (LCAP)’ [
50].
The ‘Recife 500 Years Plan’ was launched in 2018 by Aries in partnership with the City of Recife. It supports initiatives aimed at increasing the city’s resilience to long-term climate change, up to the year 2047 when Recife will celebrate its 500th anniversary. In addition to the ‘Recife 500 Years Plan’, the LCAP was launched in 2020 by ICLEI, an international network focused on sustainable urban development, in partnership with the City of Recife. It outlines strategies for how Recife will align its actions to address climate change, in accordance with the Paris Agreement and the Sustainable Development Goals (SDGs). Specific strategies within the LCAP and the ‘Recife 500 Years Plan’ regarding addressing urban heat in Recife include a set of measures focused on urban resilience. These measures involve increasing the percentage of permeable surfaces, conserving green areas, and ensuring public access to these areas.
In addition to the strategies outlined in these plans, there is the challenge of expanding the proposed programs to the other municipalities in the metropolitan region of Recife. It is important to note that Recife serves as the core of a metropolitan region encompassing more than 13 municipalities, with a total population of approximately 4 million residents. The execution of urban heat studies needs to encompass a wide range of scales, from microclimate to climate change, enhancing their applicability in addressing the societal impacts of climate change. To achieve this, it is imperative to expand the data collection network and strategic plans to the other municipalities within its metropolitan area.
7. Conclusions
This article aims to discuss the main findings related to urban heat in Recife, encompassing both conceptual aspects and their practical implications, and subsequently offer valuable theoretical and methodological insights for prospective investigations. The city of Recife is discussed due to its regional relevance in the northeast region of Brazil, as the core of the major metropolitan area of this region. Also, despite Recife being listed as one of the most vulnerable cities to climatic impact worldwide, the full extent of damages from its urban heat is not easily noticed.
The growing need for developing integrative approaches was highlighted when discussing the main concepts and approaches related to urban heat. These approaches should encompass both the physical and social characteristics of the urban landscape, including vulnerability to heat assessment, as well as the interactions between climate phenomena at the micro/local scale, such as the urban heat island, and the global-scale phenomenon of climate change.
Despite the challenges in implementing a microscale observation network, there has been a growing trend in urban climate studies in Recife since the early 2000s. These studies explore urban heat across various scales, utilizing on-site sensors as well as other data sources such as satellite data, reanalysis, laser scanning, and more. It was shown that there is currently an asymmetry in the observation of microscale climatic variables in Recife, where only precipitation variables are detailed. However, there have been new projects and collaborations striving to address this gap through the development of microscale monitoring stations.
It was explained that urban heat studies in Recife have mainly focused on describing the diurnal and temporal analysis of surface radiation and thermodynamic variables; on analyzing the physical characteristics of the UHI and its impacts on society; on defining microclimate zoning; and the correlation between climatic variables and the occurrence of epidemics, including arboviruses. Currently, there is an effort among key stakeholders to both implement a network for collecting microclimatic data to refine observations in Recife and to develop long-term strategies for climate solutions. However, this effort needs to be extended to the other cities in the metropolitan region of Recife.


