Article

Study of Haze Boundary Layer Features Based on Multi-Source Data in Shihezi, China

1
Shihezi Meteorological Bureau, Shihezi 832000, China
2
School of Electrical & Electronic Engineering, Shandong University of Technology, Zibo 255000, China
3
Urumqi Meteorological Satellite Ground Station, Urumqi 830000, China
*
Authors to whom correspondence should be addressed.
Atmosphere 2023, 14(10), 1587; https://doi.org/10.3390/atmos14101587
Submission received: 22 September 2023 / Revised: 11 October 2023 / Accepted: 16 October 2023 / Published: 20 October 2023
(This article belongs to the Section Air Quality)

Abstract

:
To reveal the temporal–spatial characteristics of air pollution during winter haze events on the north slope of the Tianshan mountains, a combined detection experiment was conducted in this study using a tethered airship, Lidar, and ground monitors from December 2019 to January 2020 in Shihezi. First, the boundary layer height (BLH) was calculated using the temperature, relative humidity, wind speed, and atmospheric pressure detected by the tethered airship; the BLHs were mainly distributed from 200 m to 450 m, with the visibility (V) mainly less than 3000 m. Subsequently, the temporal–spatial characteristics of the atmospheric pollutants were analyzed. The results show that during winter haze events, the temperature was mainly between −5 °C and −15 °C, and the relative humidity was between 60% and 75%, with a wind speed of less than 2 m/s. Moreover, the temperature difference ( Δ T) within the BLH was basically greater than 0, except from 14:00 to 18:00, and a larger Δ T corresponded to a lower V and more severe pollution, which indicates that the sensible heat flux is very weak, and the atmospheric structure is very stable. Meanwhile, the PM2.5 and PM10 were mainly concentrated between 130 and 180 μ g · m 3 and between 160 and 230 μ g · m 3 , respectively; the maximum PM2.5 and PM10 appeared at 11:00–13:00. Furthermore, the black carbon was distributed at 6–8 μ g · m 3 and decreased significantly around the BLH. Moreover, the extinction coefficient (EC) had a negative correlation with the V, and the maximum of the EC was 9 km−1 when V was the minimum (less than 1500 m) from 10:00 to 11:00. Finally, the relationship between V and the air quality index (AQI) is constructed as A Q I = 456 e 0.00061 V . The conclusions obtained provide a reference for haze elimination and environmental governance of the locale.

1. Introduction

The Tianshan Mountains (TMs) are the largest independent east–west trending mountain chain and exert a crucial impact on the climate and air pollutant distributions in the center of Asia [1]. Moreover, the cities (e.g., Urumqi, Shihezi, Changji) on the north slope of the TMs are important economic belts of the “Belt and Road Initiative” [2], and heavy air pollution occurs frequently in these cities with the development of the economy and the topographic features [3]. The heavy air pollution is mainly in the form of brown haze events in winter, which decrease the visibility and regional air quality [4,5,6,7,8]. Furthermore, air pollution not only destroys the environment and radiation budget [9] but also causes serious health problems, which cause over 3 million premature deaths every year globally [10,11,12]. Therefore, the improvement of the air quality in this area plays an important role in its economic and social development.
The occurrence of haze events is connected to the accumulation of particulate matter (PM), which may be attributed to many factors (e.g., stable weather condition, atmospheric chemistry reaction) [13,14,15,16]. Haze events are also closely related to atmospheric boundary layer (BL) processes, as the BL reflects the mixing volume and the turbulent characteristics of a low-level atmosphere [14,17,18]. The structure of the BL and turbulent layers formed within the BL are investigated worldwide using a variety of methods and sensors, including the reconstruction of vertical turbulence profiles based on the analysis of the light wave field [19,20]. The development of the boundary layer height (BLH) has a great influence on the heat, water vapor, aerosol, and free atmosphere; the weak wind, a low heat flux, and a stable BL are favorable for the development of haze events. In contrast, a higher BLH and stronger winds reduce the frequency of haze events [21,22,23].
Many previous studies have also focused on the chemical characteristics, the spatial distribution of fine PMs, and the temporal evolution of the particles [24,25,26,27]. Residential coal burning emissions and the generated PMs are the primary factors contributing to winter haze formation in China [28]. The radiation effects of a higher concentration of black carbon (BC) can strengthen the inversion above the BL, which significantly restrains the growth of the BL. A lower BL leads to the occurrence of persistent haze events [29,30]. In addition, Table 1 shows the sources of different pollutants based on the previous studies. However, due to the lack of multi-component aerosol observations (especially PM10, PM2.5, and BC), there have been few published reports on the high-resolution temporal–spatial characteristics of atmospheric pollutants during haze events over the TMs [31].
Tethered airships can directly derive the vertical profiles of the concentrations of PM10, PM2.5, BC, and meteorological elements. Compared to aircraft that are more effective at obtaining information at a high level with a low resolution due to a high speed [36,37], tethered airships enable the high-resolution analysis of the characteristics of a low-level atmosphere. Moreover, compared to a meteorological tower with a limited observation height (<350 m) [38], tethered airships can obtain data at a height up to 2 km, which is vital for humans and where the PM and BC are concentrated [39].
To reveal the temporal–spatial characteristics of atmospheric pollutants during haze events on the north slope of the TMs, a combined detection experiment was conducted in this study using a tethered airship, Lidar, and ground monitors from December 2019 to January 2020 in Shihezi. The further sections in this paper are as follows. Section 2 introduces the instruments and data. Section 3 describes the calculation method for the BLH using the tethered airship data. Section 4 analyzes the spatial–temporal characteristics of the meteorological factors within the BL during haze events. Section 5 analyzes the spatial–temporal characteristics of the pollutants, including BC, particulate matter with a diameter < 2.5 μ m   ( PM 2.5 ), particulate matter with a diameter < 10 μ m   ( PM 10 ), the extinction coefficient, and gaseous pollutants (CO, NO2, and SO2) during haze events. Finally, the study discusses the pollution sources at different times.

2. Materials and Methods

2.1. Detection Site and Equipment

In this study, the detection site is Shihezi (44.31° N, 86.06° E; Figure 1a), with an average altitude of 450 m, which is the core city of the Chinese “Belt and Road Initiative”. Moreover, the city is located on the north slope of the Tianshan Mountains (TMs) (Figure 1a), with the typical meteorological characteristics of the north slope of the TMs. Furthermore, due to the influence of terrain type and meteorological factors, severe haze events frequently occur in this area in winter.
The combined detection experiment using the tethered airship (Figure 1b), the Lidar system (Figure 1c), and ground observation instruments was conducted from December 2019 to January 2020 in Shihezi. Moreover, the number of measurements carried out using the airship was 70, and the distribution of detection time was concentrated in 06:00–23:00 from 27 December 2019 to 14 January 2020 (as shown in Table 2).
A ΠS111 meteorological sounding instrument, an AE-51 micro aethalometer, and aerosol particle spectrometers were installed in the tethered airship (Figure 1b). The ΠS111 meteorological sounding instrument is produced by the company Vaisala, based in Finland, and can effectively detect temperature, relative humidity (RH), air pressure, and horizontal wind at different heights, and its time and vertical resolutions are 2 s and 1 m, respectively. The AE-51 micro aethalometer is produced by the company AethLabs, based in the US, and measures the mass concentration of black carbon (BC) by measuring the attenuation of the transmitting 880 nm wave, and its time and vertical resolutions are 1 s and 5 m, respectively. The aerosol particle spectrometer is produced by the company Grimm, based in Germany, and can measure aerosol particles with a diameter in the range of 0.25–32 μ m , and its time resolution is 6 s. Furthermore, the aerosol particle spectrometer was used to detect PM2.5 and PM10 in this study.
The Lidar system is the GBQ L-01 atmospheric aerosol Lidar (Figure 1c), which is produced by Hefei Zhongbo Technology Company in China. The Lidar system emits a 532 nm laser, and the main parameters are shown in Table 3. Furthermore, the radar can detect the backscattered, extinction coefficient of atmospheric aerosol. The Lidar system operates very stably for 24 h nonstop and generates one set of data per minute.
The ground observation instruments include a visibility meter FD12P, environmental monitoring instruments (e.g., CO, NO2, and SO2), and meteorological detectors (e.g., temperature, RH, and wind). The visibility meter FD12P is produced by the company Vaisala, based in Finland, and measures the horizontal visibility per minute.

2.2. Data

According to Chinese meteorological observation rules [11], haze occurs when there is a low-level RH of <75%, and the haze can be divided into four levels based on visibility (V): severe haze with the V < 2.0 km, moderate haze with the V between 2.0 and 3.0 km, mild haze with the V between 3.0 and 5.0 km, and slight haze with the V between 5.0 and 10 km. Based on these rules, the observers recorded 51 haze days from December 2019 to January 2020, including 6 days of moderate pollution ( 150 AQI < 200 ), 30 days of heavy pollution ( 200 AQI < 300 ), and 5 days of severe pollution ( AQI 300 ).
In this study, the temporal–spatial characteristics of air pollution during haze were analyzed by using data including meteorological elements, with PM10, PM2.5, and BC detected by the tethered airship; the extinction coefficient detected by the Lidar system; the temperature, RH, and wind speed obtained by the ground observation station; and CO, NO2, and SO2 monitored by the environmental monitoring instrument.

2.3. The Method for Determining Boundary Layer Height

Based on previous studies, there are many different methods of determining boundary layer height (BLH). Vogelezang (1996) proposed the bulk Richardson number (Ri) to determine BLH, and Ri was widely used for determining the diurnal BLH [40,41]. However, Ri is unable to accurately determine the nocturnal BLH [42]. Moreover, the maximum gradient of the potential temperature and specific humidity (MGPS) is another widely used method for determining BLH [43].
Using the meteorological elements detected by the tethered airship, this study uses two different methods to determine the diurnal BLH and the nocturnal BLH, respectively. When the time is between 10:00 and 20:00 BT, the Ri method is used to determine the BLH. However, when the time is between 20:01 and 09:59 BT the next day, the MGPS method is used to determine the BLH. The main steps are as follows:
First, the temperature (T), RH, and air pressure (p) are used to calculate potential temperature (θ) and specific humidity (q). The equations are shown as Equations (1) and (2):
θ = T × p 0 p 0.286
q = ε × e / p 1 ε × e  
In Equation (1), p 0 is equal to 1000 hPa, T is the measured temperature (K), ε of 0.622 is the ratio of the molecular weight of water vapor to that of dry, and e represents the water vapor pressure, which can be calculated by Equation (3) using RH and saturated water vapor pressure e s :
e = RH × e s = 6.1078 × RH · exp 17.2694 T 273.16 T 35.86   T > 273.16 6.1078 × RH · exp 21.875 T 276.16 T 7.66   T < 273.16
Second, using the potential temperature (θ) and specific humidity (q), the virtual potential temperature ( θ v ) is calculated by Equation (4):
θ v = θ 1 + 0.608 q
Third, Ri is calculated by Equation (5) using θ v , horizontal wind speed, wind direction, and height (h). Moreover, in Equation (5), s represents the ground (or the height of the first detection layer), and v and u are components of the wind speeds. As the value of b u 2 is much smaller than the shear of horizontal wind, it is ignored in this study.
Ri h = g θ vs θ vh θ vs h h s u h u s 2 + v h v s 2 + b u 2
Fourth, ∆g is calculated by Equation (6) using θ and q. Moreover, h1 and h2 are the heights of the adjacent detection layer.
Δ g = | θ h 2 θ h 1 h 2 h 1 + q h 2 q h 1 h 2 h 1 | ,   h 2 > h 1
Finally, when the time period is 10:00–16:00 BT, according to the Ri method, the height corresponding Ri of 0.25 [44] is determined as the BLH. However, when the time period is 16:01–09:59 BT the next day, according to the MGPS method, the height corresponding to the maximum ∆g is determined as the BLH.
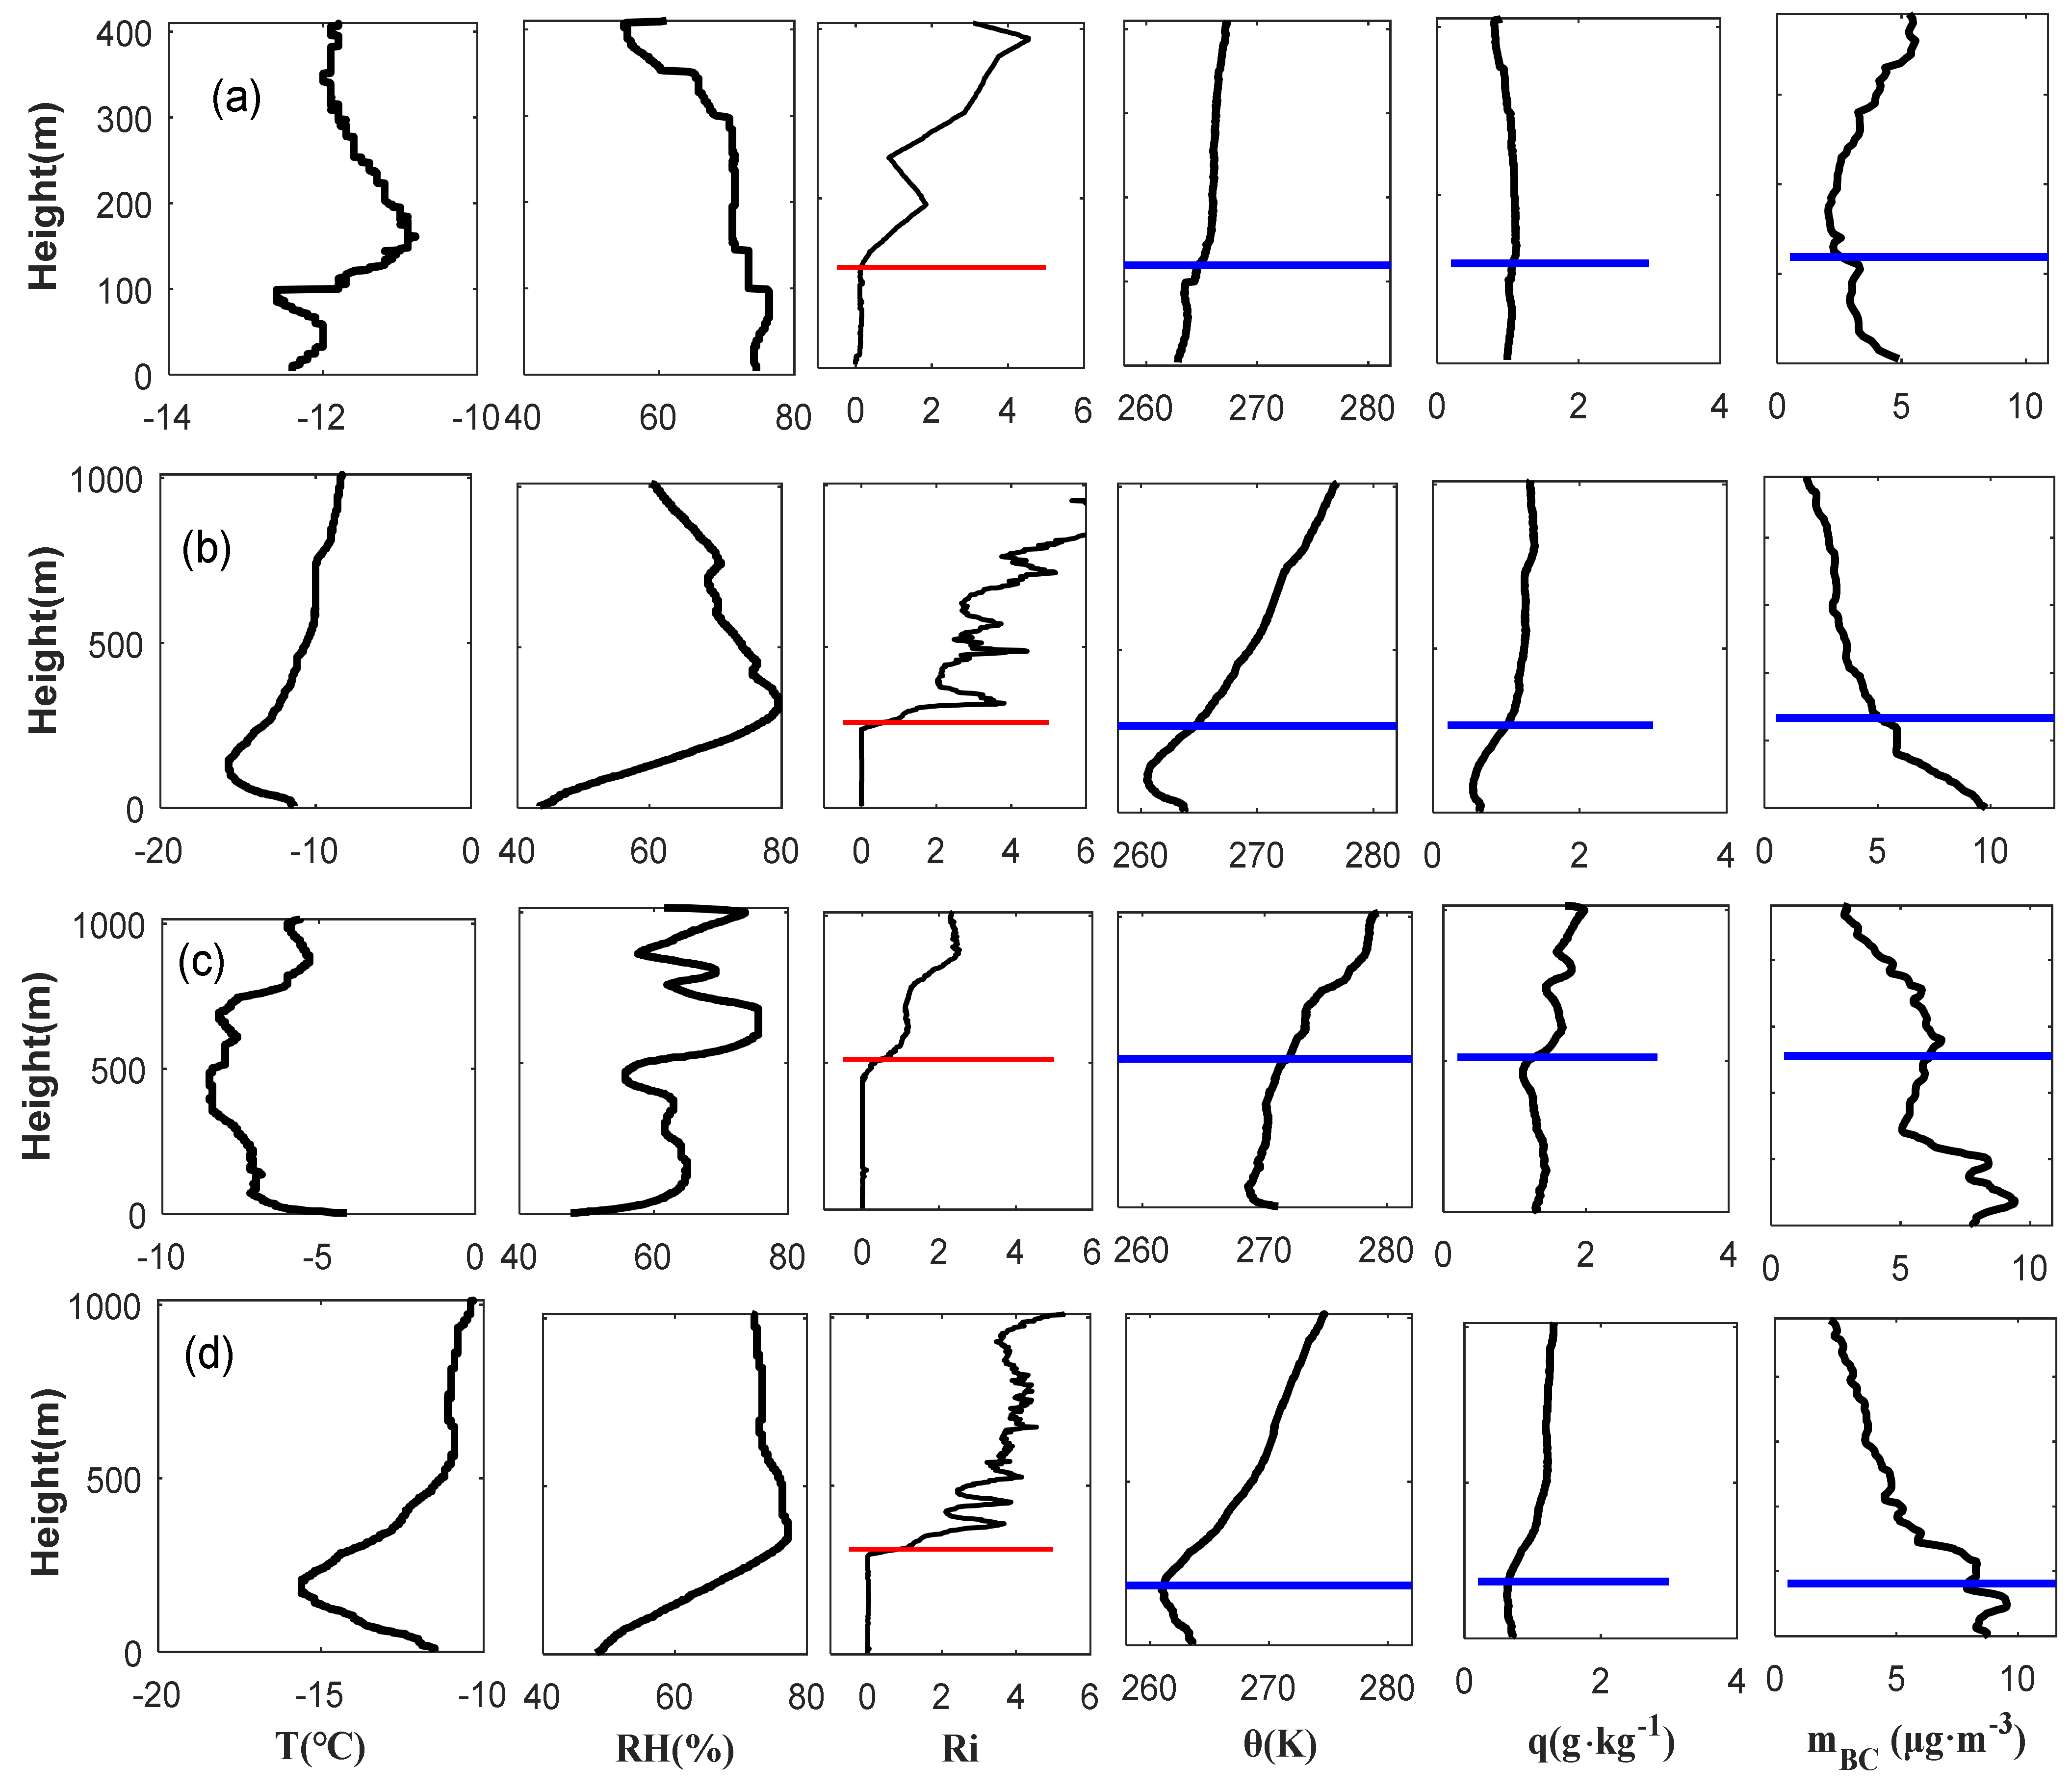
The haze events from 01:00 to 22:30 on 1 January 2020 were selected, and they determined the BLH (Figure 2). As shown in Figure 2, there is an obvious gradient change in potential temperature and specific humidity near the BLH. Moreover, the corresponding BC decreases significantly when the height of the BLH is higher, which is consistent with the structural characteristics of the BL. Hence, the BLH retrieved by this study is basically credible.

3. Results

3.1. Meteorological Characteristics

3.1.1. Characteristics of Ground Observations

Figure 3 shows the temporal distributions of ground temperature, ground relative RH, visibility, ground wind, and ground PM2.5 from 1 December 2019 to 31 January 2020. As Figure 3 shows, it can be inferred that the ground temperature (Figure 3a) is −12 °C–−3 °C, with the ground RH being between 60 and 80% (Figure 3a); moreover, the corresponding visibility (Figure 3b) is mainly less than 3000 m. Based on the meteorological observation rules, the haze events occurred frequently and lasted for a long time during this period. Furthermore, the wind speed on the ground (Figure 3c) was generally less than 1.5 m/s. Moreover, due to the blocking effect of the TMs on the strong convective airflow, it is not easy to dissipate the haze events, which leads to the maximum PM2.5 (Figure 3d) being greater than 340 μ g · m 3 . By comparing Figure 3b,d, it can be seen that the V is negatively correlated with PM2.5. Moreover, when the V is smaller, the PM2.5 is larger, with the pollution level being more serious; however, when the V is larger, the PM2.5 is smaller, with the air quality being better. During the detection period of the tethered airship (between the black lines in Figure 3), the V was mainly less than 2000 m, and the ground PM2.5 was greater than 150 μ g · m 3 , indicating that severe haze events occurred during this period.

3.1.2. Characteristics of Boundary Layer Height

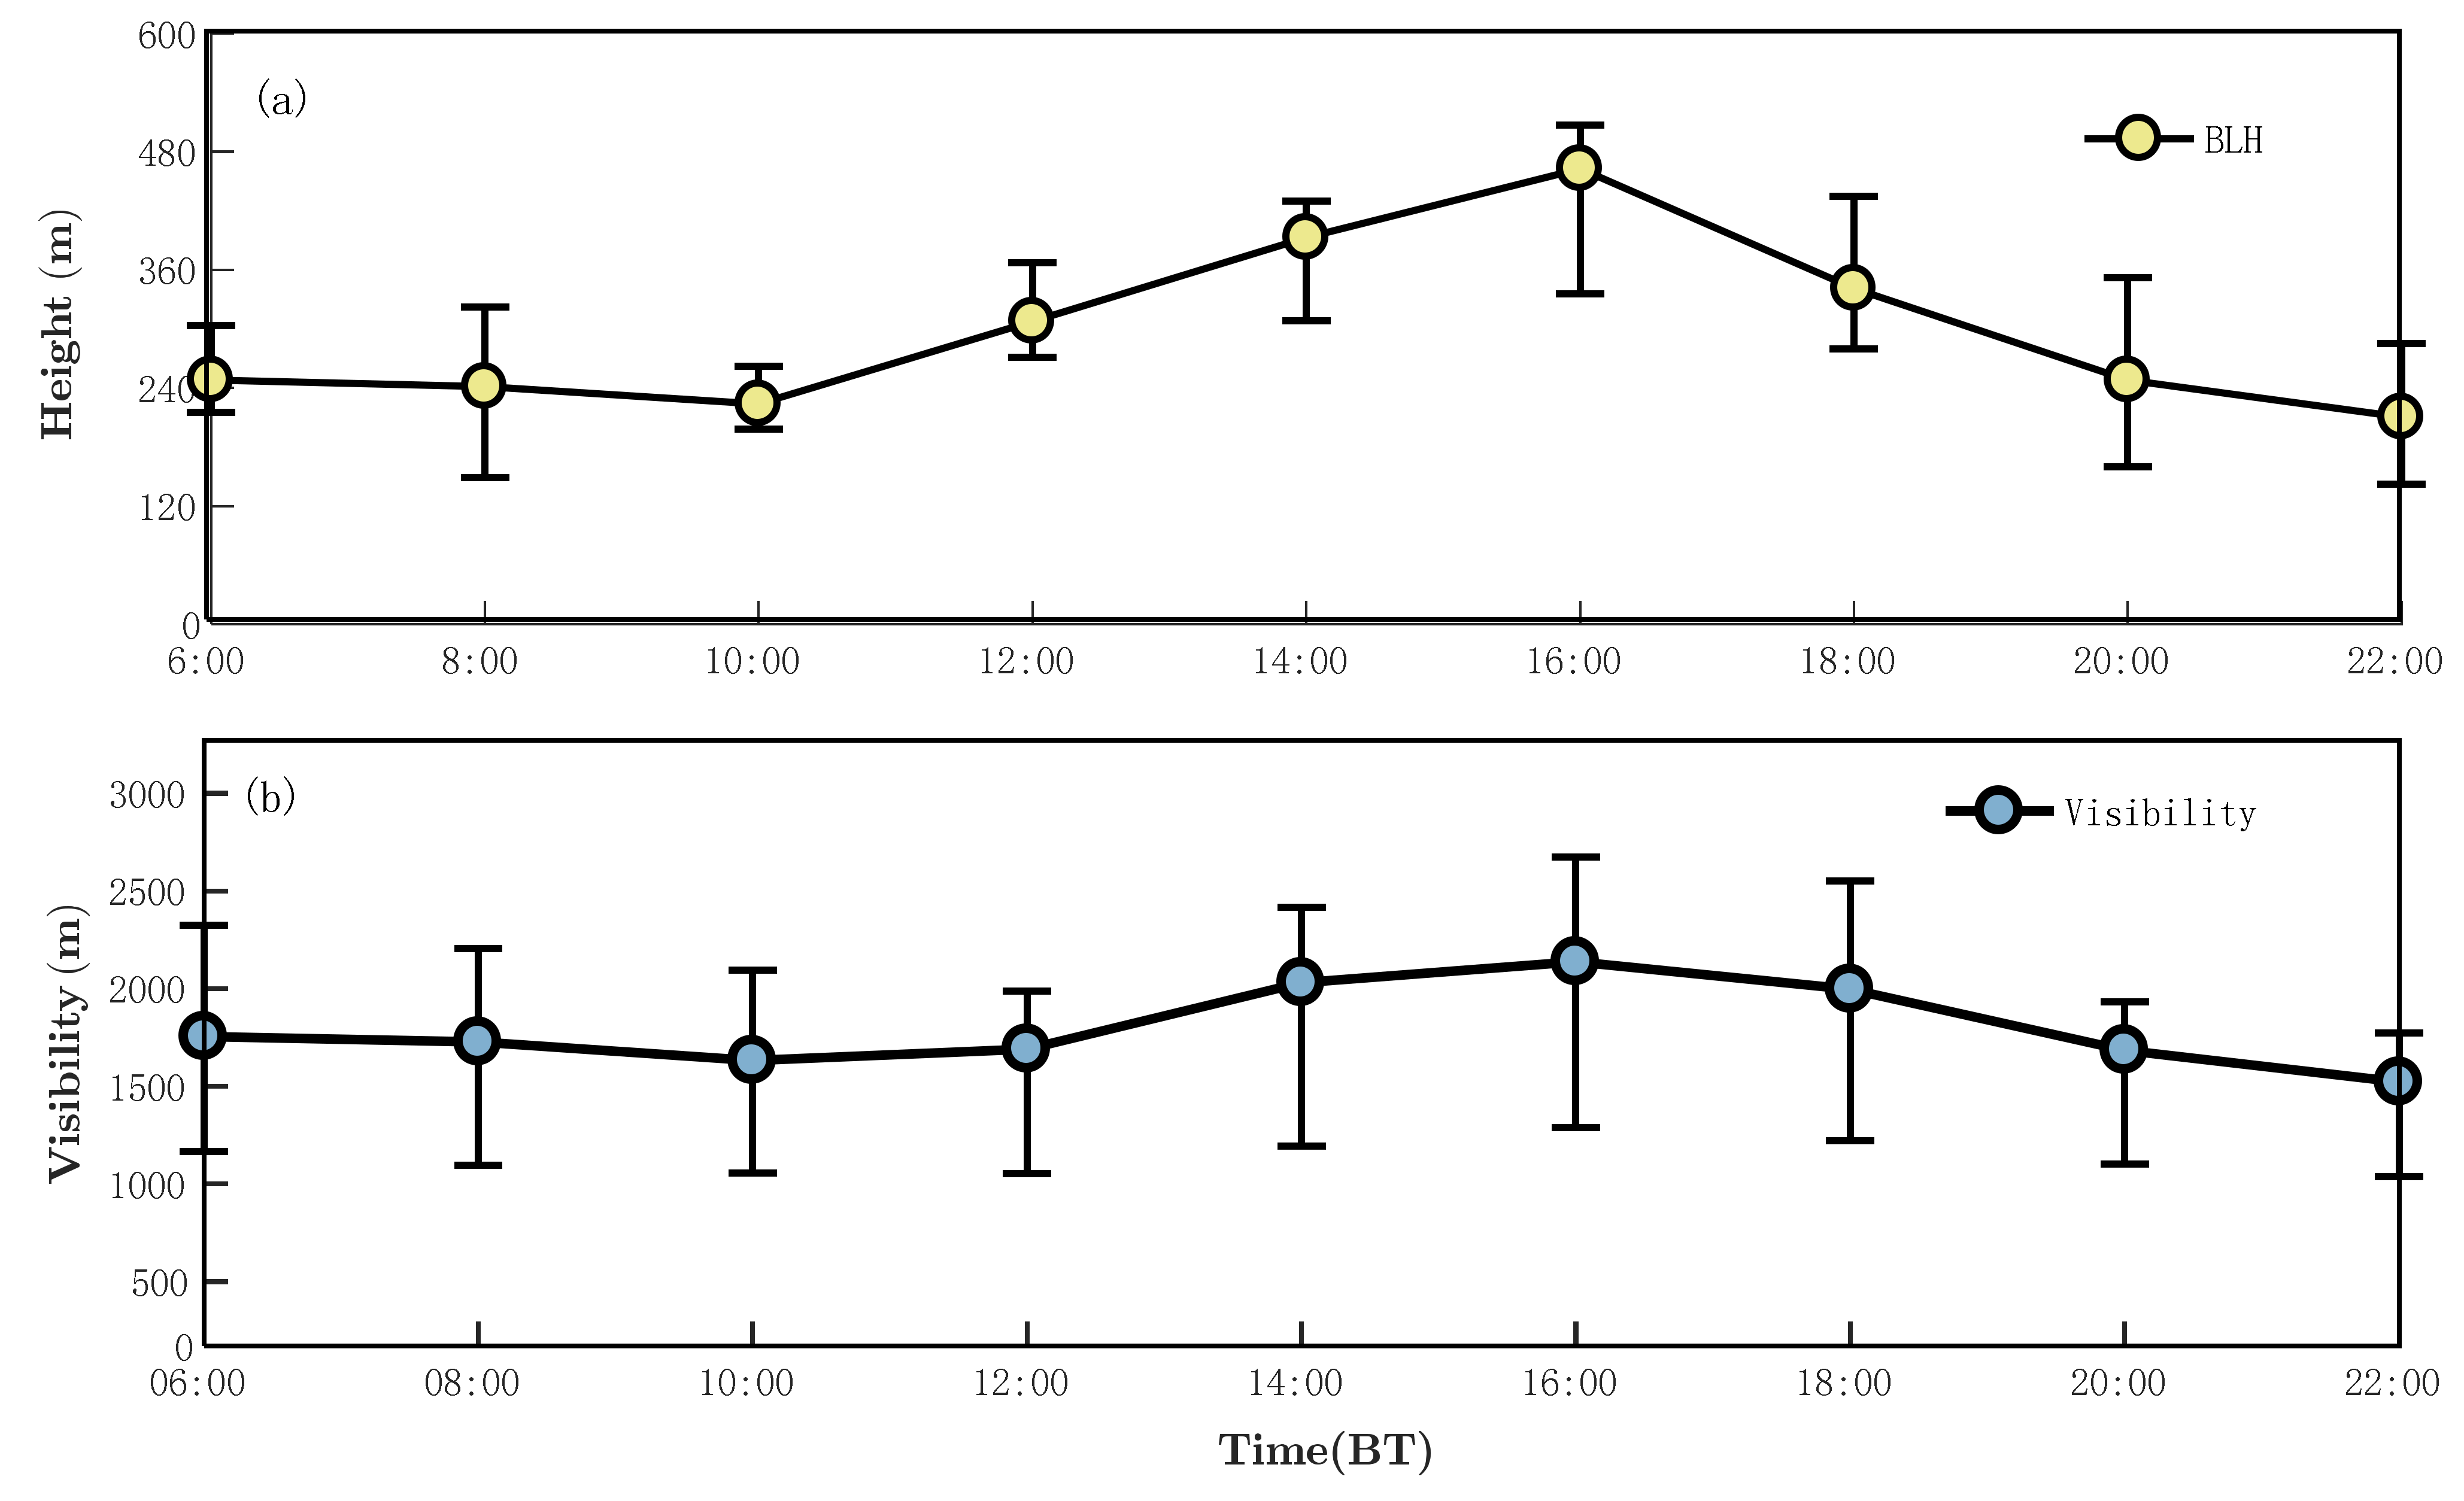
Figure 4 illustrates the temporal distribution of the average BLH and average V during the haze events in Shihezi, and the average BLH is very low, in the range of 150–480 m. Comparing Figure 4a,b, it can be seen that the average BLH has a positive correlation with V. Moreover, the higher average BLH corresponds to the better V, which is more conducive to the dissipation of haze events; however, the lower average BLH corresponds to the lower V, which is more conducive to the development of haze events.
As shown in Figure 4, in the evening (from 22:00 to 9:00 the next day), the average BLH is around 200 m with little change over time, which indicates that the atmospheric structure is very stable. Meanwhile, the average V is less than 2000 m, and the weather conditions are severe haze. When the sun starts to rise (after 10:00), the BLH gradually rises with time due to solar radiation. Subsequently, the corresponding BLH reaches its maximum (greater than 400 m) at 16:00; moreover, the average V is greater than 2000 m, and the weather conditions are moderate haze. However, the average BLH gradually decreases with the ground temperature after 18:00, and the BLH drops to about 200 m again at 20:00. The BL at night is the stable boundary layer, while the BL between 10:00 and 20:00 is the mixed layer, and the BLH at night is about 300 m less than that during daytime.
Overall, the BLH of the haze in Shihezi is mainly lower than 500 m, which is consistent with the results for severe haze in other cities in China (shown in Table 4). By analyzing the reasons, we found that this is due to the blocking effect of the TMs; the wind speed in the middle–low altitudes of this region is very low (shown in Figure 3); moreover, the temperature and RH in winter are relatively low, resulting in the stable atmospheric structure and difficulty in developing the BLH.

3.1.3. Temporal–Spatial Characteristics of Temperature

As the BLH during haze events on the north slope of the TMs is generally less than 450 m, the temporal distributions of the average temperature within the BLH (<450 m) and the average solar irradiance were obtained and are shown in Figure 5a. Figure 5 shows that the average temperature is mainly between −5 °C and −15 °C. When the time period is 06:00–08:00, the temperature is very low (<−12 °C) and the average solar irradiance is about 0/m2. Moreover, from 09:00 to 13:00, due to the sun rising and the average solar irradiance gradually increasing, the average temperature also gradually increases. Subsequently, when the time reaches noon (14:00–16:00), the solar irradiance reaches its maximum (Figure 5c), which leads to the corresponding average temperature also reaching its maximum ( 10 °C). However, after 17:00, the decreasing solar irradiance results in the temperature gradually decreasing. After 20:00, the temperature drops to −12 °C.
In order to further analyze the vertical heat characteristics, the average 100 m vertical temperature difference ( Δ T) was calculated by Equation (7), where h1 and h2 are two adjacent heights (h1 > h2) and correspond to the temperatures T h 1 and T h 2 at the same time. The temporal distribution of the Δ T is shown in Figure 5b, and the blue line is the average Δ T.
Δ T = T h 1 T h 2 / Δ h Δ h = h 1 h 2 / 100
As shown in Figure 5b, the Δ T is relatively small, with the range of −1 °C to 1 °C, and the average Δ T (blue line) is greater than 0 except for 14:00–18:00, which indicates that there is a temperature inversion layer in the low-level atmospheric layer. Moreover, the temperature inversion layer leads to a very stable atmospheric structure, which is conducive to the development of haze events and the accumulation of pollutants. However, when the time period is 14:00 to 18:00, due to solar radiation and ground heating, the average Δ T is larger than 0, which indicates that a mixed layer appears at the low-level atmospheric layer during this period; moreover, the mixed layer makes it easy for the dissipation of pollutants during this period.

3.1.4. Temporal–Spatial Characteristics of Relative Humidity

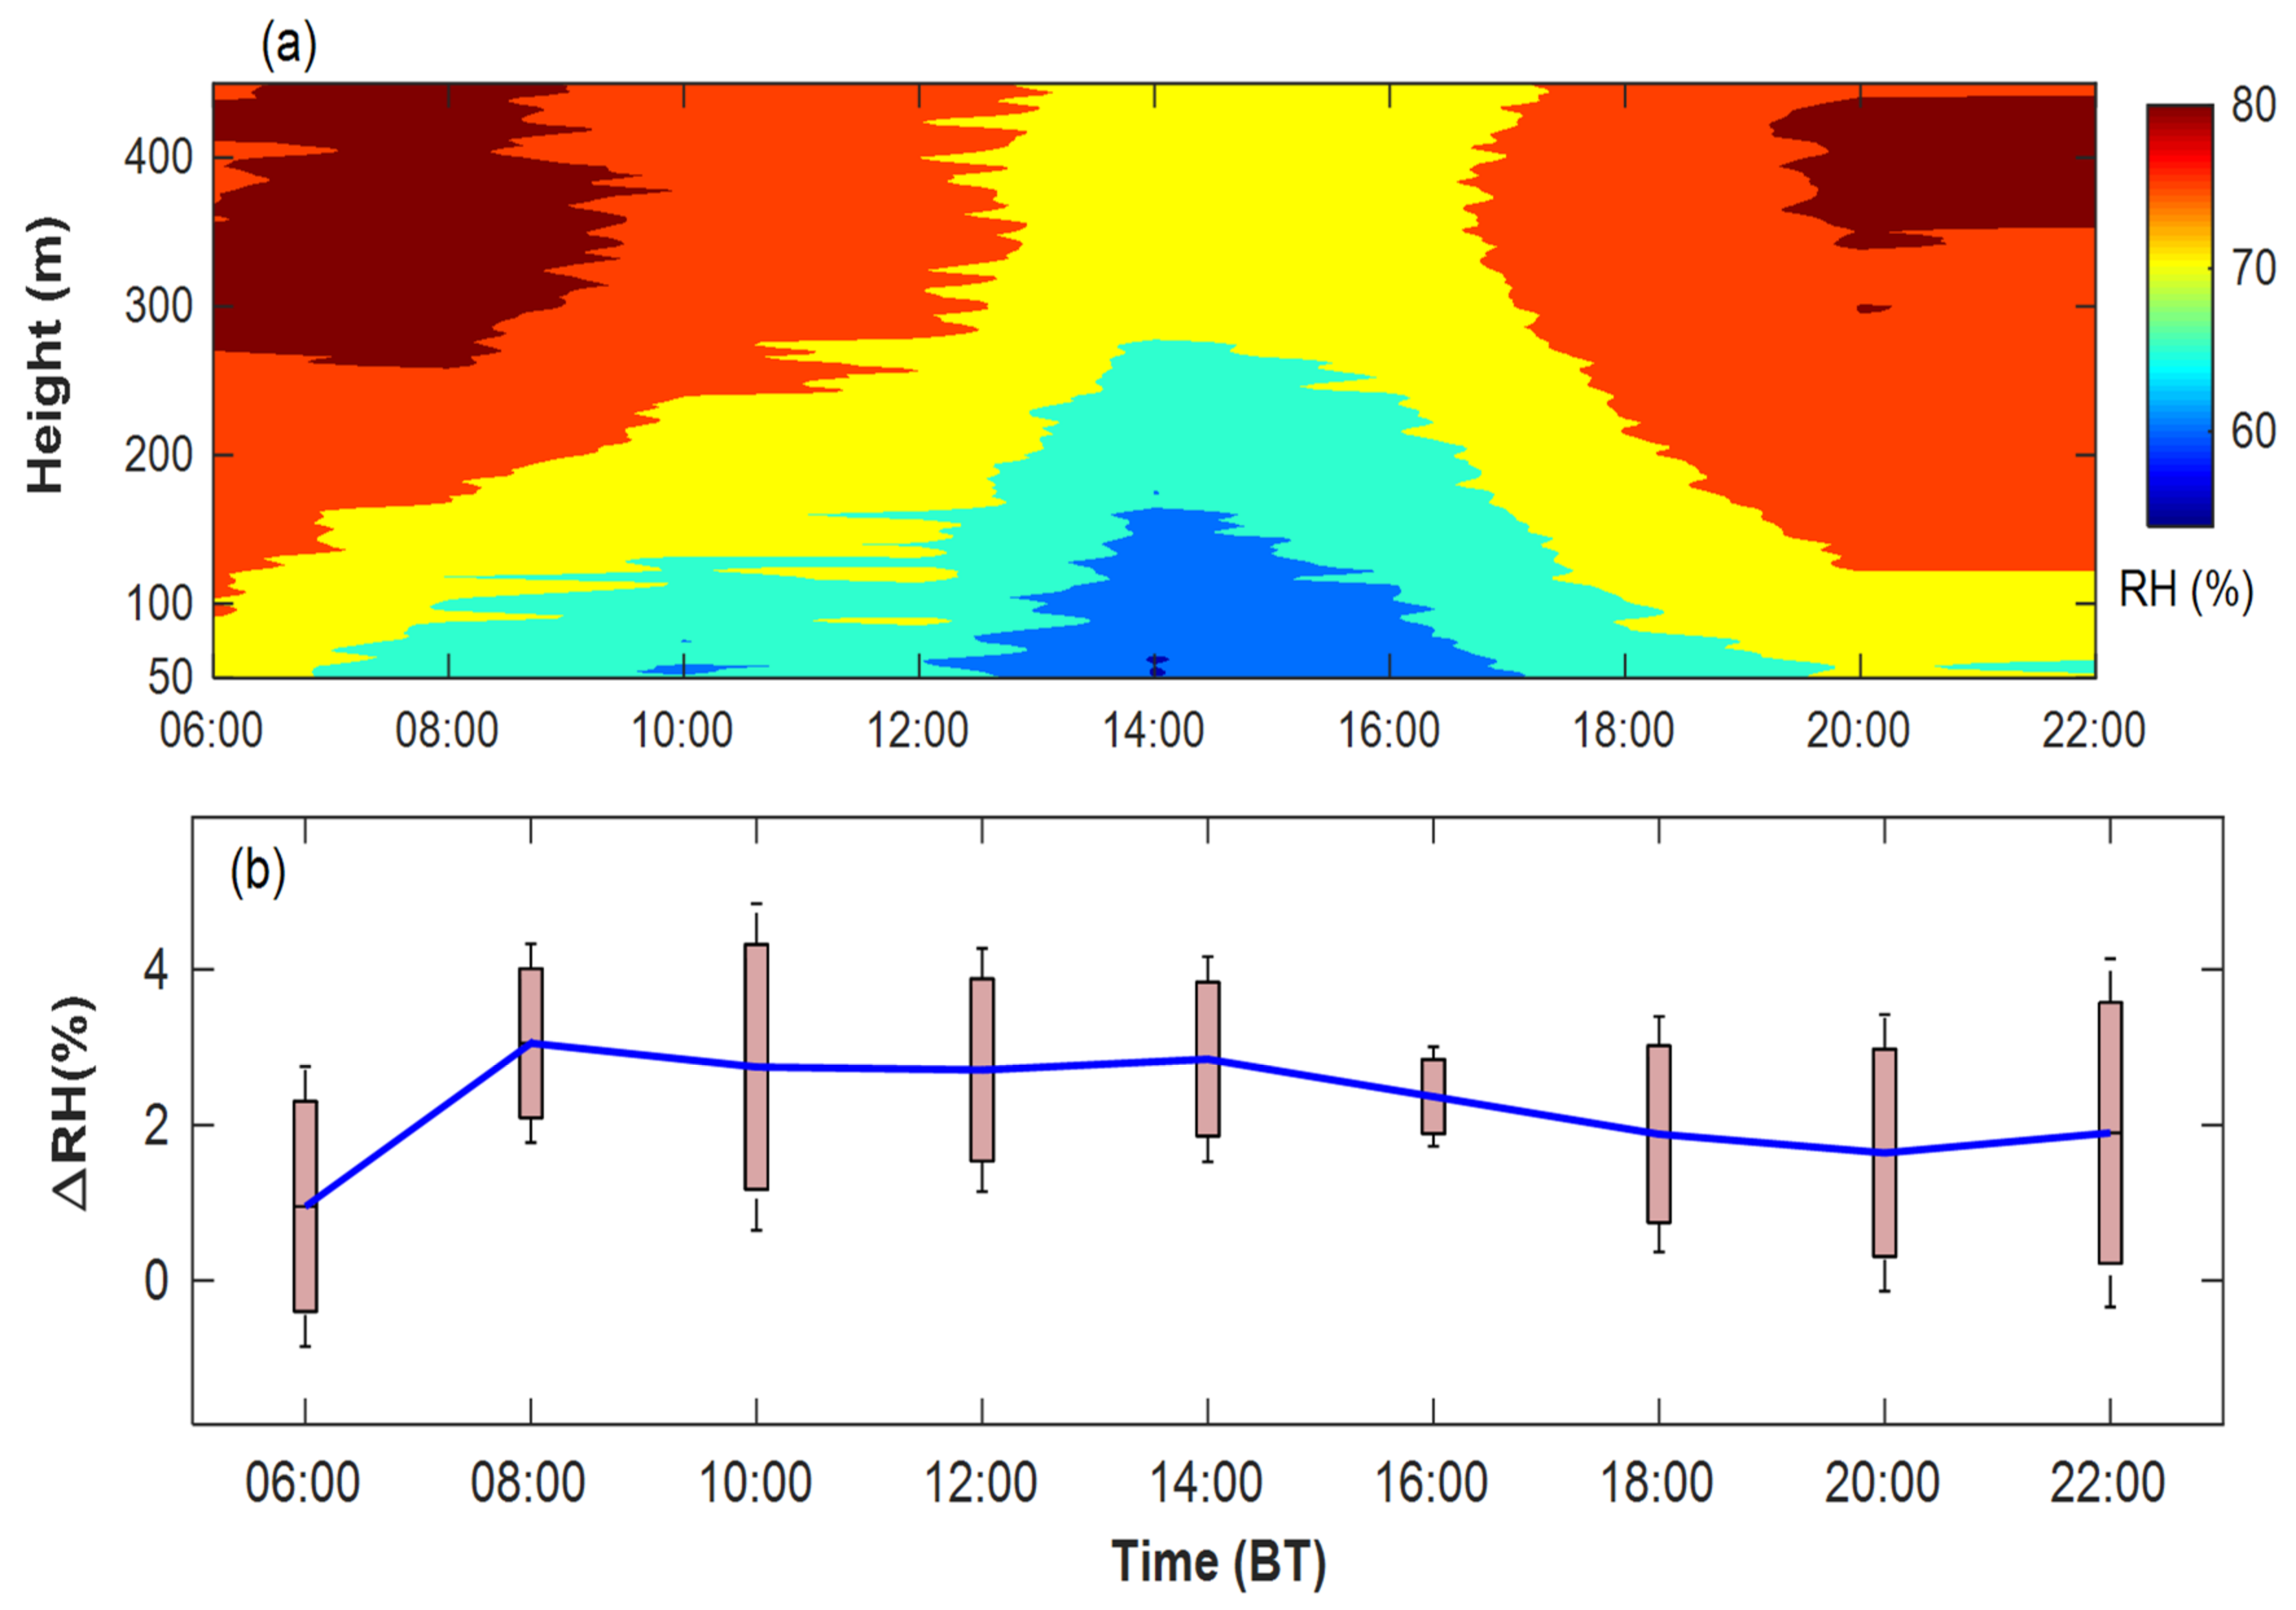
Figure 6 shows the temporal–spatial distributions of the average RH within the BLH (Figure 6a) and the temporal distribution of the average vertical 100 m RH difference (∆RH, Figure 6b). As shown in Figure 6, the average RH within the BLH is mainly distributed between 60% and 75%. From 6:00 to 7:30, the average RH is greater than 70%. Moreover, from 10:00 to 13:00, with the average solar irradiance gradually increasing (Figure 5c) and the BLH gradually increasing, the average RH within the BLH gradually decreases through the strengthening of the mixing effect and the dilution of water vapor. Subsequently, when the time period is from 14:00 to 16:00 with the average solar irradiance reaching the maximum (Figure 5c), the average RH reaches the minimum ( 60 % ) due to the BLH (the dilution space) reaching the maximum. However, from 17:00 to 20:00, due to the decreasing average solar irradiance (Figure 5c) and the BLH, the average RH gradually increases with time, and until 20:00, the average RH reaches 70% again and there is little change with time.
As shown in Figure 6b, ∆RH is mainly in the range of 1–4%, which indicates that the RH increases with height. At around 06:00, the average ∆RH is the minimum ( 1 % ), indicating that the vapor flux is very small and that the atmospheric structure is very stable in this period. However, the average ∆RH value is the maximum ( 3 % ) at around 15:00, which indicates that the vapor flux is very large and that the corresponding atmospheric turbulence is very strong.

3.2. The Characteristics of Pollutants

3.2.1. Temporal–Spatial Characteristics of BC

BC is the major component of the light-absorbing components and has an important impact on the atmospheric environment and climate [48]. Figure 7 is the temporal–spatial distribution of the average BC detected by the tethered airship, in which the black line is the average BLH. As shown in Figure 7, the BC gradually decreases with height; meanwhile, the rapid decrease in the BC is at the maximum around the BLH. When the height is less than 100 m, the BC is mainly observed in the range of   8   to   10   μ g · m 3 . Moreover, when the height is 300 m, the BC is mainly observed during 6–8 μ g · m 3 . However, when the height reaches 500 m, the value of the BC is mainly concentrated in 4–5 μ g · m 3 ; and the BC is less than 3 μ g · m 3 at 800 m.
As shown in Figure 7, when the time period is from 09:30 to 12:00, due to the increase in pollutants being discharged from human activities and industrial production, the BC gradually increases, and the maximum BC is larger than 10 μ g · m 3 . Subsequently, from 14:00 to 17:00, as the BLH reaches the maximum and the low-level turbulent movement is very intense, the pollutants are accelerated to the upper air (blue box in Figure 7), which leads to the low-level BC gradually decreasing. Furthermore, when the time period is from 17:00 to 20:00, the low-level BC gradually drops to 8 μ g · m 3 . Moreover, the smaller BLH corresponds to the larger BC concentration. BC decreases rapidly above the BLH, and the concentration of BC within the BLH accounts for about 61% of the total BC concentration.

3.2.2. Temporal–Spatial Characteristics of PM2.5 and PM10

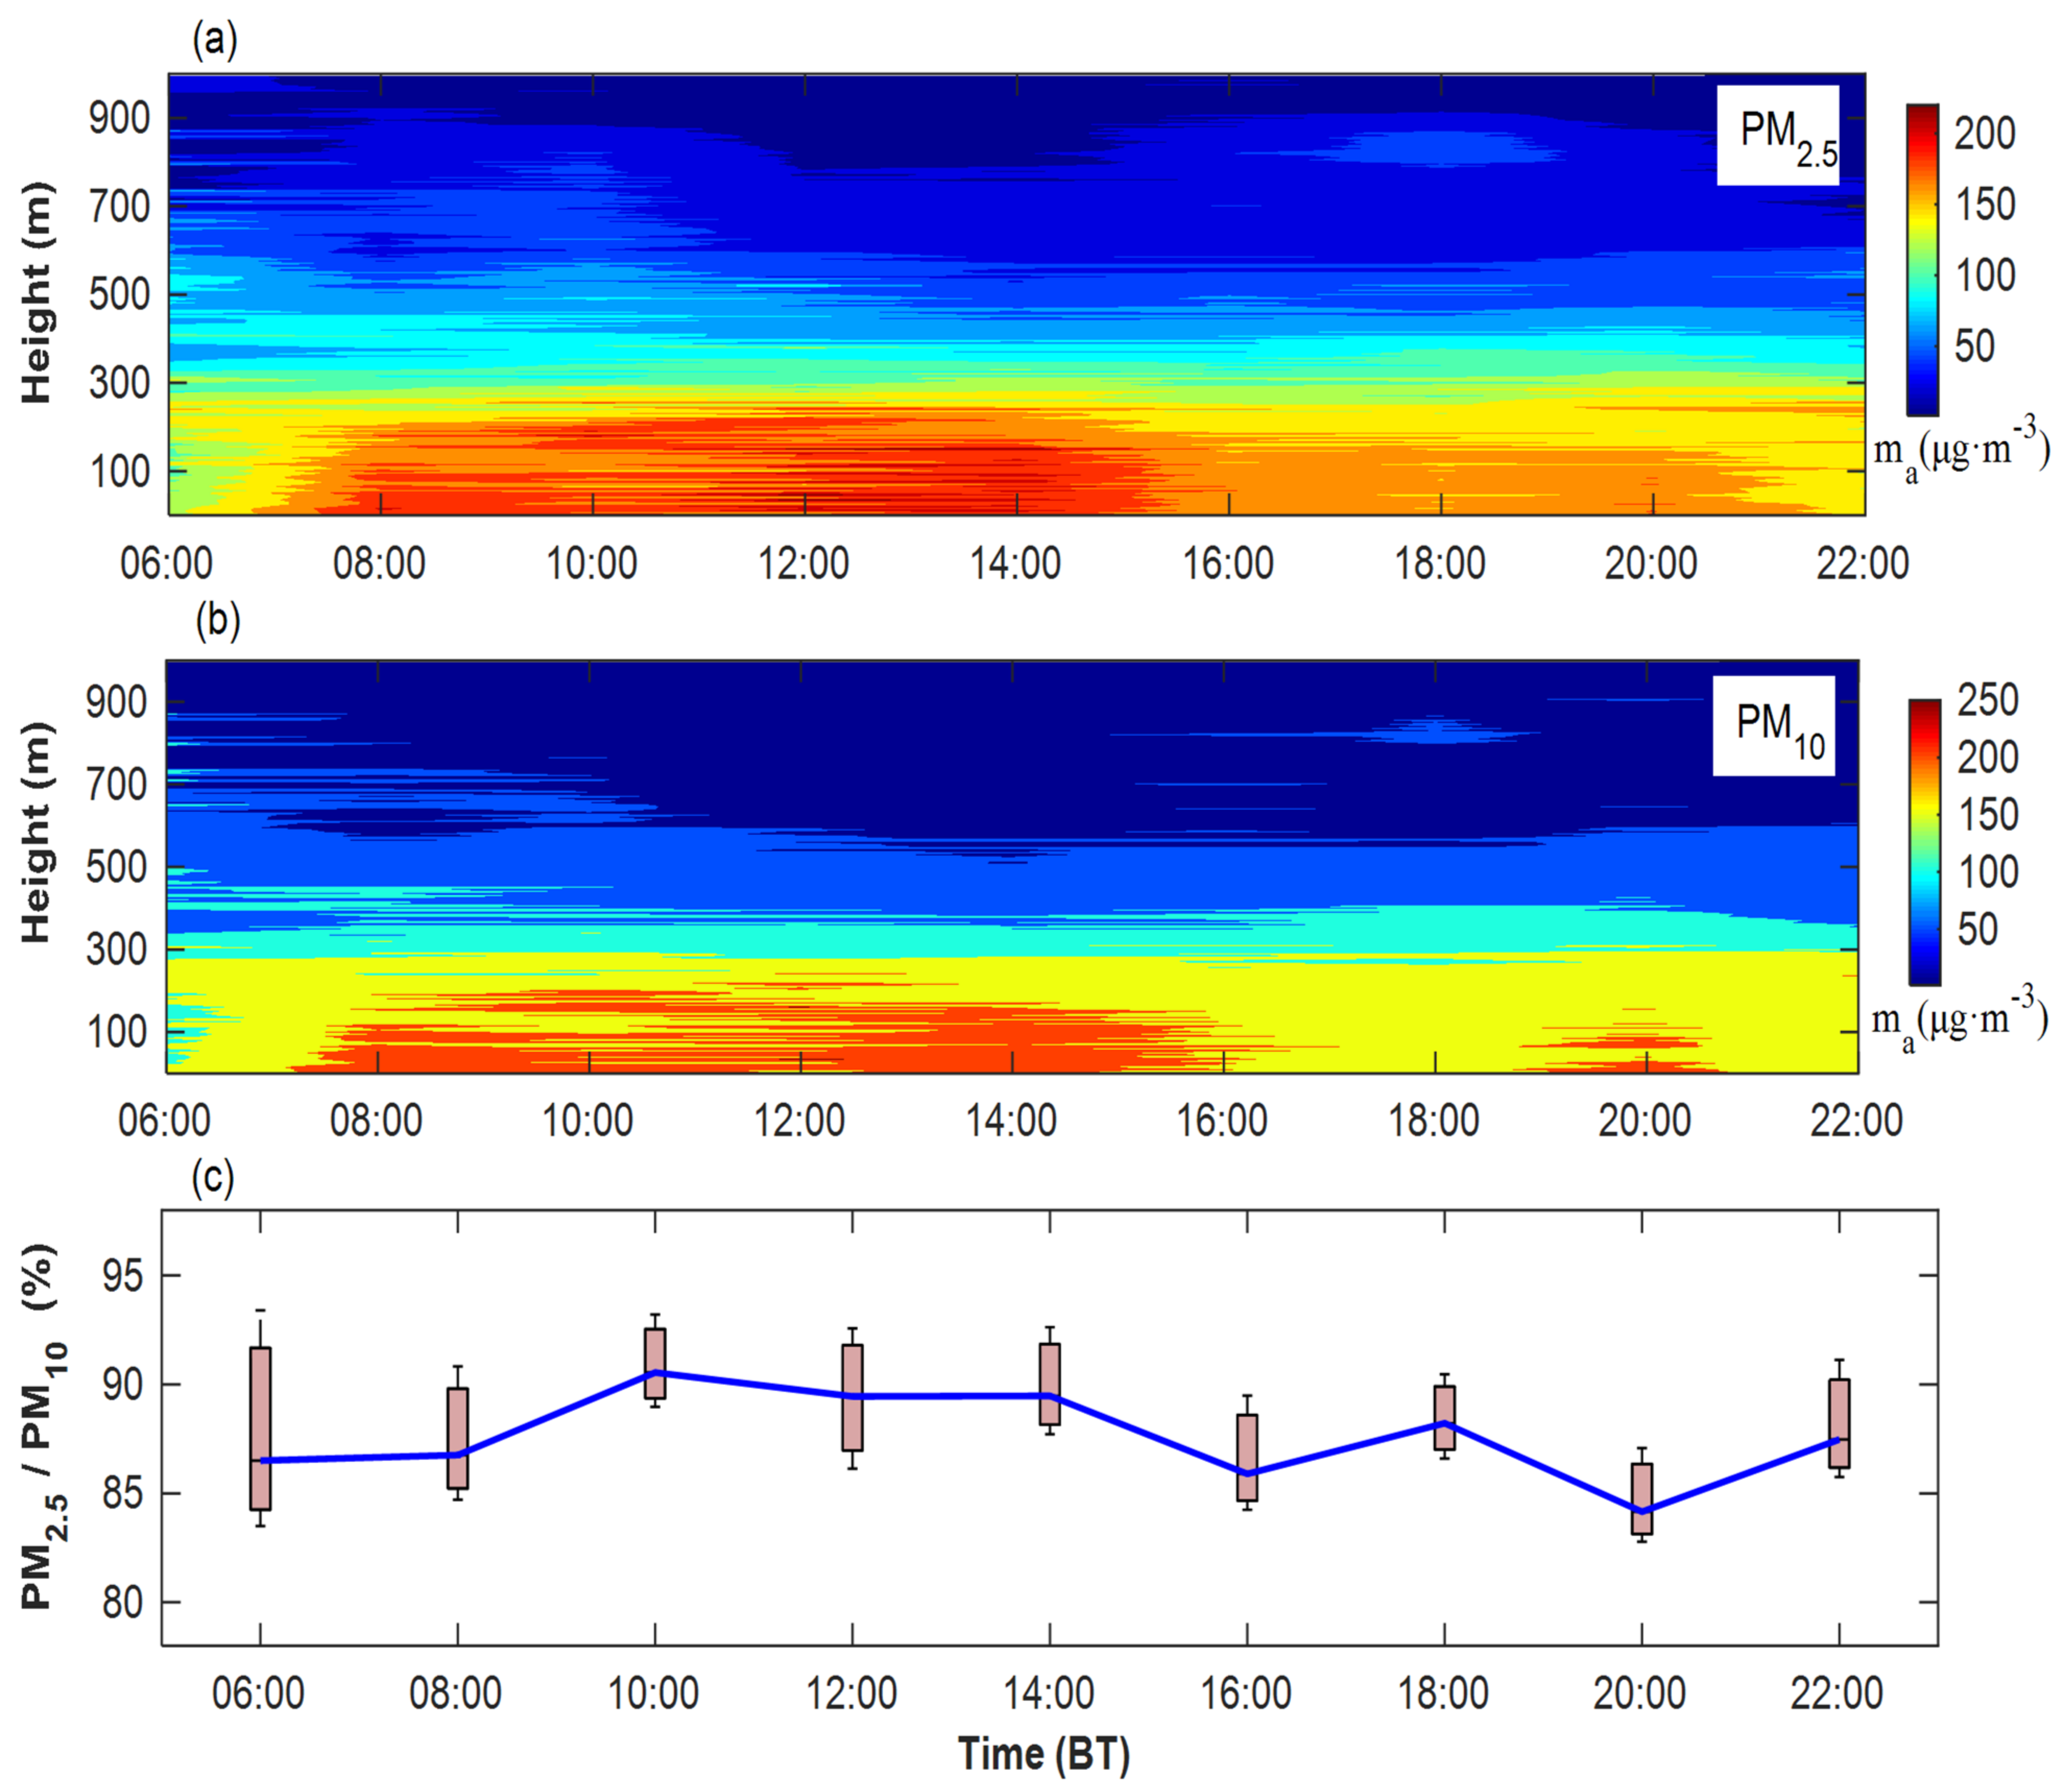
Figure 8 shows the temporal–spatial distributions of the average PM2.5 and PM10 obtained by the tethered airship. As shown in Figure 8, the concentrations of average PM2.5 and PM10 gradually decrease with height. Moreover, when the height is less than 100 m, the concentrations of PM2.5 and PM10 are mainly concentrated at 130 180   μ g · m 3 and 160 230   μ g · m 3 , respectively. Furthermore, when the height is 300 m, PM2.5 and PM10 drop to 60 100   μ g · m 3 and 100 150   μ g · m 3 , respectively. Meanwhile, when the height increases to 500 m, PM2.5 and PM10 drop to 50   μ g · m 3 and 80   μ g · m 3 , respectively, and PM2.5 and PM10 are less than 50   μ g · m 3 at 700 m.
From 06:00 to 08:00, PM2.5 and PM10 are at a relatively low level with little variation with time, and the maximum PM2.5 and PM10 are 130 μ g · m 3 and 16 μ g · m 3 , respectively. Subsequently, from 09:00 to 10:00, due to the strengthening of human activities and industrial production, PM2.5 and PM10 gradually increase with time. From 11:00 to 14:00, PM2.5 and PM10 increase to their maximum ( PM 2.5 200   μ g · m 3 , PM 10 250   μ g · m 3 ). However, from 14:00 to 16:00, as the BLH reaches the maximum, and the mixing movement is relatively strong, PM2.5 and PM10 gradually decrease. After 21:00, PM2.5 and PM10 drop to lower values (both less than 150   μ g · m 3 ).
In order to further analyze the characteristics of pollutant particles, the temporal distribution of PM2.5/PM10 was determined by using PM2.5 and PM10 as shown in Figure 8c, where the blue line is the average PM2.5/PM10. Overall, the PM2.5/PM10 is generally greater than 85%. Moreover, when the time periods are 06:00–08:00 and 19:30–20:30, the average PM2.5/PM10 is relatively small (≈85%), which indicates that there are fewer small-diameter pollutants than at other times. However, when the time period is from 10:00 to 14:00, the average PM2.5/PM10 is relatively large (≈90%), which indicates that there are more small-diameter pollutants than at other times. Furthermore, when the time period is from 15:00 to 16:00, the average PM2.5/PM10 drops greatly, which indicates that the small-diameter pollutants dissipate faster than the large-diameter pollutants.

3.2.3. Temporal–Spatial Characteristics of the Extinction Coefficient

The extinction coefficient (EC) reflects the ability to scatter and absorb. Moreover, a larger EC corresponds to a stronger ability to scatter and absorb, which means that the radius and concentration of the aerosols is larger. However, a smaller EC corresponds to a weaker ability to scatter and absorb, indicating the smaller radius and concentration of aerosols.
Using the EC detected by the Lidar system from December 2019 to January 2020, the temporal–spatial distribution of the average EC was calculated and is shown in Figure 9a. Comparing Figure 9a,b, when the time period is from 0:00 to 07:00, the corresponding EC is mainly less than 6 km−1 and concentrated within 250 m, which is exactly the same as the BLH (Figure 4); moreover, the EC and V do not change much with time, which indicates that the atmospheric structure is stable and that the pollutants are mainly concentrated within the BLH. When the time period is from 09:00 to 12:00 (between the two red lines), due to the influence of human activities and industrial production, the EC is relatively large (up to 9 km−1), with the visibility decreasing to the minimum (<1400 m), and this period is the most polluted time of the day. However, when the time period is from 14:00 to 17:00, due to the strengthening of the mixing effect and the dilution of pollutants, the EC drops to 5 km−1 with the corresponding average visibility rising to 2000 m. After 19:00, the value of the EC is basically less than 4 km−1, and it does not change much with time.

3.2.4. Temporal Characteristics of CO, NO2, and SO2

To analyze the characteristics of gaseous pollutants in the atmosphere during haze events, the CO, NO2, and SO2 detected by ground monitors from December 2019 to January 2020 were averaged and are shown in Figure 10. Figure 10 shows that the concentration of CO is in the range of 1300 1700   μ g · m 3 , and the NO2 is mainly concentrated at 43 60   μ g · m 3 . When time period is from 9:00 to 12:00, the visibility is low (Figure 9b), but the CO and NO2 concentrations are relatively high and distributed between 1500 1700   μ g · m 3 and 55 60   μ g · m 3 , respectively. However, when the time period is from 14:00 to 18:00 with high visibility, the CO and NO2 concentrations are very low at 1300 1350   μ g · m 3 and 42 44   μ g · m 3 , respectively. When the time period is 19:00–21:00, due to individuals leaving work and exhaust gas being emitted by motor vehicles, the NO2 and CO concentrations increase rapidly during this period.
As shown in Figure 10, SO2 has the lowest concentration of the three gases with a range of 12 18   μ g · m 3 , and it has a relatively low correlation with visibility. Meanwhile, the maximum content of SO2 ( 18   μ g · m 3 ) is at 01:00–03:00 when the temperature is very low and the most pollutants are emitted by coal-fired heating.
By comparing our results with previous studies [49,50] and the average concentrations of CO, SO2, and NO2 in no-haze weather conditions in Shihezi, which are 526 μ g · m 3 , 8 μ g · m 3 , and 12   μ g · m 3 , respectively, it can be seen that the average concentrations of the three gases are relatively high during winter haze. Moreover, the temporal characteristics of CO and NO2 have a high correlation with visibility (Figure 9b).

3.2.5. The Relationship between V and AQI during Haze Events

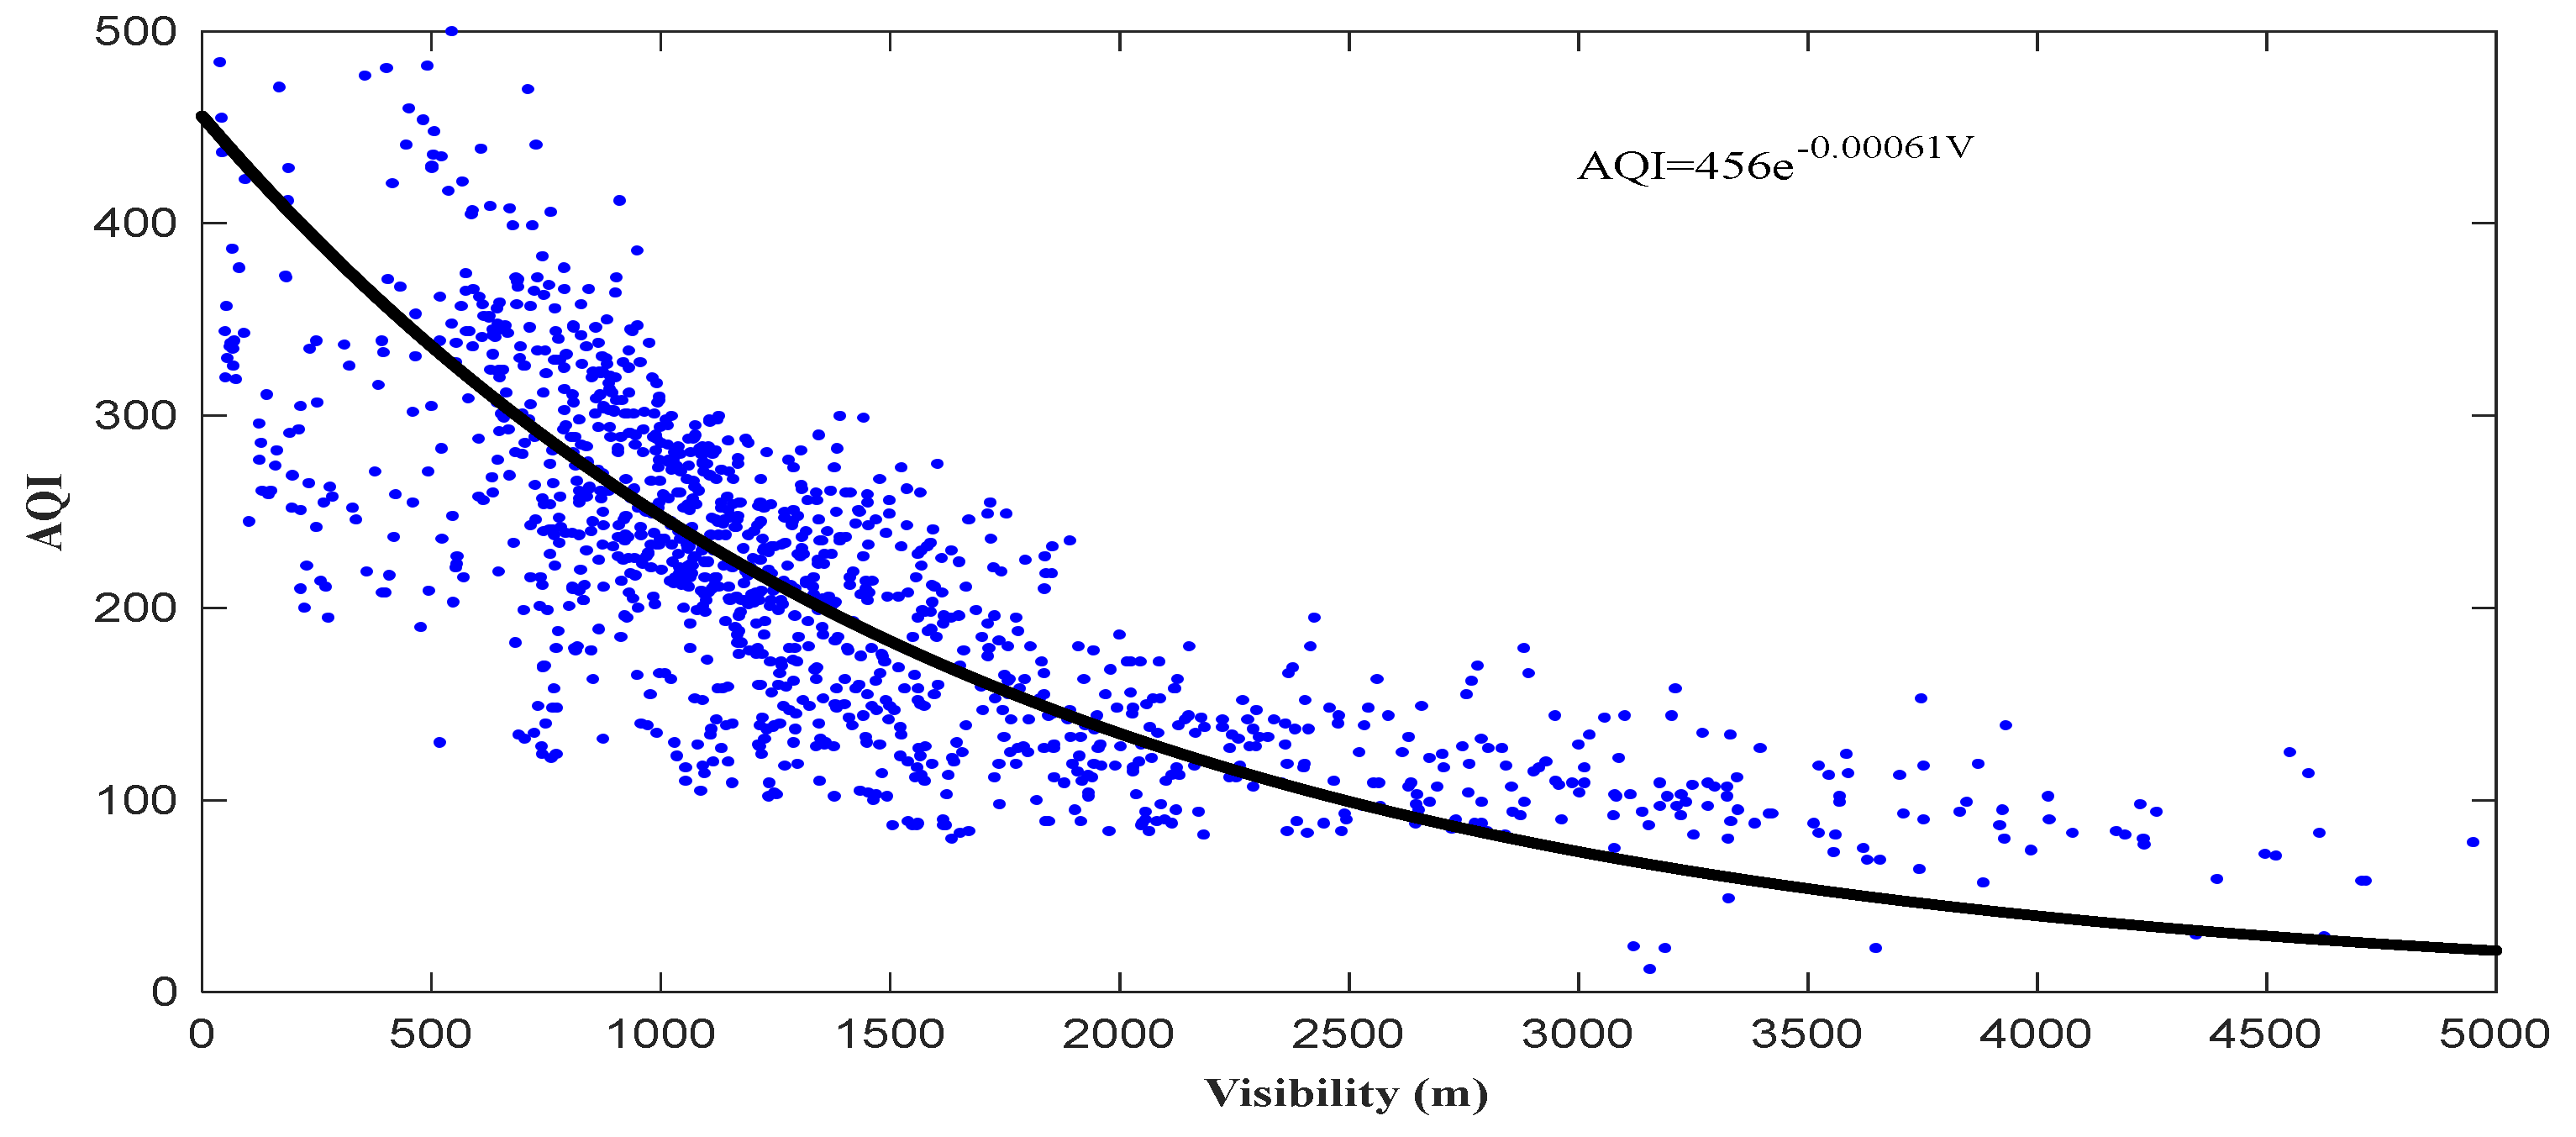
Haze events can cause heavy air pollution in this region; Figure 11 shows the distribution of the AQI (air quality index) with V, and the number of points is 1448 in this figure. As Figure 11 shows, there is a high correlation between AQI and V; moreover, the V is lower (the heavier haze event), corresponding to the larger AQI. The relationship between V and AQI is generated by the nonlinear least-squares method and is shown in Equation (8), and the Pearson coefficient is 0.82.
AQI = 456 e 0.00061 V

4. Discussion

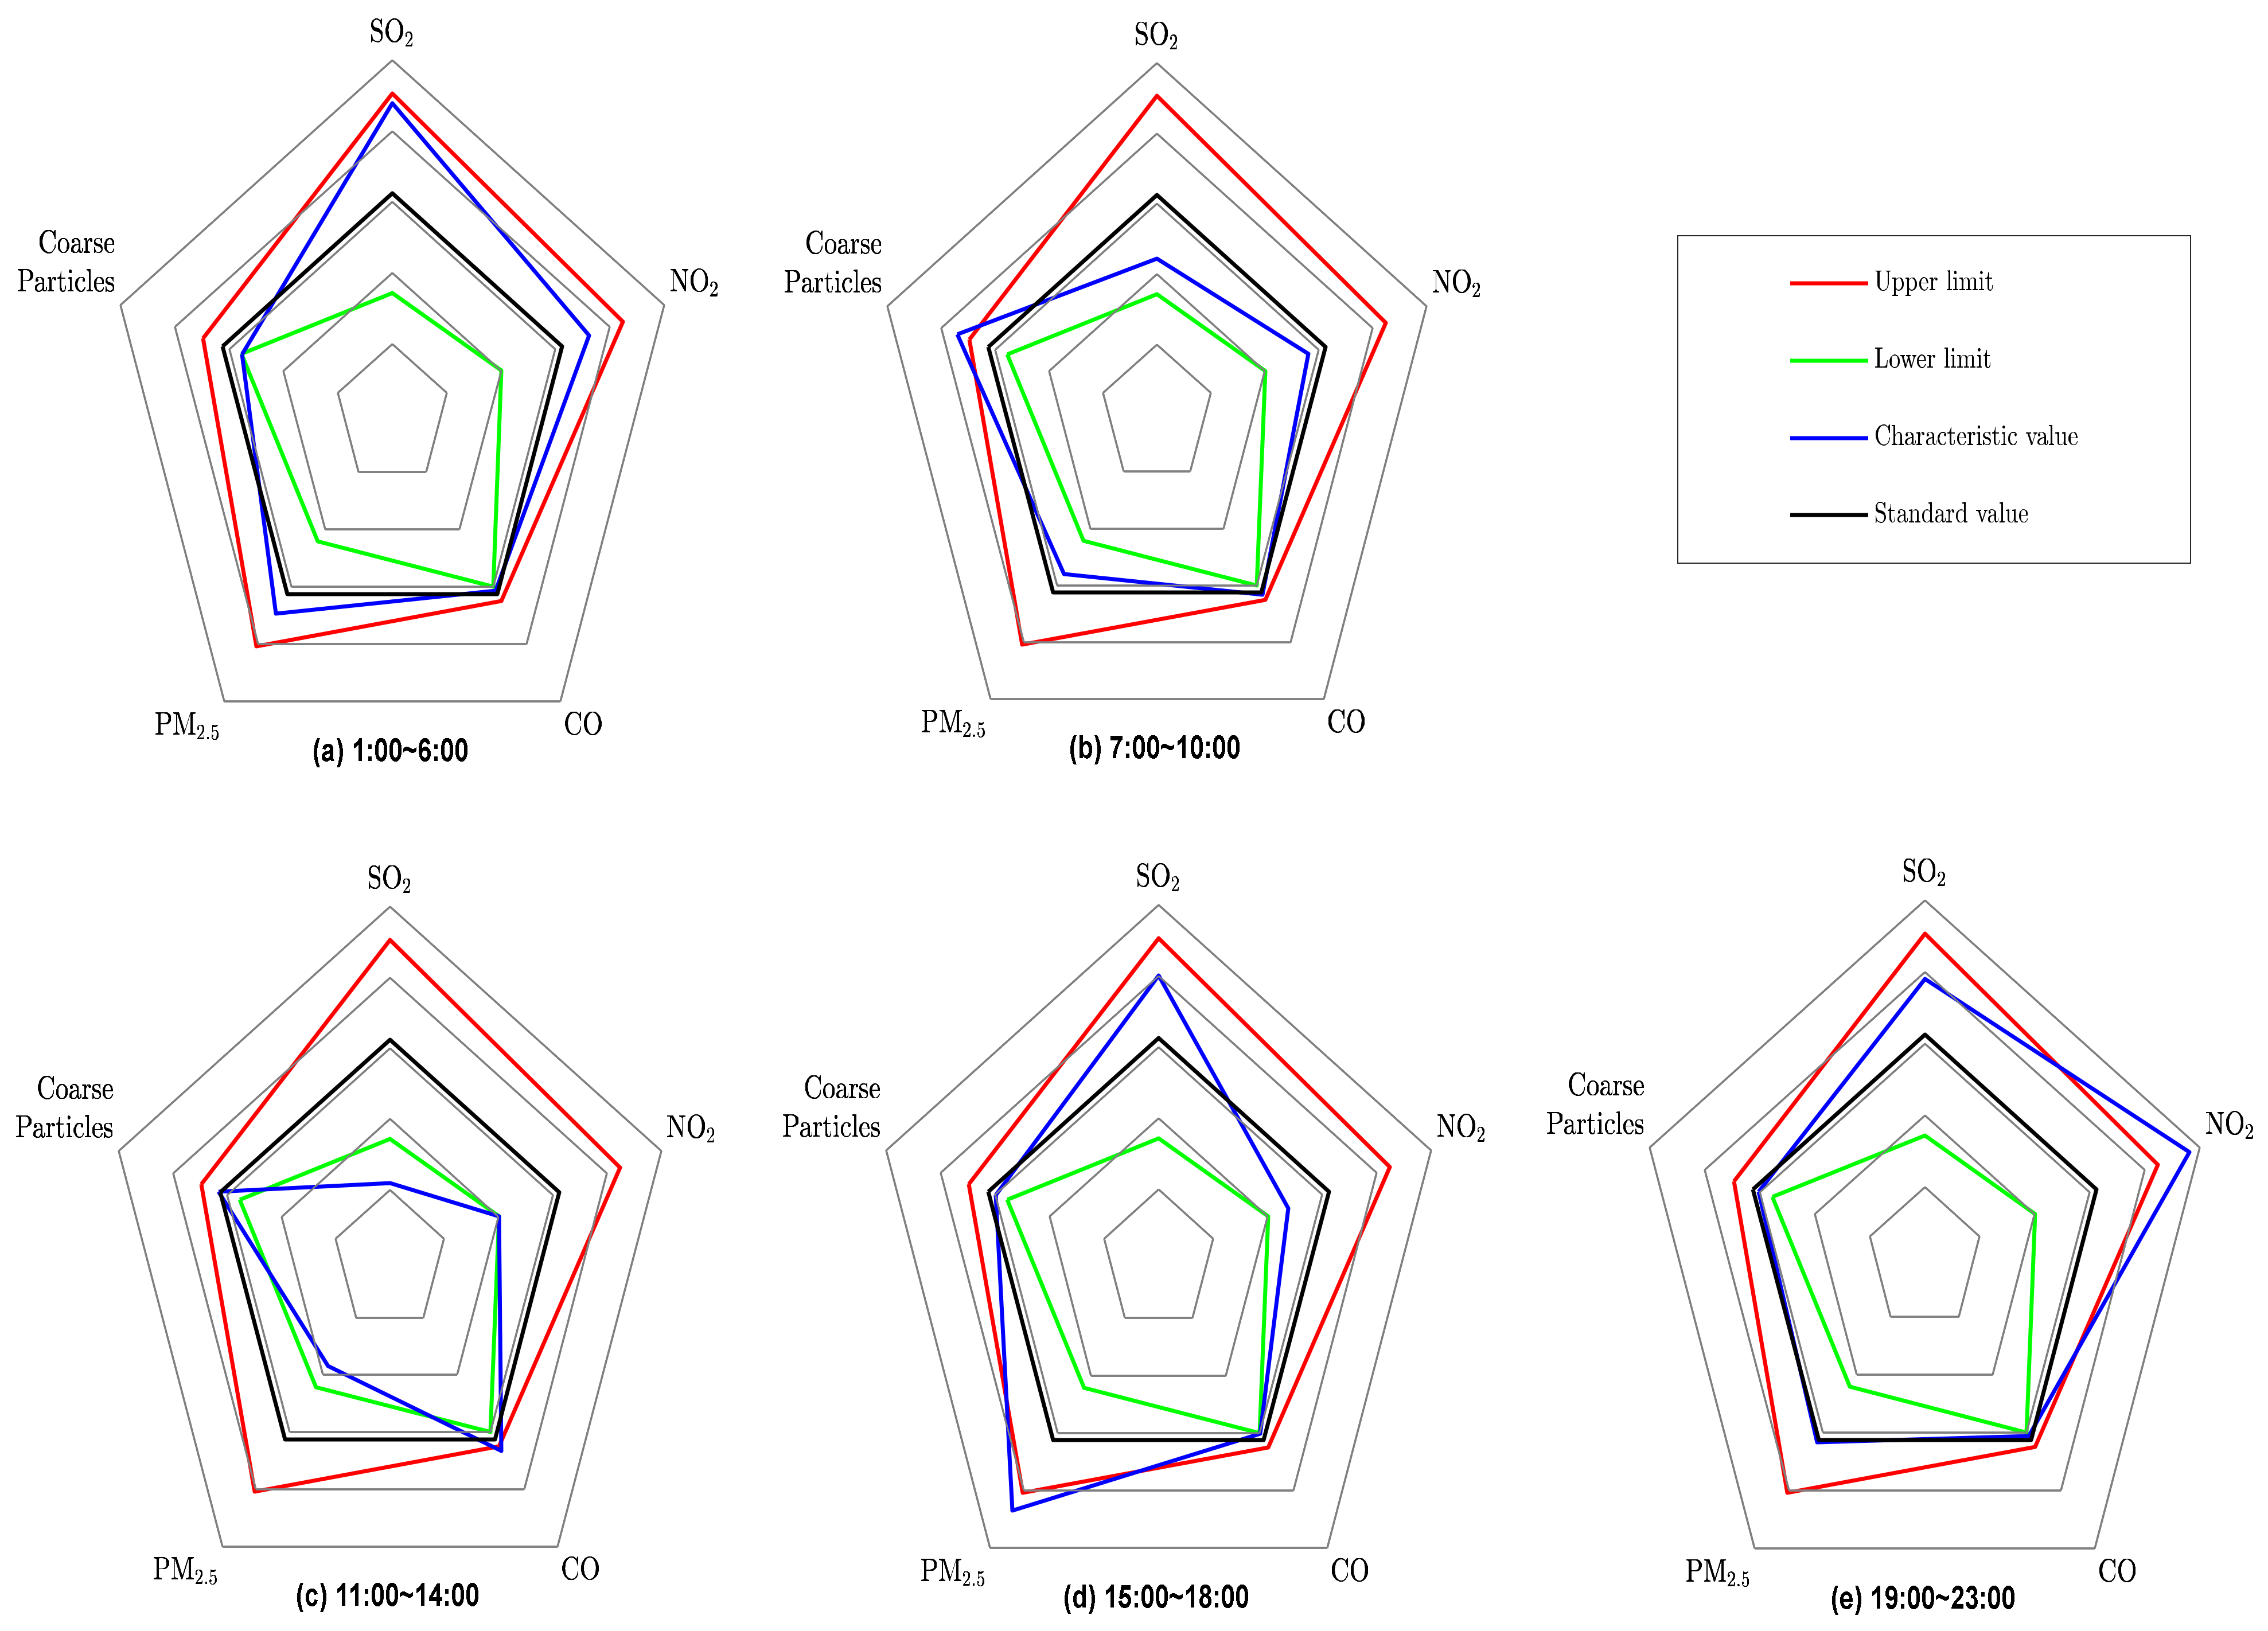
In order to ascertain the pollution sources over different time periods, using CO, SO2, NO2, PM2.5, and coarse particles, a characteristic radar map (CRM) was constructed during this study. The CRM is the one proposed by [11], and it was drawn with the eigenvalue C V i (Equation (9)), the upper limit of the standard M a x i (Equation (10)), and the lower limit of the standard (Equation (11)). The Z i is the normalized value of CO, SO2, NO2, PM2.5, and coarse particles in a certain period, and Z i ¯ is the average value of Z i over the whole day.
C V i = Z i / Z i ¯
M a x i = Z i + 1 / Z i ¯
M i n i = Z i 1 / Z i ¯
Based on the characteristics of solar radiation and human activities, the day is divided into five periods (01:00–06:00, 07:00–10:00, 11:00–14:00, 15:00–18:00, and 19:00–23:00). Then, using the CO, SO2, NO2, PM2.5, and coarse particles detected by ground monitoring, the CRMs were drawn and are shown in Figure 12. As shown in Figure 12a, when the time period is from 01:00 to 06:00, SO2 exceeds the upper limit of the standard, which indicates that coal burning caused by night heating is the main pollution source during this period. Moreover, as shown in Figure 12b, when the time period is from 07:00 to 10:00, the coarse particles exceed the upper limit of the standard, which indicates that there are more large particles and that sand is obviously being blown during this period. Figure 12c shows that when the time period is from 11:00 to 14:00, CO exceeds the upper limit of the standard, which indicates that industrial production activities caused the emission of more pollutants during this period. Meanwhile, Figure 12d shows that when the time period is from 15:00 to 18:00, PM2.5 exceeds the upper limit of the standard, indicating that this period is mainly secondary pollution. Furthermore, Figure 12e shows that when the time period is from 19:00 to 23:00, NO2 exceeds the upper limit of the standard, which indicates that motor vehicle pollution caused by human night activities is relatively high during this period. To reveal more accurate characteristics of pollution sources, further research will be carried out in the future.

5. Conclusions

In this study, a detection experiment using a tethered airship, a Lidar system, and ground monitors was conducted to detect haze events in Shihezi in winter. The high-resolution temporal–spatial characteristics of meteorological elements, BC, PM, and gaseous pollutants were determined, and they provide a key reference for further studies of the haze on the northern slope of the TMs. Moreover, the relationship between V and AQI can provide an indicator for environmental pollution during winter haze events in this aera. This study mainly draws the following conclusions:
(1)
The BLH of haze events in Shihezi is relatively low and has a positive correlation with visibility. Moreover, the BLH is mainly distributed in 200–450 m, with the maximum BLH occurring at 15:30–16:30.
(2)
The temperature within the BLH is mainly between −5 °C and −15 °C with the vertical temperature difference basically greater than 0 except 15:00–17:00, which indicates that there is a temperature inversion layer in the low-level atmosphere and that the atmospheric structure is very stable.
(3)
The RH within the BLH is between 60 and 75%. When the time period is 6:00–8:00 and after 20:00, the average RH is > 70% with a little ∆RH, and the vapor flux is very small; however, it is mostly hazy with RH < 70% at 10:00 to 14:00 with a large ∆RH, and the vapor flux is relatively large.
(4)
During haze events, the PM2.5 and PM10 within the BLH are mainly concentrated at 130 180   μ g · m 3 and 160 230   μ g · m 3 , respectively. PM2.5 and PM10 increase to the maximum ( PM 2.5 200   μ g · m 3 and PM 10 250   μ g · m 3 ), and PM2.5/PM10 are generally greater than 85% at 11:00–14:00.
(5)
BC is mainly distributed in 6–8   μ g · m 3 and concentrated within the BL, and BC decreases obviously around the BLH. Moreover, the EC is inversely correlated with visibility and mainly concentrated at 4–9 km−1.
(6)
During winter haze events, the relationship between V and AQI (air quality index) is constructed as A Q I = 456 e 0.00061 V .

Author Contributions

Conceptualization, H.M., J.W. and G.R.; methodology, J.W. and G.R; software, H.M. and Q.Z.; investigation, W.W.; data curation, H.M.; writing—original draft preparation, H.M. and J.W.; writing—review and editing, D.A. and W.L.; visualization, H.M.; supervision, H.M. All authors have read and agreed to the published version of the manuscript.

Funding

This work was supported by the Xinjiang Meteorological Bureau Guiding Program (YD2021006), the project ZR2021QD041 supported by Shandong Provincial Natural Science Foundation; the Key Scientific Research Foundation Program of Xinjiang Meteorological Bureau (ZD202003).

Institutional Review Board Statement

Not applicable.

Informed Consent Statement

Not applicable.

Data Availability Statement

Data will be made available upon request.

Conflicts of Interest

The authors declare no conflict of interest.

References

  1. Wang, H.; Liu, A.; Zhen, Z.; Yin, Y.; Li, B.; Li, Y.; Chen, K.; Xu, J. Vertical structures of meteorological elements and black carbon at Mt. Tianshan using an unmanned aerial vehicle system. Remote Sens. 2021, 13, 1267. [Google Scholar] [CrossRef]
  2. Wang, M.; Ming, H. Study on radar detection of one stratiform cloud precipitation process in the central part of the Tianshan Mountains in China. Asia-Pac. J. Atmos. Sci. 2018, 54, 511–524. [Google Scholar] [CrossRef]
  3. Zhang, X.; Zhang, X.; Talifu, D.; Ding, X.; Wang, X.; Abulizi, A.; Zhao, Q.; Liu, B. Secondary formation and influencing factors of WSOC in PM2.5 over Urumqi, NW China. Atmos. Environ. 2023, 293, 119450. [Google Scholar] [CrossRef]
  4. Liu, Y.; Zhao, H.; Ma, Y.; Yang, H.; Wang, Y.; Wang, H.; Zhang, Y.; Zou, X.; Wang, H.; Wen, R. Characteristics of particulate matter and meteorological conditions of a typical air-pollution episode in Shenyang, northeastern China, in winter 2017. Atmos. Pollut. Res. 2021, 12, 316–327. [Google Scholar] [CrossRef]
  5. Molepo, K.M.; Abiodun, B.J.; Magoba, R.N. The transport of PM10 over Cape Town during high pollution episodes. Atmos. Environ. 2019, 213, 116–132. [Google Scholar] [CrossRef]
  6. Ming, H.; Wei, M.; Wang, M.; Gao, L.; Chen, L.; Wang, X. Analysis of fog at Xianyang Airport based on multi-source ground-based detection data. Atmos. Res. 2019, 220, 34–45. [Google Scholar] [CrossRef]
  7. Salmond, J.; Dirks, K.; Fiddes, S.; Pezza, A.; Talbot, N.; Scarfe, J.; Renwick, J.; Petersen, J. A climatological analysis of the incidence of brown haze in Auckland, New Zealand. Int. J. Climatol. 2016, 36, 2516–2526. [Google Scholar] [CrossRef]
  8. Crawford, J.; Chambers, S.; Cohen, D.; Williams, A.; Griffiths, A.; Stelcer, E. Assessing the impact of atmospheric stability on locally and remotely sourced aerosols at Richmond, Australia, using Radon-222. Atmos. Environ. 2016, 127, 107–117. [Google Scholar] [CrossRef]
  9. Ma, Y.; Ye, J.; Xin, J.; Zhang, W.; Vilà-Guerau de Arellano, J.; Wang, S.; Zhao, D.; Dai, L.; Ma, Y.; Wu, X. The stove, dome, and umbrella effects of atmospheric aerosol on the development of the planetary boundary layer in hazy regions. Geophys. Res. Lett. 2020, 47, e2020GL087373. [Google Scholar] [CrossRef]
  10. Chen, H.; Kwong, J.C.; Copes, R.; Tu, K.; Villeneuve, P.J.; Van Donkelaar, A.; Hystad, P.; Martin, R.V.; Murray, B.J.; Jessiman, B. Living near major roads and the incidence of dementia, Parkinson’s disease, and multiple sclerosis: A population-based cohort study. Lancet 2017, 389, 718–726. [Google Scholar] [CrossRef]
  11. Li, M.; Jia, L.; Zhang, F.; Hu, M.; Shi, Y.; Chen, X. Characteristics of haze weather in Chongqing, China and its determinants analysis based on automatic monitoring stations. Atmos. Pollut. Res. 2016, 7, 638–646. [Google Scholar] [CrossRef]
  12. Chan, C.K.; Yao, X. Air pollution in mega cities in China. Atmos. Environ. 2008, 42, 1–42. [Google Scholar] [CrossRef]
  13. Marley, H.G.; Dirks, K.N.; Neverman, A.J.; McKendry, I.; Salmond, J.A. The relationship between Brown haze, atmospheric boundary layer structure, and air pollution in an urban area of complex coastal terrain. Atmos. Pollut. Res. 2021, 12, 101057. [Google Scholar] [CrossRef]
  14. Liu, N.; Zhou, S.; Liu, C.; Guo, J. Synoptic circulation pattern and boundary layer structure associated with PM2.5 during wintertime haze pollution episodes in Shanghai. Atmos. Res. 2019, 228, 186–195. [Google Scholar] [CrossRef]
  15. Che, H.; Qi, B.; Zhao, H.; Xia, X.; Eck, T.F.; Goloub, P.; Dubovik, O.; Estelles, V.; Cuevas-Agulló, E.; Blarel, L. Aerosol optical properties and direct radiative forcing based on measurements from the China Aerosol Remote Sensing Network (CARSNET) in eastern China. Atmos. Chem. Phys. 2018, 18, 405–425. [Google Scholar] [CrossRef]
  16. Kim, Y.J.; Kim, K.W.; Kim, S.D.; Lee, B.K.; Han, J.S. Fine particulate matter characteristics and its impact on visibility impairment at two urban sites in Korea: Seoul and Incheon. Atmos. Environ. 2006, 40, 593–605. [Google Scholar] [CrossRef]
  17. Ren, Y.; Zhang, H.; Zhang, X.; Wu, B.; Cai, X.; Song, Y.; Zhu, T. Coupled-decoupled turbulence structures of stable boundary layer during heavy haze pollution events. Atmos. Res. 2023, 281, 106465. [Google Scholar] [CrossRef]
  18. Singh, N.; Solanki, R.; Ojha, N.; Janssen, R.H.; Pozzer, A.; Dhaka, S.K. Boundary layer evolution over the central Himalayas from radio wind profiler and model simulations. Atmos. Chem. Phys. 2016, 16, 10559–10572. [Google Scholar] [CrossRef]
  19. Shikhovtsev, A.Y. A Method of Determining Optical Turbulence Characteristics by the Line of Sight of an Astronomical Telescope. Atmos. Ocean. Opt. 2022, 35, 303–309. [Google Scholar] [CrossRef]
  20. Kovadlo, P.G.; Shikhovtsev, A.Y.; Kopylov, E.A.; Kiselev, A.V.; Russkikh, I.V. Study of the Optical Atmospheric Distortions using Wavefront Sensor Data. Russ. Phys. J. 2021, 63, 1952–1958. [Google Scholar] [CrossRef]
  21. Ming, H.; Wang, M.; Gao, L.; Qian, Y.; Gao, M.; Chehri, A. Study on the Boundary Layer of the Haze at Xianyang Airport Based on Multi-Source Detection Data. Remote Sens. 2023, 15, 641. [Google Scholar] [CrossRef]
  22. Zhao, X.; Zhao, P.; Xu, J.; Meng, W.; Pu, W.; Dong, F.; He, D.; Shi, Q. Analysis of a winter regional haze event and its formation mechanism in the North China Plain. Atmos. Chem. Phys. 2013, 13, 5685–5696. [Google Scholar] [CrossRef]
  23. Miao, Y.; Hu, X.M.; Liu, S.; Qian, T.; Xue, M.; Zheng, Y.; Wang, S. Seasonal variation of local atmospheric circulations and boundary layer structure in the Beijing-Tianjin-Hebei region and implications for air quality. J. Adv. Model. Earth Syst. 2015, 7, 1602–1626. [Google Scholar] [CrossRef]
  24. Kang, E.; Han, J.; Lee, M.; Lee, G.; Kim, J.C. Chemical characteristics of size-resolved aerosols from Asian dust and haze episode in Seoul Metropolitan City. Atmos. Res. 2013, 127, 34–46. [Google Scholar] [CrossRef]
  25. Lin, Y.; Huang, K.; Zhuang, G.; Fu, J.S.; Wang, Q.; Liu, T.; Deng, C.; Fu, Q. A multi-year evolution of aerosol chemistry impacting visibility and haze formation over an Eastern Asia megacity, Shanghai. Atmos. Environ. 2014, 92, 76–86. [Google Scholar] [CrossRef]
  26. Norela, S.; Saidah, M.; Mahmud, M. Chemical composition of the haze in Malaysia 2005. Atmos. Environ. 2013, 77, 1005–1010. [Google Scholar] [CrossRef]
  27. Cheng, Y.; Yan, L.; Huang, Y.; Wang, Q.; Morawska, L.; Zhaolin, G.; Cao, J.; Zhang, L.; Li, B.; Wang, Y. Characterization of particle size distributions during winter haze episodes in urban air. Atmos. Res. 2019, 228, 55–67. [Google Scholar] [CrossRef]
  28. Zhang, J.; Liu, L.; Wang, Y.; Ren, Y.; Wang, X.; Shi, Z.; Zhang, D.; Che, H.; Zhao, H.; Liu, Y. Chemical composition, source, and process of urban aerosols during winter haze formation in Northeast China. Environ. Pollut. 2017, 231, 357–366. [Google Scholar] [CrossRef]
  29. Huang, X.; Wang, Z.; Ding, A. Impact of aerosol-PBL interaction on haze pollution: Multiyear observational evidences in North China. Geophys. Res. Lett. 2018, 45, 8596–8603. [Google Scholar] [CrossRef]
  30. Yuan, L.; Zhang, X.; Che, Y.; Liu, X.; Zhao, T.; Song, M. Vertical profile and radiative forcing of black carbon in a winter pollution period over Chengdu, China. Atmos. Res. 2022, 265, 105896. [Google Scholar] [CrossRef]
  31. Zhao, D.; Huang, M.; Tian, P.; He, H.; Lowe, D.; Zhou, W.; Sheng, J.; Wang, F.; Bi, K.; Kong, S. Vertical characteristics of black carbon physical properties over Beijing region in warm and cold seasons. Atmos. Environ. 2019, 213, 296–310. [Google Scholar] [CrossRef]
  32. Meng, Z.; Wang, C.; Wang, X.; Chen, Y.; Li, H. Simultaneous removal of SO2 and NOx from coal-fired flue gas using steel slag slurry. Energy Fuels 2018, 32, 2028–2036. [Google Scholar] [CrossRef]
  33. Tan, J.-H.; Duan, J.-C.; Ma, Y.-L.; Yang, F.-M.; Cheng, Y.; He, K.-B.; Yu, Y.-C.; Wang, J.-W. Source of atmospheric heavy metals in winter in Foshan, China. Sci. Total Environ. 2014, 493, 262–270. [Google Scholar] [CrossRef] [PubMed]
  34. Xiang, P.; Zhou, X.; Duan, J.; Tan, J.; He, K.; Yuan, C.; Ma, Y.; Zhang, Y. Chemical characteristics of water-soluble organic compounds (WSOC) in PM2. 5 in Beijing, China: 2011–2012. Atmos. Res. 2017, 183, 104–112. [Google Scholar] [CrossRef]
  35. Tan, J.; Zhang, L.; Zhou, X.; Duan, J.; Li, Y.; Hu, J.; He, K. Chemical characteristics and source apportionment of PM2.5 in Lanzhou, China. Sci. Total Environ. 2017, 601, 1743–1752. [Google Scholar] [CrossRef] [PubMed]
  36. Tian, P.; Liu, D.; Huang, M.; Liu, Q.; Zhao, D.; Ran, L.; Deng, Z.; Wu, Y.; Fu, S.; Bi, K. The evolution of an aerosol event observed from aircraft in Beijing: An insight into regional pollution transport. Atmos. Environ. 2019, 206, 11–20. [Google Scholar] [CrossRef]
  37. Li, J.; Li, P.; Ren, G.; Yuan, L.; Li, Y.; Yang, J. Aircraft measurements of aerosol distribution, warm cloud microphysical properties, and their relationship over the Eastern Loess Plateau in China. Tellus B Chem. Phys. Meteorol. 2019, 71, 1663994. [Google Scholar] [CrossRef]
  38. Sun, T.; Wu, C.; Wu, D.; Liu, B.; Sun, J.Y.; Mao, X.; Yang, H.; Deng, T.; Song, L.; Li, M. Time-resolved black carbon aerosol vertical distribution measurements using a 356-m meteorological tower in Shenzhen. Theor. Appl. Climatol. 2020, 140, 1263–1276. [Google Scholar] [CrossRef]
  39. Ran, L.; Deng, Z.; Xu, X.; Yan, P.; Lin, W.; Wang, Y.; Tian, P.; Wang, P.; Pan, W.; Lu, D. Vertical profiles of black carbon measured by a micro-aethalometer in summer in the North China Plain. Atmos. Chem. Phys. 2016, 16, 10441–10454. [Google Scholar] [CrossRef]
  40. Zhang, Y.; Gao, Z.; Li, D.; Li, Y.; Zhang, N.; Zhao, X.; Chen, J. On the computation of planetary boundary-layer height using the bulk Richardson number method. Geosci. Model. Dev. 2014, 7, 2599–2611. [Google Scholar] [CrossRef]
  41. Zhou, L.; Tian, Y.; Wei, N.; Ho, S.-p.; Li, J. Rising planetary boundary layer height over the Sahara Desert and Arabian Peninsula in a warming climate. J. Clim. 2021, 34, 4043–4068. [Google Scholar]
  42. Ryoo, J.-M.; Pfister, L.; Ueyama, R.; Zuidema, P.; Wood, R.; Chang, I.; Redemann, J. A meteorological overview of the ORACLES (ObseRvations of Aerosols above CLouds and their intEractionS) campaign over the southeastern Atlantic during 2016–2018: Part 2—Daily and synoptic characteristics. Atmos. Chem. Phys. 2022, 22, 14209–14241. [Google Scholar] [CrossRef]
  43. Xiong, J.; Bai, Y.; Zhao, T.; Zhou, Y.; Sun, X.; Xu, J.; Zhang, W.; Leng, L.; Xu, G. Synergistic Effect of Atmospheric Boundary Layer and Regional Transport on Aggravating Air Pollution in the Twain-Hu Basin: A Case Study. Remote Sens. 2022, 14, 5166. [Google Scholar] [CrossRef]
  44. Wang, Y.; Zeng, X.; Xu, X.; Xie, F.; Zhao, Y. Improving the estimate of summer daytime planetary boundary layer height over land from GPS radio occultation data. Geophys. Res. Lett. 2022, 49, e2021GL096304. [Google Scholar] [CrossRef]
  45. Li, X.L.; Wang, Y.F.; Shen, L.; Zhang, H.; Zhao, H.; Zhang, Y.; Ma, Y. Characteristics of boundary layer structure during a persistent haze event in the central Liaoning city cluster, Northeast China. J. Meteorol. Res. 2018, 32, 302–312. [Google Scholar] [CrossRef]
  46. Deng, T.; Wu, D.; Deng, X.J.; Tan, H.; Li, F.; Liao, B. A vertical sounding of severe haze process in Guangzhou area. Sci. China Earth Sci. 2014, 44, 2307–2314. [Google Scholar] [CrossRef]
  47. Zeng, S.; Zheng, Y. Analysis of a Severe Pollution Episode in December 2017 in Sichuan Province. Atmosphere 2019, 10, 156. [Google Scholar] [CrossRef]
  48. Li, L.; Che, H.; Derimian, Y.; Dubovik, O.; Schuster, G.L.; Chen, C.; Li, Q.; Wang, Y.; Guo, B.; Zhang, X. Retrievals of fine mode light-absorbing carbonaceous aerosols from POLDER/PARASOL observations over East and South Asia. Remote Sens. Environ. 2020, 247, 111913. [Google Scholar]
  49. Duan, J.; Hu, J.; Tan, J.; Chen, H. Design of Characteristic Radar Chart and Its Application in Air Pollution Analysis. Res. Environ. Sci. 2018, 31, 1329–1336. (In Chinese) [Google Scholar] [CrossRef]
  50. Obolkin, V.; Molozhnikova, E.; Shikhovtsev, M.; Netsvetaeva, O.; Khodzher, T. Sulfur and Nitrogen Oxides in the Atmosphere of Lake Baikal: Sources, Automatic Monitoring, and Environmental Risks. Atmosphere 2021, 12, 1348. [Google Scholar]
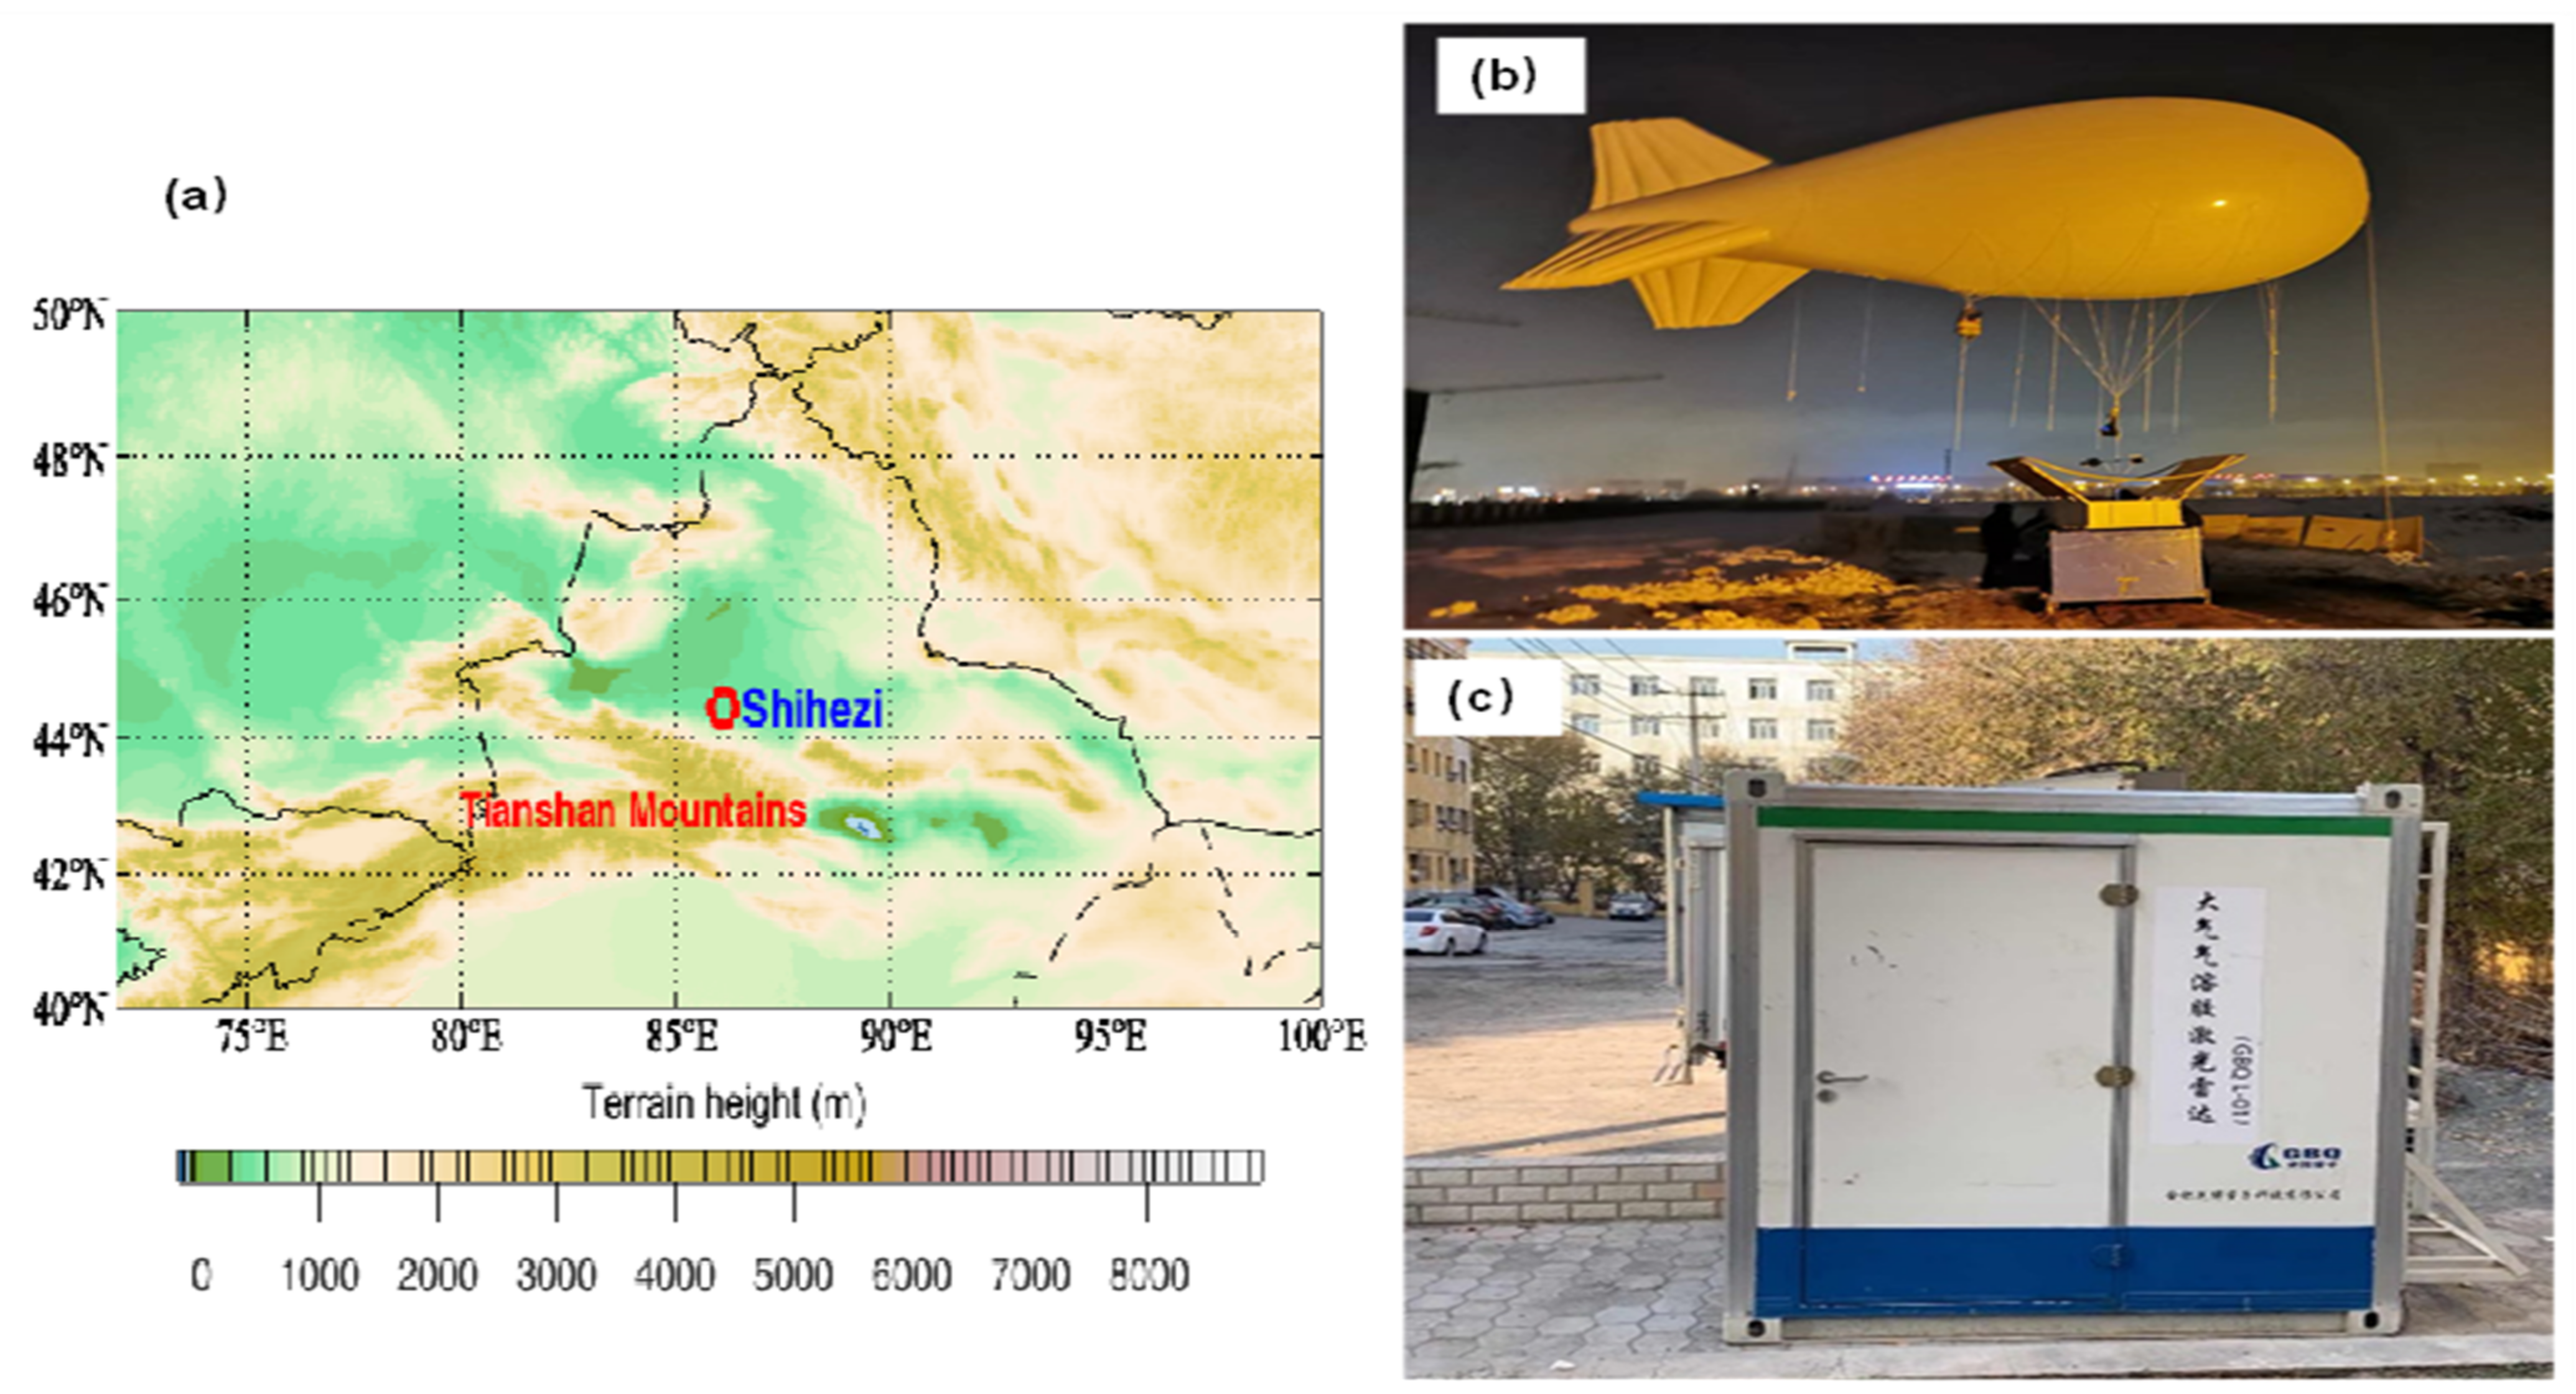
Figure 1. (a) Location map of the Tianshan Mountains, where the red circle is Shihezi; (b) the tethered airship; and (c) the Lidar system.
Atmosphere 14 01587 g001
Figure 2. Vertical distributions of temperature, RH, Ri (the red lines are the height when Ri is 0.25.), potential temperature, specific humidity, and BC at (a) 01:20, (b) 08:30, (c) 16:40, and (d) 21:30 on 1 January 2020, where the blue lines are the BLHs.
Atmosphere 14 01587 g002
Figure 3. The temporal distributions of the ground meteorological elements: (a) temperature and RH; (b) visibility; (c) surface wind; and (d) surface PM2.5. The time period between the two black lines used tethered airship detection data.
Atmosphere 14 01587 g003
Figure 4. The temporal distributions of (a) the average BLH and (b) the average visibility.
Atmosphere 14 01587 g004
Figure 5. (a) The temporal–spatial distribution of the average temperature within the BLH; (b) the temporal distribution of the Δ T, and the blue line is the average Δ T; and (c) the temporal distribution of the average solar irradiance.
Atmosphere 14 01587 g005
Figure 6. (a) The temporal–spatial distribution of the average relative humidity within the BLH; (b) the temporal distribution of the vertical relative humidity difference of 100 m, and the blue line is the average vertical relative humidity difference.
Atmosphere 14 01587 g006
Figure 7. The average temporal and spatial distribution characteristics of black carbon, where the black line represents the temporal distribution of the average BLH.
Atmosphere 14 01587 g007
Figure 8. The temporal–spatial distributions of (a) the average PM2.5 and (b) PM10; (c) the temporal distribution of the PM2.5/PM10, and the blue line is the average PM2.5/PM10.
Atmosphere 14 01587 g008
Figure 9. (a) The temporal–spatial distribution of EC and (b) the average visibility with time.
Atmosphere 14 01587 g009
Figure 10. The temporal average concentration distributions of (a) CO, (b) NO2, and (c) SO2.
Atmosphere 14 01587 g010
Figure 11. The distribution of the AQI with visibility.
Atmosphere 14 01587 g011
Figure 12. The characteristic radar maps of the different periods (a) 01:00–06:00; (b) 07:00–10:00; (c) 11:00–14:00; (d) 15:00–18:00; and (e) 19:00–23:00.
Atmosphere 14 01587 g012
Table 1. The pollution sources of different pollutants.
PollutantPollution SourcesReference
COIncomplete combustion of coal and industrial productionLi et al. [11]
SO2Coal burningMeng et al. [32]
SO2Motor vehicles and coal combustionTan et al. [33]
PM2.5Primary and secondary sourcesXiang et al. [34]
Coarse particlesBlowing sandTan et al. [35]
Table 2. The time distribution of the tethered airship detection.
TimeFrequencyTimeFrequencyTimeFrequency
06:00–08:00712:00–14:00618:00–20:009
08:00–10:001014:00–16:00620:00–22:007
10:00–12:00716:00–18:00822:00–23:0010
Table 3. Parameters of the Lidar system.
Parameter NameParameterParameter NameParameter
Transmit power≥1 mJMeasurement channel532 nm
Wavelength532 nmPulse frequency≥3 kHz
Time resolution1 minVertical resolution7.5 m
Sampling frequency20 MHzEffective detection height15 km
Table 4. The BLHs of the severe haze in other cities in China.
CityThe BLHReference
ShenyangLess than 450 mLi et al. [45]
GuangzhouLess than 500 mDeng et al. [46]
Xi’anLess than 500 mMing et al. [21]
ChengduIn the range of 150–600 mZeng et al. [47]
Disclaimer/Publisher’s Note: The statements, opinions and data contained in all publications are solely those of the individual author(s) and contributor(s) and not of MDPI and/or the editor(s). MDPI and/or the editor(s) disclaim responsibility for any injury to people or property resulting from any ideas, methods, instructions or products referred to in the content.