Article

Insight into Municipal Reactive Nitrogen Emissions and Their Influencing Factors: A Case Study of Xiamen City, China

1
School of Spatial Informatics and Geomatics Engineering, Anhui University of Science and Technology, Huainan 232001, China
2
Key Lab of Urban Environment and Health, Institute of Urban Environment, Chinese Academy of Sciences, Xiamen 361021, China
3
Xiamen Key Lab of Urban Metabolism, Institute of Urban Environment, Chinese Academy of Sciences, Xiamen 361021, China
4
University of Chinese Academy of Sciences, Beijing 101408, China
*
Author to whom correspondence should be addressed.
Atmosphere 2023, 14(10), 1549; https://doi.org/10.3390/atmos14101549
Submission received: 25 June 2023 / Revised: 1 September 2023 / Accepted: 21 September 2023 / Published: 11 October 2023
(This article belongs to the Special Issue Urban and Regional Nitrogen Cycle and Risk Management)

Abstract

:
Reactive nitrogen (Nr) has been confirmed as an indispensable nutrient for the city ecosystem, but high-intensity human activities have led to nitrogen pollution in cities, especially in coastal cities, jeopardizing ecosystem services and human health. Despite this, the characteristics and influencing factors of Nr remain unclear in coastal cities, particularly in the context of rapid urbanization. This study used the material flow analysis method to estimate Nr emissions in Xiamen from 1995 to 2018 and evaluated the characteristics of excessive Nr emissions. The STIRPAT model was used to identify and explore factors contributing to observed Nr levels in coastal cities. As indicated by the results, (1) the quantity of Nr generated by human activities increased 3.5 times from 1995 to 2018. Specifically, the total Nr entering the water environment showed a general increase with fluctuations, exhibiting an average annual growth rate of 3.1%, increasing from 17.2 Gg to 35.1 Gg. (2) Nr loads in the nearby sea increased notably from 8.1 Gg in 1995 to 25.4 Gg in 2018, suggesting a threefold augmentation compared with surface waters and groundwater. (3) NOx was the gaseous Nr with the greatest effect on the atmosphere in Xiamen, which was primarily due to fossil fuel consumption. (4) Population and per capita GDP were major factors contributing to Nr load in the water environment, while Nr emission to the atmosphere was influenced by population and energy consumption. These findings provide valuable insights for tailored approaches to sustainable nitrogen management in coastal cities.

1. Introduction

Nitrogen (N) is a fundamental component of proteins, nucleic acids, and other vital living substances [1,2]. However, the excessive use of chemical fertilizers and fossil fuels as well as high food consumption have resulted in the release of large amounts of reactive nitrogen (Nr: all species of nitrogen (N) except N2) into the environment, which has led to environmental pollution such as water eutrophication, atmospheric pollution, and acid rain [3,4]. Research has suggested that 75% of Nr production on land arises from human activities [5]. The 2030 Sustainable Development Goals (SDGs) formulated by the United Nations aim to achieve various goals, including food security, protection of the environment, and social development. The realization of many of the above-mentioned goals is closely tied to the responsible use of nitrogen [6].
In cities, Nr emissions are influenced by a wide range of factors (e.g., population, technology, and other socioeconomic factors). The rapid population growth, industrialization, and socioeconomic development that accompany urbanization can have various consequences for the environment. Urbanization and agglomeration have led to increased levels of nitrogen (Nr) emissions [7]. The anthropogenic sources of Nr in cities mainly comes from human consumption, croplands, energy consumption, and livestock processing, while N deposition is the main natural source. China continues to prioritize urbanization, particularly in the highly developed, high-income eastern coastal cities. This area encompasses 53 cities and account for almost 20% of the total Chinese population and over 40% of China’s gross regional product [8]. The increasing urbanization of coastal cities is boosting nitrogen production and emissions; thus, these cities have already become the largest anthropogenic nitrogen source worldwide [9,10]. It is essential to investigate the characteristics of Nr emission as well as its control mechanisms and influencing factors and change trends in coastal cities to address the increasingly serious problem of Nr pollution in coastal cities. This investigation is of critical significance both theoretically and practically to managing nitrogen emissions and protecting the environment.
To address the rising pollution caused by Nr, research has been conducted worldwide to explore the characteristics of Nr emissions in various cities. It has focused on several aspects such as the characteristics of Nr emissions, the effect of Nr emissions, and Nr management [11,12,13]. For example, a study conducted in Paris suggested that emissions from food consumption had tripled between 1801 and 1914 [14]. In a study on Nr emissions in Phoenix, Arizona, researchers considered the residential consumption system and specific industries in the city (e.g., the dairy and livestock sectors) [15]. In addition, domestic scholars have also conducted several studies on Nr emissions in cities such as Beijing, Shanghai, Hangzhou, and Guangzhou, analyzing Nr emissions and their driving factors [16,17,18,19]. Nevertheless, the above-mentioned studies have typically quantified Nr emissions from food consumption, while the environmental effects of Nr on air, water, and soil have not been fully determined. Therefore, further research is necessary to determine the extent of the impact of Nr emissions on the environment and to develop effective measures for Nr management.
Most researchers have focused on identifying the factors that stimulate carbon emissions using the STIRPAT model, whereas limited research has been conducted on the trend of Nr emissions. Liu and Nie [20] analyzed China’s per capita food nitrogen footprint and the effect of a wide range of socioeconomic factors on the footprint using the STIRPAT model. Furthermore, Cui et al. [21] employed the STIRPAT model to investigate the factors stimulating agricultural carbon emissions in China’s Hebei province. The STIRPAT model is effective in analyzing the driving forces behind environmental effects [22] and can help comprehensively evaluate the dynamic interplay of contributing factors and highlight the characteristic features of the macrosocial “complex coupling system” with respect to environmental effects. Previous studies on Nr emissions and their factors have generally considered urbanization, population size, per capita GDP, production structure, energy efficiency, as well as technological improvements [23,24,25,26,27]. However, the geographic and socioeconomic conditions of different cities can lead to significant variations in the factors driving Nr emissions. Understanding the changes in Nr emissions and their influencing factors is crucial, and further research is needed to account for city-specific factors.
Xiamen, a typical coastal city, is facing increasingly serious air pollution, particularly regarding Nr emissions, whose environmental effects and influencing factors remain unclear. This study aimed to achieve several objectives. First, the characteristics of Nr emission in Xiamen were analyzed. Second, we discussed the variation characteristics of Nr loads in the atmosphere and water bodies. Third, this study attempted to gain insights into the critical socioeconomic factors of Nr emissions to provide decision-makers with a more scientific basis for formulating N management policies. Furthermore, this study can contribute to sustainable city development.

2. Materials and Methods
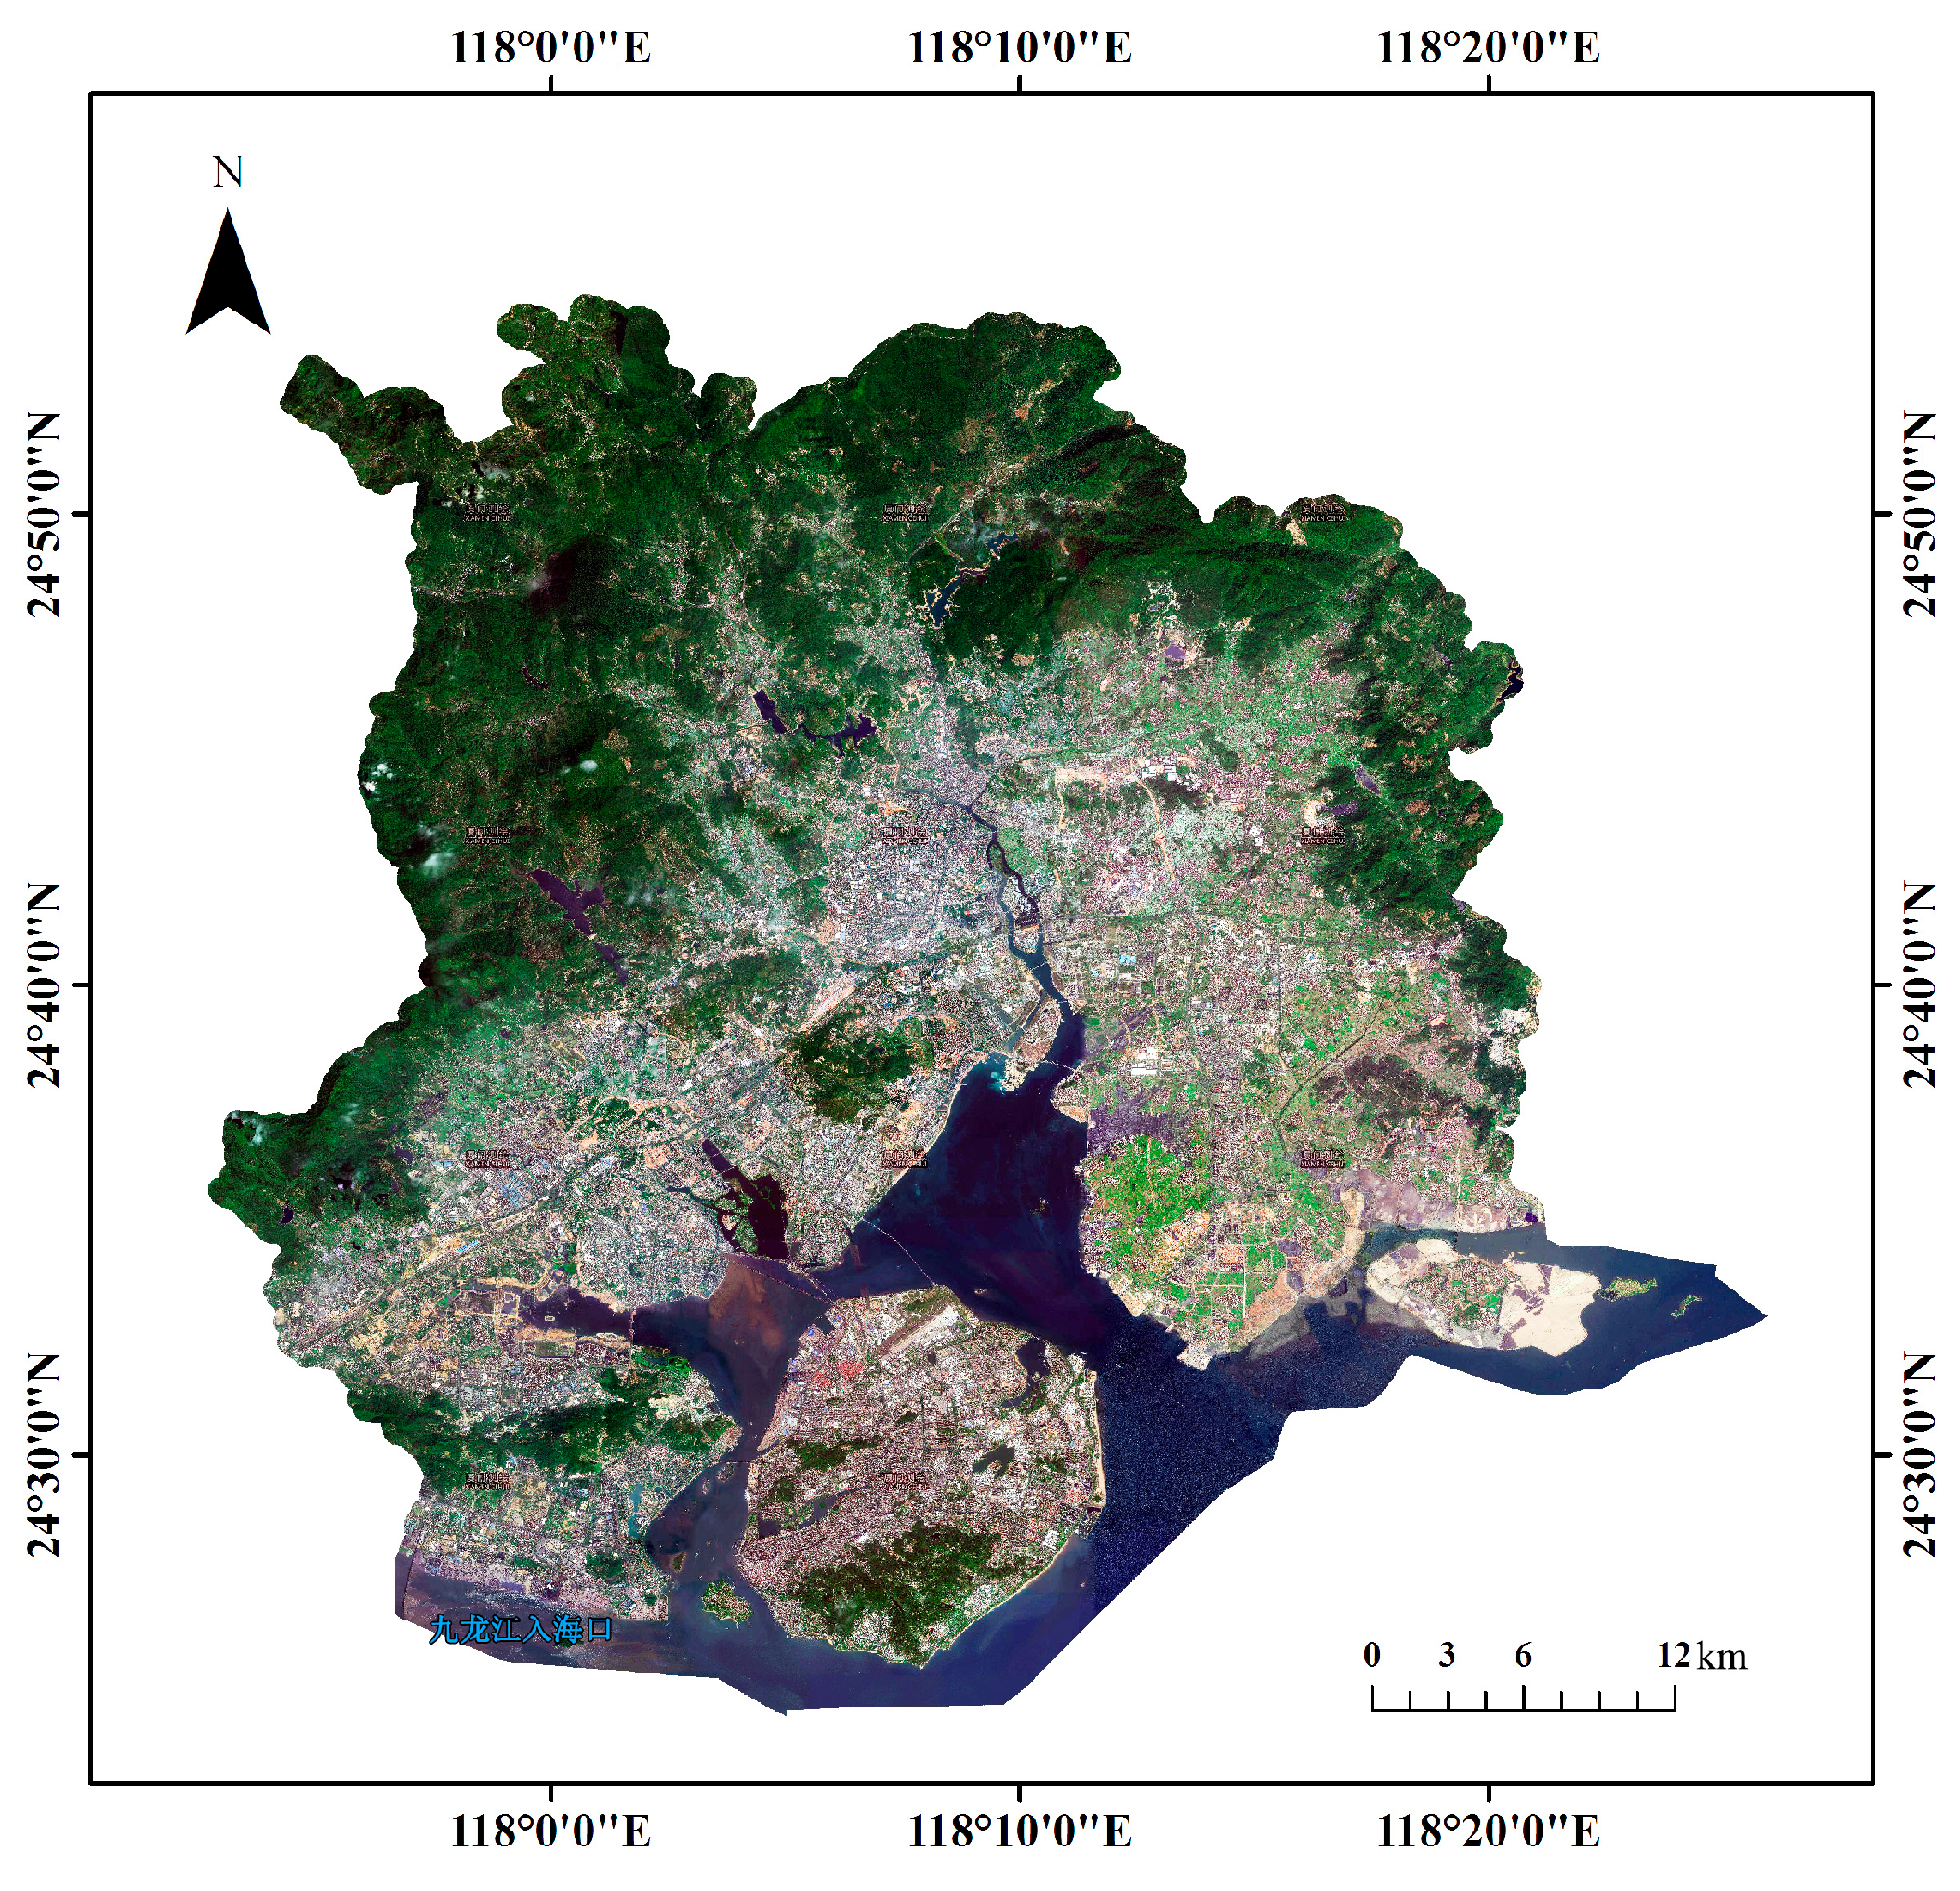
2.1. Study Area

Xiamen (117°53′–118°26′ E, 24°23′–24°54′ N) is located in the southeast of China, covering a total area of 1699.39 km2. The altitude is 63.2 m (Figure 1). Xiamen has a subtropical maritime monsoon climate with concentrated precipitation and warm temperatures. The resident population of Xiamen has increased from 1.89 million in 1995 to 4.29 million in 2020. Xiamen is characterized by a high degree of intensive human activities that consume considerable amounts of food and energy. With excessive nitrogen inputs, nitrogen pollution has grown more serious. Xiamen’s booming economy and rapid urbanization have changed its land use distribution. In 2020, the urban residential land, industrial land, and transportation land accounted for 37.2% and were concentrated on the island; the most of forest land, agricultural land, and other land took up 62.8% of Xiamen, and these lands were extensively distributed in the surrounding areas. With the continuous acceleration of urbanization in Xiamen, the urbanization rate was elevated from 62.7% in 2005 to 89.4% in 2020. According to the results of monitoring surface water nitrogen concentration from 2004 to 2016, provided by the monitoring station of the Xiamen Environmental Protection Bureau, it was found that major rivers in the area had excessive levels of nitrite and ammonia nitrogen. Furthermore, from 1995 to 2015, the concentration of inorganic nitrogen in the nearby sea of Xiamen increased from 0.35 mg L−1 to 1.34 mg L−1 [28].

2.2. Data Sources

In this study, socioeconomic data on Xiamen from 1995 to 2018 were collected from several published government sources (e.g., the Yearbook of the Xiamen Special Economic Zone (1997–2019) and the Xiamen Ecological Environmental Quality Bulletin). The parameters of Nr emission primarily originated from the published literature, government departments, and experiments. The detailed parameters of this study are elucidated in the Supplementary Materials (Tables S1–S30).

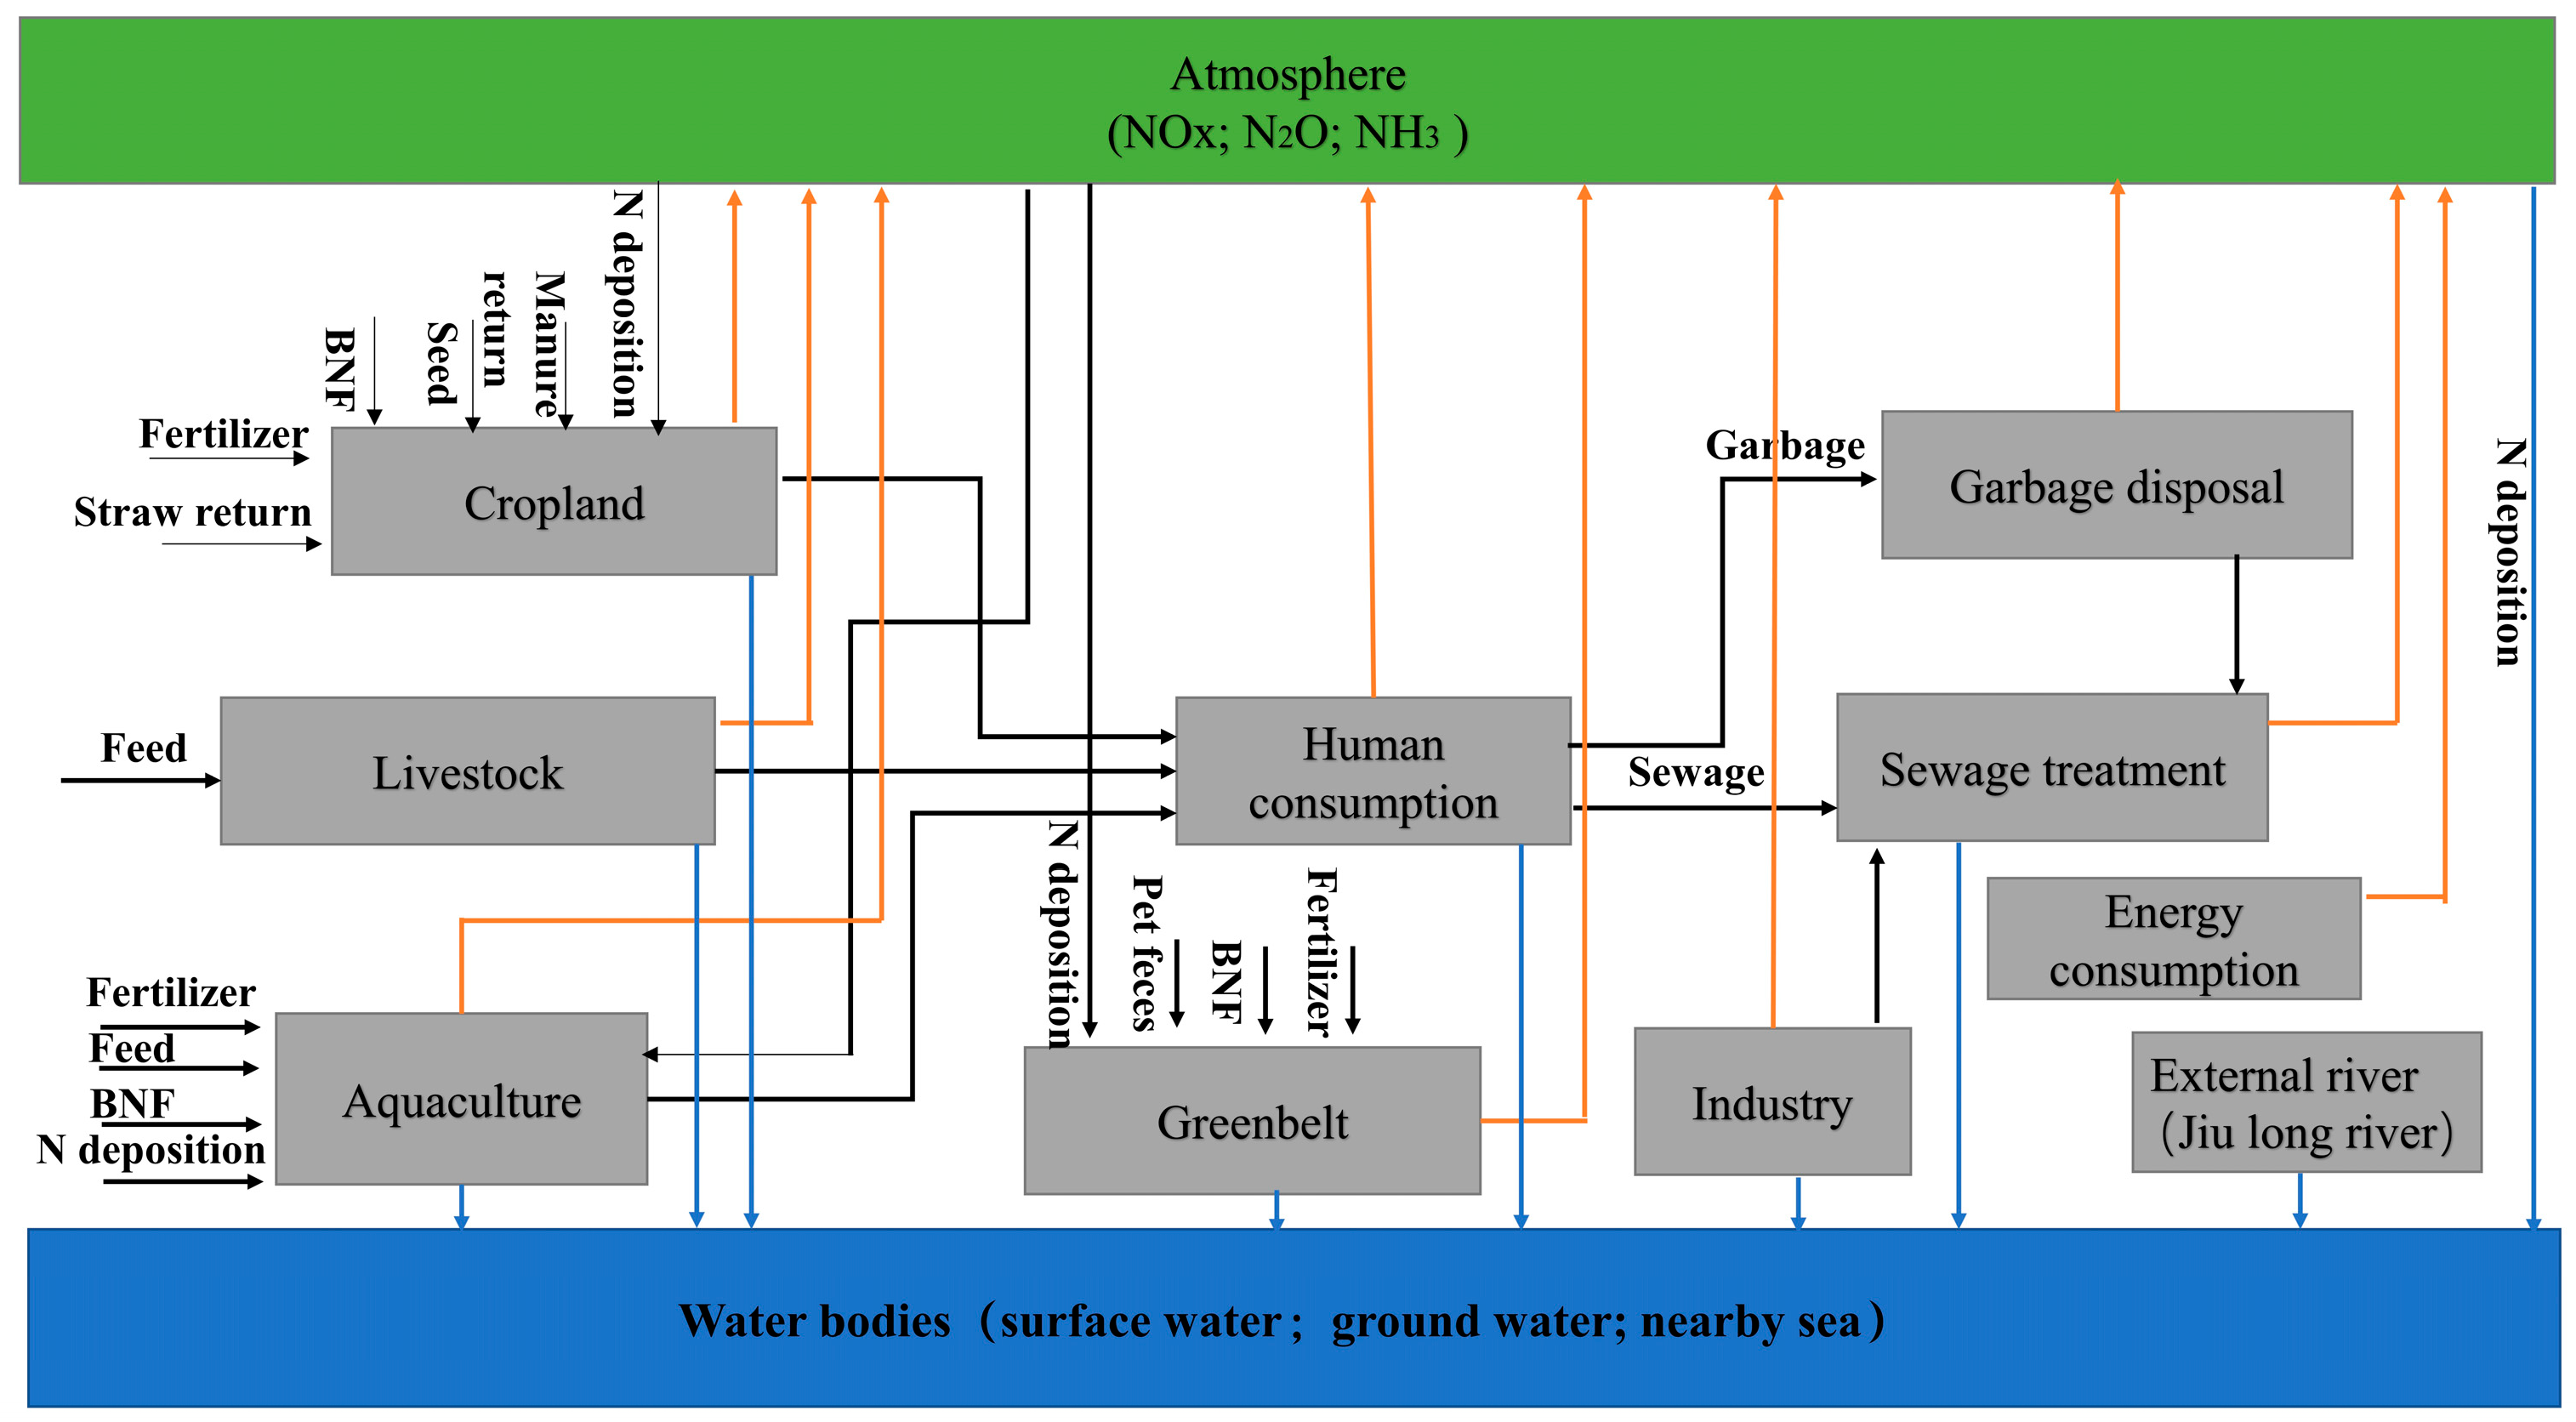
2.3. Reactive Nitrogen (Nr) Calculations

Different systems can generate varying levels of nitrogen that affect the environment in different ways. The systems that primarily affect water bodies include croplands, livestock, aquaculture, greenbelts, industry, sewage treatment, and garbage disposal (Figure 2). Moreover, Nr emissions from the above-mentioned systems also have a certain negative effect on the atmospheric environment. Nitrogen oxide emissions are increasing, notably in economically developed areas. In this study, NOx, NH3, and N2O emissions were considered the main gaseous Nr forms in the atmosphere. In general, systems that exerted a certain effect on the atmosphere comprised croplands, livestock, aquaculture, greenbelts, sewage treatment, and garbage disposal. The calculation formulas for the nitrogen flow and Nr emissions of each system are detailed in the Supplementary Materials (Equations (S1.1)–(S11.2)).

2.4. Influencing Factor Analysis Model

2.4.1. STIRPAT Model

The effects of demographic (P), economic (A), and technological (T) factors on the environment are mainly postulated in the IPAT model [29]. The IPAT model is reformulated into a stochastic model (STRIPAT), so that the nonmonotonic or nonproportional effects of driving forces on the environment can be statistically evaluated [30]. The STRIPAT model has been successfully adopted to analyze the effects of driving forces on a variety of environmental effects [31,32], which is expressed as:
I it = α P it b A it c T it d ε it
After taking logarithms, the model takes the following form:
L n l i t = a + b L n P i t + c L n A i t + d L n T i t + ε i
where suffixes i and t denote country and years, respectively; P expresses population size; A is real GDP per capita; T represents technology; the dependent variable I denotes pollutant emissions; εi is the error term, a is the constant term; and b, c, and d are the coefficients of P, A, and T, respectively.
The STRIPAT model refers to a nonlinear model with multiple dependent variables. By implementing an index, the model is capable of analyzing the nonproportional effects of factors on the environment. Besides the three variables already covered in the model, any other detrimental factor that affects the environment can be introduced for in-depth examination. The coefficients of the STRIPAT model represent the elasticity relationship between the independent and dependent variables. For instance, an environmental effect will result in changes of a%, b%, and c%, respectively, if a 1% change exists in the driver (PAT). a, b, and c equal to 1 indicate a proportional change in the environmental effect and the driver (PAT) at a constant ratio. A coefficient greater than 1 reveal that an increase in socioeconomic factors leads to a higher rate of environmental change. A coefficient over 0 and less than 1 reveals that increasing socioeconomic factors leads to a rise in the rate of environmental change but at a slower pace than the driving force. However, a coefficient less than 0 implies that increasing socioeconomic factors is conducive to reducing the environmental effect. Based on the STIRPAT model, this paper utilizes the ridge regression analysis method to fit independent variables and dependent variables through regression. This method is deemed more compatible and stable compared to the least-squares method employed in previous research studies.

2.4.2. Model Indicator Selection

In this paper’s STIRPAT model, the “I” variable representing environmental factors is the total amount of Nr emissions. The wealth factor (A) is represented by the per capita GDP index. The variable P is further broken down into two indicators: Xiamen residents (P1), and urbanization level (P2) (the percentage of built-up areas in the entire region). The technical indicator T is also separated into two indicators: energy consumption (T1) and industrial structure (T2). Energy consumption is defined as the amount of standard coal consumed per unit of GDP production, while industrial structure refers to the percentage of secondary industry. This paper utilizes ridge regression analysis to fit the STIRPAT model and comprehensively explores the factors affecting Nr emissions in the water and atmospheric environment.

2.4.3. Mann–Kendall Test and Theil–Sen’s Slope Estimator

The Mann–Kendall test is typically used to detect the presence of a temporal trend when analyzing environmental data. Thus, the test can be viewed as a nonparametric test for zero slope of the linear regression of time-ordered data versus time. The calculation of the Mann–Kendall test statistic can be found in previous research [33,34]. As for the results, when the Z value is negative, a falling trend is recognized, and when the Z value is positive, a rising trend is discerned. At a significance level of 0.05 (0.01, 0.001), Z > 1.96 (2.58) and Z < −1.96 (−2.58) indicate significant increasing and decreasing trends, respectively [35].
Theil–Sen is a nonparametric alternative to ordinary least-squares regression. Sen’s slope has an advantage compared to linear regression, in that the test is not affected by the number of outliers and data errors [35]. The Sen’s slope equation is written as follows:
β = M e d i a n ( x j x i i j )
where x i and x j are the data values at time i and j (i > j), respectively. When β is greater than zero, it indicates a growth trend, while the opposite indicates a decreasing trend.

3. Results

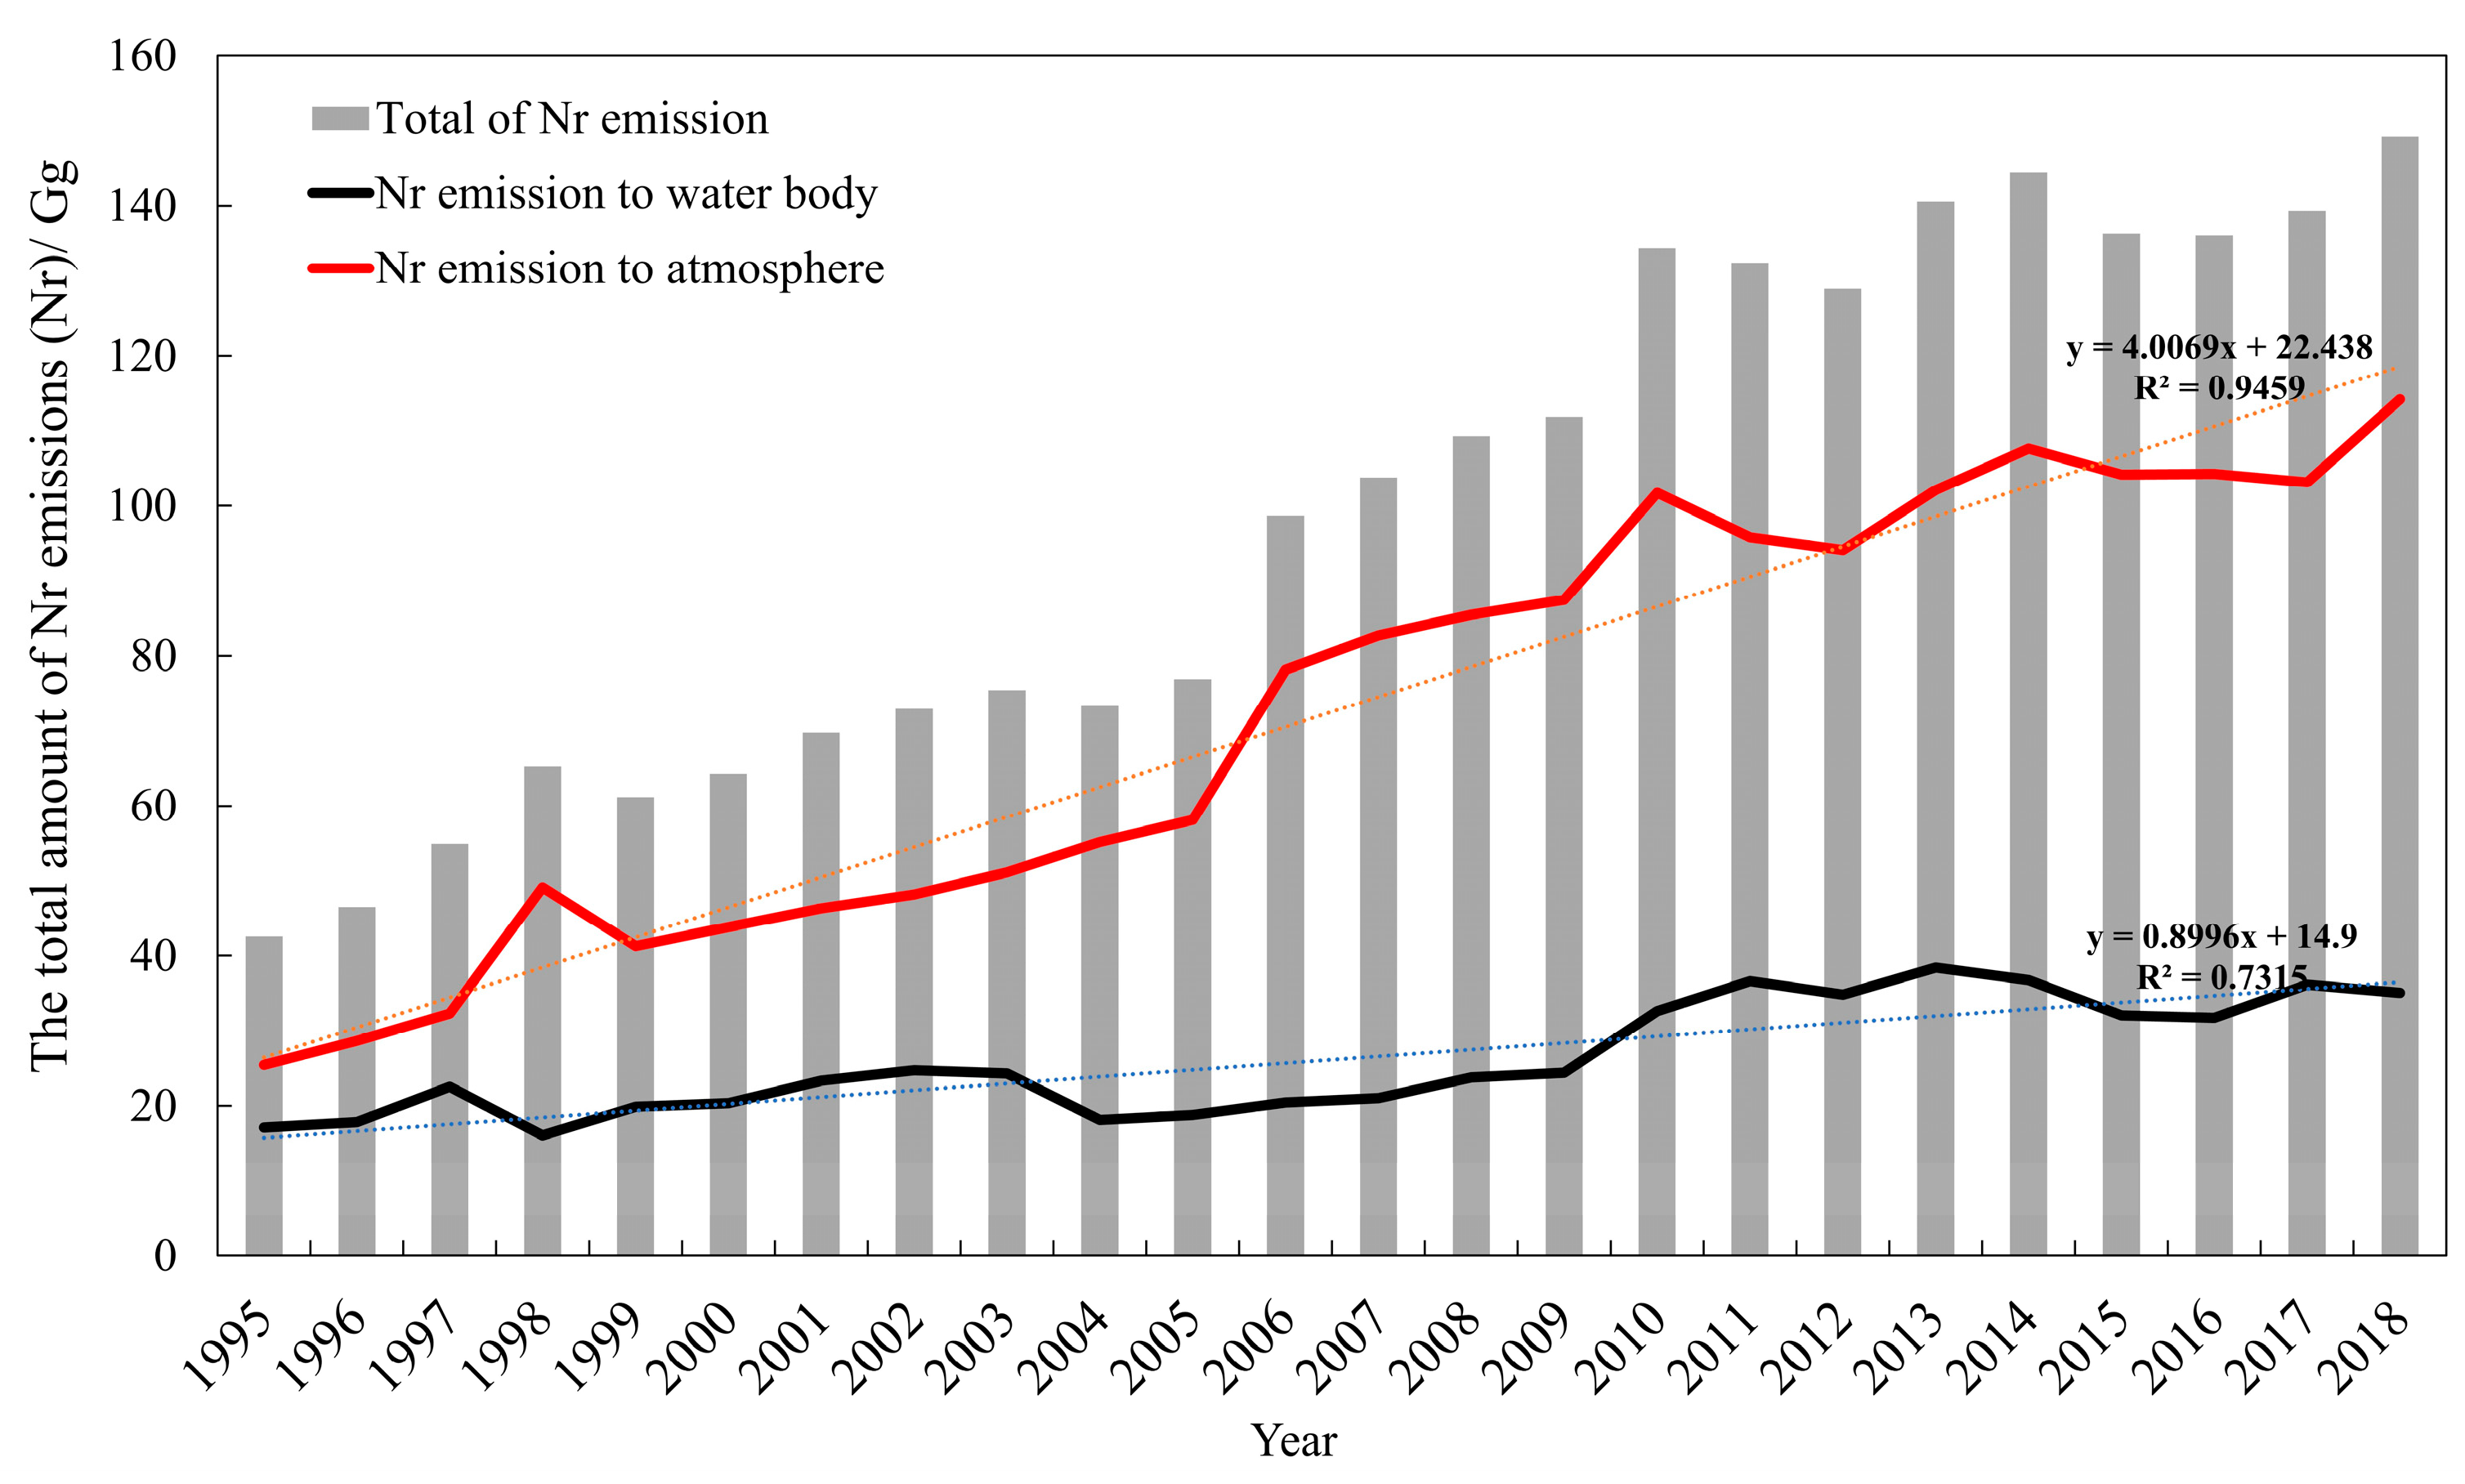
3.1. The Characteristics of Reactive Nitrogen (Nr) Emissions

Human activities have a considerable impact on the water and air environments of a city, with varying effects depending on the amount of Nr produced. Analysis of time series data reveals that the release of Nr into water bodies and the atmosphere undergoes unique changes with the process of urbanization (Figure 3). By estimating the Mann–Kendall test and Theil–Sen’s slope estimation at a 99% confidence level (Z > 2.58, p < 0.001) (Table 1), we found that the total of Nr emissions from anthropogenic activities tended to increase significantly, going from 42.6 Gg in 1995 to 149.2 Gg in 2018. Moreover, the amount of Nr released into the atmosphere far exceeded that released into water bodies. Nr loads released into water bodies tended to fluctuate, increasing from 17.2 Gg in 1995 to 35.1 Gg in 2018, with an average annual increase rate of 3.1%. On the other hand, Nr loads released into the atmosphere increased from 25.4 Gg in 1995 to 114.2 Gg in 2018, with an average annual increase rate of 6.7%. The Nr released into the atmosphere accounts for over half of the total Nr emissions resulting from anthropogenic activities.

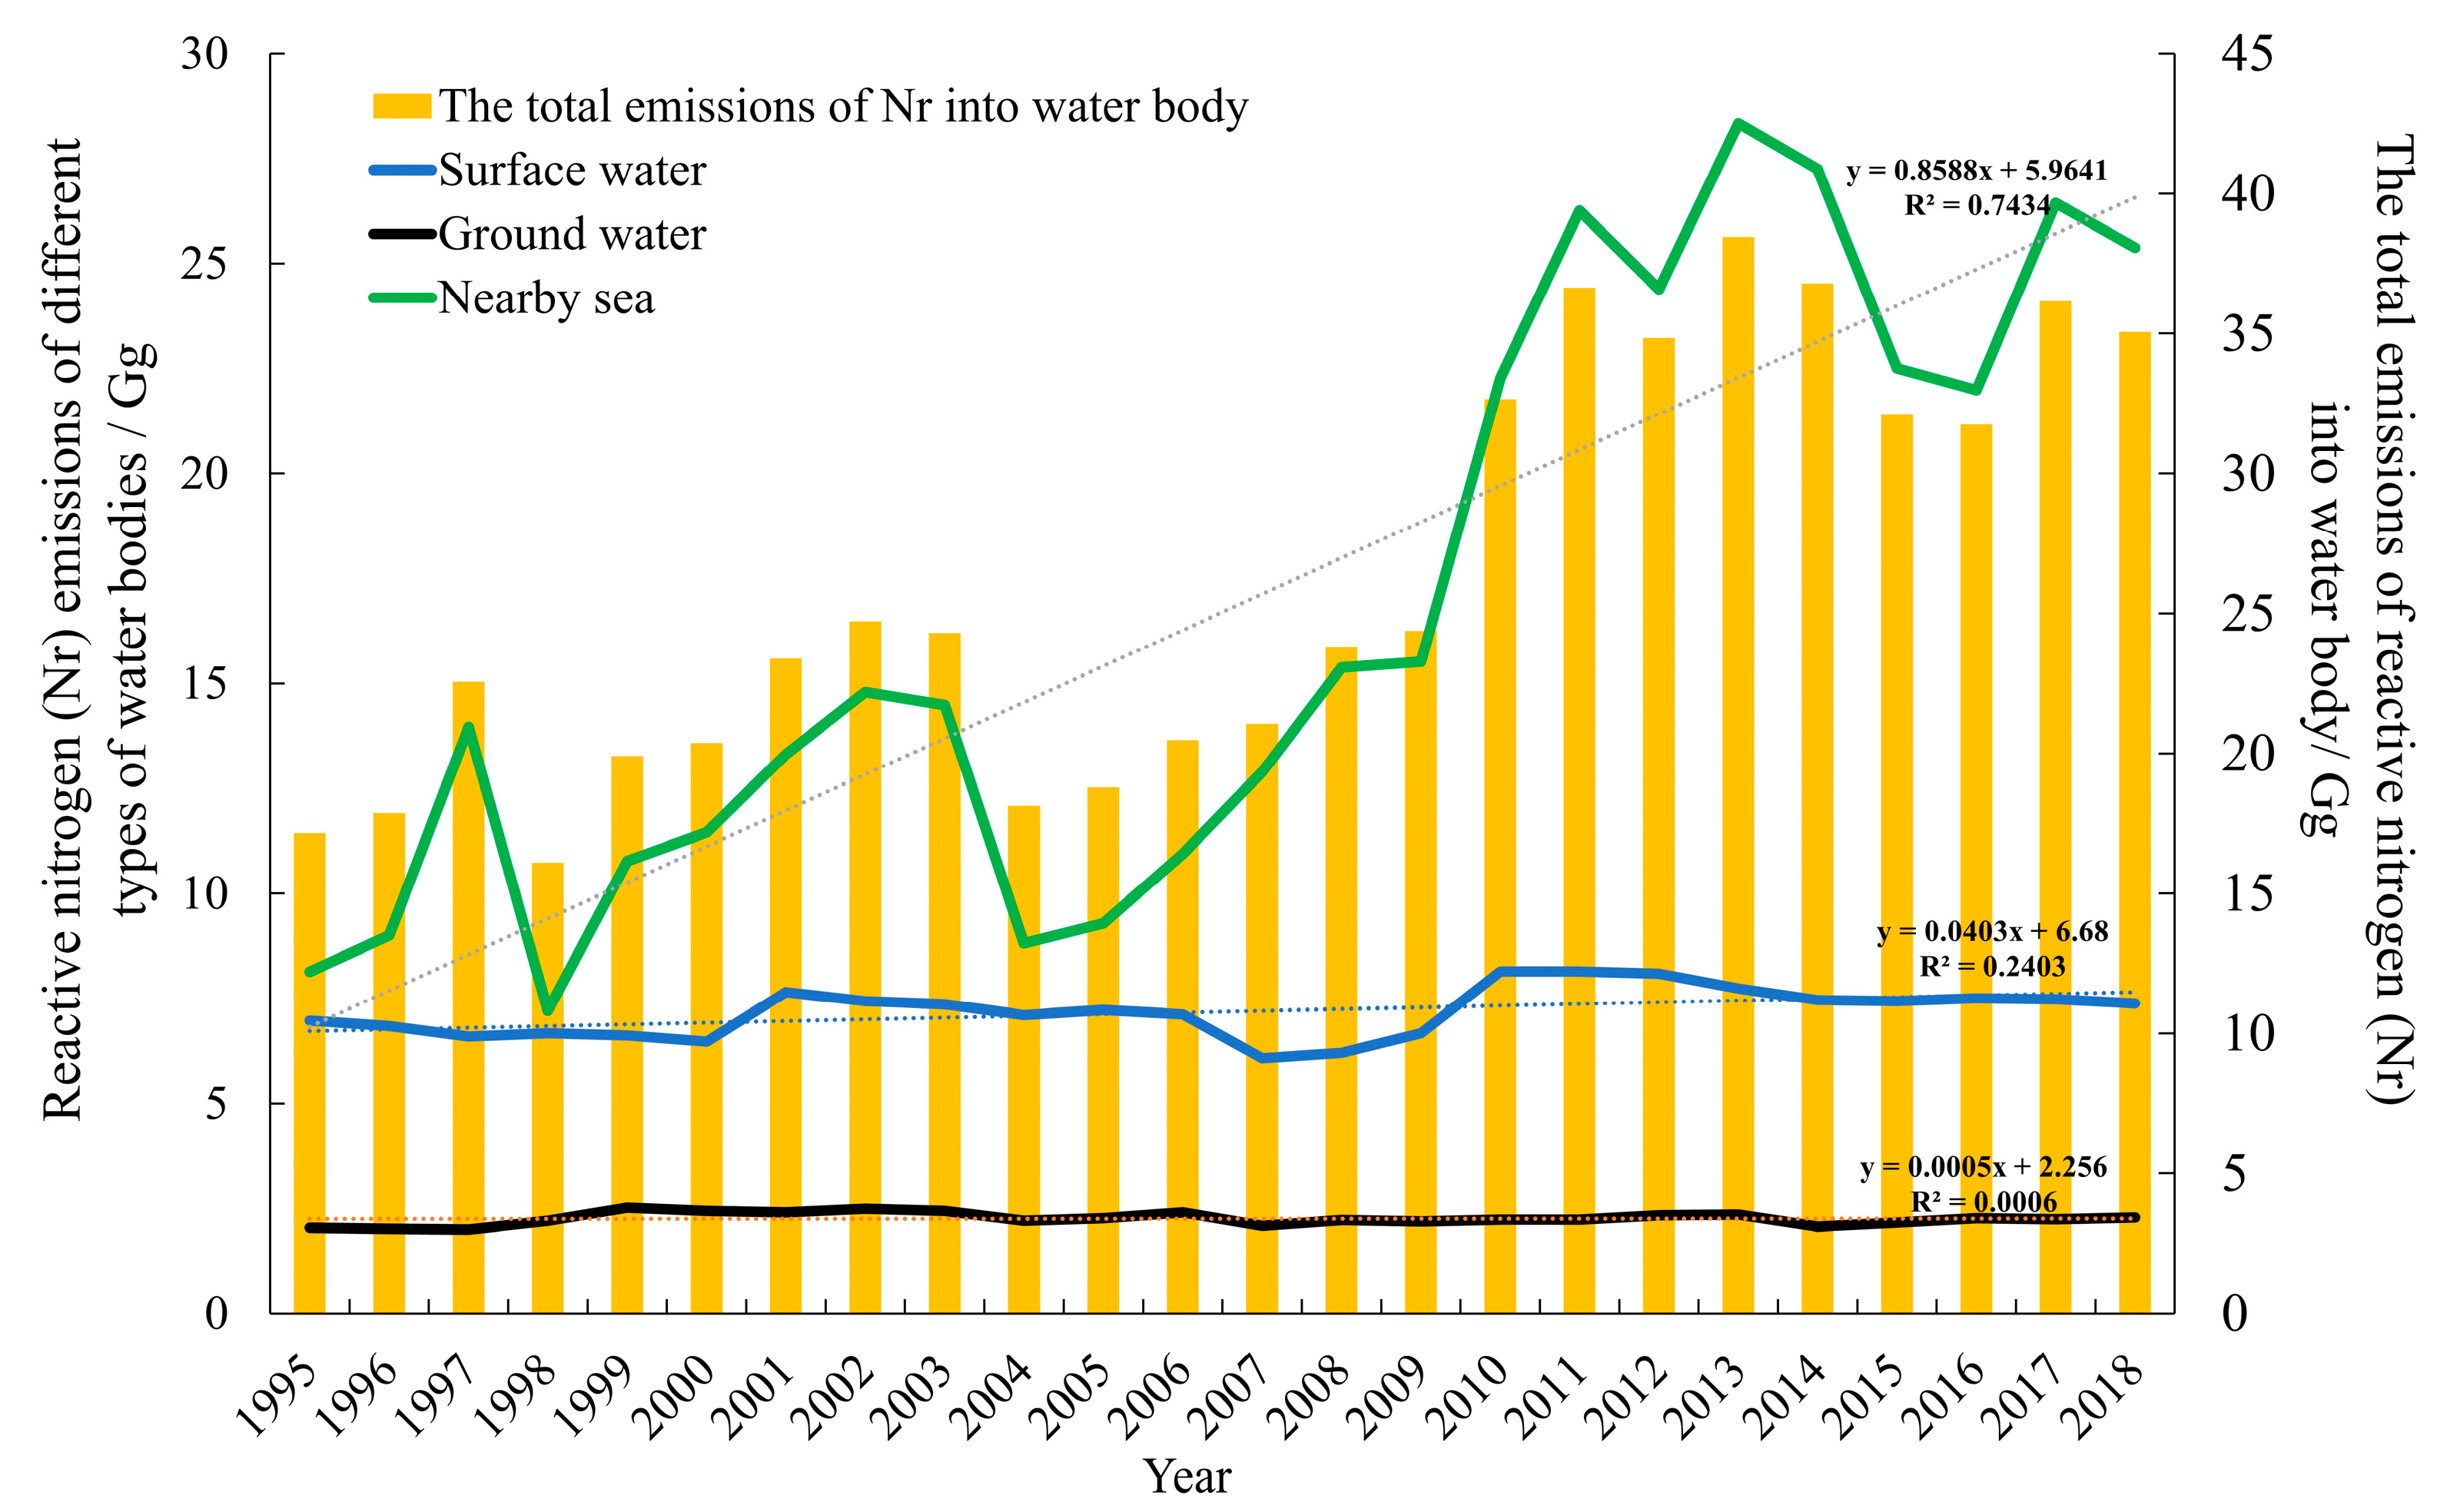
3.1.1. Characteristics of Nr Emission to Water Bodies

In general, the water bodies in this study comprised surface water, groundwater, and the nearby sea. All types of water bodies were affected by Nr emissions from different systems in the city, and the trends of Nr loads differed between the above-mentioned water body types from 1995 to 2018 (Figure 4). During urbanization, anthropogenic nitrogen (Nr) discharges exceeded those from natural sources, leading to severe effects on water body quality. By estimating the Mann–Kendall test and Theil–Sen’s slope estimation at a 99% confidence level (Z > 2.58, p < 0.001) (Table 1), the total Nr loads in Xiamen’s water bodies showed a fluctuating increasing trend between 1995 and 2018, with an average annual growth rate of 3.2%, increasing from 17 Gg to 35 Gg. While Nr loads in surface water bodies showed no significant changes during the period from 1995 to 2018, Nr loads in surface water bodies increased from 6.9 Gg to 8.1 Gg during 1995–2012 and decreased from 7.7 Gg to 7.4 Gg from 2013 to 2018. However, as Xiamen is a typical coastal city, Nr pollution in nearby seas became more serious. As the river upstream carried considerable Nr into Xiamen’s nearby sea, the Nr loads in nearby seas increased, from 8.1 Gg in 1995 to 25.4 Gg in 2018—three times higher than the Nr in surface waters and groundwater in this 23 year-period. Furthermore, most Nr pollutants originated from the upstream of the external river (Jiulong River).
The results of this study revealed differences in the contribution ratios of various systems to the Nr loads in water bodies in the city; different water bodies were affected by Nr emissions from the respective systems. In addition, different characteristics and trends were displayed from 1995 to 2018 (Figure 5). Surface water bodies in the city were affected by various systems (Figure 5a). To be specific, the contribution of Nr emissions to surface waters from cropland systems decreased, from 20.2% in 1995 to 6.3% in 2018, marking a threefold decrease. Moreover, industrial systems contributed to 37.5% of Nr loads in surface water in 1995, which declined to 1.6% in 2018, with an average annual decrease of 4.5%. Furthermore, the contribution of livestock systems to Nr loads in surface water showed a gradual decline, with an average annual decrease of 3.6%. However, the contribution of N deposition to surface water progressively increased, and it emerged as a major source of Nr pollution in surface water. From a contribution ratio of 15% in 1995, N deposition in surface water rose to 65% in 2018, marking a 4.3-fold increase over the following 23 years.
The nearby sea environment of Xiamen, a typical coastal city located at the mouth of the Jiulong River, is affected by Nr inputs from a wide variety of inland subsystems and Nr inputs from external rivers, like the Jiulong River (Figure 5b). As revealed by this study, external rivers were the primary source of Nr loads in the nearby sea, contributing to an average annual ratio of 60% from 1995 to 2018. Sewage treatment and surface water served as the main inland sources of Nr loads. The contribution ratio of Nr emissions from sewage treatment systems in the nearby sea was elevated from 6.1% in 1995 to 12.7% in 2018.
The discharge of Nr from different systems in the city can substantially affect groundwater bodies (Figure 5c). The reduction in cropland area led to a decrease in N fertilizer leaching to groundwater over the past few years. Moreover, the percentage of N fertilizer in groundwater declined from 88% in 1995 to just 10% in 2018, marking an overall decrease of approximately eight times. However, the impact of sewage treatment systems on groundwater was found to have grown. On average, there was an annual increase of 10.9% in Nr loads. The increasing workload of the sewage treatment system and aging sewer pipes were the primary causes of Nr leakage from the sewage treatment system into groundwater bodies. Furthermore, there was an increase in Nr contaminants that leach into groundwater from the greenbelt system, whose contribution to the overall Nr load was elevated from 2.7% in 1995 to 26.3% in 2018. The reason for the above result is the development of Xiamen as an ecological city, leading to an average annual increase of 12.1% in greenbelt area, as well as an increase in pet feces.

3.1.2. Characteristics of Nr Emission to the Atmosphere

Anthropogenic Nr emissions change the nitrogen cycle in cities, adversely impacting not only water bodies but also the atmosphere, and this issue is becoming more severe. The atmospheric Nr forms primarily responsible for the damage comprised NH3, NOx, and N2O. By estimating the Mann–Kendall test and Theil–Sen’s slope estimation at a 99% confidence level (Table 1), we found that NOx presented a significant increasing trend, while N2O presented a decreasing trend. NOx emissions exerted the greatest effect, accounting for nearly 80% of the city’s overall Nr emissions (Figure 6a). The second-greatest emission was NH3, primarily originating from ammonia volatilization in croplands and livestock systems. Although N2O accounted for a relatively small proportion, it is the third most critical greenhouse gas after CO2 and CH4, with a warming potential 298 times that of CO2 and contributing to 8% of greenhouse gas emissions [36].
Additionally, there were substantial variations in gaseous Nr emissions among different systems (Figure 6b). From 1995 to 2018, Nr emissions from energy consumption tended to increase, becoming the primary contributor to Nr emissions in city ecosystems. Furthermore, Nr emissions from human consumption, sewage treatment, and garbage disposal systems also increased, although this increase was at a slower rate. In contrast, the aggregate amount of Nr produced by cropland systems tended to decline over the same period.

3.2. Analysis of Influencing Factors on Nr Emission

3.2.1. Analysis of Influencing Factors on Nr Emission into Water Bodies

According to the STRIPAT model and ridge analysis, the goodness of fit (R2 value) of the model was 0.752 and the model met the requirements. This indicated that the independent variable explained 75.2% of the variation in the dependent variable (Table 2). Moreover, the equation’s F value was 8.6, and it was statistically significant at 0.001 level, indicating that the ridge regression equation could withstand the 99% significance test. This result indicated that population size, wealth, and urbanization had a positive impact on environmental Nr load, with both linear and elastic effects. Environmental pressure increased with the rise in population size, which was found to determine the amplitude of the environmental Nr load. An increase in population size increased environmental pressure. The elasticity coefficient, which ranged from 0 to 1, suggested that an increase in these factors could lead to environmental changes worsening faster than the driving force. Specifically, for every 1% increase in population, Nr load in water bodies increased by 0.17%, making population explosion a potential factor for the Nr load in Xiamen’s water bodies. Similarly, per capita GDP had a positive linear effect on water environmental pressure, with a 1% increase resulting in a 0.16% increase in liquid Nr emissions. However, in comparison to population and GDP, industrial structure showed a negative correlation with Nr emissions. The primary reason for this result is the decline of traditional industries and the rise of tertiary and high-tech industries. Improving industrial structure could have a positive impact on reducing Nr emissions into the water environment.

3.2.2. Analysis of Influencing Factors on Nr Emission to the Atmosphere

A ridge analysis was conducted according to the STRIPAT model using population, industrial structure, energy consumption, and GDP per capita as independent variables and gaseous Nr emissions as the dependent variable. The results indicated an R2 value of 0.932 and the model met the requirements. This indicated that the independent variable explained 93.2% of the variation in the dependent variable (Table 3). The primary factor driving this increase was the growing population. Moreover, the city’s energy consumption rose at a rate of 2.9% per year, which had a direct impact on gaseous Nr emissions. In fact, for every 1% increase in energy consumption, there was a corresponding 0.91% increase in emissions. Additionally, per capita GDP had a linear positive effect on the environment, with a 1% increase in per capita GDP resulting in a 0.31% increase in gaseous Nr emissions. In comparison to the aforementioned factors, Xiamen’s industrial structure had a suppressing effect on gaseous Nr emissions. Over the years, the proportion of the secondary industry in Xiamen declined by an average of 4.6% annually. Furthermore, the secondary industry transitioned into high-tech industries, which can help reduce the nitrogen pollution caused by heavy industries in the region.

4. Discussion

Nr emissions have increased significantly due to anthropogenic activities over the past few decades, particularly in coastal cities, which is expected to adversely affect the environment of the above-described cities. Accordingly, the sources of Nr emissions and the factors that contribute to their increase in coastal areas should be explored. This study aimed to conduct a systematic analysis of the effect of human activities on Nr emissions and examine the environmental effects arising from such emissions to more effectively curb and manage nitrogen pollution. The results suggested an increase in Nr emissions from coastal cities in recent years, with gaseous Nr emissions outweighing the amount entering the water environment, thus triggering a growing problem of Nr pollution in the atmosphere. Most Nr emissions have originated from energy systems, cropland systems, and human consumption systems. Moreover, socioeconomic factors (e.g., population) have affected Nr emissions. The above-mentioned findings reveal the importance of identifying the key systems and critical factors of Nr emission to effectively reduce nitrogen pollution in cities. In brief, a substantial difference was found between the environmental effects of Nr emissions from different systems in cities, and action should be taken to alleviate this issue.
In Xiamen, the level of Nr entering water bodies tended to fluctuate and increase. This result is in good agreement with the actual change in nitrogen concentration in surface water. Previous studies found that according to the results of monitoring nitrogen concentration in surface water in Xiamen from 2004 to 2016, nitrite and ammonia nitrogen in major streams and surface water in the territory seriously exceeded the standard. The average nitrogen concentration in surface water showed a fluctuating increasing trend, and the nitrogen concentration in surface water showed a significant linear positive correlation with Nr load [37]. The variation in Nr load in surface water bodies is influenced by multiple systems. Among them, the agricultural system made the largest contribution during the period from 1995 to 2012, resulting in an increasing trend of Nr load in surface water bodies due to the extensive use of nitrogen fertilizers. However, from 2013 to 2018, the urbanization process accelerated and the area of grain cultivation decreased. As a result, there was a reduction in wastewater discharge from the agricultural system. Furthermore, policies had an impact on the livestock and aquaculture systems in Xiamen, leading to a continuous decrease in Nr emissions from 2013 to 2018. This ultimately resulted in a decrease in wastewater discharge and subsequent fluctuations in Nr load in surface water bodies. In addition, in our study, we also found severe levels of Nr pollution in the nearby sea. The coastal city’s nearby sea is affected by outside rivers. In the upstream of the Jiulong River, the development of industries (e.g., pig breeding and crop cultivation) led to the elevation of pollution levels [38]. Existing research has suggested that Nr pollutants from the Jiulong River have resulted in elevated pollution levels in the sea near Xiamen since the 1990s. Human activities (e.g., fertilizer application and pig breeding) in the upstream of the Jiulong River have disrupted the biogeochemical processes expediting N cycling [39,40]. The above result is confirmed by the frequent occurrence of red tides in the waters of Xiamen over the past few years. Thus, local sources of pollution should be controlled and inter-regional cooperation should be developed in the future management of pollutants in the nearby sea.
The source of Nr pollution that exerts the greatest effect on surface water has changed from the cropland system to N deposition. Consequently, the contribution of N deposition to Nr loads in surface water in Xiamen increased by 4.3 times over the 23 years analyzed in this study. The increased deposition of atmospheric nitrogen was closely correlated with the large number of nitrogen oxides generated by energy consumption processes in the local region, as well as the dispersion of N pollutants attributed to the socioeconomic development of the surrounding region [41]. The above-described nitrogen oxides primarily originate from fossil fuel combustion in cities while accounting for a larger share of anthropogenic Nr emissions [42]. In addition, given that, as indicated by statistics, energy consumption in Xiamen has increased by 2.5 times over the last decade, it is concerning that half of the nitrogen oxide and ammonia nitrogen emissions eventually return to the land and water bodies of the city’s ecosystems in the form of a deposition. This N deposition has contributed to eutrophication in surface water bodies. It can break the material cycle and energy flow of the surface water ecosystem, so that the stability of surface water ecosystems can be seriously affected [43]. As revealed by this study, sewage treatment and greenbelt systems in city ecosystems more notably affect groundwater. The overloading of the sewage treatment process and the aging of sewage pipes have been confirmed as the main reasons for the leakage of N pollutants into groundwater bodies [44]. Moreover, since Xiamen strives to become an ecological and green city, the greenbelt area has achieved an annual average growth of 12.1%. However, the extensive use of artificial fertilizers on the greenbelt, coupled with the rising amount of pet waste being discarded in the area, can trigger an escalation of N pollutants seeping into groundwater [45].
The release of significant amounts of Nr adversely affected the water bodies and the air environment. This study suggested that Nr emissions resulting from energy consumption tended to increase and turned out to be the most critical contributor to Xiamen’s Nr emissions into the atmosphere from 1995 to 2018. This result is consistent with existing research, which states that energy consumption has become the most important source of gaseous Nr emissions in cities [46,47]. NOx has accounted for the production of most gaseous Nr resulting from energy consumption, notably in cities. The total emissions of NOx at the city level have been substantially greater than those at the global and national levels [48,49,50]. On that basis, the regulation of sectors that emit higher NOx levels (e.g., transportation services) should be prioritized in the future. Cities should develop effective NOx control mechanisms that primarily target reducing motor vehicle emissions in the future [51].
In the atmosphere, NH3 has been reported as a critical nitrogen-containing gas and also an alkaline gas. As revealed by previous studies, the majority of NH3 present in the atmosphere arises as a result of the livestock system and the application of N fertilizers, accounting for 39% and 17% of the total Nr, respectively, on the global scale [42,43,44,45,46,47,48,49,50,51,52,53]. It is noteworthy that China is a large agricultural producer, and nitrogen fertilizer application remains the largest contributor to NH3 emissions on the national scale [54]. Unlike on the global or national scale, in Xiamen, a typical coastal city, NH3 emissions primarily originate from croplands and energy consumption systems. NH3 can be employed as a catalyst for secondary aerosols, and it takes on critical significance in atmospheric physicochemical reactions. Additionally, it can neutralize acidic gases, so that the acidity of clouds and aerosols can be affected [55]. Accordingly, it is imperative to adopt a more reasonable and scientific farming method that is capable of increasing the utilization rate of nitrogen fertilizer and the rate of straw return.
N2O is a critical greenhouse gas, and although it is the least emitted compared with other forms of gaseous nitrogen (NH3, N2O), it is still not negligible in city ecosystems. Globally, N2O emissions from soils contribute the most to N2O in the atmosphere [56]. In contrast, this study suggested that N2O emissions from the cropland system accounted for two-thirds of the total gaseous Nr emissions in Xiamen. Subsequently, the sewage treatment system followed. N2O emissions in the sewage treatment system were attributed to the biochemical actions of nitrifying and denitrifying bacteria. The above-mentioned N2O emissions increase during the sewage treatment process [57]. Thus, in the future, the focus should be placed on updating sewage treatment technologies to increase N removal rates while reducing greenhouse gas emissions in Xiamen.
The influencing factors for Nr loads in water bodies, i.e., population and urbanization levels, are crucial in Xiamen. However, as for Nr loads in the atmosphere, population and energy consumption are the main factors. This finding further confirms that global population growth is one of the critical drivers of long-term changes in nutrient cycling [58]. As revealed by existing research, population, economic development, urbanization, agricultural patterns, and per capita GDP are the main factors for Nr emission to the environment [59,60,61]. The variations in environmental Nr loads identified in this study were likely the result of social factors, economic development, and population changes. In particular, as a developed coastal city, the local industries and energy consumption were identified as crucial factors for the environmental effects of Nr emissions. As revealed by the analyses of this study, the driving forces of increased Nr emissions due to population growth shifted progressively from changes in energy consumption to satisfy the city’s development needs. Consequently, there still exists a significant burden of Nr pollution in the coastal city. Accordingly, the way energy is produced and exploited should be actively facilitated by increasing energy efficiency and transitioning from smokestack industries to high-tech ones. The above-described measures promise to substantially mitigate nitrogen pollution in Xiamen.

5. Limitations

Although this study presents an expansion of our understanding of the characteristics and influencing factors of Nr emissions in coastal cities, it is limited in several ways that future research must address. (1) Future analyses should consider the nitrogen concentrations and chemical composition of N deposition when analyzing ecological effects. (2) The critical impact of Nr emissions on the soil environment was not taken into account in this study. (3) Two types of variables—activity data and N parameters—are needed to estimate the various kinds of Nr emissions in this paper. Based on previous studies in the field of uncertainty analysis, activity data are mainly derived from official statistics which are widely considered as a reliable data source for analysis. Nr emissions in Xiamen are simply assumed to have uncertainty ranges of 10% to 30% [62]. Based on previous research, this study will further refine the analysis of uncertainty in future research. Despite these limitations, this study provided a comprehensive analysis of Nr in coastal cities. Nevertheless, future research needs to address these limitations to create more sophisticated and perfected works.

6. Conclusions

The emission of Nr in Xiamen from 1995 to 2018 was estimated using the method of material flow analysis. In this study, an increase in Nr emissions was revealed over the 23-year period. Moreover, a quantitative analysis of the key factors driving the above-mentioned long-term changes was conducted. The main findings of this study are elucidated as follows:
First, as urbanization leapt forward in Xiamen, the effects of Nr emissions to water bodies increased, particularly in surface water and the nearby sea. Nr load in the nearby sea was notably higher than that in surface waters and groundwater, and it increased incrementally from 8.1 Gg in 1995 to 25.4 Gg in 2018, marking an increase of 3.1 times in these 23 years. The majority of the Nr originated from the upstream of the external river, Jiulong River. Second, the emission of Nr from various subsystems into the water bodies tended to vary from 2005 to 2018. In terms of surface water, the effect of N deposition and greenbelt subsystems increased as urbanization accelerated. On the other hand, the cropland, sewage treatment, and greenbelt subsystems had a greater impact on groundwater bodies. Since Xiamen is a typical coastal city, the issue of Nr pollution in the nearby sea aroused more attention. The sea near Xiamen was primarily affected by external rivers (Jiulong River) and the direct discharge of tailwater from sewage treatment facilities. Third, the gaseous Nr with the greatest impact on the atmosphere in Xiamen was NOx, which mainly resulted from fossil fuel consumption. Fourth, the STRIPAT model was adopted to analyze the socioeconomic drivers impacting Nr emissions in Xiamen. As revealed by the findings, population and per capita GDP were the major factors for Nr load in water bodies, while population and energy consumption affected Nr loads in the atmosphere. Several potential solutions were proposed (e.g., cooperation between adjacent cities and upstream areas of the river, improvements in energy utilization technology, and appropriate N fertilizer application). Subsequent research should emphasize analyzing N management strategies for coastal cities in different scenarios.

Supplementary Materials

The following supporting information can be downloaded at: https://www.mdpi.com/article/10.3390/atmos14101549/s1, Table S1: Input and output items in processes of cropland system; Table S2. The parameter of cropland system; Table S3. the activity data of cropland system; Table S4. Input and output items in processes of human consumption system; Table S5. The parameter of human consumption system; Table S6. The activity data of human consumption system; Table S7. Input and output items in processes of livestock system; Table S8. The parameters of livestock system; Table S9. The activity data of livestock system; Table S10. Input and output items in processes of sewage treatment system; Table S11. The parameters of sewage treatment system; Table S12. The activity data of sewage treatment system; Table S13. Input and output items in processes of garbage treatment system; Table S14. The parameters of garbage treatment system; Table S15. The activity data of garbage treatment system; Table S16. Input and output items in processes of aquaculture system; Table S17. The parameter of aquaculture system; Table S18. The activity data of aquaculture system; Table S19. Input and output items in processes of green space system; Table S20. The parameter of green space system; Table S21. The activity data of green space system; Table S22. Input and output items in processes of green space system; Table S23. The parameter of energy system; Table S24. The activity data of energy system; Table S25. Input and output items in processes of pet; Table S26. The parameter of pet system; Table S27. Input and output items in processes of industry system; Table S28. Input and output items in processes of coastal system; Table S29. The parameter of coastal system; Table S30. The activity data of coastal system. References [63,64,65,66,67,68,69,70,71,72,73,74,75,76,77,78,79,80,81,82,83,84,85,86] are cited in Supplementary file.

Author Contributions

Conceptualization, Y.L. and S.C.; methodology, Y.L.; software, X.Y.; validation, S.W.; formal analysis, S.W.; investigation, Y.L.; resources, Y.L.; data curation, S.C.; writing—original draft preparation, Y.L.; writing—review and editing, Y.L.; visualization, S.C.; supervision, S.C.; project administration, S.C.; funding acquisition, Y.L. and X.Y. All authors have read and agreed to the published version of the manuscript.

Funding

This research was funded by Natural Science Research Project of Anhui Educational Committee (GrantNo.2022AH050820); Scientific Research Foundation for High-level Talents of Anhui University of Science and Technology (GrantNo.13200458); Anhui Provincial Natural Science Foundation (GrantNo.2208085QD115); the Open Foundation of the Key Laboratory of Universities in Anhui Province for Prevention of Mine Geological Disasters (GrantNo.2022-MGDP-08); the Key Laboratory of Aviation–Aerospace–Ground Cooperative Monitoring and Early Warning of Coal Mining-Induced Disasters of Anhui Higher Education Institutes (Anhui University of Science and Technology) (GrantNo.KLAHEI202204).

Institutional Review Board Statement

Not applicable.

Informed Consent Statement

Not applicable.

Data Availability Statement

The data used to support the findings of this study are available from the corresponding author upon request.

Acknowledgments

We would like to thank all the authors and reviewers for their great guidance and help in writing this manuscript.

Conflicts of Interest

The authors declare that they have no known competing financial interests or personal relationships that could have appeared to influence the work reported in this paper.

References

  1. Galloway, J.N.; Dentener, F.J.; Capone, D.G.; Boyer, E.W.; Howarth, R.W.; Seitzinger, S.P.; Asner, G.P.; Cleveland, C.C.; Green, P.A.; Holland, E.A.; et al. N cycles: Past, present, and future. Biogeochemistry 2004, 70, 153–226. [Google Scholar] [CrossRef]
  2. Stevens, C.J. Nitrogen in the environment. Science 2019, 363, 578–580. [Google Scholar] [CrossRef] [PubMed]
  3. Schlesinger, W.H. On the fate of anthropogenic nitrogen. Proc. Natl. Acad. Sci. USA 2009, 106, 203–208. [Google Scholar] [CrossRef]
  4. Shibata, H.; Galloway, J.N.; Leach, A.M.; Cattaneo, L.R.; Cattell, N.L.; Erisman, J.W.; Gu, B.J.; Xiao, L.; Hayashi, K.; Ma, L.; et al. Nitrogen footprints: Regional realities and options to reduce nitrogen loss to the environment. Ambio 2017, 46, 129–142. [Google Scholar] [CrossRef] [PubMed]
  5. Galloway, J.N.; Winiwarter, W.; Leip, A.; Leach, A.M.; Bleeker, A.; Erisman, J.W. Nitrogen footprints: Past, present and future. Environ. Res. Lett. 2014, 9, 115003. [Google Scholar] [CrossRef]
  6. Wiedmann, T.; Lenzen, M. Environmental and social footprints of international trade. Nat. Geosci. 2018, 11, 314–321. [Google Scholar] [CrossRef]
  7. Chen, C.; Wen, Z.G.; Wang, Y.H. Nitrogen flow patterns in the food system among cities within urban agglomeration: A case study of the Pearl River Deltal region. Sci. Total Environ. 2020, 703, 135506. [Google Scholar] [CrossRef] [PubMed]
  8. National Bureau of Statistics of China (NBSC). 2004–2018 China Statistical Yearbook; China Statistics Press: Beijing, China. Available online: http://www.stats.gov.cn (accessed on 14 May 2023).
  9. Shi, L.; Zhang, M.; Zhang, Y.; Yang, B.; Sun, H.; Xu, T. Comprehensive analysis of nitrogen deposition in urban ecosystem: A case study of Xiamen city, China. Sustainability 2018, 10, 4673. [Google Scholar] [CrossRef]
  10. Xian, C.; Wu, T.; Lu, F.; Zhang, J.; Gong, C.; Ouyang, Z. The nitrogen footprints of China’s major urban agglomerations: Understanding regional challenges to advance sustainable development. Environ. Res. Lett. 2022, 17, 045020. [Google Scholar] [CrossRef]
  11. Xu, W.; Du, E.Z.; Tang, A.H.; Zhang, Y.; Zhang, Y.Y.; Wen, Z.; Hao, T.X.; Pan, Y.P.; Zhang, L.; Gu, B.J.; et al. Environmental impacts of nitrogen emissions in China and the role of policies in emission reduction. Philos. Trans. R. Soc. A 2020, 378, 20190324. [Google Scholar]
  12. Kanter, D.R.; Winiwarter, W.; Bodirsky, B.L.; Bouwman, L.; Boyer, E.; Buckle, S.; Compton, J.E.; Dalgaard, T.; Vries, d.W.; Leclère, D.; et al. A framework for nitrogen futures in the shared socioeconomic pathways. Glob. Environ. Chang. 2020, 61, 102029. [Google Scholar] [CrossRef] [PubMed]
  13. Ma, S. High-resolution assessment of ammonia emissions in China: Inventories, driving forces and mitigation. Atmos. Environ. 2020, 229, 117458. [Google Scholar] [CrossRef]
  14. Barles, S. Feeding the city: Food consumption and flow of N, Paris, 1801–1914. Sci. Total Environ. 2007, 375, 48–58. [Google Scholar] [CrossRef] [PubMed]
  15. Baker, L.A.; Hope, D.; Xu, Y.; Edmonds, J.; Lauver, L. Nitrogen balance for the Central Arizona–Phoenix (CAP) ecosystem. Ecosystems 2001, 4, 582–602. [Google Scholar] [CrossRef]
  16. Gu, B.; Chang, J.; Ge, Y.; Ge, H.; Yuan, C.; Peng, C.; Jiang, H. Anthropogenic modification of the nitrogen cycling within the Greater Hangzhou Area system, China. Ecol. Appl. 2009, 19, 974–988. [Google Scholar] [CrossRef]
  17. Gu, B.; Dong, X.; Peng, C.; Luo, W.; Chang, J.; Ge, Y. The long-term impact of urbanization on nitrogen patterns and dynamics in Shanghai, China. Environ. Pollut. 2012, 171, 30–37. [Google Scholar] [CrossRef]
  18. Dong, Y.; Xu, L. Aggregate risk of reactive nitrogen under anthropogenic disturbance in the Pearl River Delta urban agglomeration. J. Clean. Prod. 2019, 211, 490–502. [Google Scholar] [CrossRef]
  19. Zhang, Y.; Lu, H.; Fath, B.D.; Zheng, H. Modelling urban nitrogen metabolic processes based on ecological network analysis: A case of study in Beijing, China. Ecol. Model. 2016, 337, 29–38. [Google Scholar] [CrossRef]
  20. Liu, C.; Nie, G.H. Identifying the driving factors of food nitrogen footprint in China, 2000–2018, econometric analysis of provincial spatial panel data by the STIRPAT Model. Sustainability 2021, 13, 6147. [Google Scholar] [CrossRef]
  21. Cui, H.; Zhao, T.; Shi, H. STIRPAT-Based Driving Factor Decomposition Analysis of Agricultural Carbon Emissions in Hebei, China. Pol. J. Environ. Stud. 2018, 27, 1449–1496. [Google Scholar] [CrossRef]
  22. York, R.; Rosa, E.A.; Dietz, T. STIRPAT, IPAT, and ImPACT: Analytic tools for unpacking the driving forces of environmental impacts. Ecol. Econ. 2003, 46, 351–365. [Google Scholar] [CrossRef]
  23. Xu, S.C.; Miao, Y.M.; Gao, C.; Long, R.Y.; Chen, H.; Zhao, B.; Wang, S.X. Regional differences in impacts of economic growth and urbanization on air pollutants in China based on provincial panel estimation. J. Clean. Prod. 2019, 208, 340–352. [Google Scholar] [CrossRef]
  24. Ge, X.; Zhou, Z.; Zhou, Y.; Ye, X.; Liu, S. A spatial panel data analysis of economic growth, urbanization, and NOx emissions in China. Int. J. Environ. Res. Public Health 2018, 15, 725. [Google Scholar] [CrossRef] [PubMed]
  25. Jiang, L.; Chen, Y.; Zhou, H.; He, S. NOx emissions in China: Temporal variations, spatial patterns and reduction potentials. Atmos. Pollut. Res. 2020, 11, 1473–1480. [Google Scholar] [CrossRef]
  26. Zhang, X.; Zhang, Y.; Fath, B.D. Analysis of anthropogenic nitrogen and its influencing factors in Beijing. J. Clean. Prod. 2020, 244, 118780. [Google Scholar] [CrossRef]
  27. Zeng, Y.; Xu, C.; Wang, Q.; Li, Y.; Hou, S. Basin-scale estimation of nitrogen footprint and corresponding dynamic change characteristics: A case study. Environ. Dev. 2019, 29, 81–93. [Google Scholar] [CrossRef]
  28. Huang, L.H.; Jiang, Y.; Lin, Q.; Li, T.W.; Chen, F.; Wang, W.Y. Research on the coupling coordination relationship between Xiamen port development and coastal eco-environment evolution. Environ. Pollut. Prev. 2020, 42, 890–900. (In Chinese) [Google Scholar]
  29. Sadorsky, P. The effect of urbanization on CO2 emissions in emerging economies. Energy Econ. 2014, 41, 147–153. [Google Scholar] [CrossRef]
  30. Chikaraishi, M.; Fujiwara, A.; Kaneko, S.; Poumanyvong, P.; Komatsu, S.; Kalugin, A. The moderating effects of urbanization on carbon dioxide emissions: A latent class modeling approach. Technol. Forecast. Soc. Chang. 2015, 90, 302–317. [Google Scholar] [CrossRef]
  31. Salim, R.A.; Shafiei, S. Urbanization and renewable and non-renewable energy consumption in OECD countries: An empirical analysis. Econ. Model. 2014, 38, 581–591. [Google Scholar] [CrossRef]
  32. Zhao, C.S.; Niu, S.W.; Zhang, X. Effects of household energy consumption on environment and its influence factors in rural and urban areas. Energy Procedia 2012, 14, 805–811. [Google Scholar]
  33. Agbo, E.P.; Nkajoe, U.; Edet, C.O. Comparison of Mann–Kendall and Şen’s innovative trend method for climatic parameters over Nigeria’s climatic zones. Clim. Dyn. 2023, 60, 3385–3401. [Google Scholar] [CrossRef]
  34. Chu, T.; Guo, X.; Takeda, K. Remote sensing approach to detect post-fire vegetation regrowth in Siberian boreal larch forest. Ecol. Indic. 2016, 62, 32–46. [Google Scholar] [CrossRef]
  35. Guo, A.; He, L. Correlations between Summer Discharge and South Asian Summer Monsoon Subsystems in Mekong River Basin. Atmosphere 2023, 14, 958. [Google Scholar] [CrossRef]
  36. IPCC. Intergovernmental Panel on Climate Change: Greenhouse Gas Inventory Reference Manual; Cambridge University Press: Cambridge, UK, 2007. [Google Scholar]
  37. Li, Y.M.; Gao, B.; Tang, J.X.; Huang, W.; Cui, S.H. The evolution characteristics of nitrogen flow and water environment load in Xiamen. Acta Sci. Circumstantiae 2019, 39, 610–623. (In Chinese) [Google Scholar]
  38. Huang, W.; Gao, B.; Huang, Y.; Zhang, Z.; Xu, S.; Xu, L.; Cui, S. Transforming nitrogen management of the urban food system in a food-sink city. J. Environ. Manag. 2019, 249, 109180. [Google Scholar] [CrossRef]
  39. Chen, B.; Ji, W.; Chen, J.; Lin, C.; Huang, H.; Huo, Y.; Ji, X. Characteristics of nutrients in the Jiulong River and its impact on Xiamen Water, China. Chin. J. Oceanol. Limnol. 2013, 31, 1055–1063. [Google Scholar] [CrossRef]
  40. Chen, N.W.; Hong, H.S.; Zhang, L.P. Preliminary results concerning the spatio-temporal pattern and mechanism of nitrogen sources and exports in the Jiulong River watershed. Acta Sci. Circumstantiae 2009, 29, 830–839. (In Chinese) [Google Scholar]
  41. Liu, C.; Wang, Q.X.; Zou, C.J. Recent trends in N flows with urbanization in Shanghai megacity and the effects on the water environment. Environ. Sci. Pollut. Res. 2015, 22, 3431–3440. [Google Scholar] [CrossRef]
  42. Elliott, E.M.; Kendall, C.; Wankel, S.D.; Burns, D.A.; Boyer, E.W.; Harlin, K.; Bain, D.J.; Butler, T.J. N isotopes as indicators of NOx source contributions to atmospheric nitrate deposition across the midwestern and northeastern United States. Environ. Sci. Technol. 2007, 41, 7661–7667. [Google Scholar] [CrossRef]
  43. Gao, Y.; Zhou, F.; Ciais, P.; Miao, C.Y.; Yang, T.; Jia, Y.L.; Zhou, X.D.; Klaus, B.B.; Yang, T.T.; Yu, G.R. Human activities aggravate nitrogen-deposition pollution to inland water over China. Natl. Sci. Rev. 2020, 7, 430–440. [Google Scholar] [CrossRef] [PubMed]
  44. Dey, C.S.; Bhunia, P. Simultaneous carbon and nitrogen removal from domestic wastewater using high rate vermifilter. Indian J. Microbiol. 2021, 61, 218–228. [Google Scholar]
  45. Li, Y.; Tang, J.; Cui, S. Dynamic Changes of Nitrogen Loads in Source–Sink Landscapes under Urbanization. Land 2022, 11, 1371. [Google Scholar] [CrossRef]
  46. Chen, J. Mitigating nitrogen dioxide air pollution: The roles and effect of national smart city pilots in China. Energy 2023, 263, 125652. [Google Scholar] [CrossRef]
  47. Gu, B.; Leach, A.M.; Ma, L.; Galloway, J.N.; Chang, S.X.; Ge, Y.; Chang, J. Nitrogen footprint in China: Food, energy, and nonfood goods. Environ. Sci. Technol. 2013, 47, 9217–9224. [Google Scholar] [CrossRef]
  48. Winiwarter, W.; Höglund-Isaksson, L.; Klimont, Z.; Schöpp, W.; Amann, M. Technical opportunities to reduce global anthropogenic emissions of nitrous oxide. Environ. Res. Lett. 2018, 13, 014011. [Google Scholar] [CrossRef]
  49. Jaeglé, L.; Steinberger, L.; Martin, R.V.; Chance, K. Global partitioning of NOx sources using satellite observations: Relative roles of fossil fuel combustion, biomass burning and soil emissions. Faraday Discuss. 2005, 130, 407–423. [Google Scholar] [CrossRef]
  50. Shi, Y.L.; Cui, S.H.; Xu, S.; Lin, J.Y.; Huang, W. Nitrogen oxide emission in energy consumption in China from a consumption-based perspective. Acta Sci. Circumstantiae 2014, 34, 2684–2692. (In Chinese) [Google Scholar]
  51. Clark, L.P.; Millet, D.B.; Marshall, J.D. Changes in transportation-related air pollution exposures by race-ethnicity and socioeconomic status: Outdoor nitrogen dioxide in the United States in 2000 and 2010. Environ. Health Perspect. 2017, 125, 097012. [Google Scholar] [CrossRef] [PubMed]
  52. Warner, J.X.; Dickerson, R.R.; Wei, Z.; Strow, L.L.; Wang, Y.; Liang, Q. Increased atmospheric ammonia over the world’s major agricultural areas detected from space. Geophys. Res. Lett. 2017, 44, 2875–2884. [Google Scholar] [CrossRef]
  53. Clarisse, L.; Clerbaux, C.; Dentener, F.; Hurtmans, D.; Coheur, P.F. Global ammonia distribution derived from infrared satellite observations. Nat. Geosci. 2009, 2, 479–483. [Google Scholar] [CrossRef]
  54. Kang, Y.; Liu, M.; Song, Y.; Huang, X.; Huang, X.; Yao, H.; Cai, X.H.; Zhang, H.S.; Kang, L.; Liu, X.J.; et al. High-resolution ammonia emissions inventories in China from 1980 to 2012. Atmos. Chem. Phys. 2016, 16, 2043–2058. [Google Scholar] [CrossRef]
  55. Behera, S.N.; Sharma, M.; Aneja, V.P.; Balasubramanian, R. Ammonia in the atmosphere: A review on emission sources, atmospheric chemistry and deposition on terrestrial bodies. Environ. Sci. Pollut. Res. 2013, 20, 8092–8131. [Google Scholar] [CrossRef]
  56. Wang, C.; Amon, B.; Schulz, K.; Mehdi, B. Factors that influence nitrous oxide emissions from agricultural soils as well as their representation in simulation models: A review. Agronomy 2021, 11, 770. [Google Scholar] [CrossRef]
  57. Masuda, S.; Otomo, S.; Maruo, C.; Nishimura, O. Contribution of dissolved N2O in total N2O emission from sewage treatment plant. Chemosphere 2018, 212, 821–827. [Google Scholar] [CrossRef]
  58. Hou, Y.; Ma, L.; Gao, Z.L.; Wang, F.H.; Sims, J.T.; Ma, W.Q.; Zhang, F.S. The driving forces for nitrogen and phosphorus flows in the food chain of China, 1980 to 2010. J. Environ. Qual. 2013, 42, 962–971. [Google Scholar] [CrossRef]
  59. Gao, B.; Huang, W.; Wang, L.; Huang, Y.; Ding, S.; Cui, S. Driving forces of nitrogen flows and nitrogen use efficiency of food systems in seven Chinese cities, 1990 to 2015. Sci. Total Environ. 2019, 676, 144–154. [Google Scholar] [CrossRef]
  60. Gu, B.; Zhang, X.; Bai, X.; Fu, B.; Chen, D. Four steps to food security for swelling cities. Nature 2019, 566, 31–33. [Google Scholar] [CrossRef]
  61. Wang, F.; Wang, Y.; Cai, Z.; Chen, X. Environmental losses and driving forces of nitrogen flow in two agricultural towns of Hebei province during 1997–2017. Environ. Pollut. 2020, 264, 114636. [Google Scholar] [CrossRef]
  62. Li, Y.; Cui, S.; Gao, B.; Tang, J.X.; Huang, W. Modeling nitrogen flow in a coastal city—A case study of Xiamen in 2015. Sci. Total Environ. 2020, 735, 139294. [Google Scholar] [CrossRef]
  63. Ti, C.; Pan, J.; Xia, Y.; Yan, X. A nitrogen budget of mainland China with spatial and temporal variation. Biogeochemistry 2012, 108, 381–394. [Google Scholar] [CrossRef]
  64. Yan, W.; Yin, C.; Zhang, S. Nutrient budgets and biogeochemistry in an experimental agricultural watershed in Southeastern China. Biogeochemistry. 1999, 45, 1–19. [Google Scholar] [CrossRef]
  65. Chen, N.W.; Hong, H.S.; Huang, Q.J.; Wu, J.Z. Atmospheric nitrogen deposition and its long-term dynamics in a southeast China coastal area. J. Environ. Manag. 2011, 92, 1663–1667. [Google Scholar] [CrossRef] [PubMed]
  66. Zhou, T.; Wang, Y.; Wang, F.; Feng, Y. Analysis of the nitrogen footprint of agriculture in Guangdong. China Environ. Sci. 2014, 34, 2430–2438. [Google Scholar]
  67. Wang, M.; Ma, L.; Strokal, M.; Ma, W.Q.; Liu, X.J.; Kroeze, C. Hotspots for nitrogen and phosphorus losses from food production in China: A county-scale analysis. Environ. Sci. Technol. 2018, 52, 5782–5791. [Google Scholar] [CrossRef]
  68. Cui, S.; Shi, Y.; Groffman, P.M.; Schlesinger, W.H.; Zhu, Y.G. Centennial-scale analysis of the creation and fate of reactive nitrogen in China (1910–2010). Proc. Natl. Acad. Sci. USA 2013, 110, 2052–2057. [Google Scholar] [CrossRef]
  69. Ma, L.; Velthof, G.L.; Wang, F.H.; Qin, W.; Zhang, W.F.; Zhang, F.S.; Oenema, C. Nitrogen and phosphorus use efficiencies and losses in the food chain in China at reginal scales in 1980 and 2005. Sci. Total Environ. 2012, 434, 51–61. [Google Scholar] [CrossRef]
  70. Zheng, X.; Han, S.; Huang, Y.; Wang, Y.; Wang, M. Re-quantifying the emission factors based on field measurements and estimating the direct N2O emission from Chinese croplands. Glob. Biogeochem. Cycles 2004, 18, GB2018. [Google Scholar] [CrossRef]
  71. Möller, D.; Schieferdecker, H. Ammonia emission and deposition of NHx in the GDR. Atmos. Environ. 1989, 23, 1187–1193. [Google Scholar] [CrossRef]
  72. Cai, B.F. City’s Greenhouse Gas (GHG) Emission Inventory Research; Chemical Industry Press: Beijing, China, 2009. (In Chinese) [Google Scholar]
  73. Ma, L.; Ma, W.Q.; Velthof, G.L.; Wang, F.H.; Qin, W.; Zhang, F.S.; Oenema, O. Modeling nutrient flows in the food chain of China. J. Environ. Qual. 2010, 39, 1279–1289. [Google Scholar] [CrossRef]
  74. Min, J.; Shi, W. Nitrogen discharge pathways in vegetable production as non-point sources of pollution and measures to control it. Sci. Total Environ. 2018, 613, 123–130. [Google Scholar] [CrossRef] [PubMed]
  75. NBS. Xiamen Statistic Yearbook; Xiamen Bureau of Statistics of China: Xiamen, China, 2015. (In Chinese)
  76. Liao, C.; Xia, Y.; Wu, D. Nitrogen flows associated with food production and consumption system of Shanghai. Environ. Pollut. 2021, 279, 116906. [Google Scholar] [CrossRef] [PubMed]
  77. Gu, B.; Ju, X.; Chang, J.; Ge, Y.; Vitousek, P.M. Integrated reactive nitrogen budgets and future trends in China. Proc. Natl. Acad. Sci. USA 2015, 112, 8792–8797. [Google Scholar] [CrossRef] [PubMed]
  78. Huang, X.; Song, Y.; Li, M.; Li, J.; Huo, Q.; Cai, X.; Zhang, H. A high-resolution ammonia emission inventory in China. Glob. Biogeochem. Cycles. 2012, 26, 1030. [Google Scholar] [CrossRef]
  79. Xian, C.; Ouyang, Z.; Lu, F.; Xiao, Y.; Li, Y. Quantitative evaluation of reactive nitrogen emissions with urbanization: A case study in Beijing megacity, China. Environ. Sci. Pollut. Res. 2016, 23, 17689–17701. [Google Scholar] [CrossRef]
  80. Crab, R.; Avnimelech, Y.; Defoirdt, T.; Bossier, P.; Verstraete, W. Nitrogen removal techniques in aquaculture for a sustainable production. Aquaculture 2007, 270, 1–14. [Google Scholar] [CrossRef]
  81. Shu, T.F.; Wen, Y.M.; Tang, Y.T. Cycle and budget balance of nitrogen in the cultivated water. Fish. Sci. 2002, 21, 30–34. (In Chinese) [Google Scholar]
  82. Zhang, R.L. Research advances on fertilizer application to lawn. Chin. J. Trop. Agric. 2002, 22, 77–81. (In Chinese) [Google Scholar]
  83. Xu, J.R.; Wang, Y.S.; Sun, S. The characteristics of nitrogen fixation, ammonification, nitrification and denitrification in coastal zones. Acta Ecol. Sin. 2004, 24, 2907–2914. (In Chinese) [Google Scholar]
  84. Hu, W.; Huaiyang, Z.; Xiaotong, P.; Qunhui, Y.; Chaomei, Q.; Xijie, Y.; Guangqian, C. Denitrification in Qi’ao Island coastal zone, the Zhujiang Estuary in China. Acta Oceanol. Sin. 2009, 28, 37–46. (In Chinese) [Google Scholar]
  85. Yan, W.; Yang, L.; Wang, F.; Wang, J.; Ma, P. Riverine N2O concentrations, exports to estuary and emissions to atmosphere from the Changjiang River in response to increasing nitrogen loads. Glob. Biogeochem. Cycles 2012, 26, 4006. [Google Scholar] [CrossRef]
  86. Yu, Y.; Song, J.; Li, X.; Yuan, H.; Li, N. Distribution, sources and budgets of particulate phosphorus and nitrogen in the East China Sea. Cont. Shelf Res. 2012, 43, 142–155. [Google Scholar] [CrossRef]
Figure 1. Map of the study area.
Atmosphere 14 01549 g001
Figure 2. Framework of Nr emissions to the environment (blue arrows represent Nr emission to water environments; red arrows represent Nr emission to the atmosphere; black arrows represent nitrogen flow between different systems; BNF: Biological nitrogen fixation).
Atmosphere 14 01549 g002
Figure 3. Total amount of Nr emissions.
Atmosphere 14 01549 g003
Figure 4. Characteristics of Nr load in different water bodies in Xiamen.
Atmosphere 14 01549 g004
Figure 5. Characteristics of variations in Nr load contributions to different water bodies ((a): surface water; (b): nearby sea; (c): groundwater).
Atmosphere 14 01549 g005
Figure 6. Trends and contributions of gaseous Nr emissions from 1995 to 2018 ((a): emission ratio of different forms of gaseous Nr; (b): gaseous Nr emission of each subsystem).
Atmosphere 14 01549 g006
Table 1. Theil–Sen median slope estimation and Mann–Kendall trend test.
ItemSen’s SlopeMann–Kendall StatisticThe Z Value of the Mann–Kendall TestThe p-Value of the Mann–Kendall Test
Total Nr emission4.834250.0006.176 0.000
Nr emission to water bodies0.945178.0004.390 0.000
Nr emission to atmosphere3.793252.0006.226 0.000
Nr emission to surface water 0.03382.0002.009 0.045
Nr emission to groundwater 0.0016.0000.124 0.901
Nr emission to nearby sea0.880182.0004.490 0.000
NH3 emission0.375244.0006.027 0.000
NOx emission3.436238.0005.879 0.000
N2O emission−0.026−198.000−4.886 0.000
Table 2. Ridge regression of various socioeconomic factors affecting Nr load in water bodies.
Standardization CoefficienttpR2F
Constants-010.752
Population (P1)0.1705.0190.000 **F = 8.604
Urbanization (P2)0.1535.7320.000 **p = 0.001
Industrial structure (T2) −0.1172.3340.032 *
Per capita GDP (A)0.1606.6520.000 **
* p < 0.05, ** p < 0.01.
Table 3. Ridge regression of socioeconomic factors affecting Nr load in the atmosphere.
Standardization CoefficienttpR2F
Constants-010.932
Population (P1)1.0912.0750.000 **F (6,7) =15.897
Industrial structure (T2) −0.468−1.2010.027 *p = 0.001
Energy consumption (T1) 0.9112.0810.000 **
Per capita GDP (A)0.3100.9930.035 *
* p < 0.05, ** p < 0.01.
Disclaimer/Publisher’s Note: The statements, opinions and data contained in all publications are solely those of the individual author(s) and contributor(s) and not of MDPI and/or the editor(s). MDPI and/or the editor(s) disclaim responsibility for any injury to people or property resulting from any ideas, methods, instructions or products referred to in the content.

