Article

Theoretical Calculation and Experimental Verification of Wind-Driven Rain Aerodynamic Forces on the Bridge Main Beam

1
School of Civil Engineering, Changsha University, Changsha 410022, China
2
Wind Engineering Research Center, Hunan University, Changsha 410082, China
3
Hunan Provincial Key Laboratory of Bridge Engineering, Changsha University of Science and Technology, Changsha 410114, China
*
Authors to whom correspondence should be addressed.
Atmosphere 2023, 14(10), 1535; https://doi.org/10.3390/atmos14101535
Submission received: 5 September 2023 / Revised: 30 September 2023 / Accepted: 3 October 2023 / Published: 7 October 2023

Abstract

:
Regarding the issue of changes in the aerodynamic force of the bridge main beam under the action of wind-driven rain, this article explores the changes in air density caused by rainfall, the calculation theory of raindrop impact force and its simplified mass-weighted equivalent method (MWEM), and the calculation method of water accumulation thickness on the surface of the main beam. The calculation shows that the changes in air density caused by rainfall can be ignored, and the error of the MWEM increases with the increase in rainfall intensity; however, even at a rainfall intensity of 709 mm/h, the deviations in the MWEM value of the horizontal and vertical raindrop impact force is only about +5% and −4%, respectively. Then, based on the above analysis, a calculation model for the aerodynamic three-component forces of the main beam caused by rainfall under the action of wind-driven rain is provided. Finally, taking two typical main beam sections as an example, static three-component force tests are carried out on the main beam model under different rainfall intensities. The experimental results show that the drag coefficient variations obtained through the MWEM are in good agreement with experimental data, which proves the correctness of the theoretical model of the raindrop impact force. But for the lift and torque coefficient, the differences between theoretical and experimental values are much more significant than the drag coefficient, and it increases with the increase in rain intensity. It can be seen that the surface ponding model and influence of rainfall intensity need to be further explored. In summary, the theoretical calculation method for the additional aerodynamic force of wind-driven rain on the main beam proposed in this article is convenient and practical, and it can provide a certain reference for the rapid safety assessment of bridges under extreme meteorological conditions.

1. Introduction

As an important traffic infrastructure with special structural form, concern about the safety of bridges is often shown. With the progress of science and technology, the span of bridges is increasing, and the main beam is becoming lighter and softer, which makes the wind-induced response of the main beam under extreme wind climates more prominent [1]. Especially in coastal and canyon areas, strong wind is generally accompanied by rainfall. As a gas–liquid two-phase mixture, wind-driven rain acts on the main beam. For the main beam of long-span soft bridges under such environmental conditions, to accurately guide and correct its wind-resistant design parameters, it is a key problem to accurately grasp the influence law and degree of rainfall on its wind-induced aerodynamic force.
Research on the impact of rainfall on the additional aerodynamic characteristics of the structure has been carried out for a long time, and the main areas involved are aircraft stalls caused by rainfall, building facade erosion, and wind-driven rain-induced vibration of cables. Rhold et al. [2] made a preliminary quantitative analysis on the changes in the aerodynamic three-component force of the aircraft caused by rainfall. It was believed that the impact of raindrops and the water film on the surface of the fuselage were the main reasons for the increase in drag force and the decrease in lift force. Around 1981, several flight accidents under thunderstorm weather brought major attention to the additional aerodynamic effects of rain. After that, theoretical analysis, model tests, and numerical simulation technology of the wind-driven rain multi-phase flow acting on the fuselage have been carried out successively. The influence of the transition of the aerodynamic boundary layer caused by rain impact force, raindrop sputtering, and water film adhesion on the structure surface has been discussed in detail, and a wealth of research results have been obtained [3,4,5,6,7,8]. The field of wind-driven rain of buildings focuses on analyzing the trajectory of wind-driven rain and its distribution on the windward side of the building to determine the degree of erosion [9,10,11,12,13]. For some special flexible building structures, some scholars pointed out that the additional load effect of wind-driven rain cannot be ignored [14,15,16,17,18,19,20]. In the field of bridge cable wind-driven rain-induced vibration research, since Hikami et al. [21] discovered this phenomenon in 1988, it has a wealth of theories, actual measurements, experiments on the waterline motion pattern of the cable caused by wind-driven rain, the influence mechanism of the additional aerodynamic force, and simulation analysis results [22,23,24,25,26,27,28].
In recent years, some scholars have especially carried out aerodynamic research on main beams under rainfall conditions by means of theory, test, and simulation, and have achieved corresponding research results. Xin et al. [29,30] conducted experiments and numerical analysis on aerodynamic forces of wind-driven rain acting on the main beam. They believed that the influence of rain on the wind-induced static force of bridge structures mainly depends on the wind field changes caused by spatial raindrops and the attachment of water films on the surface of the main beam. Hu [31] derived a rainfall impact force model using the momentum theorem and substituted it into the vibration equation of the main beam to obtain its influence, including the direct impact force and indirect damping effect. Finally, these two factors were substituted into the finite element calculation to analyze the influence of rainfall on the wind inducedvibration of the main beam. But his analysis did not involve water accumulation on the surface of the main beam and there was no experimental verification either. Zhao et al. [32] believed through experimental research that the accumulation of water in the structure is the fundamental cause of steady aerodynamic changes, and the impact effect is not significant. Dong et al. [33] and Huang et al. [34,35] used Euler–Langrange or Euler–Euler models to conduct CFD simulation analysis on the aerodynamic forces of bridge main beams under wind-driven rain conditions. However, the modeling and calculation processes were relatively complex and did not consider the impact of water accumulation on the surface of the main beams.
Summarizing the existing research results, it can be seen that due to the structural and mechanical characteristics, the influence of wind-driven rain on the additional aerodynamic force of the main beam is different from those of aircraft thin wings, building windward surfaces, and cable structures, and the relevant conclusions are difficult to apply. At present, the research on the additional aerodynamic force of wind-driven rain on the main beam of the bridge is still in the preliminary stage, and the theory, test, and simulation lack mutual verification. Moreover, there is a lack of accurate and practical methods for calculating the additional aerodynamic forces of wind-driven rain on the bridge main beam.
In view of the shortcomings of the existing research, according to the action characteristics of wind-driven rain on the main beam, this paper systematically carries out the theoretical analysis of its influence on the aerodynamic force of the main beam from three aspects (the change in air density caused by rainfall, raindrop impact, and surface ponding), and carries out experimental comparison and verification. It provides a reference for accurately evaluating the additional aerodynamic effect of wind-driven rain on the main beam, to guide and modify its wind resistance design parameters.

2. Summary of Raindrop Characteristics

At present, natural rain is generally considered to be spherical and the raindrop size follows the M-P distribution [36]. Based on this model, the number of rain droplets with diameter D in a unit volume is
N ( D ) = N 0 e λ D
where N0 = 8000 is the concentration parameter (m−3/mm), λ = 4.1I−0.21 is the scale parameter (mm−1), and I is the vertical rain intensity (mm/h).
Therefore, the water content in a unit volume of air WL (g/m3) of Equation (1) is
W L = 0 N 0 e λ D 4 3 π ( D 2 ) 3 ρ r d D = 0.08894 I 0.84
where D is the diameter of the rain droplets, ranging from 0 to ∞, and ρr is the water intensity (g/m3).
The vertical end velocity and horizontal velocity of the raindrop drops with diameter D can be calculated using Equations (3) and (4) [37]:
v r ( D ) = 9.58 ( 1 exp ( ( D / 1.77 ) 1.147 ) )
u r ( D ) = κ U
where vr(D) and ur(D) are the vertical and horizontal velocity of raindrops with diameter D, respectively; U is the wind speed at which the structure is disposed; and κ (constant) is the raindrop horizontalvelocity correction coefficient [9]. It is the correction coefficient for the horizontal velocity of raindrops considering the wind speed profile along the height direction.
For rain intensity, the level standards required for structural safety design are shown in Table 1. Calculated using Equation (2), Figure 1 shows that when the rain reaches 709 mm/h, the air density increase is only 1.78%, which can be completely ignored, so the raindrops and surface water accumulation are two major factors affecting the aerodynamic force.

3. Derivation of Wind-Driven Rain Aerodynamic Forces of the Main Beam

3.1. Rain Drop Impact Analysis and Simplified Calculation Model

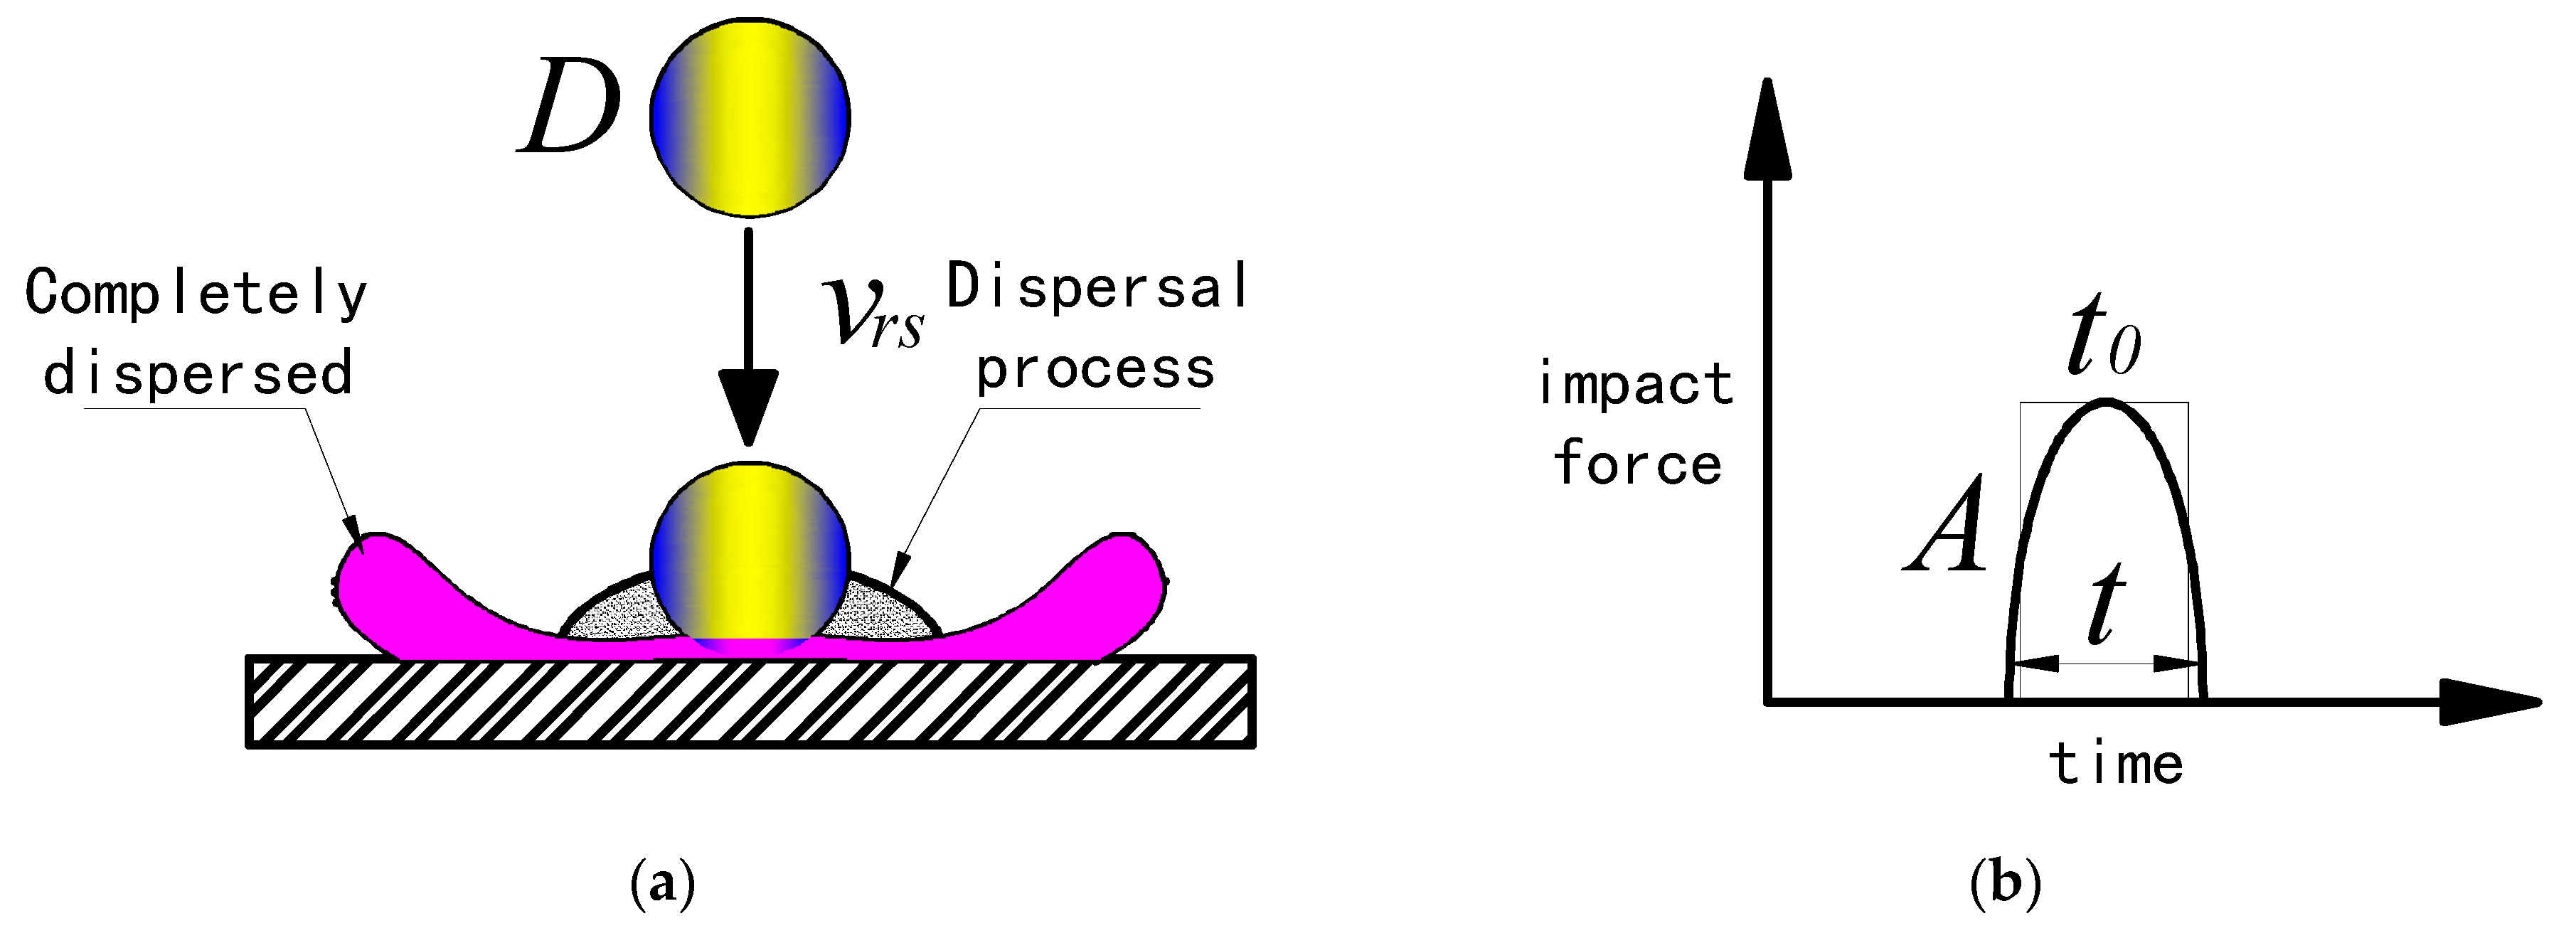
A raindrop impact is so complicated that it is difficult to calculate accurately. Therefore, it is generally considered that the raindrops do not sputter or separate after touching the structure, and the final velocity is completely consistent with the velocity of the structure itself. A single raindrop impact is shown in Figure 2a. Assuming that the impact force changes over time in sine or cosine curves, the effect time t is equivalent to the equivalent effect time t0 according to the principle of the impulse equivalence. According to the theorem of momentum, the calculation formula of a single raindrop impact force Fr is
F r = m r v r s t 0 = 1 6 ρ r π D 3 v r s t 0
where mr and vrs are raindrop quality and impact speed, respectively.
As shown in Figure 2b, if the sine wave area is made equal to the rectangular area (the amplitude is A), the following equation must be met:
A t 0 = 0 t A sin π t τ d τ = A [ cos π t τ / ( π t ) ] 0 t
where τ is the integration time variable for the raindrop impact process.
Equation (6) is subjected to Equation (5) and combined with t = D/vrs (as shown in Figure 1a), approximately assuming that the distance from the contact structure to completely dissipating is diameter D, because the raindrop diameter is generally not more than 5 mm. This process is short, and it can be considered to retain the uniform motion vrs, so t = D/vrs. Accordingly, the impact force of a single raindrop Fr is
F r = 1 12 ρ r π 2 D 2 v r s 2
It is assumed that the single rain droplet is A = π D2/4, so the volume occupancy rate in a unit volume of air α = πD3n/6 (n is the number of rain droplets of unit air diameter D). The relationship between raindrop velocity and raindrop diameter can be calculated according to Equation (3), and then the raindrop impact force falling on per unit area FrA is
{ F r A = D 1 D 2 F d D = D 1 D 2 N 0 e λ D α A 1 12 ρ r π 2 D 2 v r s 2 d D = D 1 D 2 N 0 e λ D 1 18 ρ r π 2 D 2 v r s 2 d D v r s 2 = v r 2 + u r 2
where D2 and D1 are the upper and lower limits of the raindrops, respectively, selected by the integration; vrs, vr, and ur represent the rain resultant velocity, and vertical and horizontal velocity components, respectively; and U is the wind speed at the position of the structure.
The above theoretical equations are complicated and inconvenient for engineering analysis. Therefore, it can be equivalent to a single particle size (equivalent rain droplet size) according to the principle that the water content and rain drop impact force in a unit volume of air are equivalent. And it can be stated as follows:
{ D min D max N ( D ) 4 3 π ( D 2 ) 3 ρ r d D = n 0 4 3 π ( D 0 2 ) 3 ρ r D min D max N ( D ) 1 18 ρ r π 2 D 3 ( v r ( D ) 2 + u r ( D ) 2 ) d D = n 0 1 18 ρ r π 2 D 0 3 v r s 0 2
where n0, D0, and vrs0 are the number of equivalent rain droplets, the equivalent particle size, and the equivalent velocity, respectively, in a unit volume of air.
The above equation system has no explicit solution, is complex in operation, and is not convenient for engineering analysis. Due to the asymmetric distribution characteristics of raindrop spectra, simply taking the arithmetic mean of particle size can lead to a larger calculation error in subsequent impact forces [36]. Therefore, this article adopts a high-alumni equivalent method to calculate the equivalent particle size:
D o = o D n + 1 N ( D ) d D / o D n N ( D ) d D = n + 1 λ
It represents the n + 1 order of the raindrop diameter. Taking the mass-weighted equivalent method (MWEM) for example, its equivalent particle size can be expressed as
D 0 = D min D max m r ( D ) D N ( D ) d D / D min D max m r ( D ) N ( D ) d D
where the integral limit is 0 to ∞. From mr(D) = ρrπD3/6, the above equation can be changed to the following equation:
D o = o D 4 N ( D ) d D / o D 3 N ( D ) d D = 4 λ = 0.98 I 0.21
According to the principle of constant water flow, the number of equivalent raindrops of a particle size per unit volume of air n0 is
n o = 6 W L / ( π D o 3 ρ r )
After obtaining the equivalent rain drop size and the raindrops, the force of vertical raindrops on the surface per unit volume FrAv can be expressed as
F r A v = 1 18 ρ r π 2 D 0 3 v r 0 2 n 0
where vr0 is the vertical raindrop velocity using the MWEM. To calculate the horizontal impact force FrAu, the velocity vr0 can be replaced by ur0.
Through the equivalent raindrop size, according to the momentum theorem, the vertical shock of the raindrops of the unit structure is also calculated:
F r A v = v r 0 τ n 0 m r v r 0 / τ = 1 6 n 0 ρ r π D 0 3 v r 0 2
Similarly, FrAu can be obtained through replacing vr0 with ur0.
Equation (15) is slightly smaller than Equation (14), because in Equation (14), the raindrop impact is considered to be continuous, so the time estimation is slightly larger.
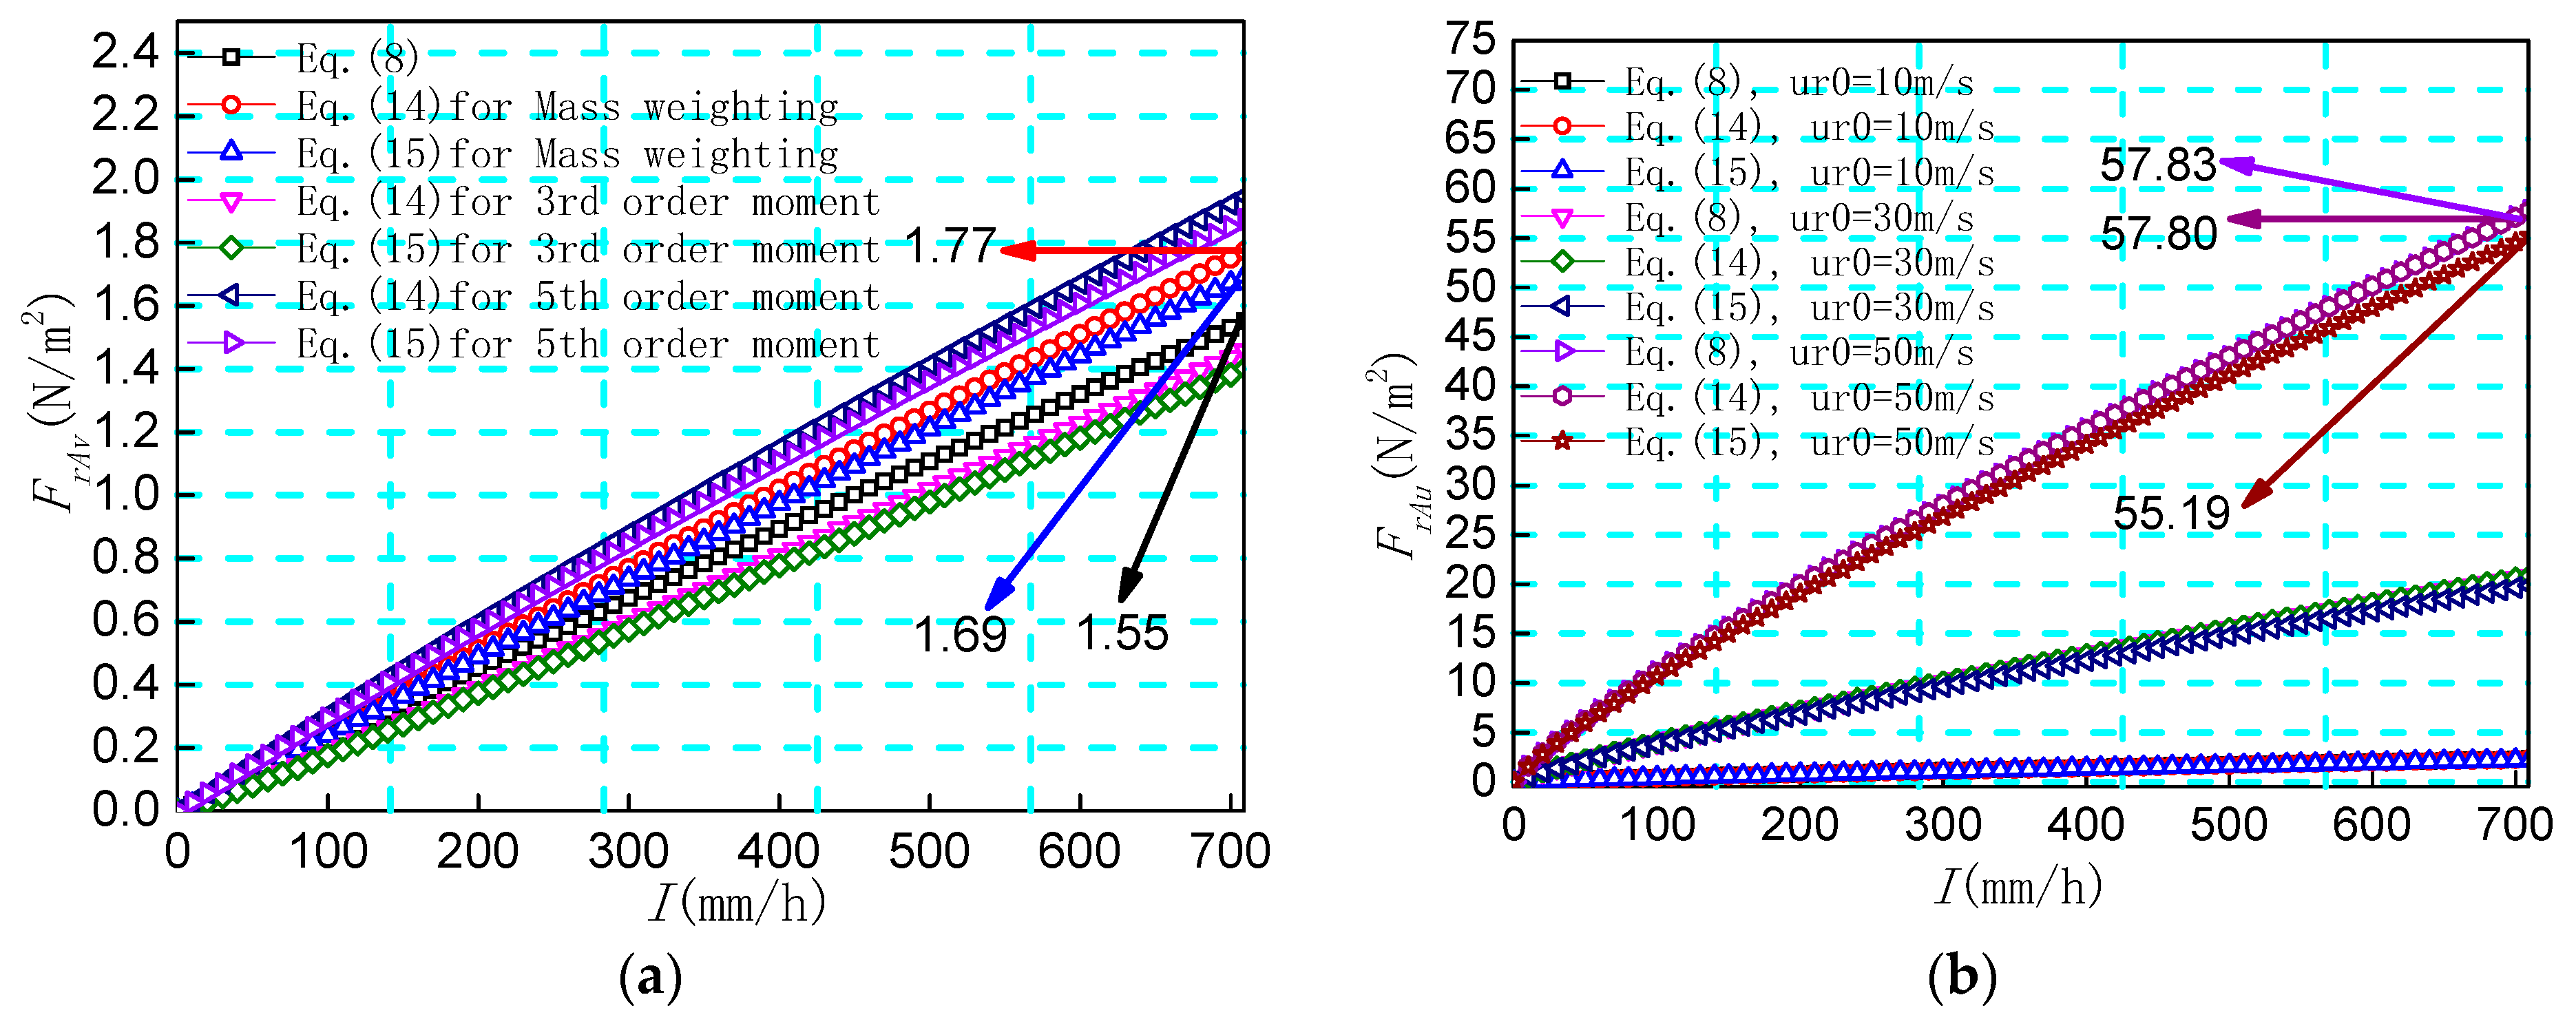
Figure 3 shows the comparative results of Equations (14) and (15) of equivalent rain droplets with different orders and the theoretical integration of Equation (8). The results show that in terms of the raindrop vertical impact force, compared to equivalent methods of 3rd-order and 5th-order moments, simplified models of four-stage moments (MWEM) are more consistent with the theoretical values under the premise of preference. When the rain intensity is 709 mm/h, the error between the MWEM and theoretical values of the vertical and horizontal impact force is only about +5% and −4% respectively, and its estimation accuracy is relatively high, proving that the above effective method is reasonable and feasible.
It is noted that the calculation method of the equivalent rain drop size of various stages can be combined with Equations (12), (14), and (15): nD3 is constant. As the order increases, the diameter of the equivalent raindrop increases, and its vertical impact velocity increases, resulting in an increase in the equivalent vertical impact force per unit area. However, the horizontal velocity is only related to wind speed, so its impact force does not change, due to changes in the equivalent order.
Figure 4 shows the relationship between equivalent rain drop size and the number of raindrops and the rain intensity according to the MWEM.
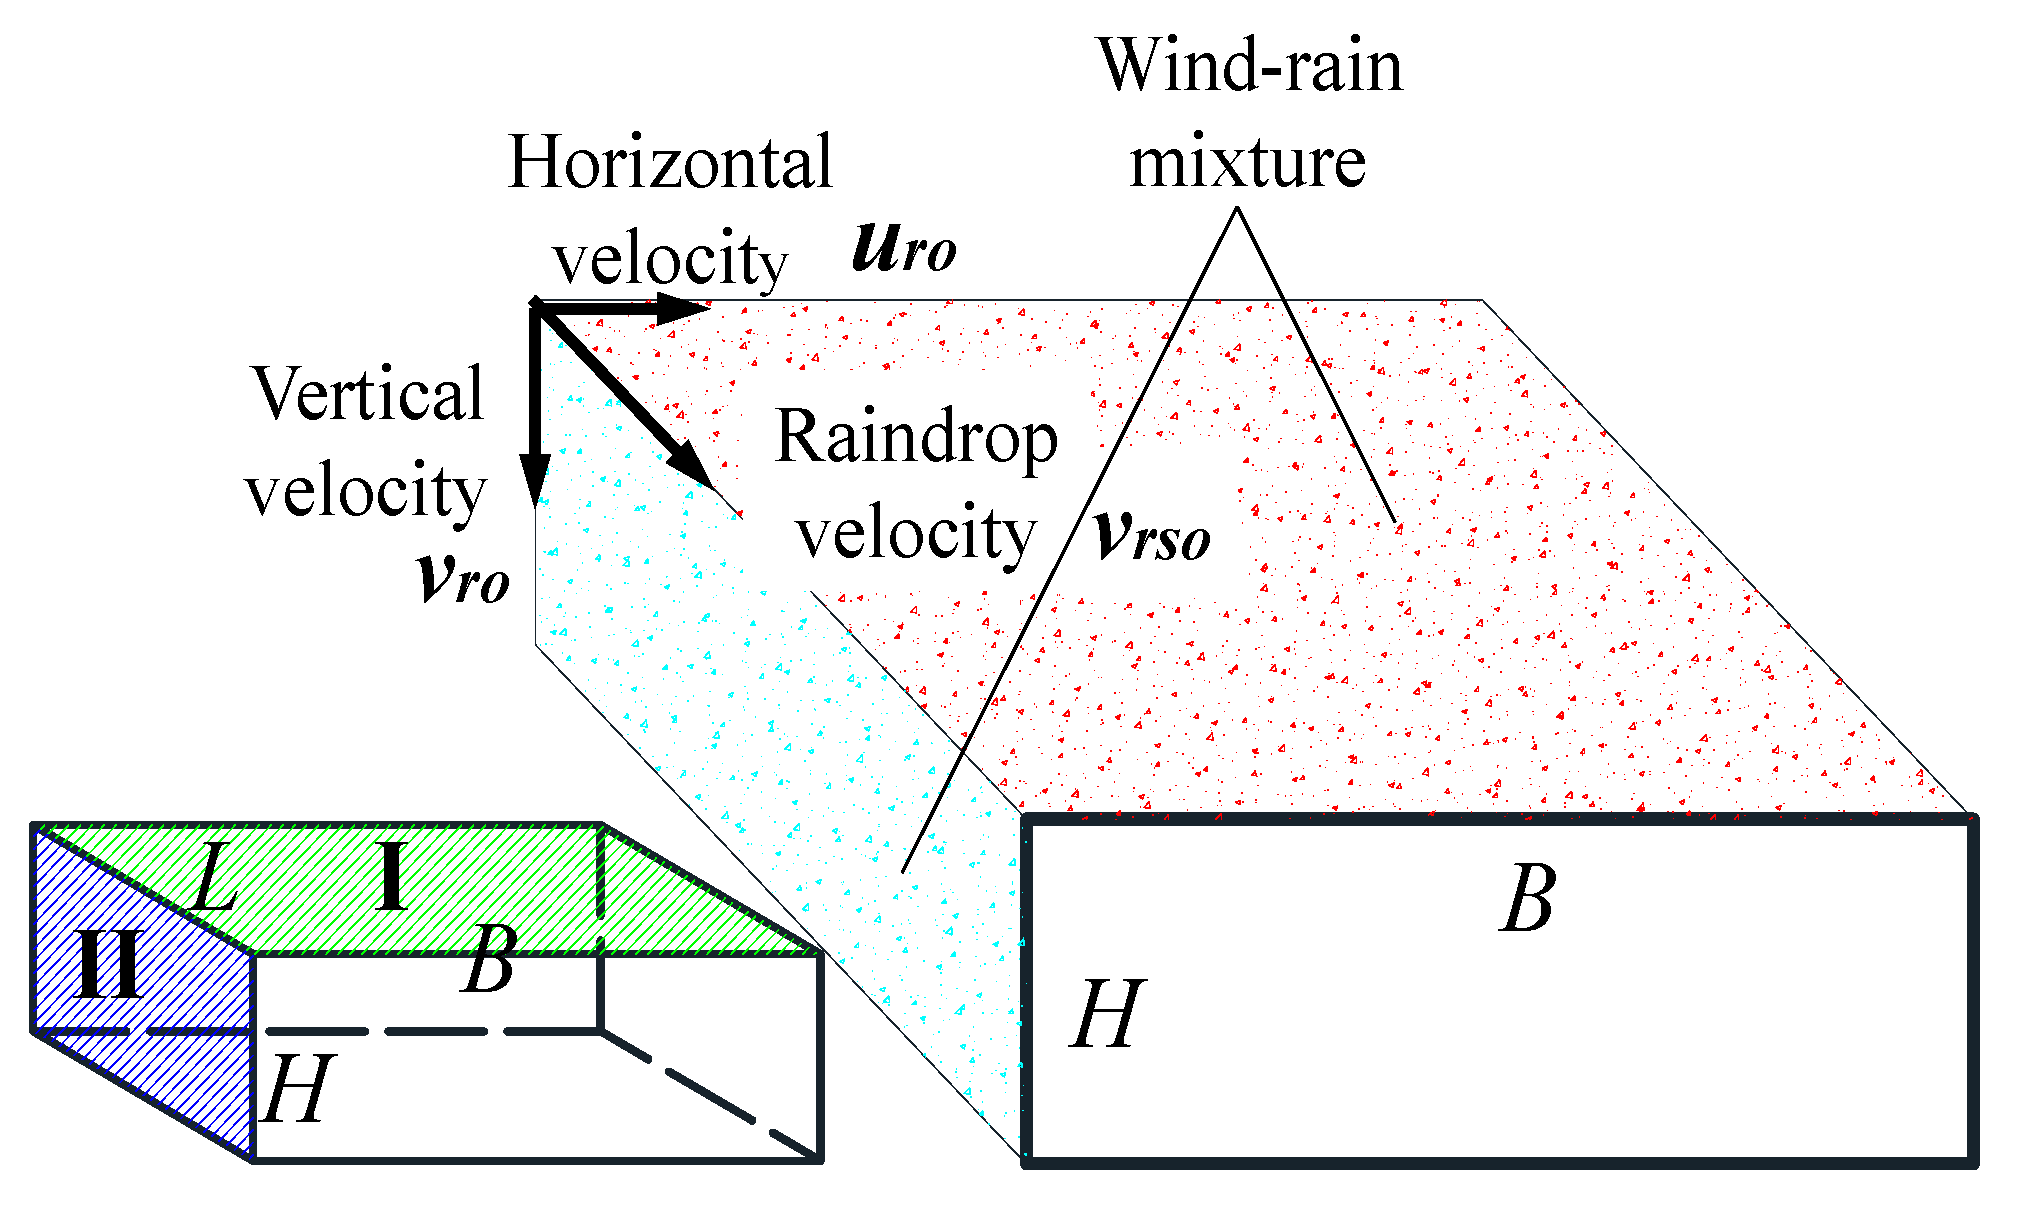
Based on the MWEM, the rain drop impact force acting on the main beam under the wind-driven rain condition is further analyzed. Taking the rectangular section as an example, the raindrop impact force on the structure under the wind-driven rain condition is shown in Figure 5.
Zone I and zone II in Figure 5 are upward and side windward surfaces, respectively. It is assumed that the raindrops are equivalent to D0, and the number of equivalent rain drops in a unit volume is n0. In time τ, the number of raindrops with diameter D0 falling in zone I and zone II is
N = ( L H u r 0 + L B v r 0 ) τ n 0
where L, B, and H represent the length, width, and height of the rectangle, respectively; and the other symbols are the same as previously mentioned.
The vertical force of raindrops Prv is
P r v = ρ r π 6 D 0 3 v r 0
The horizontal momentum Pru can be obtained by replacing vr0 with ur0. According to the momentum theory, within time τ, the total number of water droplets in zone I and zone II is equal to the impulse of the average load. Therefore, the vertical rain intensity impulse Frvτ can be expressed by
F r v τ = ( L H u r 0 + L B v r 0 ) τ n 0 ρ r π 6 D 0 3 v r 0 = ( L H u r 0 + L B v r 0 ) W L τ v r 0
Frv can be obtained by removing two sides of Equation (18):
F r v = ( L H u r 0 + L B v r 0 ) W L v r 0
Fru can be obtained by replacing the vertical velocity vr0 outside the parentheses with a horizontal velocity ur0.

3.2. Water Accumulation Model on the Main Beam Surface

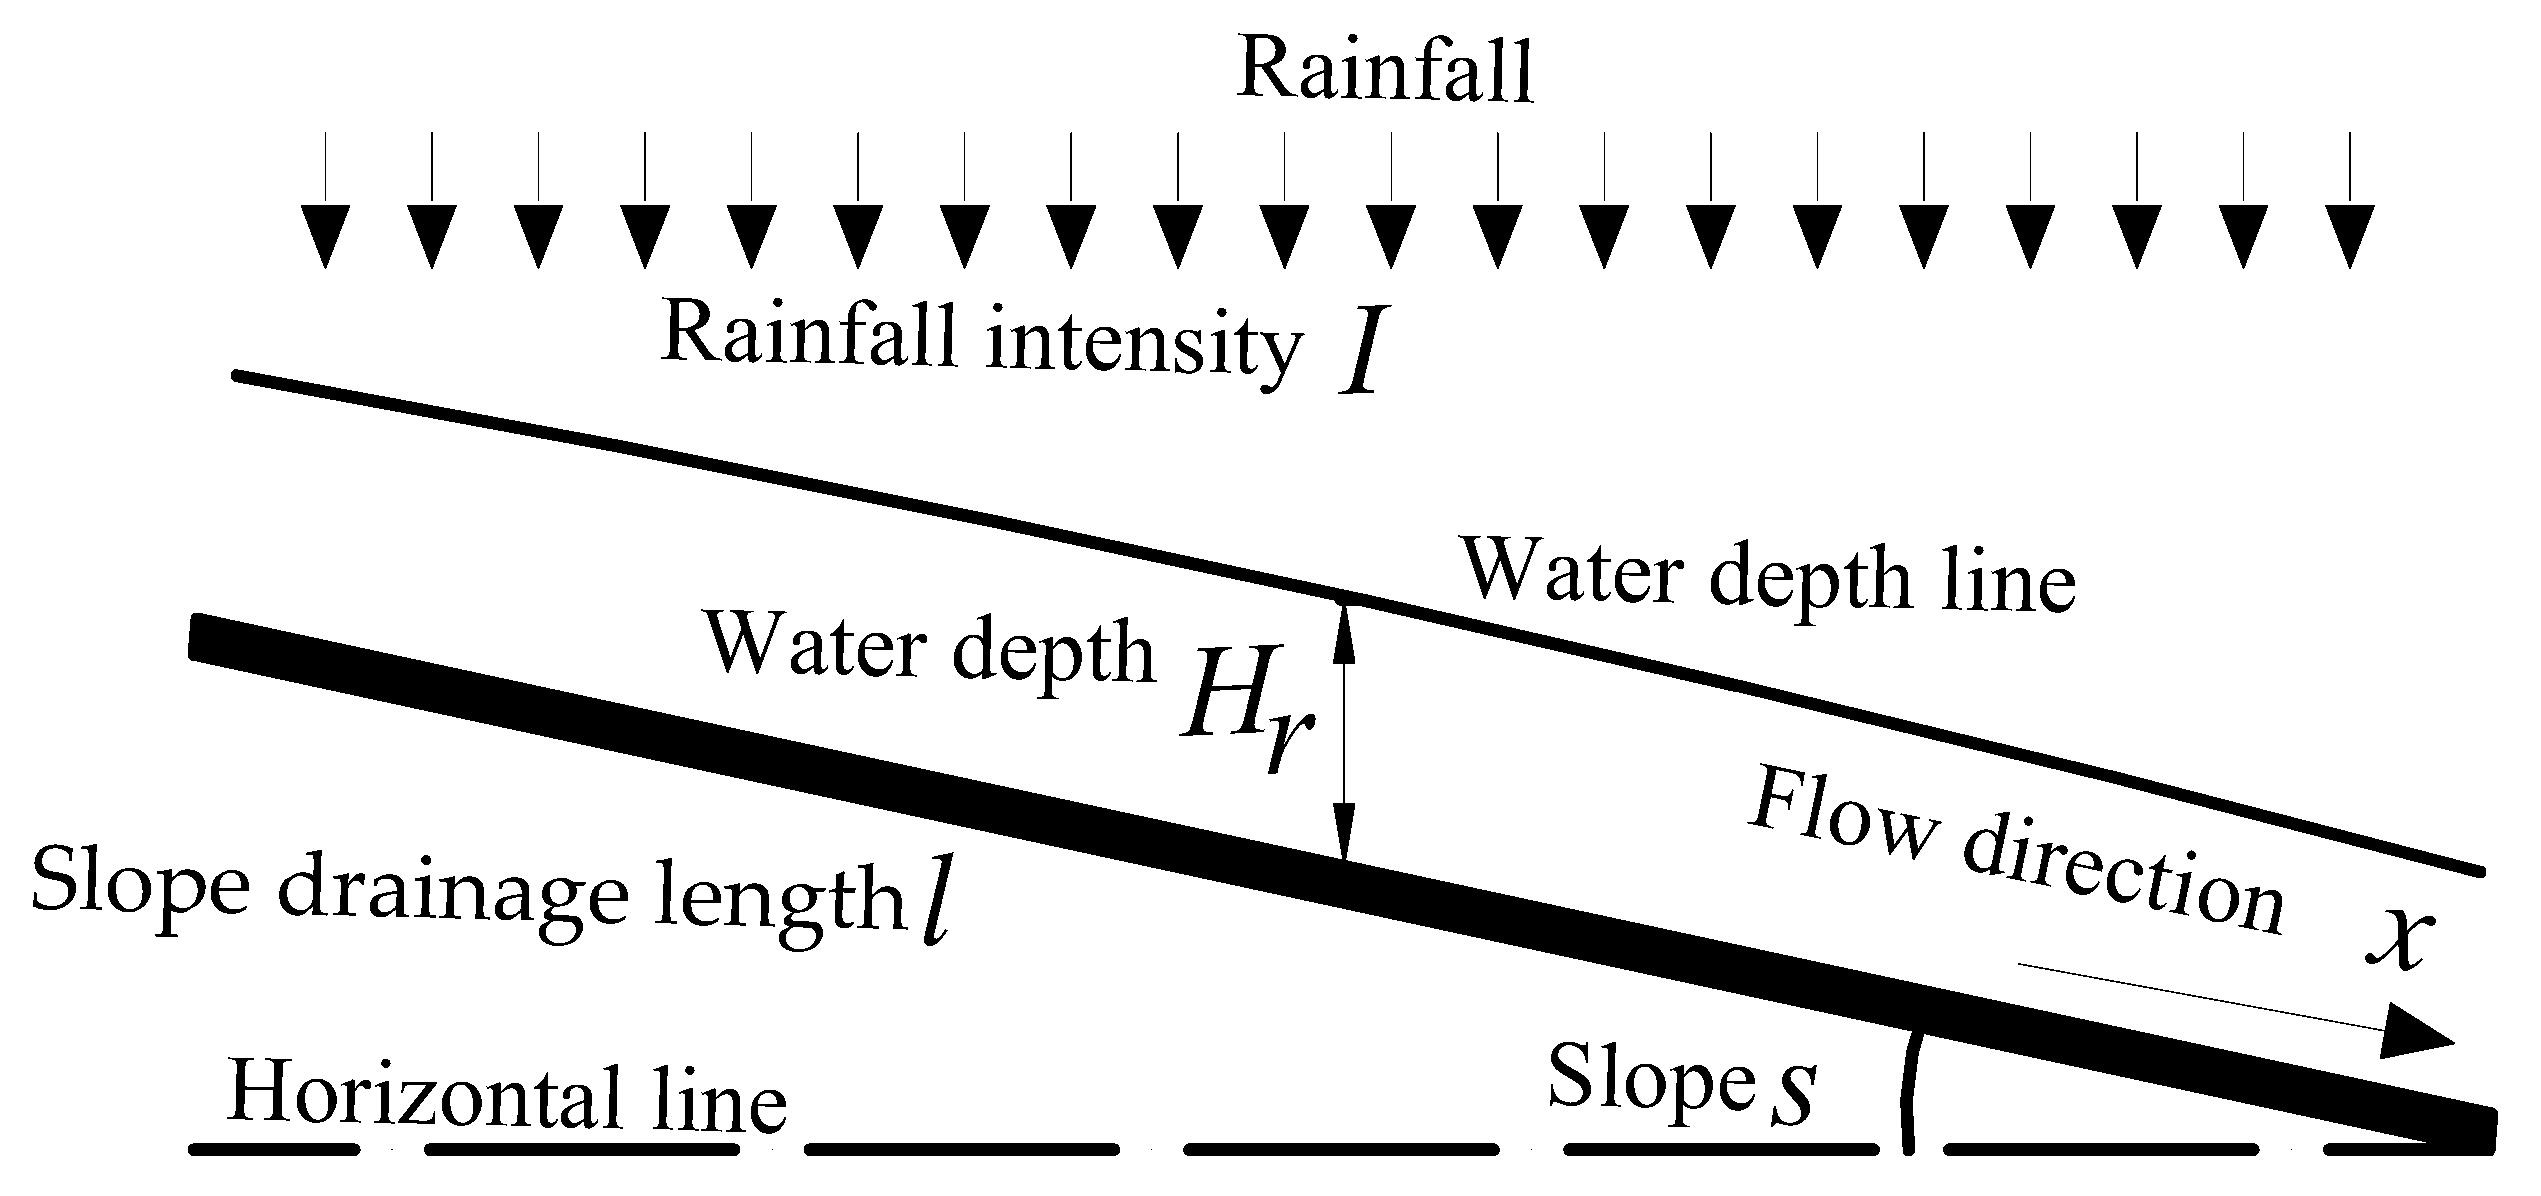
Rainfall striking the structural surface will form a complex production exchange flow. It is a process that is highly non-linear and uneven, and is difficult to estimate accurately, because of many affecting factors. For the bridge main beam, if the obstacle of its accessory member on the water flow can be ignored, it can be considered as a single-width and one-dimensional free drainage section (the slope is unchanged, the drainage state is in the longitudinal direction, and the water flow from the ramp is free to flow, as shown in Figure 6).
Due to the limited surface tension of water, the accumulated water is not infinitely increased, as is shown in Figure 6. Ji [38] obtained the regression equation (Equation (20)) of water thickness on a single-width and one-dimensional free drainage section through experiment and theoretical analysis.
H r = 0.1258 l 0.6715 S 0.3147 I 0.7786 T D 0.7261
where Hr is the water film thickness (mm); l is the slope drainage length (m); I is the rainfall intensity (mm/min); S is the slope, and the road slope is generally 0.5–2%; and TD is the slope construction depth (mm), which is generally 0.1–1 mm for the road. It can be seen from Equation (20) that Hr increases with the increase in l, I, and TD, but it decreases with the increase in S.

3.3. Analysis of the Wind-Driven Rain Pneumatic Three-Component Force of Main Beam

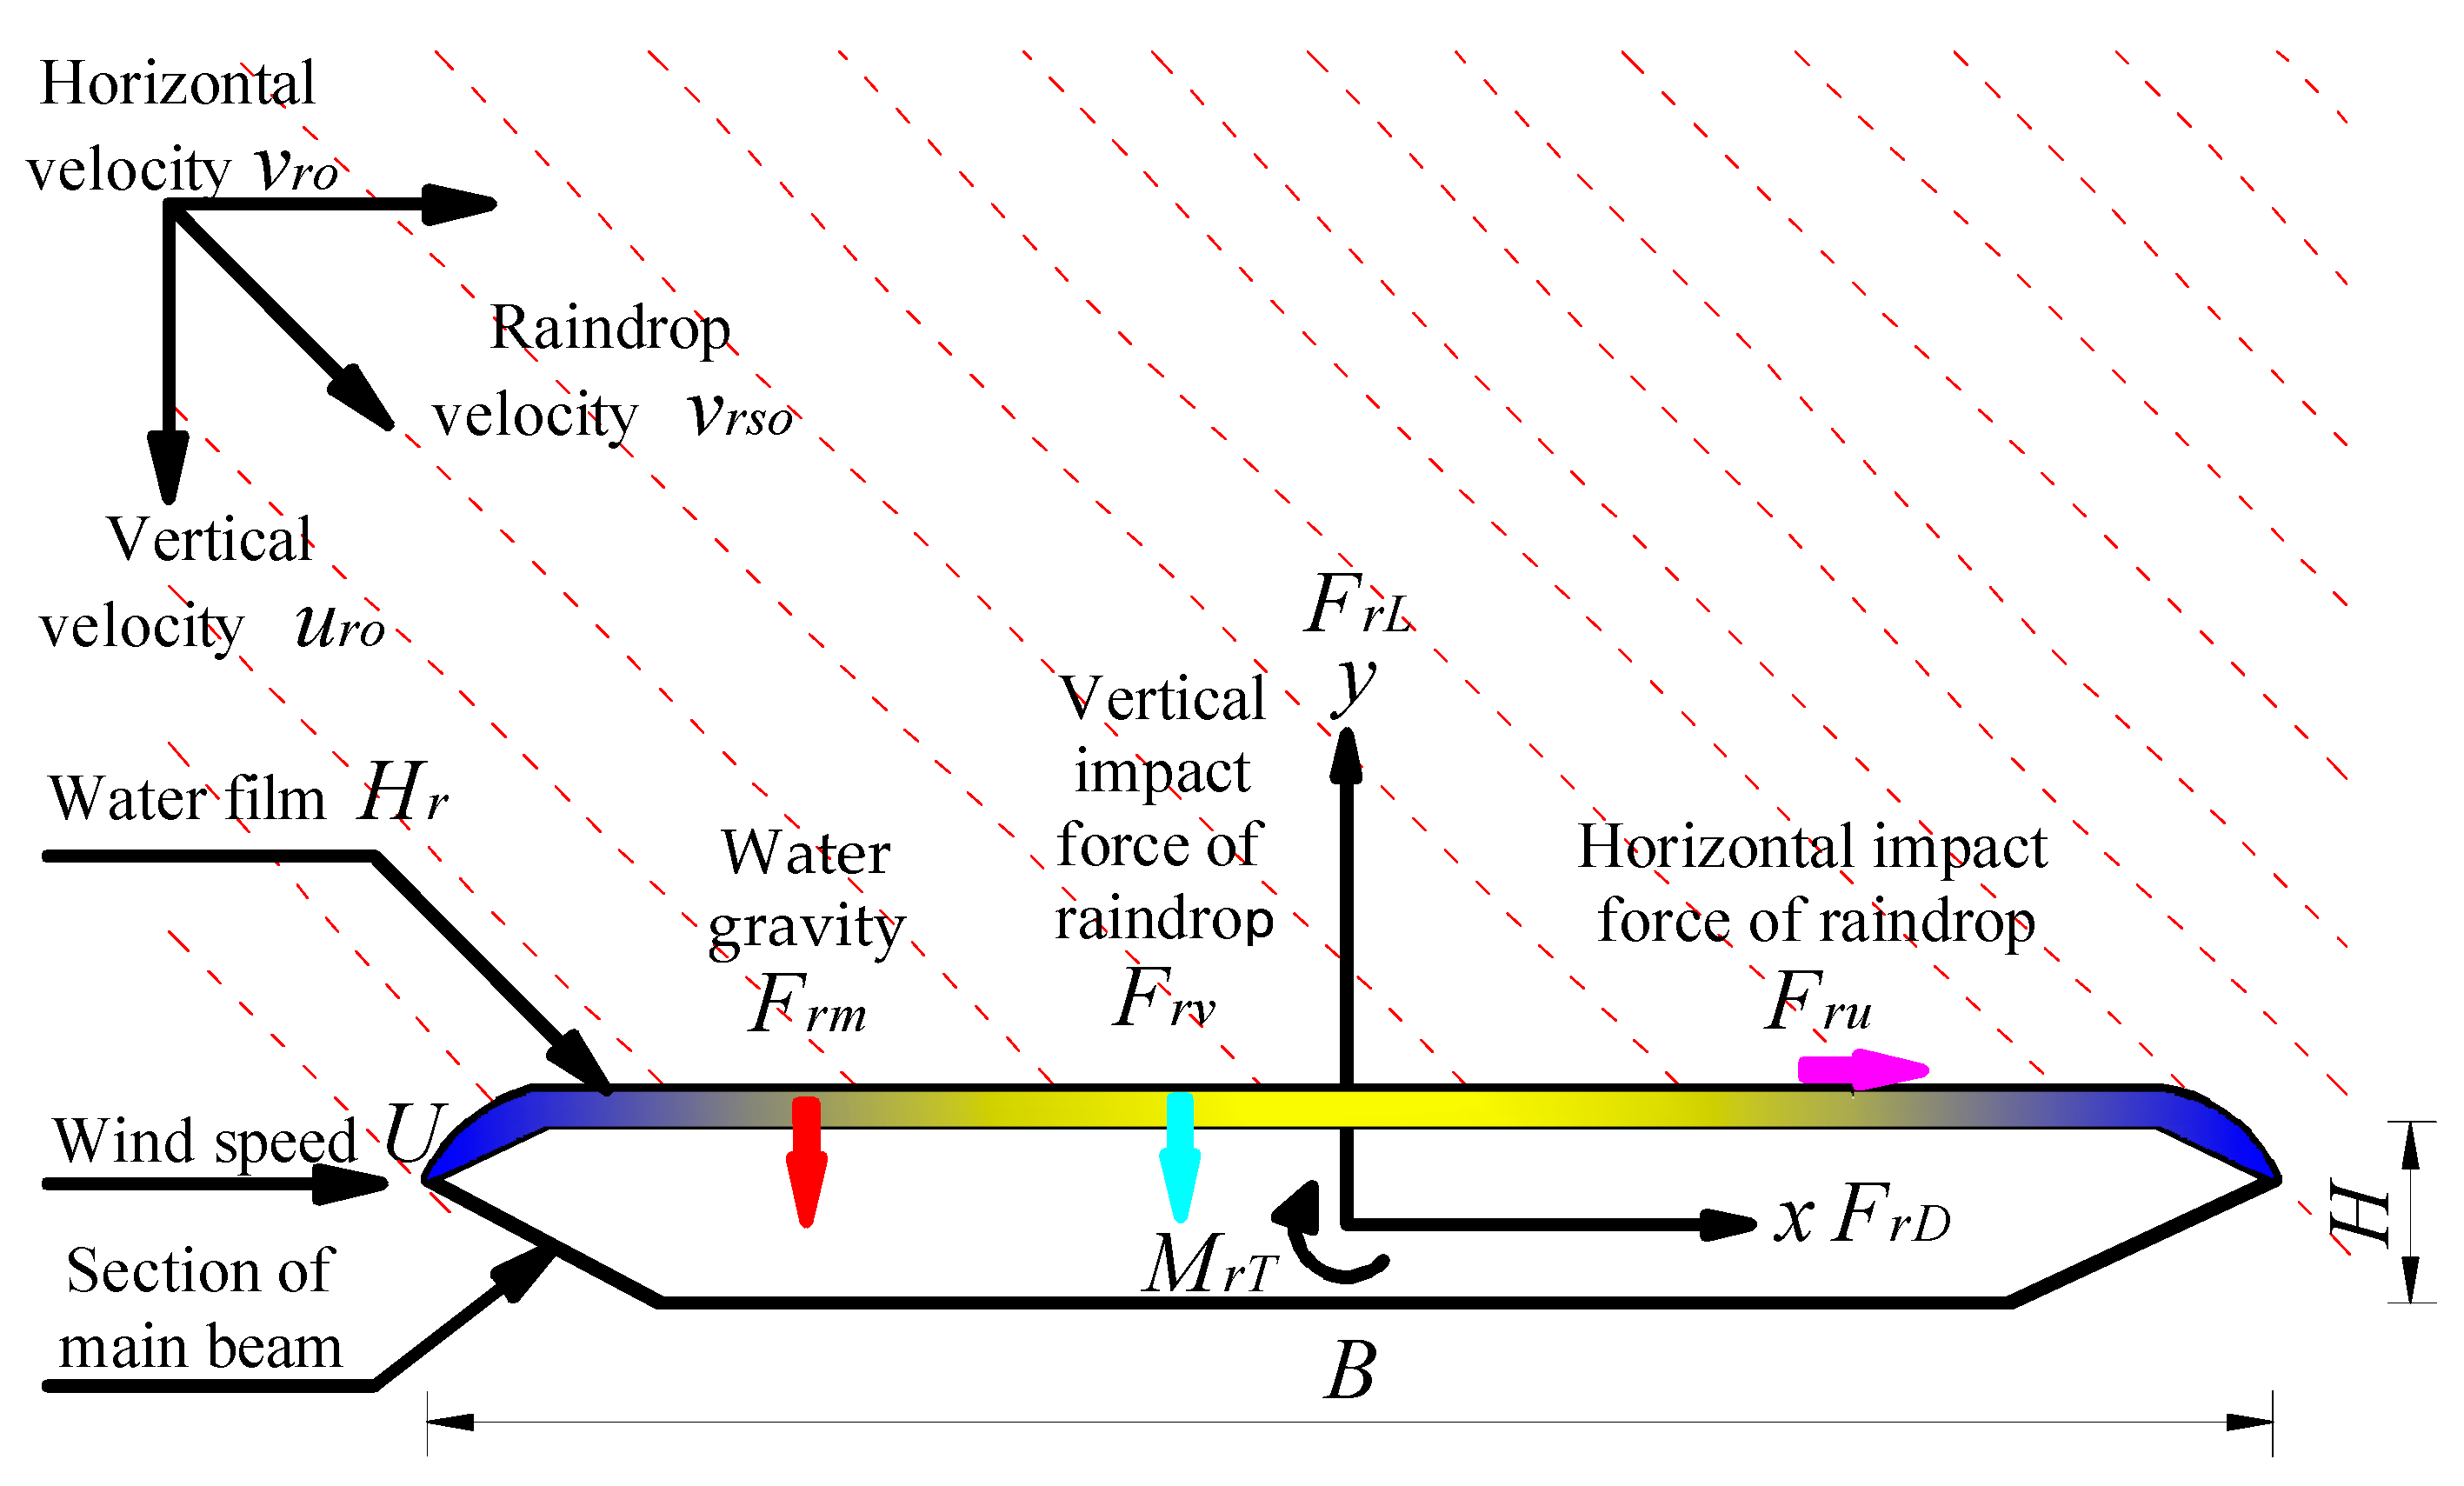
For the main beam section with many accessory facilities, its impact must be considered in Equation (18) with the correction coefficient, and the additional vertical force caused by surface water accumulation must also be considered. Wind-driven rain acting on the typical bridge main beam is shown in Figure 7.
According to Figure 7 and combined with the above analysis, it can be derived that the drag force of the wind shaft coordinate caused by rainfall can be expressed as
F r D = L ( μ H H u r 0 + μ B B v r 0 ) W L u r 0 + 1 2 ρ U 2 C D 0 Δ H L
where B and H are the projection value of the main beam width and height in the wind shaft coordinate system, respectively, and L is the main beam span. For the main beam section with the accessory facilities, it is necessary to consider its impact on the rain area. It can be represented by the drag and lift force correction coefficient. μH is a drag force area correction coefficient, and its value can be approximated to the ratio of the vertical projection of all accessory facilities and the main beam main body section in the wind shaft coordinate system and vertical projection of the main beam body section in the wind shaft coordinate system. μB is the correction coefficient of the lift force area, which can approximately be the ratio of the horizontal projection of all accessory facilities, the main beam body section in the wind shaft coordinate system, and the horizontal projection of the main beam body section in the wind shaft coordinate system. CD0 is the drag coefficient when there is no rain and ΔH is the thickness of accumulated water on the surface of the main beam.
For a single-width and one-dimensional free drainage section, the lift force caused by rainfall in the wind shaft coordinate system is expressed as
F r L = L ( μ H H u r 0 + μ B B v r 0 ) W L v r 0 + ρ r g k = 1 n H r k L k B k + 1 2 ρ U 2 C L 0 Δ B L
where n is the number of single-width free drainage sections on the surface of the main beam. Hrk, Lk, and Bk are the rheumatic thickness, span, and slope width of the k rain slope, respectively. CL0 is the lift coefficient when there is no rain and ΔB is the change in width of the main beam caused by surface water accumulation.
Supposing the centroid of the object is in the geometric center position, the additional torque caused by rainfall is
M r T = B / 2 B / 2 ( F r v ( x ) + F r m ( x ) ) x d x + H / 2 H / 2 F r u ( y ) y d y + 1 2 ρ U 2 C M 0 Δ B 2 L
where Frm is the water accumulation gravity and x and y are integral variables. CM0 is the torque coefficient when there is no rain. Since the torsional movement causes the complexity of rainfall on the structural surface, it is difficult to accurately calculate its effect.

4. Wind-Driven Rain Aerodynamic Force Test of the Main Beam

4.1. Overview of the Test

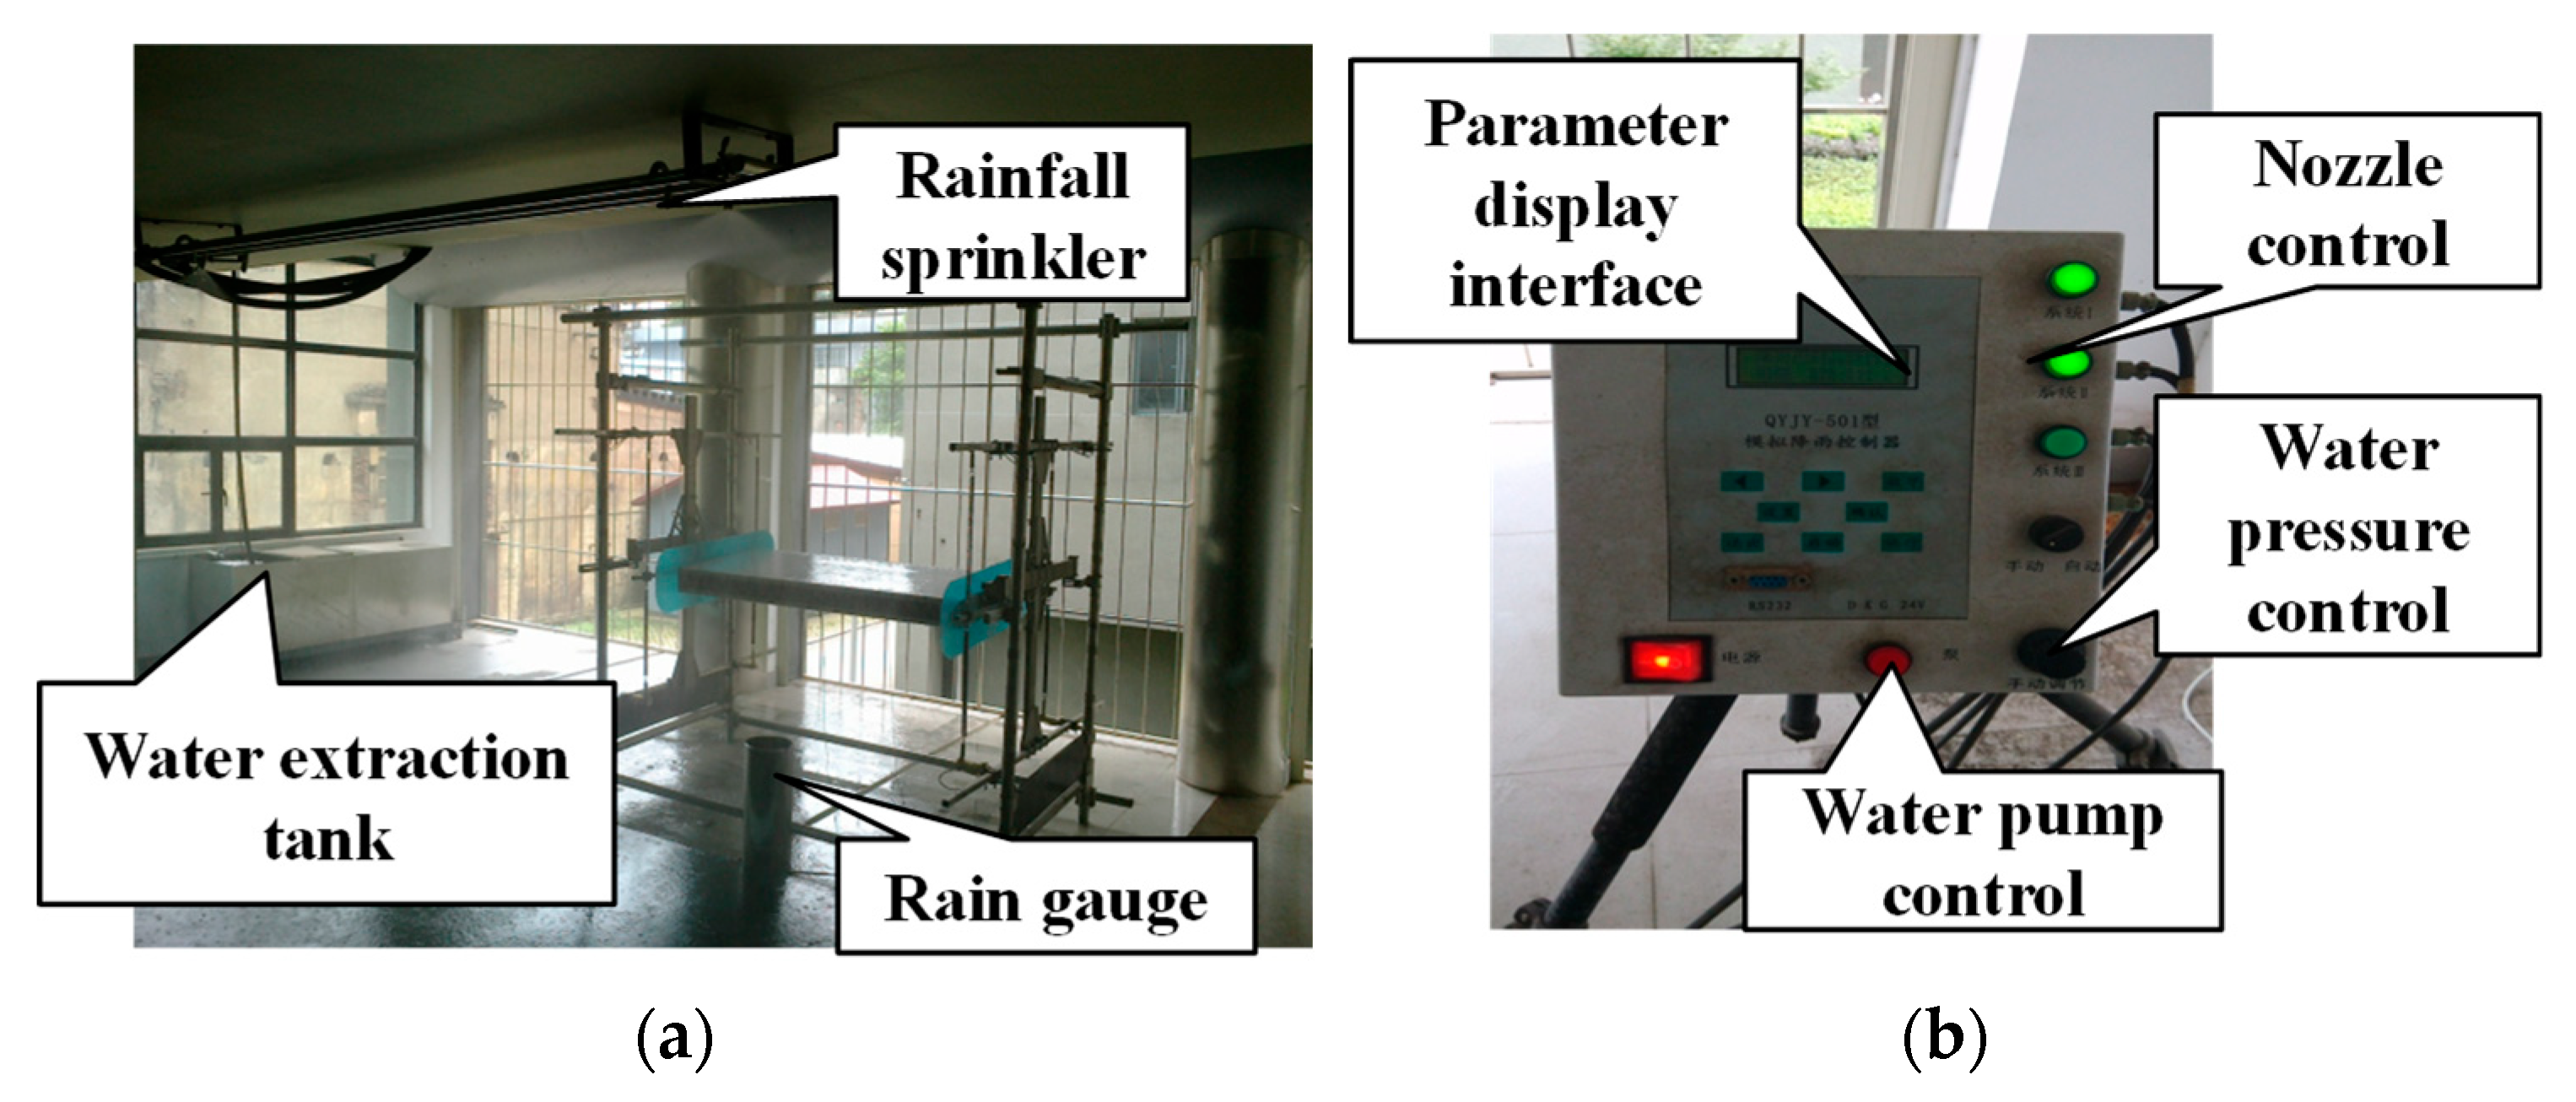
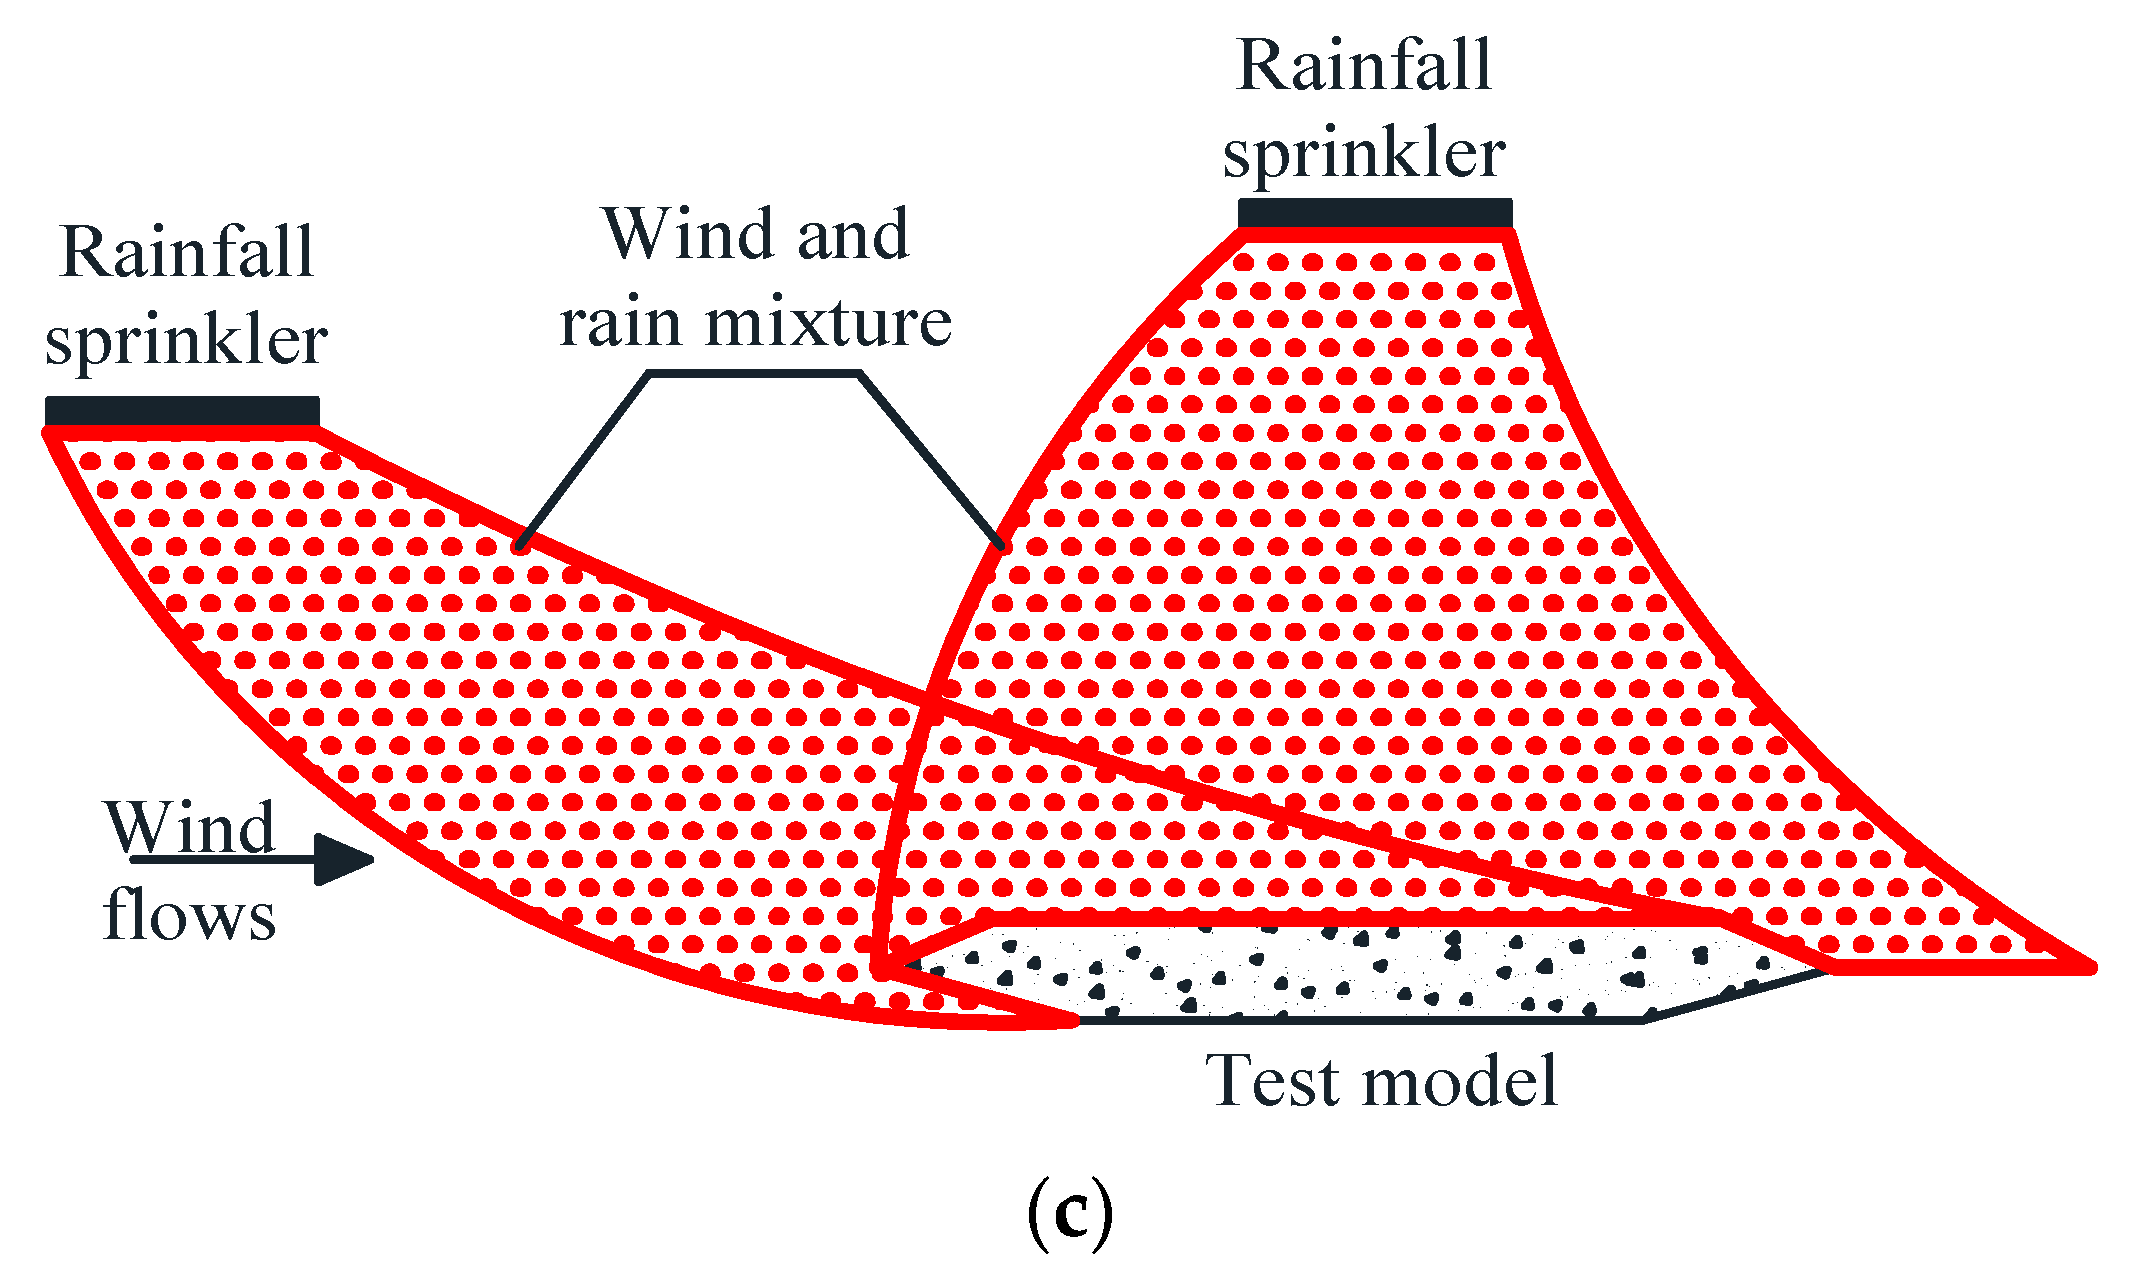
The test was carried out in the low-speed jet segment in the HD-2 wind tunnel of Hunan University. After the wind speed exceeds 5 m/s, the turbulence is less than 6%. The Qyjy-501 artificial simulated rainfall device produced by Xi’an Qingyuan Testing Technology Co., Ltd. (Qingyuan, China). In Xi'an, China was used. It uses the pressure vertical spray simulated rainfall process with a rain intensity regulation range and good uniformity, making the rain drop median particle size of the rainfall and the kinetic energy very close to natural rainfall. The test platform is shown in Figure 8.
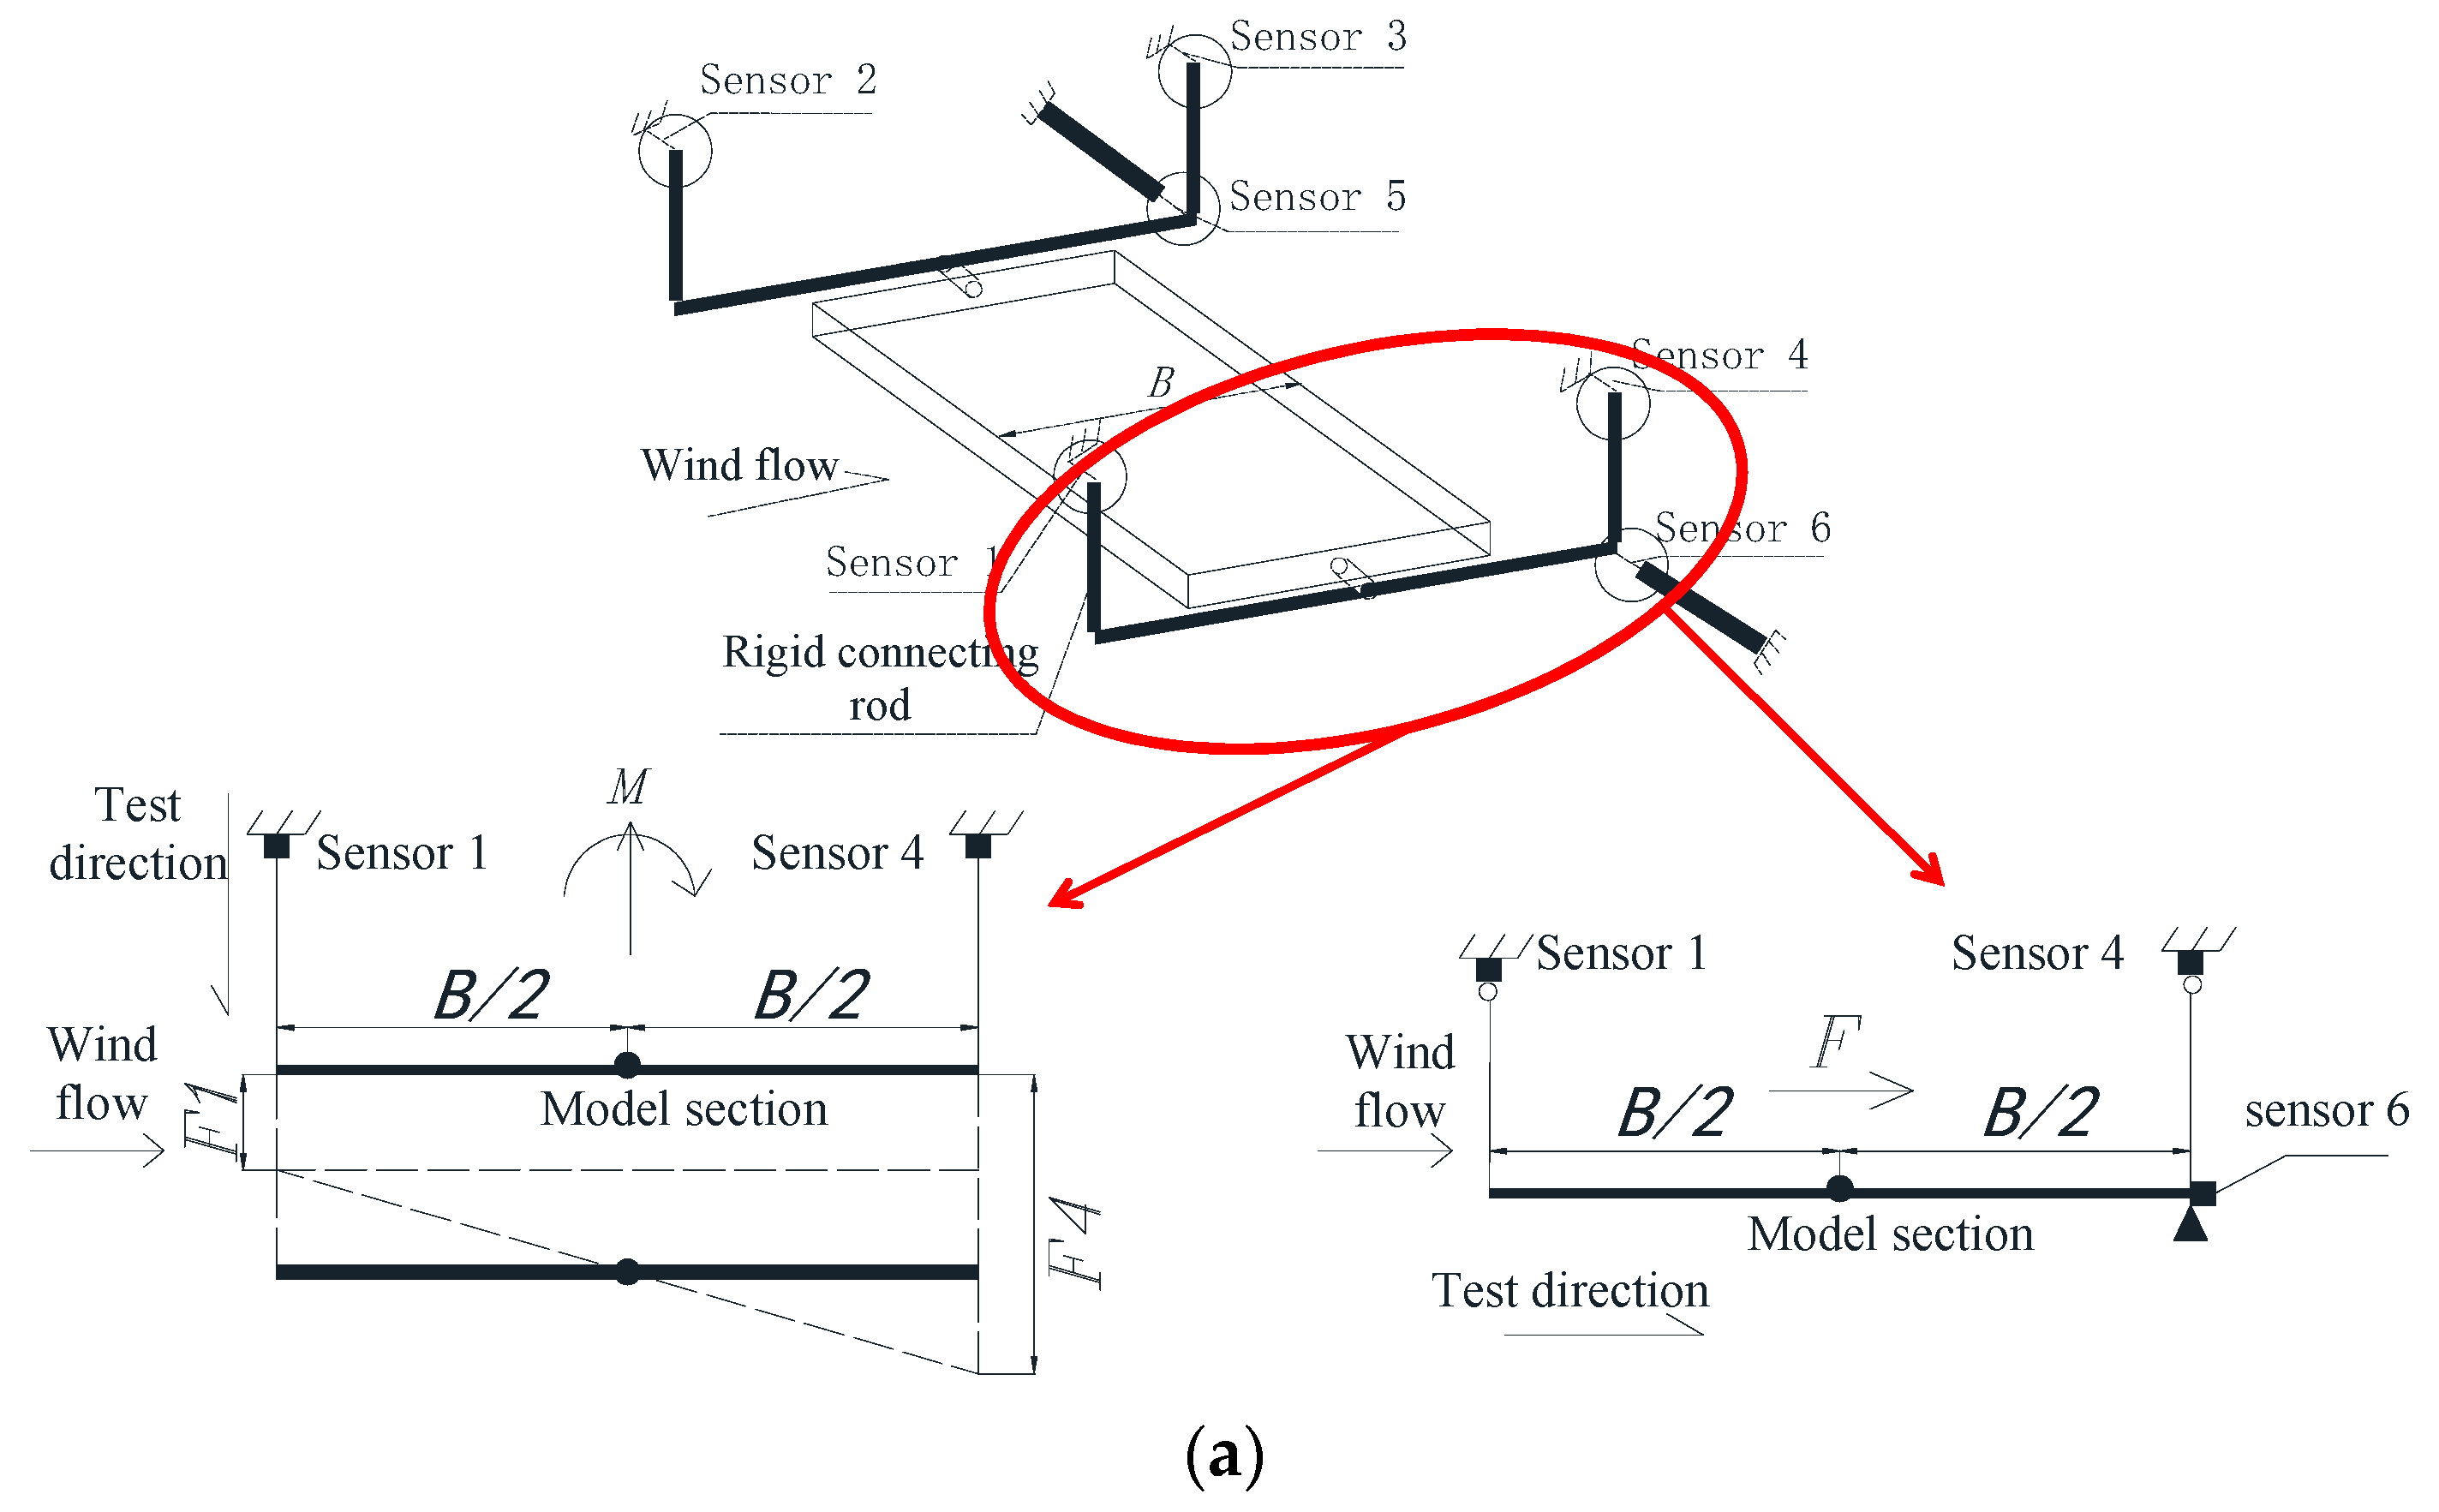
The force-measuring device is shown in Figure 9. When the vertical force and the torque moment are measured, force sensors 5# and 6# are detached from the structure, and sensors 1# to 4# bear the vertical force because they are connected to the model with a rigid connecting rod. When the horizontal force is measured, the contact portion of sensors 1# to 4# and the rigid boom changes from the consolidation to the hinge (it can be rotated in the direction of the flow), thereby avoiding the generation of the horizontal constraint that causes the horizontal force, to make sure that sensors 5# and 6# bear all the force. Using this set of devices, the calculation equation of the three-component force is obtained, as shown in Equation (24).
F L = | F 1 + F 2 + F 3 + F 4 | M T = ( | F 1 F 4 | + | F 2 F 3 | ) × B 2 F D = | F 5 + F 6 |
where Fi is force measured by sensor i; B is the model width; and FL, MT, and FD are the lift, torque, and drag force, respectively (as seen in Figure 9a).
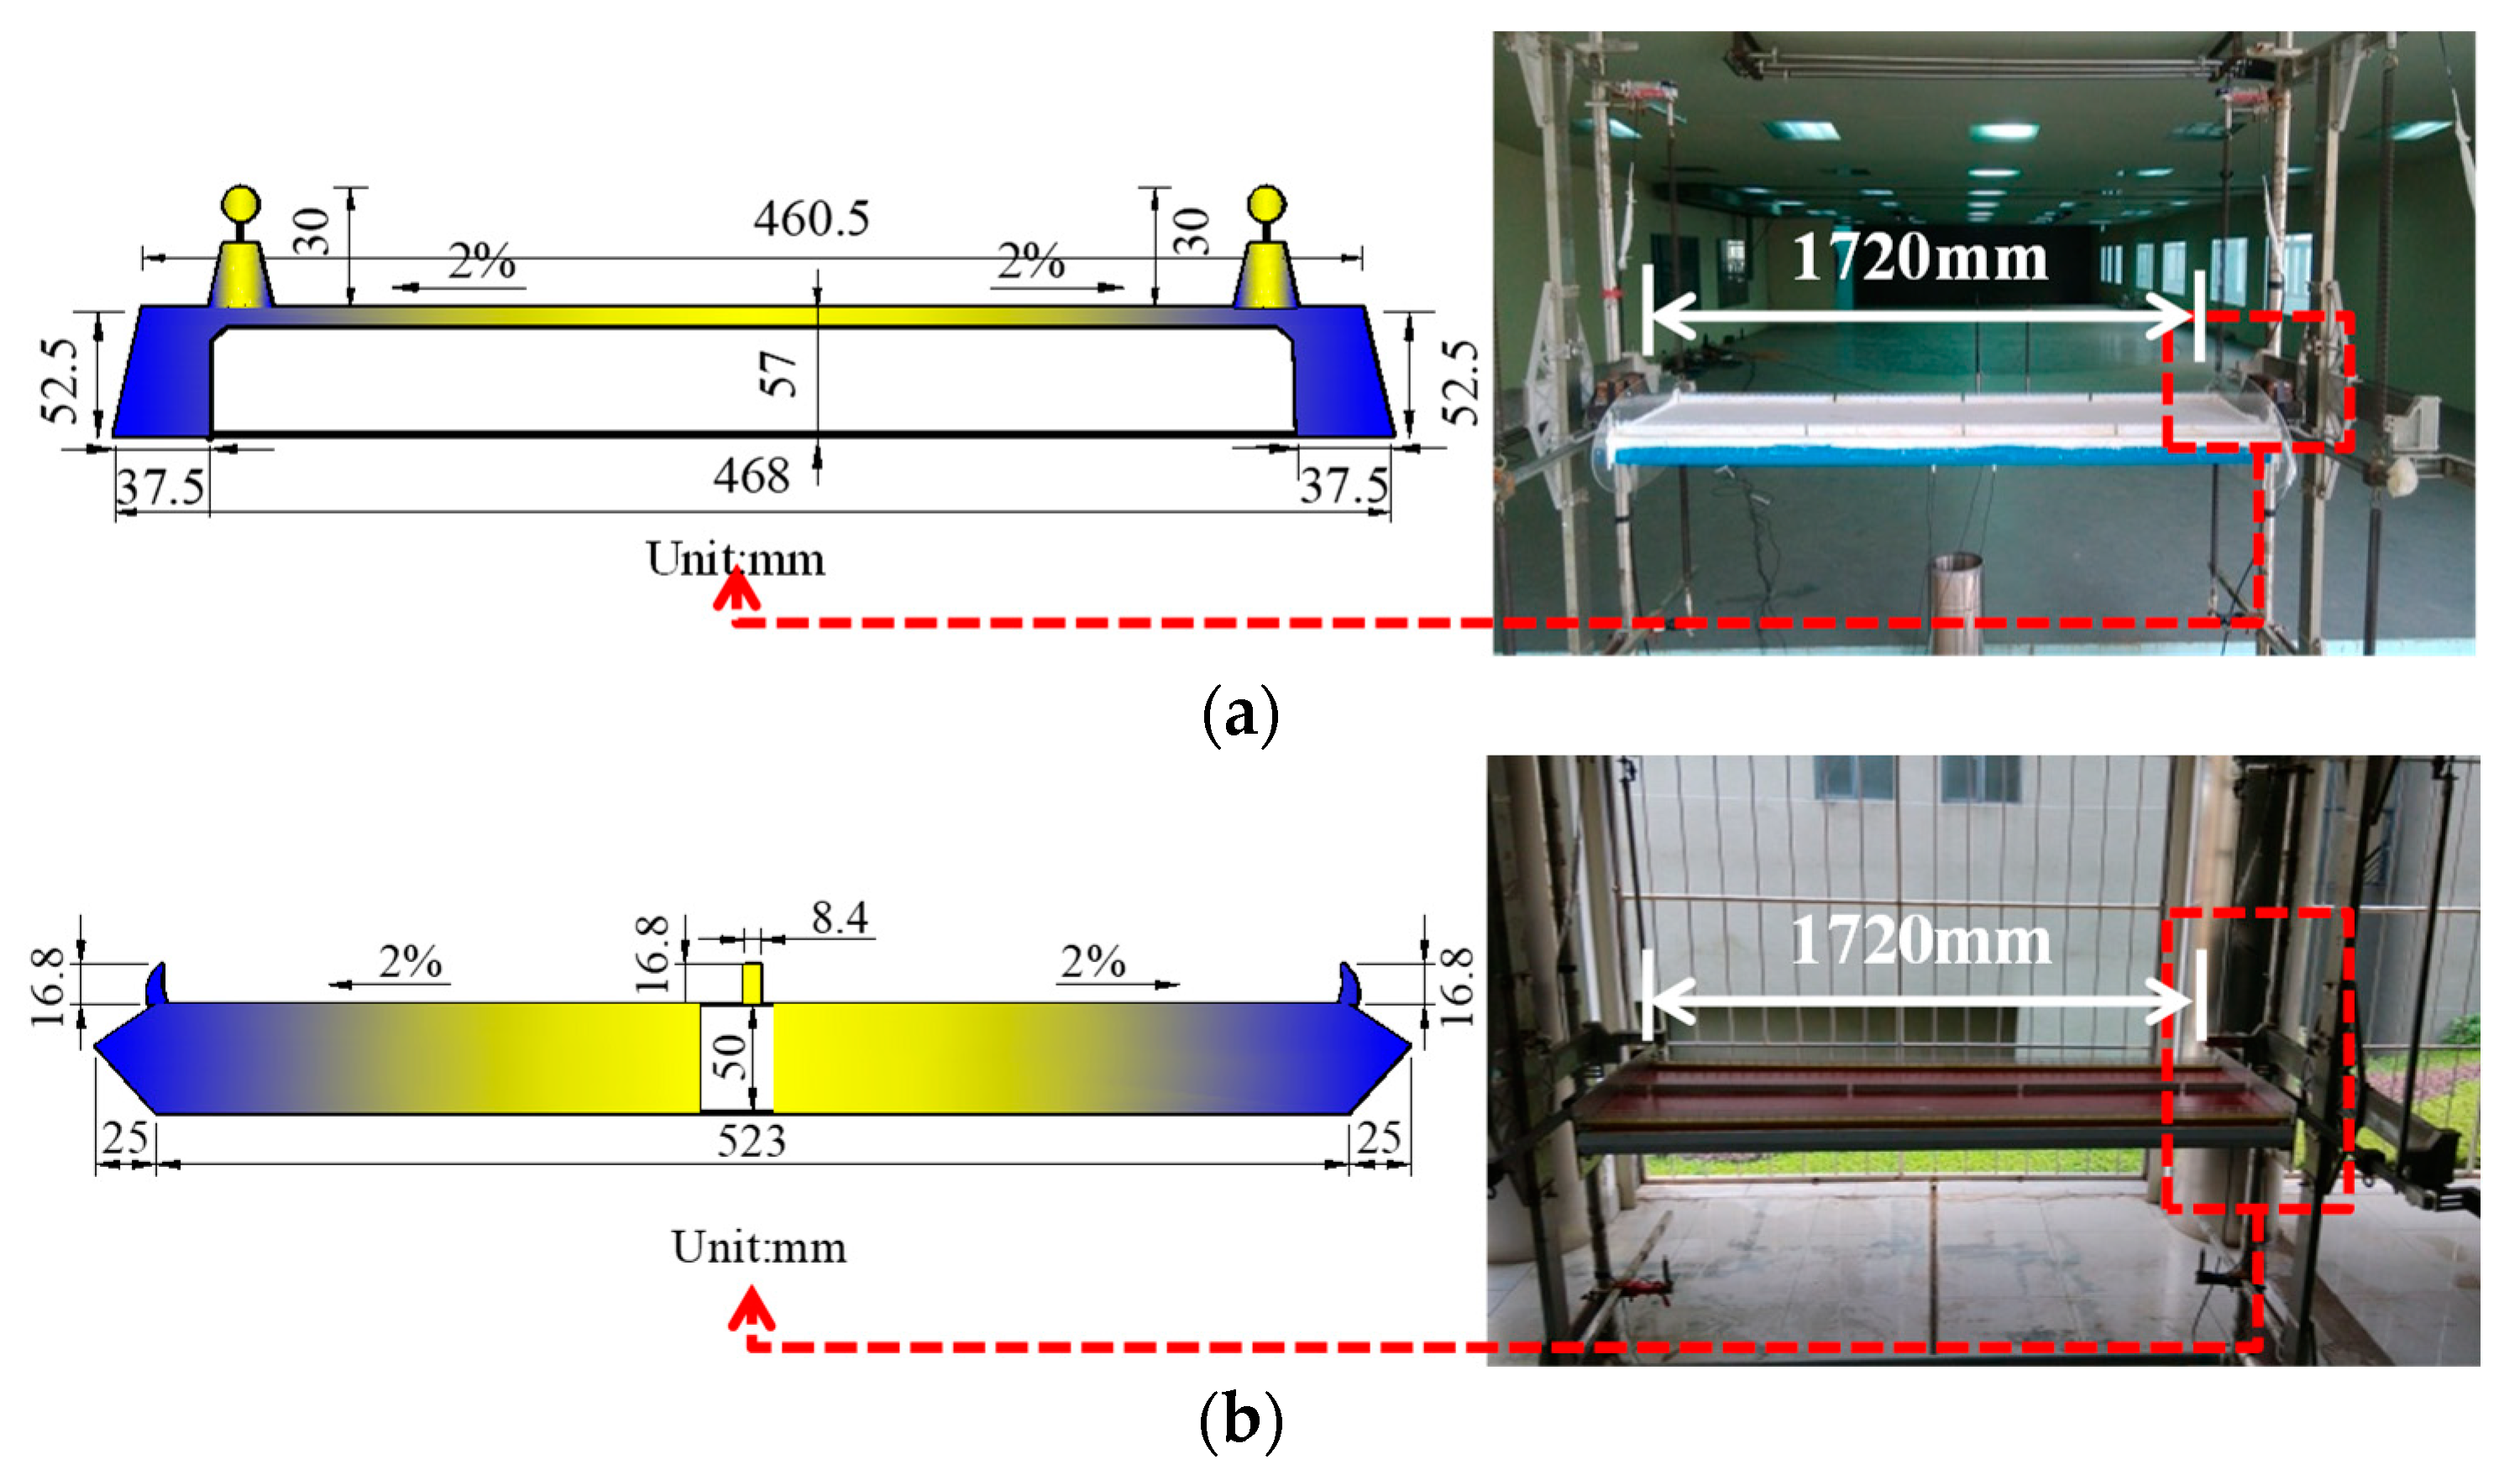
The test selected two typical bridge main beam sections, as shown in Figure 10. It was a bidirectional sloping bridge deck, with a slope of 2%. The test wind speed was 7.3 m/s; the angle of attack was 0°, +3°, and −3°; and the test rain intensity was 0 mm/h, 30 mm/h, 60 mm/h, and 120 mm/h.

4.2. Test Results and Analysis

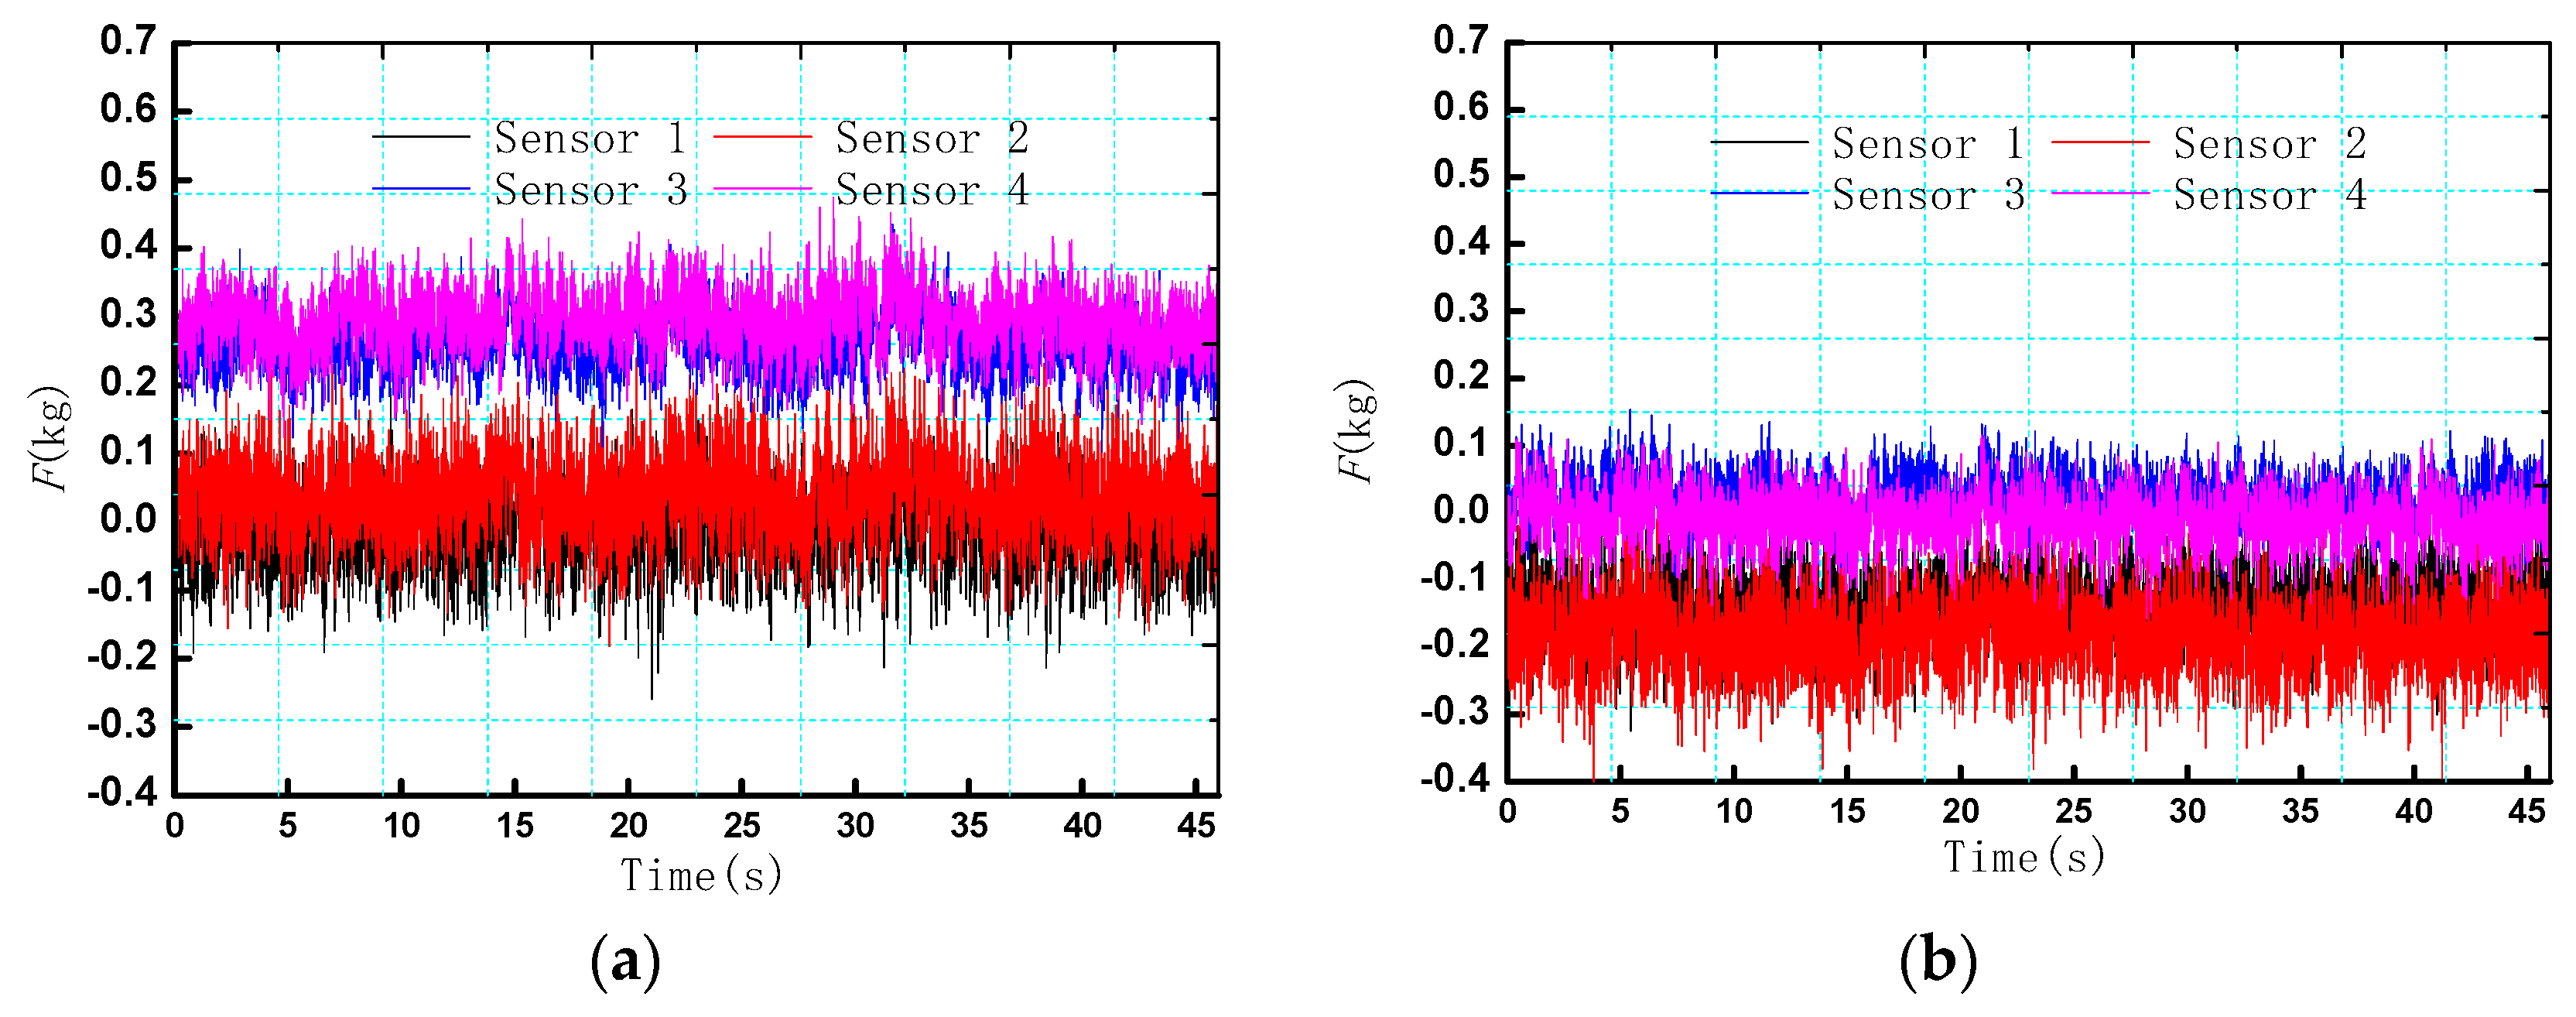
The original sampling signal of sensors in the dynamic test is shown in Figure 11, which has a certain vibration noise, mainly caused by factors such as instantaneous impact, sputtering, and bounce. In addition, the vibration of the model itself caused by the wind can also bring measuring noise. Therefore, the above-mentioned measurement noise on the static wind effect can be eliminated by applying the sample data mean.
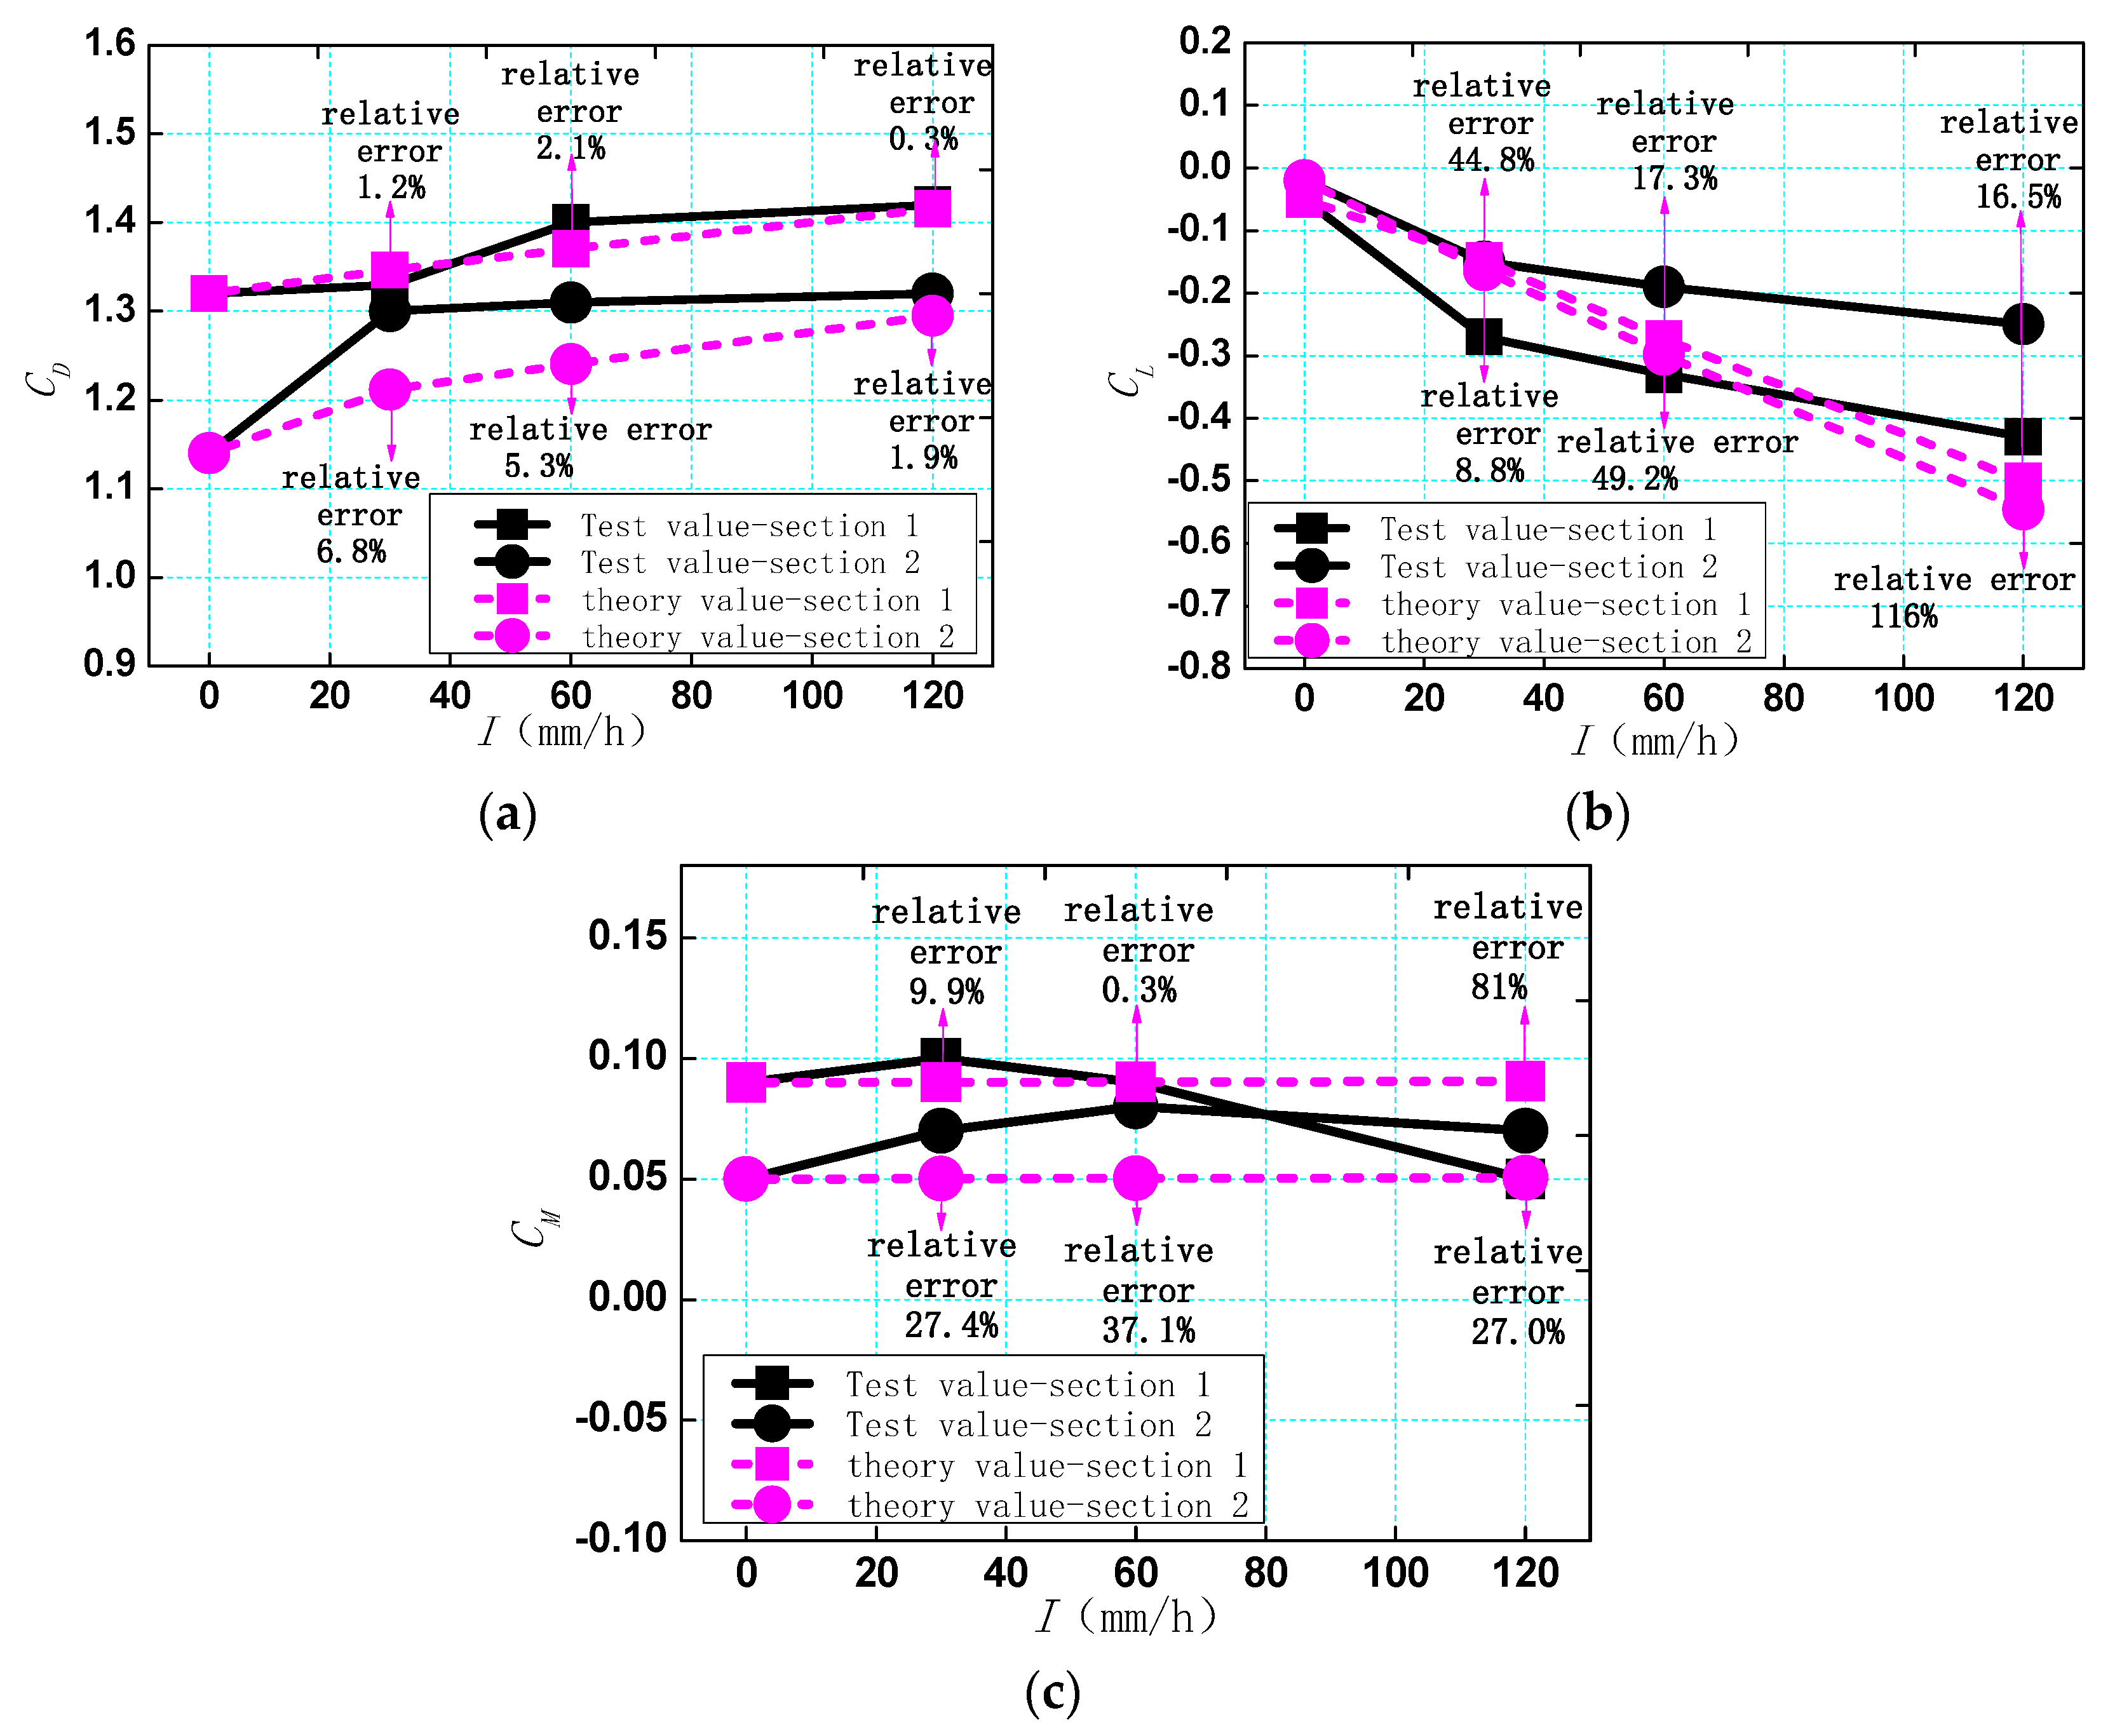
Taking the test and theoretical calculation results at the 0° attack angle (α = 0°) as an example, the variation in the three-component coefficient under different rain intensities is shown in Figure 12. It can be seen from the figure that the drag coefficient increases with the increase in rain intensity, the lift coefficient decreases significantly with the increase in rain intensity, and the torque coefficient changes little with no obvious trend. For the theoretical calculation results in the figure, taking I = 120 mm/h of rain intensity of a streamlined cross-section as an example, the geometric size information and other parameter information of the main beam section given in Figure 10 are calculated as follows:
L = L1 = L2 = 1.72 m, H = 0.05 m, B = 2B1 = 2B2 = 0.52 m;
μH = 0.0168   ×   3   +   0.05 0.05 = 2 , μB= 0.025   ×   2   +   0.52 0.52 = 1.1 ;
ρ = 1.225 kg/m3, ρr = 1000 kg/m3, g = 9.8 m/s2, U = uro=7.3 m/s, vro = 7.66 m/s, WL = 4.96 × 10⁻³ kg/m3, n = 2, ΔH = Hr = Hr1 = Hr2 = 0.056 mm, ΔB = 0 mm;
The initial drag coefficient CD0 = 1.18, the initial lift coefficient CL0 = 0.00, and the initial torque coefficient CM0 = 0.05.
Substituting the above known parameters into Equations (21)–(23), respectively, the theoretical three-component force coefficient can be obtained as follows:
C D = F r u + F D 1 2 ρ U 2 H L = L ( μ H H u r 0 + μ B B v r 0 ) W L u r 0 + 1 2 ρ U 2 C D 0 Δ H L + 1 2 ρ U 2 C D 0 H L 1 2 ρ U 2 H L = 1.295
C L = F r v + F L 1 2 ρ U 2 B L = L ( μ H H u r 0 + μ B B v r 0 ) W L v r 0 + ρ r g k = 1 n H r k L k B k + 1 2 ρ U 2 C L 0 B L 1 2 ρ U 2 B L = 0.545
C M = M r T θ + M T 1 2 ρ U 2 B 2 L = H / 2 H / 2 F r u ( y ) y d y + 1 2 ρ U 2 C M 0 Δ B 2 L + 1 2 ρ U 2 C M 0 B 2 L 1 2 ρ U 2 B 2 L = 0.0505
From the comparison of the theoretical and experimental results of the three-component force coefficients, we know that the minimum, maximum, and average deviations of the drag force coefficient are 0.3%, 6.8%, and 2.93%, respectively; those of the lift force coefficient are 8.8%, 116%, and 42.1%, respectively; and those of the torque force coefficient are 0.3%, 81%, and 30.45%, respectively. Therefore, the theoretical and experimental results of the drag coefficient have the best agreement while the deviations in the lift and torque coefficients are much larger. It is worth noting that the two maximum deviation values (116% and 81%) both occurred during the rain intensity of 120 mm/h, which is not very reasonable. In the following text, we discuss the possible causes of this phenomenon.
From the comparison of the theoretical and experimental results of the two sections (Sections 1 and 2), we know that the average deviations for Sections 1 and 2 of the drag force coefficient are 1.2% and 4.6%, respectively; those of the lift force coefficient are 26.3% and 58%, respectively; and those of the torque force coefficient are 30.4% and 30.5%, respectively, except for individual points (such as 44.8%-CL and 81%-CM), where the theoretical and experimental values of Section 1 (π-shaped cross-section) match better.
From the comparison of the theoretical and experimental results of different rainfall intensities (30 mm/h, 60 mm/h, and 120 mm/h), we know that the average deviations for rainfall intensities of 30 mm/h, 60 mm/h, and 120 mm/h of the drag force coefficient are 4%, 3.7%, and 1.1%, respectively; those of the lift force coefficient are 26.8%, 33.25%, and 66.4%, respectively; and those of the torque force coefficient are 18.6%, 18.7%, and 54%, respectively. From the comparison, it can be seen that as the rainfall intensity increases, the deviation shows an increasing trend.

5. Discussion

The reasons for the deviation between theory and test values of aerodynamic forces are analyzed as follows:
  • Firstly, the water content in a unit volume of air, the raindrop size, the raindrop spectral characteristics, and the falling velocity of experimental rainfall and natural rainfall may not be completely consistent, while theoretical calculations ideally use natural rainfall characteristic parameters, which will inevitably lead to a deviation in the results.
  • Secondly, under the wind axis coordinate system used in this article, the aerodynamic drag force of the experimental model is mainly affected by the impact force of raindrops, while the aerodynamic lift and torque force, especially for the aerodynamic lift force, are more affected by the gravity of surface water accumulation. This conclusion is consistent with the literature [35,36]. Therefore, the error of surface water accumulation, especially under heavy rain, can cause significant deviation in the results of the surface runoff model. However, the surface water accumulation runoff model used in this article is an empirical model (Equation (20)), but for water accumulation on the surface of the main beam, its accuracy and applicability still need to be verified.
  • Thirdly, the reasons for differences in the consistency between theoretical and experimental values of two types of cross-sections is that the side of the streamlined section is in a broken line form, and the lower edge of the side may not be fully impacted by raindrops, due to the obstruction of the upper edge. However, in theoretical calculations, the entire side is treated as a straight line, resulting in an increase in error.
  • Finally, the reason the error tends to increase with the increase in rain intensity may be related to the more complex water accumulation state on the surface of the main beam under heavy rain intensity and its influence on the impact force of raindrops. This reason has been mentioned and analyzed in detail in the literature [21,23]. So, in Figure 10, the two maximum deviation values (116% and 81%) both occurred during a rain intensity of 120 mm/h, barring any problems with the rainfall equipment.
Comparing the theoretical and experimental results, it can be seen that the simplified calculation method for the wind-driven rain impact force of the main beam can be used as a practical approximate estimation method. The correctness of the surface runoff model caused by rainfall still needs to be further explored.

6. Conclusions

According to the characteristics of rainfall, the changes in air density caused by rainfall and the theoretical calculation method of raindrop impact force are discussed in detail. Based on the simplified calculation method of raindrop impact force and the existing empirical formula for calculating the water film thickness on drainage slopes, a calculation method for the additional aerodynamic three-component force on the main beam under the action of wind-driven rain is proposed. Finally, the accuracy of the methods is verified through wind-driven rain aerodynamic force tests on two typical bridge main beam sections. The main conclusions are as follows:
1.
Even when the rainfall intensity reaches 709 mm/h (extreme value in China), the increase in density of air is less than 2%, and the change in density of air caused by rainfall can be ignored.
2.
This article proposes the mass-weighted equivalent method (MWEM) to simplify the calculation process of raindrop impact force. Compared with the theoretical method, the error of the simplified calculation method (MWEM) increases with the increase in rainfall intensity, but even if the rainstorm intensity reaches 709 mm/h, the error is only about 4%, which can meet the accuracy of engineering applications. At the same time, the accuracy of the MWEM is verified through wind-driven rain experiments of two typical bridge main beam sections. It can be used for engineering applications.
3.
For the additional aerodynamic force of the main beam under the action of wind-driven rain, in the wind axis coordinate system used in this article, the drag force mainly considers the impact force of raindrops, which is different from the lift and torque force that must simultaneously consider the impact force of raindrops and the complex water accumulation on the surface of the main beam. Therefore, under the existing empirical formulas for calculating the thickness of accumulated water, there is a significant deviation between the theoretical and experimental results of lift and torque force. Furthermore, it is worth noting that as the rainfall intensity increases, there is also a trend toward an increase in the deviation between theoretical and experimental results. So, the more complex water accumulation state on the surface of the main beam under heavy rain intensity and its influence on the impact force of raindrops need to be further studied.

Author Contributions

Conceptualization, X.L. and Z.C.; methodology, X.L.; software, X.L. and L.S.; validation, X.L. and Y.H.; formal analysis, L.S.; investigation, X.Z.; resources, L.S.; data curation, X.Z. and L.S.; writing—original draft preparation, X.L.; writing—review and editing, X.L. and L.S.; visualization, X.L. and L.S.; supervision, Z.C. and C.W.; project administration, X.L.; funding acquisition, X.L., L.S., Z.C. and Y.H. All authors have read and agreed to the published version of the manuscript.

Funding

The work described in this article was supported by the Hunan Provincial Natural Science Foundation of China (No. 2022JJ40524); Excellent youth program of Hunan Education Department, China (No. 20B062); Changsha Science and Technology Bureau Project, China (No. kq195004); and Open Fund Project of Changsha University of Technology (14KA03).

Institutional Review Board Statement

Not applicable.

Informed Consent Statement

Not applicable.

Data Availability Statement

The data that support the findings of this study are available from the corresponding author upon reasonable request.

Acknowledgments

This article also wishes to thank other teachers and classmates from the Wind Engineering Experimental Center of Hunan University for their help and support in wind-driven rain experiments.

Conflicts of Interest

The authors declare no conflict of interest.

References

  1. Cheng, Z. The Bridge Wind Engine Engineering; China Communication Press: Beijing, China, 2005; pp. 1–200. [Google Scholar]
  2. Rhode, R.V. Some Effects of Rainfall on Flight of Airplanes and on Instrument Indications; Research Report No. ADB814123; Technical Report Archive & Image Library: Washington, DC, USA, 1941. [Google Scholar]
  3. Haines, P.; Luers, J. Aerodynamic penalties of heavy rain on landing airplanes. J. Aircr. 1983, 20, 111–119. [Google Scholar] [CrossRef]
  4. Hastings, E.C.; Manuel, G.S. Scale-model tests of airfoils in simulated heavy rain. J. Aircr. 1985, 22, 536–540. [Google Scholar] [CrossRef]
  5. Bilanin, A.J. Scaling laws for testing airfoils under heavy rainfall. J. Aircr. 1987, 24, 31–37. [Google Scholar] [CrossRef]
  6. Wan, T.; Wu, S. Aerodynamic analysis under influence of heavy rain. In Proceedings of the 24th International Congress of the Aeronautical Sciences, Yokohama, Japan, 29 August–3 September 2004. [Google Scholar]
  7. Douvi, E.C.; Margaris, D.P. Aerodynamic performance investigation under the influence of heavy rain of a NACA 0012 airfoil for wind turbine applications. Int. Rev. Mech. Eng. 2012, 6, 1228–1235. [Google Scholar] [CrossRef]
  8. Cao, Y.; Wu, Z.; Xu, Z. Effects of rainfall on aircraft aerodynamics. Prog. Aerosp. Sci. 2014, 71, 85–127. [Google Scholar] [CrossRef]
  9. Choi, E.C.C. Wind-driven rain and driving rain coefficient during thunderstorms and non-thunderstorms. J. Wind. Eng. Ind. Aerodyn. 2001, 89, 293–308. [Google Scholar] [CrossRef]
  10. Blocken, B.; Derome, D.; Cameliet, J. Rainwater runoff from building facades: A review. Build. Environ. 2013, 60, 339–361. [Google Scholar] [CrossRef]
  11. Huang, S.; Li, Q. Large eddy simulations of wind-driven rain on tall building facades. J. Struct. Eng. 2012, 138, 967–983. [Google Scholar] [CrossRef]
  12. Erkal, A.; Dayal, A.D.; Sequeir, A.L. Assessment of wind-driven rain impact, related surface erosion and surface strength reduction of historic building materials. Build. Environ. 2012, 57, 336–348. [Google Scholar] [CrossRef]
  13. Baher, U.T.; Chowdhury, A.G.; Bitsuamlak, G.; Masters, F.J.; Tokay, A. Simulation of wind-driven rain associated with tropical storms and hurricanes using the 12-fan wall of wind. Build. Environ. 2014, 76, 18–29. [Google Scholar] [CrossRef]
  14. Tian, L.; Zeng, Y. Stat-of-the-art review of structural resistance to wind rain loads. Struct. Eng. 2016, 32, 197–204. [Google Scholar] [CrossRef]
  15. Tian, L.; Zeng, Y.; Fu, X. Velocity ratio of wind-driven rain and its application on a transmission tower subjected to wind and rain loads. J. Perform. Constr. Facil. 2018, 32, 04018065. [Google Scholar] [CrossRef]
  16. Baskaran, B.A.; Brown, W.C. Dynamic evaluation of the building envelope for wind and wind-driven rain performance. J. Build. Phys. 1995, 18, 261–275. [Google Scholar] [CrossRef]
  17. Fu, X.; Li, H. Dynamic analysis of transmission tower-line system subjected to wind and rain load. J. Wind. Eng. Ind. Aerodyn. 2016, 157, 95–103. [Google Scholar] [CrossRef]
  18. Liu, M.; Li, Q.; Huang, S. Large eddy simulation of wind-driven rain effects on a large span retractable roof stadium. J. Wind. Eng. Ind. Aerodyn. 2019, 195, 104009. [Google Scholar] [CrossRef]
  19. Yu, W.; Ke, S. Flow field characteristics and surface aerodynassmic force of large cooling tower under coupling of wind and rain. J. Nanjing Univ. Aeronaut. Astronaut. 2020, 52, 666–674. [Google Scholar] [CrossRef]
  20. Yang, Q.; Ke, S.; Yu, W.; Wang, T.; Cao, S. Study of wind-driven rain distribution characteristics for MW level wind turbine under adverse stopped status. Act Energiae Solaris Sin. 2020, 41, 32–40. [Google Scholar]
  21. Hikami, Y.; Shiraishi, N. Rain-wind vibration of cables in cable-stayed bridges. J. Wind. Eng. Ind. Aerodyn. 1988, 29, 409–419. [Google Scholar] [CrossRef]
  22. Gu, M.; Du, X. Experimental investigation of rain–wind-induced vibration of cables in cable-stayed bridges and its mitigation. J. Wind. Eng. Ind. Aerodyn. 2005, 93, 79–95. [Google Scholar] [CrossRef]
  23. Gu, M.; Du, X.; Li, S. Experimental and theoretical simulations on wind–rain induced vibration of 3-D rigid stay cables. J. Sound Vib. 2009, 320, 184–200. [Google Scholar] [CrossRef]
  24. Matsumoto, M.; Yagi, T.; Sakai, S.; Ohya, J.; Okada, T. Steady wind force coefficients of inclined stay cables with water rivulet and their application to aerodynamics. Wind. Struct. 2005, 8, 107–120. [Google Scholar] [CrossRef]
  25. Ni, Y.; Wang, X.; Chen, Z.; Ko, J. Field observations of rain-wind-induced cable vibration in cable-stayed Dongting Lake Bridge. J. Wind. Eng. Ind. Aerodyn. 2007, 95, 303–328. [Google Scholar] [CrossRef]
  26. Liu, Q.; Matsumoto, M.; Yagi, T. LES study on the mechanism of rain-wind induced vibration of cables of cable-stayed bridge. In Proceedings of the 12th International Conference on Wind Engineering, Cairns, Australia, 2–7 July 2007. [Google Scholar]
  27. Liu, Q.; Qiao, F.; Du, Y. Initial research of precipitation effect on aerodynamic characteristics of basic bluff. J. Shijiazhuang Railw. Inst. 2007, 20, 14–18. [Google Scholar] [CrossRef]
  28. Li, H.; Chen, W.; Xu, F.; Li, F.; Ou, J. A numerical and experimental hybrid approach for the investigation of aerodynamic forces on stay cables suffering from rain-wind induced vibration. J. Fluids Struct. 2010, 26, 1195–1215. [Google Scholar] [CrossRef]
  29. Xin, D. Wind-Rain Induced Flutter Stability Analysis and Boundary Layer Control Methods of Bridges. Ph.D. Thesis, Harbin Institute of Technology, Harbin, China, 2008. [Google Scholar]
  30. Xin, D.; Li, H.; Wang, L.; Ou, J. Experimental study on static characteristics of the bridge deck section under simultaneous actions of wind and rain. J. Wind. Eng. Ind. Aerodyn. 2012, 107, 17–27. [Google Scholar] [CrossRef]
  31. Hu, J. Study on the In-Field Measured Data, Wind Rain Action and Wind-Induced Fatigue of a Long-Span Suspension Bridge. Ph.D. Thesis, Dalian University of Technology, Dalian, China, 2012. [Google Scholar]
  32. Zhao, L.; Ge, Y.; Wu, Z.; Xu, L. Theoretic and testing investigation of wind-rain coupling loads on bridges and structures. J. Vib. Eng. 2014, 27, 507–517. [Google Scholar] [CrossRef]
  33. Dong, G.; Zhang, J.; Xue, F.; Cai, C.; Han, Y. Numerical simulation of wind-rain coupling effect on typical bridge section based on lagrangian system. J. Hunan Univ. 2017, 27, 507–517. [Google Scholar] [CrossRef]
  34. Liu, S.; Huang, S.; Li, Q.; Chen, F.B. 3D numerical simulation of wind-driven rain on bridge deck sections based on eulerian multiphase model. Eng. Mech. 2017, 34, 63–71. [Google Scholar] [CrossRef]
  35. Huang, S.; Li, Q.; Liu, M.; Chen, F.; Liu, S. Numerical simulation of wind-driven rain on a long-span bridge. Int. J. Struct. Stab. Dyn. 2019, 19, 1950149. [Google Scholar] [CrossRef]
  36. Marshall, J.S.; Palmer, W.M.K. The distribution of raindrops with size. J. Atmos. Sci. 1948, 5, 165–166. [Google Scholar] [CrossRef]
  37. Gunn, R.; Kinzer, G.D. The terminal velocity of fall for water droplets in stagnant air. J. Atmos. Sci. 1949, 6, 243–248. [Google Scholar] [CrossRef]
  38. Ji, T. The Influence of Rainfall on the Tire and Road Adhesion Coefficient. Ph.D. Thesis, Southeast University, Nanjing, China, 2004. [Google Scholar]
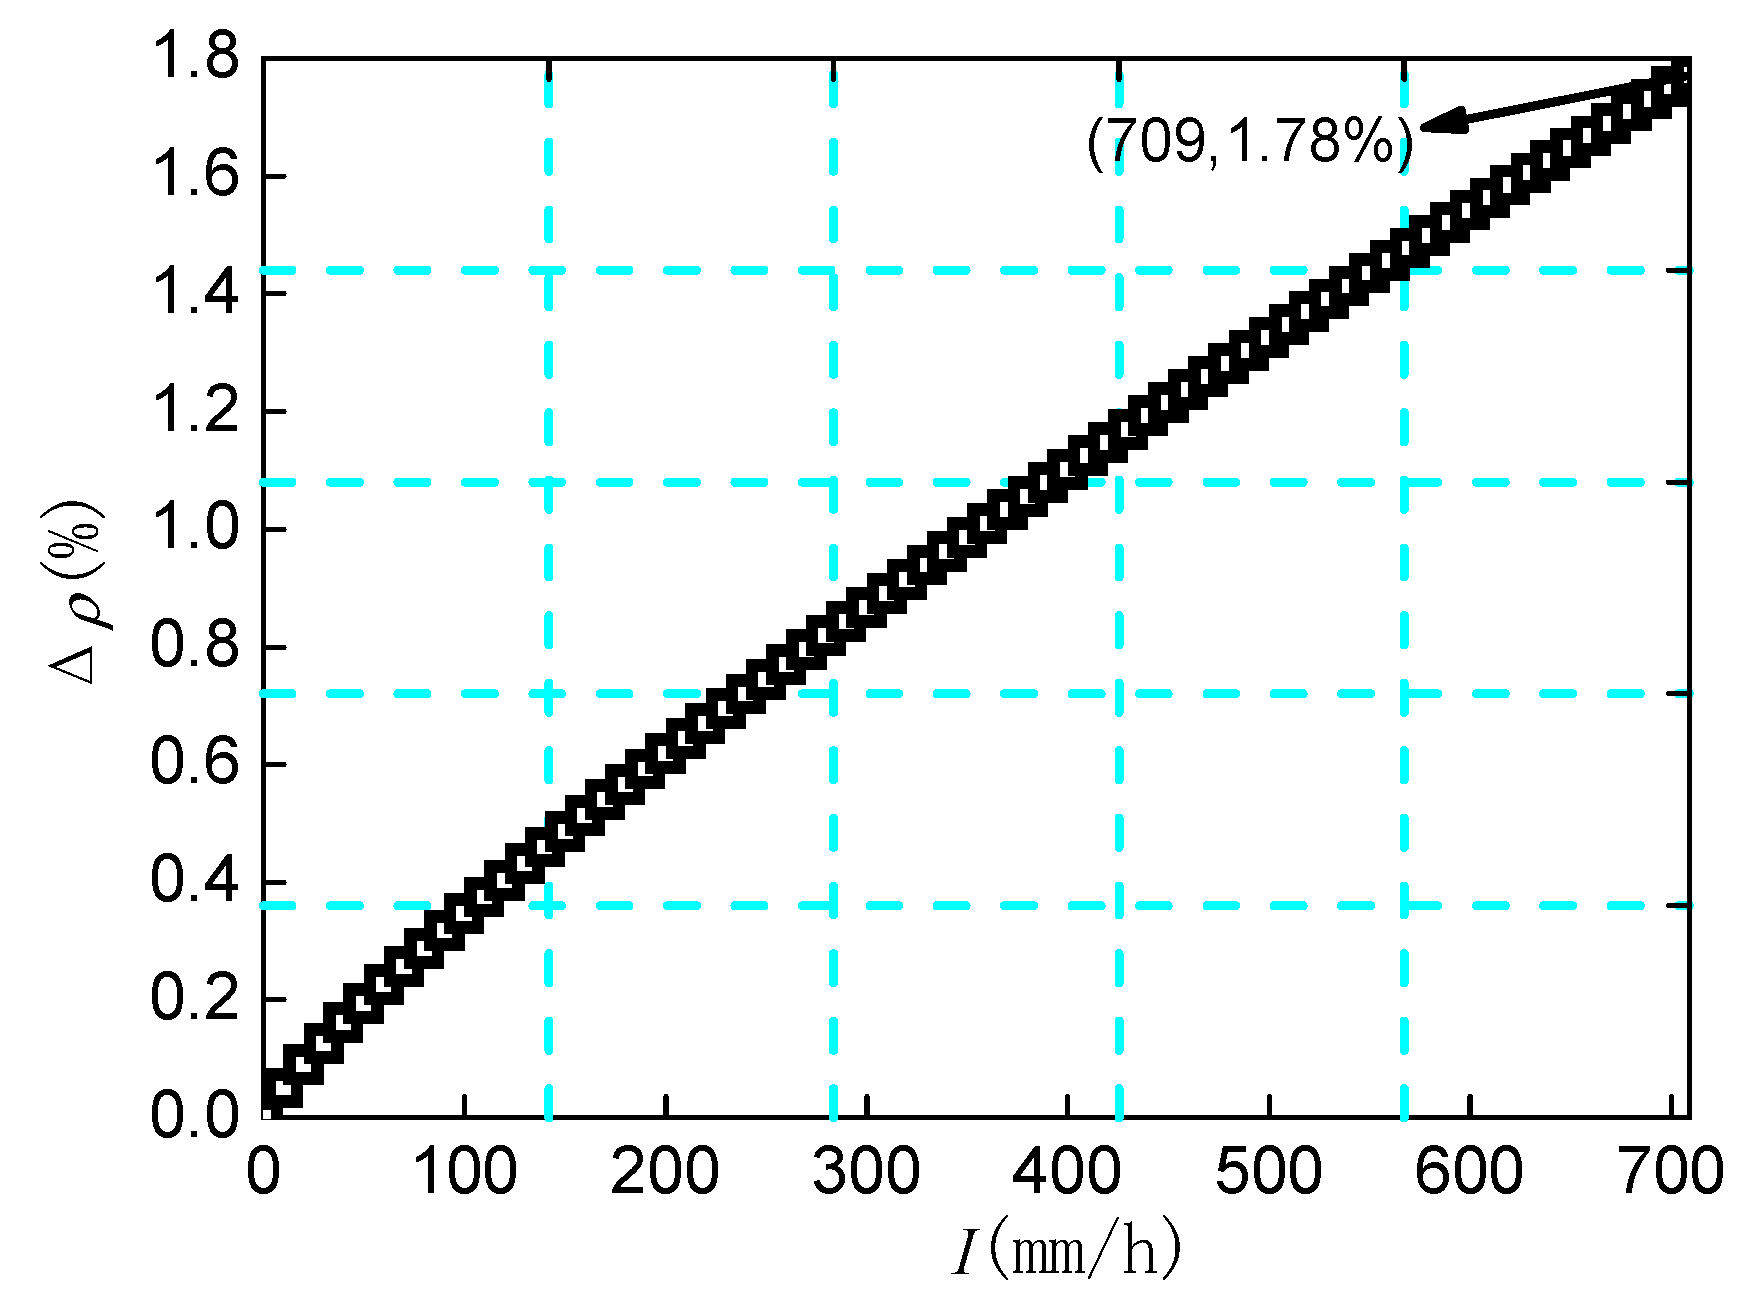
Figure 1. Change in density of air with different rainfall intensities.
Atmosphere 14 01535 g001
Figure 2. Impact model of single raindrop (a) Raindrop impact process, (b) Change in impact force with time.
Atmosphere 14 01535 g002
Figure 3. Comparison of the theoretical values and the values through the use of above methods. (a) Vertical impact force per unit area. (b) Horizontal impact force per unit area.
Atmosphere 14 01535 g003
Figure 4. Trend of changes in equivalent particle sizes, and number and velocity of raindrops with different rainfall intensities. (a) Equivalent particle size, (b) Equivalent raindrop number, (c) Equivalent vertical velocity.
Atmosphere 14 01535 g004
Figure 5. Schematic diagram of the effect of raindrops impacting on the structure surface. L, B, and H represent the length, width, and height of the rectangle; zone I and zone II are upward and side windward surfaces; for the right sub-figure, color red and cyan represent raindrops falling in the zone I and zone II, respectively.
Atmosphere 14 01535 g005
Figure 6. Schematic diagram of slope area water. The arrow above the figure represents rainfall, I is the rainfall intensity, l is the slope drainage length, S is the slope, Hr is the water film thickness.
Atmosphere 14 01535 g006
Figure 7. Schematic diagram of main beam’s rainfall force caused by wind-driven rain. The gradient filling part is the thickness of the surface water film. Red, cyan, and purple arrows represent force Frm, Frv, Fru, respectively.
Atmosphere 14 01535 g007
Figure 8. Coupling test platform for wind-driven rain. (a) Rainfall device, (b) Control equipment, (c) Schematic diagram of wind-driven rain. In sub-figure (c), the red area represents the experimental rainfall range and the black area below the red area represents the main beam model.
Atmosphere 14 01535 g008aAtmosphere 14 01535 g008b
Figure 9. Wind-driven rain-force-measuring device and the definition of the force’s direction. (a) Schematic diagram of force-measuring system, (b) Force-measuring device, (c) Three-component force in wind axis coordinate system. The gradient filled area is the main beam model.
Atmosphere 14 01535 g009aAtmosphere 14 01535 g009b
Figure 10. Bridge main beam section for testing. (a) π-shaped cross-section (section 1), (b) Streamlined cross-section (section 2).
Atmosphere 14 01535 g010
Figure 11. Original signal of the force sensors. (a) I = 0 mm/h, (b) I = 120 mm/h.
Atmosphere 14 01535 g011
Figure 12. The trend of the change in static three-component coefficient with rainfall intensity. (a) CD of 0° attack angle, (b) CL of 0° attack angle, (c) CM of 0° attack angle.
Atmosphere 14 01535 g012
Table 1. Classification of rainfall levels for structural safety design [31].
Rain Intensity LevelLight
Rain
Moderate RainHeavy RainRainstormWeak Heavy RainstormMedium Heavy RainstormStrong RainstormDomestic Extreme Value
Precipitation (mm/h)2.58163264100200709.2
Disclaimer/Publisher’s Note: The statements, opinions and data contained in all publications are solely those of the individual author(s) and contributor(s) and not of MDPI and/or the editor(s). MDPI and/or the editor(s) disclaim responsibility for any injury to people or property resulting from any ideas, methods, instructions or products referred to in the content.