Abstract
The impact of tropical cyclones is expected to worsen with continued global warming and socioeconomic development. Quantifying population exposure to strong winds and heavy rainfall induced by tropical cyclones is a core element of tropical cyclone population risk assessment. Based on the demographic dataset of Shared Socioeconomic Pathways and future tropical cyclone data, we first calculate and analyze the changes in impact frequency and population exposure to four tropical cyclone scenarios in the Northwest Pacific over the period 2015–2050. Then, we quantitatively assess the contribution rates of climate change, population change, and their joint change to population exposure change. The results show that East China, South China, and Southeast China are the areas with high exposure change. Additionally, most of the high exposure changes (absolute changes over 400,000 people) are significant, and primarily influenced by the changes in local population growth. Overall, exposure change in the Northwest Pacific is mainly influenced by climate change, followed by population change and joint change.
1. Introduction
Tropical cyclones have a widespread impact and great destructive power, with strong winds, heavy rainfall, and storm surges seriously threatening people’s lives and properties [1,2,3,4,5]. In recent decades, systematic changes in tropical cyclone activities have occurred regarding trajectory and intensity, which are important for assessing tropical cyclone risks. For example, in the Northwest Pacific, the polar shift of tropical cyclones has resulted an increase in the intensity of tropical cyclones in Eastern Asia [6,7,8,9,10,11]. Moreover, the intensity of landfalling tropical cyclones has increased by 12–15% in recent decades [12]. In the future, the intensity and precipitation of tropical cyclones are projected to increase further, implying the greater risk of intense tropical cyclones [13,14,15,16]. Moreover, with socio-economic development, the risk of exposure of the population and their assets to natural disasters is also rising [4,17,18,19,20,21]. In addition, the global urban land located in low-altitude coastal areas will increase by 230% during the period 2000–2030 [22], which will further enhance the exposed population to tropical cyclone disasters. Risk management and climate change adaptation focus primarily on the mitigation of exposure and vulnerability, as well as improving resilience to the potential adverse impacts of climate extremes [23]. Therefore, it is necessary to explore exposure to disaster and loss in risk assessments [24]. The annual population exposure to tropical cyclone events will increase by 26% (33 million people) for each 1 °C increase in global temperature [4].
Although there are many studies on population exposure to tropical cyclones, obtaining detailed information on tropical cyclone exposure remains an open challenge at present, because the effects of future tropical cyclone rainfall are rarely considered. Ultimately, studies on future tropical cyclone rainfall are still immature. Additionally, few studies have been performed on the contribution of different change factors to exposure changes to tropical cyclones. In this study, the changes in impact frequency and population exposure to four tropical cyclone scenarios in the Northwest Pacific over the period 2015–2050 are calculated based on the Shared Socioeconomic Pathways (SSPs) demographic and economic dataset by Jiang et al. [25]. Future tropical cyclone data are obtained from the High-Resolution Model Intercomparison Project (HighResMIP). Then, the contribution rates of climate change, population change, and joint change to population exposure change are quantified. Based on the change analysis of population exposure and contribution rates, we aim to identify the changing characteristics of future exposed populations to tropical cyclones and to illustrate the significance of climate change and population change.
In this study, we aim to analyze the changes in impact frequency and population exposure in the Northwest Pacific over the period 2015–2050, and quantitatively assess the contribution rates of climate change, population change, and joint change to population exposure change. Although storm surge is a common secondary hazard of tropical cyclones, we only consider strong winds and heavy rainfall in this study, mainly due to data availability.
2. Materials and Methods
2.1. Data and Study Area
Future tropical cyclone data were obtained from the High-Resolution Model Intercomparison Project (HighResMIP), which was obtained via the TRACK algorithm (https://catalogue.ceda.ac.uk, accessed on 31 August 2022). Storm tracks are provided as NetCDF files similar to the Climate Model Output Rewriter, one for each hemisphere during the simulation period of the HighResMIP experiment, with a tracked variable in each file and associated time, latitude, and longitude at six-hour interval coordinates. In this study, we selected the ‘highres-future’ dataset for 2015–2050, which includes 25 models and coupled atmosphere–ocean data using the SSP585 scenario. Future population data are used in the Shared Socioeconomic Pathways (SSPs) demographic dataset by Jiang et al. [25] (https://cstr.cn/31253.11.sciencedb.01683, accessed on 31 August 2022), which provides the global population projections under SSP1 (sustainable pathways), SSP2 (intermediate pathways), SSP3 (local or inconsistent development/regional competition pathways), SSP4 (uneven pathways) and SSP5 (traditional fossil fuel-based pathways) scenarios for 2010–2100 at a spatial resolution of 0.5° × 0.5°. As future tropical cyclone data are only available for the SSP585 scenario, the population under the SSP5 scenario was selected for this study. The study region includes 14 countries in the Northwest Pacific basin (0–60° N, 97–180° E), accounting for >30% of global tropical cyclones. Figure 1 shows the location of countries in the Northwest Pacific and the location of provinces in China.
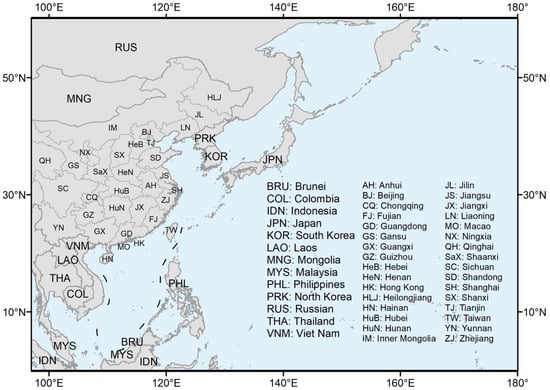
Figure 1.
The study region.
For comparison and statistical analysis, we would preferably select a base period and comparison periods [26]. In this study, due to the short time series of future tropical cyclone track data and the large difference in the number of historical tropical cyclone records, we can only set the base period at 2015–2020 (T0) and the two comparison periods at 2021–2035 (T1) and 2036–2050 (T2). T1–0, T2–1, and T2–0 represent T1 compared with T0, T2 compared with T2, and T2 compared with T0, respectively.
2.2. Tropical Cyclone Simulation
2.2.1. Tropical Cyclone Wind Field Simulation
In this study, the gradient balance velocity for a stationary storm is calculated using the Holland wind field model [27,28] as follows:
where is the air pressure profile parameter, which is set to ( represents the latitude of the cyclone center) [29]; is the pressure at the periphery, which is set to 1010 hPa [30]; is the pressure at the cyclone center, which can be obtained using the best track dataset; is the air density, which is set to 1.15 kg/m3 [31]; is the radius to maximum wind speed, which is set to [32]; is the distance between the cyclone center and target point; and is the Coriolis parameter, which is set to , where is the angular rotation rate of the earth (7.272 × 10⁻⁵ rad/s) and is the latitude at the target point [31].
We then calculate the wind speed near the surface. According to Harper et al. [33], the wind speed at the 10 m surface () is as follows:
where is computed as:
2.2.2. Tropical Cyclone Rainfall Simulation
Tropical cyclone rainfall is defined as the total rainfall within a certain radius from the cyclone center [34,35], and this radius is usually set to 500 km [36,37]. In this study, a 500 km radius is used to calculate the total rainfall of a tropical cyclone.
The tropical cyclone rainfall is found to have an approximate power–law relation with maximum wind speed and location, indicated by the latitude of the tropical cyclone:
where is tropical cyclone rainfall in millimeters (mm), is the latitude in degrees (°), is the maximum wind speed in knots, is the natural constant, and parameters , , and are the empirical constants determined from historical tropical cyclone rainfall and the corresponding maximum wind speed and latitude. In the Northwest Pacific, the values for parameters , , and are 6.35, −0.14, and 0.58, respectively (see the attached document for details). The total amount of the future tropical cyclone rainfall is estimated by Equation (4), and its spatial distribution can be assigned weight based on its historical spatial distribution; then, the spatial distribution of the future tropical cyclone rainfall is simulated (see Appendix A for details).
2.3. Analysis Methods
2.3.1. Tropical Cyclone Impact Frequency
Tropical cyclone influences mainly include strong wind and heavy rainfall. In this study, we examine four scenarios for the impact of hazard factors, namely, tropical cyclone hazard scenarios I (tropical cyclone strong winds), II (tropical cyclone heavy rainfall), III (simultaneous tropical cyclone strong winds and heavy rainfall), and IV (strong winds or heavy rainfall affected by tropical cyclone). Here, the thresholds for strong winds and heavy rainfall are 30 knots (10 min average) and 25 mm day−1, respectively [21]. We then calculate the annual impact frequency for the four hazard impact scenarios for each 0.25° × 0.25° grid in each future tropical cyclone track model. In general, the multi-model ensemble is widely used due to its better performance [38,39]. Therefore, the mean of the single annual impact frequency of the 25 models is computed for the annual impact frequency of the four tropical cyclone hazard scenarios for each grid.
2.3.2. Population Exposure to Tropical Cyclone
The population exposed to tropical cyclones is defined as the amount of people located in tropical cyclone-prone areas [40]. The population exposure to tropical cyclones can be calculated by multiplying the population and the tropical cyclone impact frequency for each raster. In this study, the spatial resolution of the future population data is 0.5° × 0.5°, so it is necessary to resample the future tropical cyclone impact frequency to 0.5° × 0.5° (unit: person per year).
2.3.3. Change in Tropical Cyclone Impact Frequency, Population and Population Exposure
The impact area of tropical cyclones varies from year to year; thus, the trend line of tropical cyclone impact frequency over the period 2015–2050 in each grid was fitted with a linear regression model. Adapted from Kossin [41], the change in tropical cyclone impact frequency in each grid is defined as the difference between fitted values for 2050 and 2015. The calculation of changes in population and population exposure is the same as that of changes in tropical cyclone impact frequency. A significant change is based on the p-value of the fitted trend line for each grid, and if the p-value is less than 0.05, then it is considered to be a significant change.
2.3.4. Contribution Rate to Population Exposure Change
According to Jones et al. [42] and Liu et al. [43], impact on changes in population exposure can be divided into three components: climate change, population change, and their joint change [42,43]. According to Liao et al. [24], the contribution rate of each factor is calculated as follows:
where , , and represent the contribution rates of climate change, population change, and joint change, respectively. and represent the population and climate in period , respectively. and represent the changes in population and climate, respectively.
3. Results
3.1. Changes in Tropical Cyclone Influences and Population
Figure 2 shows the spatial distribution of the changes in tropical cyclone impact frequency in the Northwest Pacific for the period 2015–2050 for four tropical cyclone hazard scenarios, as well as the spatial distribution of the significant changes (p-value < 0.05). The overall trend for the tropical cyclone hazard scenarios is that the change in the frequency of impact increases at higher latitudes and decreases at lower latitudes during the period 2015–2050, but there are few areas of significant change. The areas with decreasing changes in the frequency of tropical cyclone hazard scenario I are concentrated south of 20° N and to the north-east of the Northwest Pacific (Figure 2a), while on land, only a few small areas to the north experience significant increasing changes (Figure 2b). The north–south variation in the changes in the frequency of storm impacts of tropical cyclone hazard scenario II is more pronounced than that of tropical cyclone hazard scenario I (Figure 2c), but on land, there are only a few small areas where there is a significant increasing change (Figure 2d). The spatial distribution of the impact frequency change in tropical cyclone hazard scenario III is similar to that of tropical cyclone hazard scenario II (Figure 2e,f), while the spatial distribution of the impact frequency change in tropical cyclone hazard scenario IV is similar to that of tropical cyclone hazard scenario I (Figure 2g,h).
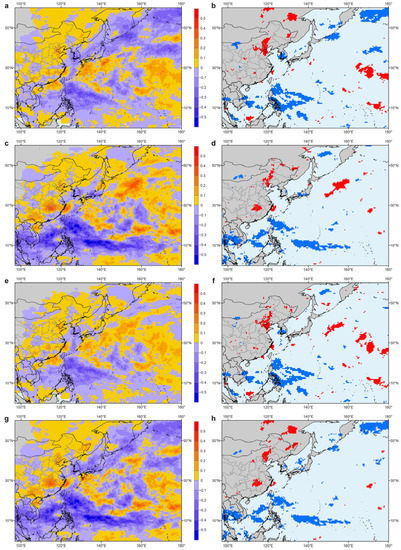
Figure 2.
Spatial distribution of tropical cyclone impact frequency change in the Northwest Pacific. (a,c,e,g): Spatial distribution of the tropical cyclone impact frequency change over the period 2015–2050 for tropical cyclone hazard scenarios I, II, III, and IV, respectively. (b,d,f,h): Regions with significant changes between periods are indicated in red (increased) and blue (decreased) at the 95% confidence level for tropical cyclone hazard scenarios I, II, III, and IV, respectively.
Then, we plot the spatial distribution of the change in population in the Northwest Pacific for the period 2015–2050 and the spatial distribution of significant changes (p-value < 0.05) in Figure 3. It is clear that among the Southeast Asian countries in the Northwest Pacific, with the exception of Cambodia (Myanmar is not in the Northwest Pacific), there has been a significant increase in population. In Northeast Asia, the populations of Japan and North Korea are significantly declining, and the population of South Korea is significantly increasing. In China, the population of the southeastern coastal provinces (except Taiwan and Jiangsu) has increased significantly. The populations of Beijing, Tianjin, Ningxia, Qinghai, and Tibet are also significantly increasing, while the populations of Jiangsu, Yunnan, and Guizhou are insignificantly increasing; otherwise, the populations of regions in China are significantly decreasing.
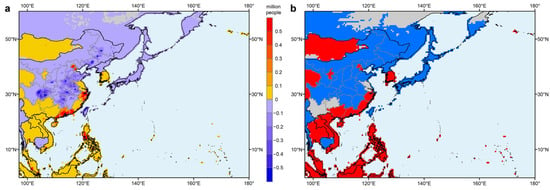
Figure 3.
Spatial distribution of the population change in the Northwest Pacific. (a): Spatial distribution of the change in population over the period 2015–2050. (b): Regions with significant changes between periods are indicated in red (increased) and blue (decreased) at the 95% confidence level.
3.2. Spatial and Temporal Changes in Population Exposure to Tropical Cyclones
Figure 4 depicts the spatial distribution of exposed population change for the four tropical cyclone hazard scenarios over the period 2015–2050, and the spatial distribution of significant changes (p-value < 0.05). Overall, the spatial distribution of exposure changes affected by tropical cyclone hazard scenario I is similar to that affected by tropical cyclone hazard scenario III (Figure 4a,e), while the spatial distribution of exposure changes affected by tropical cyclone hazard scenario II is similar to that affected by tropical cyclone hazard scenario IV (Figure 4c,g).
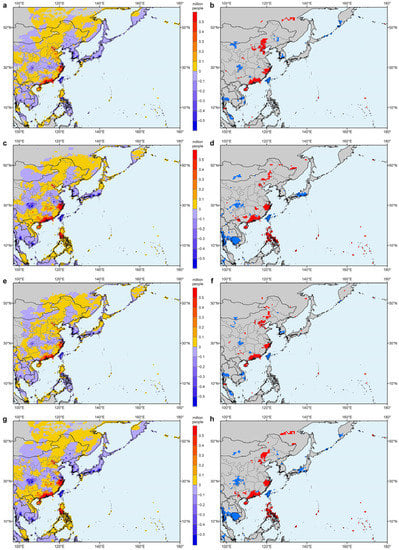
Figure 4.
Spatial distribution of exposed population changes in the Northwest Pacific. (a,c,e,g): Spatial distribution of exposed population changes over the period 2015–2050 for tropical cyclone hazard scenarios I, II, III, and IV, respectively. (b,d,f,h): Regions with significant changes between periods are indicated in red (increased) and blue (decreased) at the 95% confidence level for tropical cyclone hazard scenarios I, II, III, and IV, respectively.
In terms of the spatial distribution of exposure changes affected by tropical cyclone hazard scenario I, the areas with a large increase in exposure change (>+400,000 people) are mainly located in East China (e.g., Zhejiang) and South China (e.g., Guangdong). The areas with a medium increase in exposure change (+200,000~+400,000 people) are mainly located in Northern China (e.g., Beijing, Tianjin, and Shandong). The areas with a low increase in exposure change (<+200,000 people) are mainly located in Northern China (e.g., Hebei, Shanxi, and Inner Mongolia), Southwest China (e.g., Guangxi and Guizhou), Southeastern Russia, and the Northern Philippines. The areas with a large decrease in exposure change (<−400,000 people) are mainly located in Southeast China (e.g., Taiwan). The areas with a medium decrease in exposure change (−200,000~−400,000 people) are mainly located in the western and southern parts of Korea. The areas with a low decrease in exposure change (>−200,000 people) are mainly located in Central China (e.g., Hubei, Anhui), Japan, Southeast Asia, and the Korean Peninsula. Only a few regions showed significant changes in exposure. For example, significant increases were found in Northern, Eastern and Southern China, and significant decreases were found in Southeastern China (including Taiwan island) and Southern Korea.
In terms of the spatial distribution of exposure changes affected by tropical cyclone hazard scenario II, the areas with a large increase in exposure change (>+400,000 people) are mainly located in East China (e.g., Zhejiang), South China (e.g., Guangdong), Northern China (e.g., Beijing, Tianjin), and the North–Central Philippines. The areas with a medium increase in exposure change (+200,000~+400,000 people) are mainly located in Central and Southwestern China (e.g., Hunan and Guangxi). The areas with a low increase in exposure change (<+200,000 people) are mainly located in Northern China (e.g., Hebei, Shanxi, and Inner Mongolia), Southwest China (e.g., Yunnan and Guizhou), Southeastern Russia, Northern Japan, North Vietnam, Malaysia and the Philippines. The areas with a high decrease in exposure change (<−400,000 people) are mainly located in Southeast China (e.g., Taiwan island), Southwest China (e.g., Sichuan and Chongqing), and Eastern Japan. The areas with a medium decrease in exposure change (−200,000~−400,000 people) are mainly located in Central China (Anhui). The areas with a low decrease in exposure change (>−200,000 people) are mainly located in South Japan, the Korean Peninsula, and Southeast Asia, excluding the Philippines, Malaysia and North Vietnam. Only a few regions showed significant changes in exposure, for example, East and South China and the Philippines showed significant increases, while Southeast China (including Taiwan Island), Eastern Japan, Southeast Thailand and Cambodia showed significant decreases in exposure.
In terms of the spatial distribution of exposure changes affected by tropical cyclone hazard scenario III, the areas can be referred to as the spatial distribution of exposure changes affected by tropical cyclone hazard scenario I. In terms of the spatial distribution of exposure changes affected by tropical cyclone hazard scenario IV, the areas can be referred to as the spatial distribution of exposure changes affected by tropical cyclone hazard scenario II.
3.3. Contributions to Population Exposure to Tropical Cyclones
Figure 5 shows the contribution rate of each factor in each scenario. Overall, climate change has the greatest impact on exposure change, followed by population change and joint change. In T2-0, the scenario of tropical cyclone hazard scenario I has the largest climate change effect of 82.1%, while tropical cyclone hazard scenario III has the largest population change effect of 32.7%. For T1-0 and T2-1, the climate change effects of tropical cyclone hazard scenarios I and III show decreased trends from 60.7% to 50.1% and from 54.8% to 44.7%, respectively; the climate change effects of tropical cyclone hazard scenarios II and IV show increased trends from 27.4% to 59.2% and from 41.3% to 65.3%, respectively.
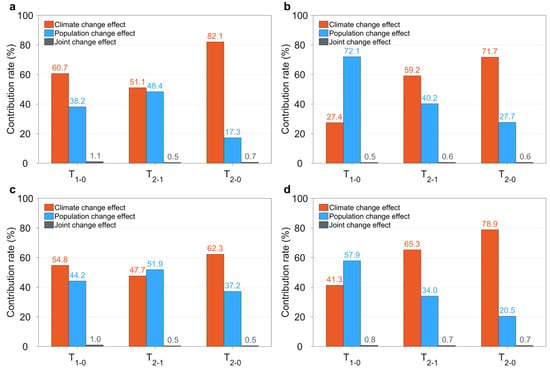
Figure 5.
Breakdown of the change in population exposure for each scenario in the Northwest Pacific. (a–d): Breakdown of the change in population exposure for tropical cyclone hazard scenarios I, II, III, and IV, respectively.
To further investigate the structural aspects of exposure change, we break down exposure change in the eight regions of interest in different periods into climate change effects, population change effects and joint change effects, where the eight regions of interest are identified based on the spatial distribution of significant changes in Figure 4 (Figure 6). Then, we plotted the contribution rates of climate change, population change and joint change for the tropical cyclone hazard scenario I (Figure 7) and tropical cyclone hazard scenario II (Figure 8) in these eight regions of interest.
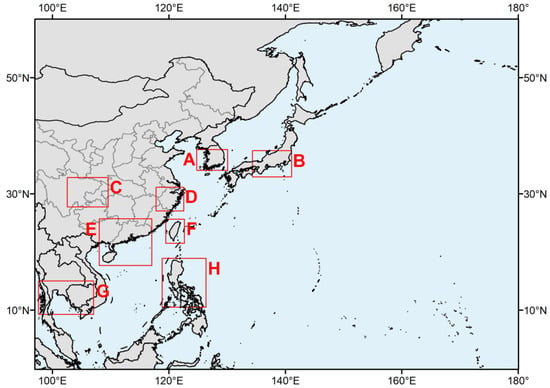
Figure 6.
Eight regions of interest in the Northwest Pacific.
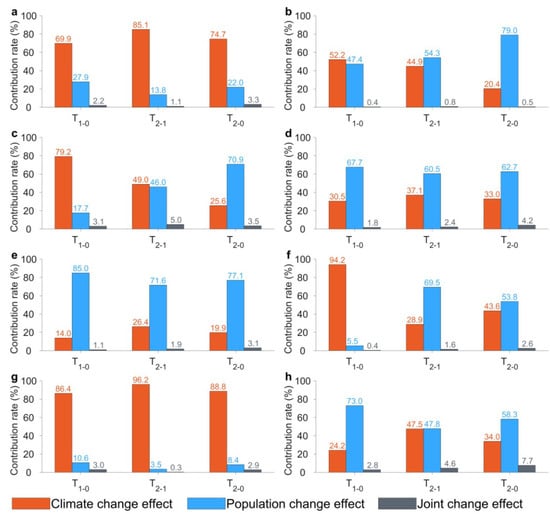
Figure 7.
Breakdown of the changes in population exposure for tropical cyclone hazard scenario I in the Northwest Pacific. (a–h): Breakdown of the change in population exposure for regions A, B, C, D, E, F, G, and H, respectively.
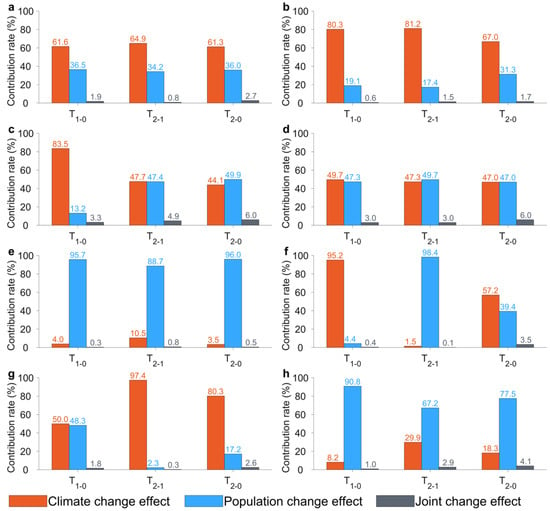
Figure 8.
Breakdown of the changes in population exposure for tropical cyclone hazard scenario II in the Northwest Pacific. (a–h): Breakdown of the change in population exposure for regions A, B, C, D, E, F, G, and H, respectively.
For tropical cyclone hazard scenario I, the contribution rates of factors in different regions are not consistent. In regions A and G, population exposure is decreasing; meanwhile climate change impact is the dominant factor in each period, and shows a slight increasing trend (Figure 7a,g). The decline in tropical cyclone strong wind impact frequency should be the main reason for the decrease in population exposure in regions A and G. In regions D and E, population exposure is increasing; however, population change impact is the dominant factor in each period and shows a slight decreasing trend (Figure 7d,e). Population growth should be the main reason for the increase in population exposure in regions D and E. In region B, the population exposure is decreasing; meanwhile, population change impact is the dominant factor in T2-0, while climate change impact is as important as population change impact in T1-0 and T2-1 (Figure 7b). The negative population growth and decline in tropical cyclone strong wind impact frequency should be the main reasons for the decrease in population exposure in region B. In region C, the population exposure is decreasing; meanwhile, population change impact is the dominant factor in T2-0, and climate change impact is the dominant factor in T1-0, while population change impact is as important as climate change impact in T2-1 (Figure 7c). Overall, negative population growth is the main reason for the decrease in population exposure in region C. In region F, population exposure is decreasing; meanwhile, population change impact and climate change effect are the dominant factors in T2-0, climate change effect is the dominant factor in T1-0, and population change effect becomes the dominant factor in T2-1 (Figure 7f). Overall, negative population growth is the main reason for the decrease in population exposure in region F. In region H, the population exposure is increasing; meanwhile, population change impact is the dominant factor in T2-0 and T1-0, but is evenly matched by climate change effect in T2-1 (Figure 7h). Although the decline in tropical cyclone strong wind impact frequency and population growth both occur in region H, population growth is the main reason for the increase in population exposure.
For the tropical cyclone hazard scenario II, the contribution rates of factors in different regions are not consistent. In regions A and B, population exposure is decreasing; climate change impact is the dominant factor in each period and shows a slightly increasing trend (Figure 8a,b). The decline in tropical cyclone heavy rainfall impact frequency should be the main reason for the decrease in population exposure in regions A and B. In region C, population exposure is decreasing; the impacts of climate change and population change are the dominant factors in T2-0, and climate change impact is the dominant factor in T1-0, while population change impact becomes as important as climate change impact in T2-1 (Figure 8c). Overall, negative population growth and the decline in tropical cyclone heavy rainfall impact frequency are the main reasons for the decrease in population exposure in region C. In region D, population exposure is increasing; the impacts of climate change and population change are the dominant factors in each period (Figure 8d). Population growth and the increase in tropical cyclone heavy rainfall impact frequency should be the main reasons for the increase in population exposure in region D. In regions E and H, population exposure is increasing, and population change impact is the dominant factor in each period (Figure 8e,h). Although the decline in tropical cyclone heavy rainfall impact frequency and population growth both occur in regions E and H, population growth is the main reason for the increase in population exposure. In region F, population exposure is decreasing; population change impact and climate change effect are the dominant factors in T2-0, and the impact of climate change is slightly bigger than the population change in T2-0. Climate change is the dominant factor in T1-0, while population change is the dominant factor in T2-1 (Figure 8f). Overall, negative population growth and the decline in tropical cyclone heavy rainfall impact frequency are the main reasons for the decrease in population exposure in region F. In region G, population exposure is decreasing; the population change impact is the dominant factor in T2-0 and T2-1, but is evenly matched by climate change effect in T1-0 (Figure 8g). Overall, the decline in tropical cyclone heavy rainfall impact frequency is the main reason for the decrease in population exposure in region G.
4. Conclusions and Discussion
In this study, we depict the changes in impact frequency and exposed population for four tropical cyclone hazard scenarios over the period 2015–2050 in the Northwest Pacific, and then analyze the contribution rates of three effect factors on population exposure for the tropical cyclone hazard scenarios I and II. The main findings are outlined below.
Most of the high increases/decreases in exposure change are significant. The high increase in exposure change is mainly located in regions D and E for all hazard scenarios, where the population growth should be the main reason for the increase in population exposure to the tropical cyclone hazard scenarios I and II. The high decrease in exposure change is mainly located in region F for all tropical cyclone hazard scenarios, where negative population growth is the main reason for the decrease in population exposure in tropical cyclone hazard scenario I, while negative population growth and the decline in tropical cyclone heavy rainfall impact frequency together cause a large decline in population exposure in tropical cyclone hazard scenario II. A high decrease in exposure change also occurs in region C in tropical cyclone hazard scenarios II and IV; negative population growth and the decline in tropical cyclone heavy rainfall impact frequency are the main reasons for the decrease in population exposure. Overall, change in local population growth is the primary cause of high exposure change. The distributions of medium increases/decreases in exposure change are not consistent across the four tropical cyclone hazard scenarios, so they are not discussed here. The distribution of low increases/decreases in exposure change is the largest in the fourth tropical cyclone hazard scenario. It is noteworthy that some places with a low increase in exposure change have negative population growth, which is due to the increase in tropical cyclone impact frequency.
The exposure change in the Northwest Pacific is driven primarily by climate change, followed by the population change, and lastly by joint change. In the eight regions of interest, population change is the primary influence on tropical cyclone hazard scenario I, while climate change is the primary influence on tropical cyclone hazard scenario II. Joint change is the least important for all tropical cyclone hazard scenarios.
Our results call for more attention to be given to population exposure in relation to future tropical cyclone activities. In particular, the impact of future population changes and changes in the frequency of tropical cyclones, as well as the often-overlooked changes in population exposure due to tropical cyclone rainfall, should receive more attention. It is also worth noting that population exposure changes have a regional dimension. For example, some regions are more influenced by climate change factors, others by population change factors, and some regions by a combination of these two factors. This suggests that governments in different regions will need to develop different precautionary measures in the future based on different tropical cyclone hazard scenarios.
Author Contributions
Conceptualization, W.X. and L.Q.; methodology, L.Q.; software, L.Q. and C.M.; validation, W.X., L.Q. and X.L.; formal analysis, G.Z.; investigation, L.Q.; resources, L.Q.; data curation, L.Q., X.L, C.M.; writing—original draft preparation, L.Q.; writing—review and editing, X.L.; visualization, L.Q.; supervision, W.X.; project administration, W.X.; funding acquisition, W.X. and L.Q. All authors have read and agreed to the published version of the manuscript.
Funding
This study was funded by the Joint Funds of the National Natural Science Foundation of China (grant no. U22B2011), the Ministry of Education and State Administration of Foreign Experts Affairs, China (grant no. B0820003), and the Key Laboratory of Environmental Change and Natural Disaster of Ministry of Education, Beijing Normal University (grant no. 2022-KF-10).
Institutional Review Board Statement
Not applicable.
Informed Consent Statement
Not applicable.
Data Availability Statement
Future tropical cyclone data were obtained from the High-Resolution Model Intercomparison Project (HighResMIP) at https://catalogue.ceda.ac.uk (accessed on 31 August 2022). Future population data are from the Shared Socioeconomic Pathways (SSPs) demographic dataset at https://cstr.cn/31253.11.sciencedb.01683 (accessed on 31 August 2022).
Acknowledgments
We are thankful for the high-performance computing support from the Center for Geodata and Analysis, Faculty of Geographical Science, Beijing Normal University [https://gda.bnu.edu.cn/ (accessed on 31 August 2022)].
Conflicts of Interest
The authors declare no conflict of interest.
Appendix A
Appendix A.1. Tropical Cyclone Rainfall Simulation
Appendix A.1.1. Data Sources
The best track dataset for tropical cyclones was acquired from the International Best Track Archive for Climate Stewardship (IBTrACS) v04 dataset [44], which includes the position, minimum sea-level pressure, and the maximum sustained wind speed of tropical cyclones from 1980 to 2020. The IBTrACS dataset contains various wind-averaged periods for tropical cyclone conditions from different agencies. Here, the 1 min and 3 min mean wind speeds are converted into 10 min mean wind speeds [45].
Tropical cyclone rainfall was obtained from Multi-Source Weighted-Ensemble Precipitation (MSWEP). MSWEP is a global precipitation product with a resolution of 0.1° for 3-hourly periods, available from 1979 to the present. The MSWEP dataset takes advantage of the complementary strengths of measurement-, satellite-, and reanalysis-based data to provide a reliable estimation of precipitation on a global scale. It also tends to exhibit better performance than other precipitation products in both densely gauged and ungauged regions [46,47].
Appendix A.1.2. Analysis Method of Tropical Cyclone Rainfall Simulation
A detailed basis is lacking for a causal model relating the intensity and location of tropical cyclones and rainfall. Here, we plot a scatter between global tropical cyclone rainfall, maximum wind speed, and latitude of tropical cyclones in Figure A1, and list their statistics in Table A1. It is clear that there is a general power–law relationship between tropical cyclone rainfall and maximum wind speed (Table A1 and Figure A1a), and a linear relationship between tropical cyclone rainfall and latitude (Table A1, Figure A1b,c). Herein, we conjecture that the combination of maximum wind speed and location affects the magnitude of tropical cyclone rainfall and assume a relationship of the following form:
where is tropical cyclone rainfall in millimeters (mm), is the absolute value of latitude in degrees (°), is the maximum wind speed in knots, is the natural constant, and parameters , , and are empirical constants determined from historical tropical cyclone rainfall and the corresponding maximum wind speed and latitude. Traditionally, nonlinear regression analysis is performed by transformation to achieve linear, homoscedastic or constant variance [48]. Log-log transformation is the most commonly used transformation:
This study rounded the maximum wind speed and latitude according to the rounding method. Because the large amount of data with latitude at and maximum wind speed at correspond to multiple values of tropical cyclone rainfall, we construct by averaging the tropical cyclone rainfall corresponding to exact and .
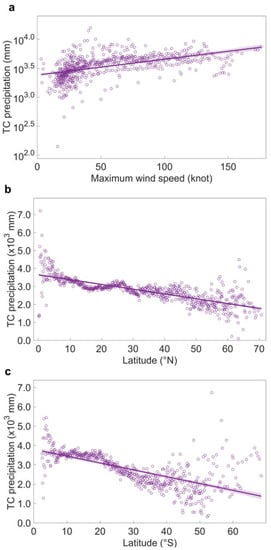
Figure A1.
The scatter of tropical cyclone rainfall and tropical cyclone characteristics and their linear trends. (a) Maximum wind speed. (b) Latitude in Northern Hemisphere and (c) Southern Hemisphere.

Table A1.
Statistical significance of the relationship between tropical cyclone rainfall and main factors.
Table A1.
Statistical significance of the relationship between tropical cyclone rainfall and main factors.
| Constant | 95% CI of Constant | p-Value (Uncorrected) | Slope | 95% CI of Slope | p-Value (Uncorrected) | d.f. | R2 | |
|---|---|---|---|---|---|---|---|---|
| 3.38 | [3.36, 3.41] | 0 | 2.73 × 10⁻³ | [2.37 × 10⁻³, 3.09 × 10⁻³] | 2.68 × 10−43 | 650 | 0.25 | |
| 3646.27 | [3575.05, 3717.5] | 0 | −26.61 | [−28.46, −24.76] | 1.97 × 10−115 | 661 | 0.55 | |
| 3801.71 | [3683.59, 3919.84] | 6.34 × 10−251 | −35.33 | [−38.82, −31.85] | 1.69 × 10−66 | 537 | 0.42 |
Here, CI is the confidence interval, and d.f. is the degree of freedom.
Appendix A.1.3. Regression Results
According to Equation (A2), we regressed the relationship between tropical cyclone rainfall, maximum wind speed, and latitude in both hemispheres and all ocean basins with a simple linear model. The regression results are listed in Table A2. The parameters are 6.58 and 7.32 in the Northern and Southern Hemispheres, respectively, and range from 5.99 to 8.25 in the ocean basins. The parameter does not differ significantly between the Northern and Southern Hemispheres and individual ocean basins. The slopes of latitude () are −0.23 and −0.39 in the Northern and Southern Hemispheres, respectively, and range from −0.72 to −0.12 in the ocean basins. The parameter represents the degree of response of tropical cyclone rainfall to latitude. With increasing latitude, tropical cyclone rainfall decreases more in the Southern Hemisphere than in the Northern Hemisphere. The largest decrease in tropical cyclone rainfall with increasing latitude is in the Eastern Pacific Ocean among the various ocean basins. The smallest decrease in tropical cyclone rainfall is in the Northern Atlantic Ocean. The slopes of maximum wind speed () are 0.55 and 0.49 in the Northern and Southern Hemispheres, respectively, and range from 0.31 to 0.76 in the ocean basins. The parameter represents the degree of response of tropical cyclone rainfall to maximum wind speed. As the maximum wind speed increases, tropical cyclone rainfall is greater in the Northern Hemisphere than in the Southern Hemisphere. The largest increase in tropical cyclone rainfall with increasing maximum wind speed among the various ocean basins is in the Eastern Pacific Ocean. The smallest decrease in tropical cyclone rainfall is in the Northern Indian Ocean.

Table A2.
Statistical significance of the relationship between tropical cyclone rainfall and maximum wind speed and latitude.
Table A2.
Statistical significance of the relationship between tropical cyclone rainfall and maximum wind speed and latitude.
| (Uncorrected) | (Uncorrected) | (Uncorrected) | d.f. | R2 | |||||||
|---|---|---|---|---|---|---|---|---|---|---|---|
| Northern Hemisphere | 6.58 | [6.47, 6.70] | 0 | −0.23 | [−0.25, −0.21] | 1.22 × 10−81 | 0.55 | [0.53, 0.58] | 0 | 3724 | 0.43 |
| Southern Hemisphere | 7.32 | [7.16, 7.49] | 0 | −0.39 | [−0.42, −0.35] | 1.22 × 10−94 | 0.49 | [0.46, 0.52] | 1.00 × 10−175 | 2463 | 0.38 |
| Northern Atlantic Ocean | 5.99 | [5.80, 6.18] | 0 | −0.12 | [−0.16, −0.08] | 1.09 × 10−09 | 0.59 | [0.56, 0.62] | 4.50 × 10−262 | 2460 | 0.41 |
| Northern Indian Ocean | 7.41 | [7.13, 7.68] | 4.15 × 10−288 | −0.19 | [−0.27, −0.11] | 3.52 × 10−06 | 0.31 | [0.26, 0.37] | 2.51 × 10⁻²⁶ | 963 | 0.12 |
| Eastern Pacific Ocean | 6.76 | [6.46, 7.06] | 5.19 × 10−262 | −0.72 | [−0.78, −0.66] | 5.00 × 10−94 | 0.76 | [0.7, 0.82] | 3.38 × 10−120 | 1377 | 0.48 |
| Western North Pacific Ocean | 6.35 | [6.21, 6.49] | 0 | −0.14 | [−0.17, −0.11] | 1.03 × 10⁻²⁰ | 0.58 | [0.55, 0.61] | 4.17 × 10−289 | 2374 | 0.44 |
| Southern Indian Ocean | 7 | [6.83, 7.18] | 0 | −0.33 | [−0.37, −0.29] | 2.79 × 10−62 | 0.5 | [0.47, 0.54] | 7.65 × 10−152 | 2237 | 0.34 |
| Southern Pacific Ocean | 8.25 | [8.05, 8.45] | 0 | −0.57 | [−0.62, −0.53] | 1.90 × 10−122 | 0.43 | [0.39, 0.47] | 1.07 × 10−93 | 1671 | 0.40 |
Appendix A.1.4. Spatial Distribution of Simulated Total Tropical Cyclone Rainfall
According to Equation (A2) and the parameter estimates in Table A2, the total amount of tropical cyclone rainfall can be estimated from the intensity and location of the tropical cyclone, and its spatial distribution can be assigned weights based on its historical spatial distribution, which in turn simulates the spatial distribution of tropical cyclone rainfall (Figure A2). The scatter plot of the simulated and historical values is shown in Figure A3 on a pixel-by-pixel basis (adjusted R2 = 0.9610, slope = 0.8758).
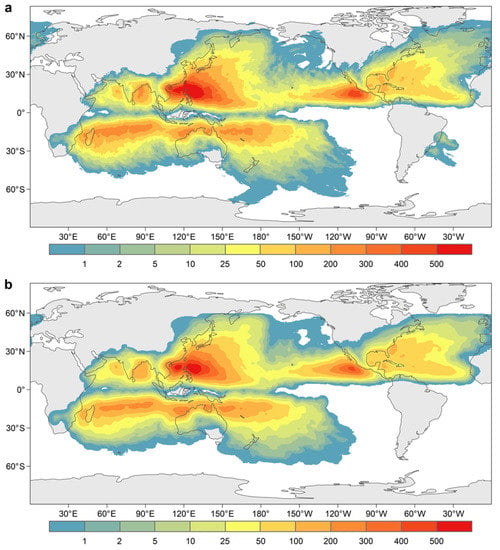
Figure A2.
Spatial distribution of global mean annual tropical cyclone rainfall from 1980 to 2020. (a): Historical tropical cyclone rainfall. (b): Simulated tropical cyclone rainfall.
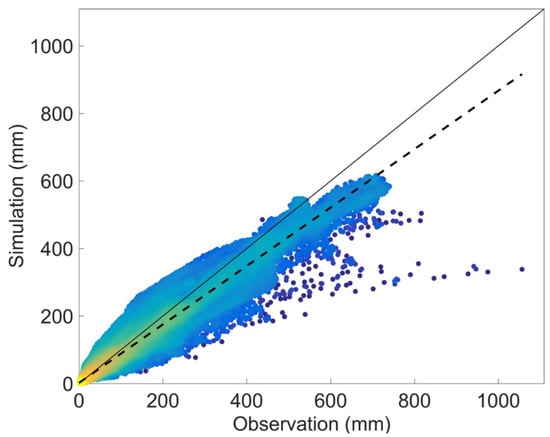
Figure A3.
Correlation between mean historical tropical cyclone rainfall and simulated tropical cyclone rainfall for 1980–2020, where the solid line is the 1:1 line and the dashed line is the slope of the fit.
Appendix A.1.5. Data Availability Statement
The best track dataset for TCs is obtained from the International Best Track Archive for the Climate Stewardship (IBTrACS) dataset: https://www.ncdc.noaa.gov/ibtracs/index.php?name=ibtracs-data (accessed on 31 May 2022). Three hourly precipitation data are obtained from Multi-Source Weighted-Ensemble Precipitation (MSWEP) in http://www.gloh2o.org/ (accessed on 30 June 2022).
References
- Peduzzi, P.; Chatenoux, B.; Dao, Q.-H.; De Bono, A.; Herold, C.; Kossin, J.; Mouton, F.; Nordbeck, O. Global trends in tropical cyclone risk. Nat. Clim. Chang. 2012, 2, 289–294. [Google Scholar] [CrossRef]
- Welker, C.; Faust, E. Tropical cyclone-related socio-economic losses in the western North Pacific region. Nat. Hazards Earth Syst. Sci. 2013, 13, 115–124. [Google Scholar] [CrossRef]
- Needham, H.F.; Keim, B.D.; Sathiaraj, D. A review of tropical cyclone-generated storm surges: Global data sources, observations, and impacts. Rev. Geophys. 2015, 53, 545–591. [Google Scholar] [CrossRef]
- Geiger, T.; Gütschow, J.; Bresch, D.N.; Emanuel, K.; Frieler, K. Double benefit of limiting global warming for tropical cyclone exposure. Nat. Clim. Chang. 2021, 11, 861–866. [Google Scholar] [CrossRef]
- Maxwell, J.T.; Bregy, J.C.; Robeson, S.M.; Knapp, P.A.; Soulé, P.T.; Trouet, V. Recent increases in tropical cyclone precipitation extremes over the US east coast. Proc. Natl. Acad. Sci. USA 2021, 118, e21056361182021. [Google Scholar] [CrossRef]
- Park, D.S.R.; Ho, C.H.; Kim, J.H. Growing threat of intense tropical cyclones to East Asia over the period 1977–2010. Environ. Res. Lett. 2014, 9, 014008. [Google Scholar] [CrossRef]
- Choi, J.W.; Cha, Y.; Kim, H.D.; Kang, S.D. Latitudinal change of tropical cyclone maximum intensity in the western North Pacific. Adv. Meteorol. 2016, 2016, 5829162. [Google Scholar] [CrossRef][Green Version]
- Kossin, J.P.; Emanuel, K.A.; Camargo, S.J. Past and projected changes in western North Pacific tropical cyclone exposure. J. Clim. 2016, 29, 5725–5739. [Google Scholar] [CrossRef]
- Oey, L.Y.; Chou, S. Evidence of rising and poleward shift of storm surge in western North Pacific in recent decades. J. Geophys. Res. Ocean. 2016, 121, 5181–5192. [Google Scholar] [CrossRef]
- Zhan, R.; Wang, Y. Weak tropical cyclones dominate the poleward migration of the annual mean location of lifetime maximum intensity of northwest Pacific tropical cyclones since 1980. J. Clim. 2017, 30, 6873–6882. [Google Scholar] [CrossRef]
- Song, J.; Klotzbach, P.J. What has controlled the poleward migration of annual averaged location of tropical cyclone lifetime maximum intensity over the western North Pacific since 1961? Geophys. Res. Lett. 2018, 45, 1148–1156. [Google Scholar] [CrossRef]
- Mei, W.; Xie, S.P. Intensification of landfalling typhoons over the northwest Pacific since the late 1970s. Nat. Geosci. 2016, 9, 753–757. [Google Scholar] [CrossRef]
- Hill, K.A.; Lackmann, G.M. The impact of future climate change on TC intensity and structure: A downscaling approach. J. Clim. 2011, 24, 4644–4661. [Google Scholar] [CrossRef]
- Collins, M.; Knutti, R.; Arblaster, J.; Dufresne, J.L.; Fichefet, T.; Friedlingstein, P. Long-term climate change: Projections, commitments and irreversibility. In Climate Change 2013-The Physical Science Basis: Contribution of Working Group I to the Fifth Assessment Report of the Intergovernmental Panel on Climate Change; Cambridge University Press: Cambridge, UK, 2013; pp. 1029–1136. [Google Scholar]
- Knutson, T.R.; Sirutis, J.J.; Zhao, M.; Tuleya, R.E.; Bender, M.; Vecchi, G.A. Global projections of intense tropical cyclone activity for the late twenty-first century from dynamical downscaling of CMIP5/RCP4. 5 scenarios. J. Clim. 2015, 28, 7203–7224. [Google Scholar] [CrossRef]
- Balaguru, K.; Foltz, G.R.; Leung, L.R.; Emanuel, K.A. Global warming-induced upper-ocean freshening and the intensification of super typhoons. Nat. Commun. 2016, 7, 1–8. [Google Scholar] [CrossRef]
- Hanson, S.; Nicholls, R.; Ranger, N.; Hallegatte, S.; Corfee-Morlot, J.; Herweijer, C.; Chateau, J. A global ranking of port cities with high exposure to climate extremes. Clim. Chang. 2011, 104, 89–111. [Google Scholar] [CrossRef]
- Freeman, A.C.; Ashley, W.S. Changes in the US hurricane disaster landscape: The relationship between risk and exposure. Nat. Hazards 2017, 88, 659–682. [Google Scholar] [CrossRef]
- Geiger, T.; Frieler, K.; Bresch, D.N. A global historical data set of tropical cyclone exposure (TCE-DAT). Earth Syst. Sci. Data 2018, 10, 185–194. [Google Scholar] [CrossRef]
- Varis, O.; Taka, M.; Tortajada, C. Global human exposure to urban riverine floods and storms. River 2022, 1, 80–90. [Google Scholar] [CrossRef]
- Ye, M.; Wu, J.; Wang, C.; He, X. Historical and future changes in asset value and GDP in areas exposed to tropical cyclones in China. Weather Clim. Soc. 2019, 11, 307–319. [Google Scholar] [CrossRef]
- Güneralp, B.; Güneralp, İ.; Liu, Y. Changing global patterns of urban exposure to flood and drought hazards. Glob. Environ. Chang. 2015, 31, 217–225. [Google Scholar] [CrossRef]
- IPCC. Summary for policymakers. In Managing the Risks of Extreme Events and Disasters to Advance Climate Change Adaptation. A Special Report of Working Groups I and II of the Intergovernmental Panel on Climate Change; Field, C.B., Barros, V., Stocker, T.F., Qin, D., Dokken, D.J., Ebi, K.L., Mastrandrea, M.D., Mach, K.J., Plattner, G.-K., Allen, S.K., et al., Eds.; Cambridge University Press: Cambridge, UK; New York, NY, USA, 2012; p. 582. [Google Scholar]
- Liao, X.; Xu, W.; Zhang, J.; Li, Y.; Tian, Y. Global exposure to rainstorms and the contribution rates of climate change and population change. Sci. Total Environ. 2019, 663, 644–653. [Google Scholar] [CrossRef] [PubMed]
- Jiang, T.; Su, B.; Wang, Y.; Wang, G.; Guo, G. Gridded datasets for population and economy under Shared Socioeconomic Pathways for 2020–2100. Clim. Chang. Res. 2022, 18, 381–383. [Google Scholar]
- IPCC. Climate Change 2014: Synthesis Report. Contribution of Working Groups I, II and III to the Fifth Assessment Report of the Intergovernmental Panel on Climate Change; Core Writing Team, Pachauri, R.K., Meyer, L.A., Eds.; IPCC: Geneva, Switzerland, 2014; p. 151. [Google Scholar]
- Holland, G.J. An analytic model of the wind and pressure profiles in hurricanes. Mon. Weather Rev. 1980, 108, 1212–1218. [Google Scholar] [CrossRef]
- Holland, G.J.; Belanger, J.I.; Fritz, A. A revised model for radial profiles of hurricane winds. Mon. Weather Rev. 2010, 138, 4393–4401. [Google Scholar] [CrossRef]
- Vickery, P.J.; Wadhera, D. Statistical models of Holland pressure profile parameter and radius to maximum winds of hurricanes from flight-level pressure and H* Wind data. J. Appl. Meteorol. Climatol. 2008, 47, 2497–2517. [Google Scholar] [CrossRef]
- Lin, W. Typhoon Wind Hazard Analysis of Hainan Island. Master Dissertation, Beijing Normal University, Beijing, China, 2014. (In Chinese). [Google Scholar]
- Qin, L.; Xu, W.; Qin, M.; Li, Z.; Qiao, Y.; Liu, B.; Zheng, J. Land use and land cover play weak roles in typhoon economic losses at the county level. Geomat. Nat. Hazards Risk 2021, 12, 1287–1297. [Google Scholar] [CrossRef]
- Tan, C. Assessment on Forest Damage Risk in Coastal China to Tropical Cyclone Wind Based on Parametric Wind Field Model and Multi-Source Remote Sensing. Doctoral Dissertation, Beijing Normal University, Beijing, China, 2020. (In Chinese). [Google Scholar]
- Harper, B.A.; Hardy, T.; Mason, L.; McConochie, J.D. Queensland Climate Change and Community Vulnerability to Tropical Cyclones: Ocean Hazards Assessment-Stage 1; Report Prepared by Systems Engineering Australia in Conjunction with James Cook University Marine Modelling Unit; Queensland Government: Brisbane, Australia, 2001. [Google Scholar]
- Lau, K.M.; Zhou, Y.P.; Wu, H.T. Have tropical cyclones been feeding more extreme rainfall? J. Geophys. Res. Atmos. 2008, 113, D23. [Google Scholar] [CrossRef]
- Zhang, Q.; Lai, Y.; Gu, X.; Shi, P.; Singh, V.P. Tropical cyclonic rainfall in China: Changing properties, seasonality, and causes. J. Geophys. Res. Atmos. 2018, 123, 4476–4489. [Google Scholar] [CrossRef]
- Jiang, H.; Zipser, E.J. Contribution of tropical cyclones to the global precipitation from eight seasons of TRMM data: Regional, seasonal, and interannual variations. J. Clim. 2010, 23, 1526–1543. [Google Scholar] [CrossRef]
- Prat, O.P.; Nelson, B.R. Mapping the world’s tropical cyclone rainfall contribution over land using the TRMM Multi-satellite Precipitation Analysis. Water Resour. Res. 2013, 49, 7236–7254. [Google Scholar] [CrossRef]
- Barfus, K.; Bernhofer, C. Assessment of GCM performances for the Arabian Peninsula, Brazil, and Ukraine and indications of regional climate change. Environ. Earth Sci. 2014, 72, 4689–4703. [Google Scholar] [CrossRef]
- Samouly, A.A.; Luong, C.N.; Li, Z.; Smith, S.; Baetz, B.; Ghaith, M. Performance of multi-model ensembles for the simulation of temperature variability over Ontario, Canada. Environ. Earth Sci. 2018, 77, 524. [Google Scholar] [CrossRef]
- United Nations Office for Disaster Risk Reduction (UNISDR). Terminology. Available online: https://www.undrr.org/terminology (accessed on 21 September 2022).
- Kossin, J.P. A global slowdown of tropical-cyclone translation speed. Nature 2018, 558, 104–107. [Google Scholar] [CrossRef]
- Jones, B.; O’Neill, B.C.; McDaniel, L.; McGinnis, S.; Mearns, L.O.; Tebaldi, C. Future population exposure to US heat extremes. Nat. Clim. Chang. 2015, 5, 652–655. [Google Scholar] [CrossRef]
- Liu, Z.; Anderson, B.; Yan, K.; Dong, W.; Liao, H.; Shi, P. Global and regional changes in exposure to extreme heat and the relative contributions of climate and population change. Sci. Rep. 2017, 7, 43909. [Google Scholar] [CrossRef]
- Knapp, K.R.; Kruk, M.C.; Levinson, D.H.; Diamond, H.J.; Neumann, C.J. The international best track archive for climate stewardship (IBTrACS) unifying tropical cyclone data. Bull. Am. Meteorol. Soc. 2010, 91, 363–376. [Google Scholar] [CrossRef]
- Harper, B.A.; Kepert, J.D.; Ginger, J.D. Guidelines for Converting between Various Wind Averaging Periods in Tropical Cyclone Conditions; WMO: Geneva, Switzerland, 2010. [Google Scholar]
- Beck, H.E.; Van Dijk, A.I.; Levizzani, V.; Schellekens, J.; Miralles, D.G.; Martens, B.; De Roo, A. MSWEP: 3-hourly 0.25 global gridded precipitation (1979–2015) by merging gauge, satellite, and reanalysis data. Hydrol. Earth Syst. Sci. 2017, 21, 589–615. [Google Scholar]
- Beck, H.E.; Wood, E.F.; Pan, M.; Fisher, C.K.; Miralles, D.G.; Van Dijk, A.I.; McVicar, T.R.; Adler, R.F. MSWEP V2 global 3-hourly 0.1 precipitation: Methodology and quantitative assessment. Bull. Am. Meteorol. Soc. 2019, 100, 473–500. [Google Scholar]
- Wen, S.; Su, B.; Wang, Y.; Fischer, T.; Li, X.; Yin, Y.; Chao, G.; Wang, R.; Jiang, T. Economic sector loss from influential tropical cyclones and relationship to associated rainfall and wind speed in China. Glob. Planet. Chang. 2018, 169, 224–233. [Google Scholar] [CrossRef]
Disclaimer/Publisher’s Note: The statements, opinions and data contained in all publications are solely those of the individual author(s) and contributor(s) and not of MDPI and/or the editor(s). MDPI and/or the editor(s) disclaim responsibility for any injury to people or property resulting from any ideas, methods, instructions or products referred to in the content. |
© 2022 by the authors. Licensee MDPI, Basel, Switzerland. This article is an open access article distributed under the terms and conditions of the Creative Commons Attribution (CC BY) license (https://creativecommons.org/licenses/by/4.0/).