Abstract
Water vapor transport plays a significant role in maintaining the water cycle over the Tibetan Plateau (TP). This study investigates the characteristics of water vapor transport across the TP southern boundaries and its impacts on TP precipitation during the Indian summer monsoon (ISM) season from 2000 to 2019. The southern boundary is subdivided into four sub-boundaries from the east to the west: boundaries 7 (100°–95° E), 8 (95°–89° E), 9 (89°–80° E), and 10 (80°–70° E) (B7, B8, B9, and B10). ISM can affect the water vapor transports of B7, B8, and B9, while mid-latitude westerlies dominate the water vapor transport of B10. An area with concentrated spatial precipitation in both strong and weak ISM months is regarded as a precipitation concentration region (PCR). The results show that the PCR precipitation is smaller in the weak ISM month than in the normal month for most of the day, while it is larger in the strong ISM month than in the normal month. The PCR precipitation difference from afternoon to evening in strong and weak ISM months between normal months shows a dependency on the water vapor transport of B8 and B10. Water vapor transported across B9 also contributes to the increased PCR precipitation in the afternoon. The PCR precipitation shows a more dependable relationship to the water vapor from the BoB and the Arabian Sea in strong ISM months than in weak ISM months. Conversely, the water vapor transport efficiency is low in strong ISM months due to a cyclonic circulation over northern India, preventing water vapor transport from reaching the TP directly.
1. Introduction
The Tibetan Plateau (TP), known as “the world water tower”, is an essential water tower in the world for two reasons [1]. Firstly, the TP is the highest land in the world with an average altitude of over 4000 m and is referred to as the “roof of the world”. Secondly, a large amount of water is stored and maintained in the TP in all its forms, as it includes more than 1 × 10⁴ km2 of glaciers [2,3], over 5 × 10⁴ km2 of lakes [4], and approximately 1.06 × 10⁶ km2 of permafrost [5]. Meanwhile, the TP is also the origination of more than ten major rivers, such as the Yangtze, the Yellow River, and the Mekong River [6]. Abundant water resources are stored in the TP, while a large amount of water is flowing out of the TP at the same time. That means the maintenance of the regional water cycle in the TP needs water sources outside the TP, and an important source is the water vapor transported into the TP by circulation [7,8,9,10,11]. Water vapor transport plays a significant role in maintaining the water cycle over the TP, and this topic has invoked the interest of many researchers [12,13,14,15].
For the TP, in addition to the evaporation from the local surface, moisture from outside, e.g., the Bay of Bengal (BoB), the Arabian Sea, and the mid-latitude westerlies, is the most critical water vapor source in summer [7,8,16,17,18]. The TP locates at the convergence of the mid-latitude westerlies and the South Asian monsoon systems [19,20,21,22]. The large-scale circulations provide favorable dynamic conditions for water vapor transport to the TP. Previous studies have noted that water vapor enters the TP mainly across two boundaries [13,23,24,25]. One is the western boundary dominated by mid-latitude westerlies. The other is the southern boundary, which is mainly influenced by the Indian summer monsoon (ISM). The southern boundary has been identified as the boundary with the most considerable water vapor input [23,24]. The water vapor transported by the ISM from the Arabian Sea and the BoB across the southern boundary accounts for over 60% of total transported moisture into the TP [26].
The southern boundary of the TP is a complex terrain with the highest mountains in the world, the Himalayas. On the one hand, these mountains form a mechanical barrier to water vapor input [27], as part of the water vapor flow is blocked by the plateau and then deflected predominantly to the east side of it after reaching the TP [28]. On the other hand, there is intense surface sensible heating (SH) appearing over the southern slope of the TP in the summer [29,30]. Xu et al. (2014) revealed that water vapor could be transported to the TP through a CISK (conditional instability of the second kind)-like mechanism [31]. The warm–moist airflow rises to the plateau and is then transported to the center of it, forced by the surface heating, resulting in frequent convection and precipitations over the TP [32].
Since water vapor is an indispensable material for the formation of precipitation, many previous studies [13,23,33,34] have emphasized the significance of the southern boundary as a vital water vapor input boundary for the precipitation of the plateau in summer. Feng and Zhou (2012) addressed that water vapor transport from the southern boundary dominated the summer precipitation over the southeastern TP [23]. This point is supported by Zhang et al. (2019), who estimated that more than half of the precipitation moisture in the southern TP is transported from the southwest of the TP with the breakout of the Indian monsoon in summer [34]. Dong et al. (2016) indicated that water vapor is transported to the TP via the up-and-over route. In this route, moisture is lifted by convective storms along the south slope of the plateau and then swept over the southwestern TP (SWTP) by the mid-tropospheric circulation [33]. Moisture transported in this pathway accounts for over half of the total summer rainfall over the SWTP. Therefore, this study focuses on the water vapor transport across the southern boundary and its impact on precipitation in the TP.
Although there are many previous studies on water vapor and water vapor transport over the TP, most of them, as mentioned above, are mainly based on monthly or longer time scales. The daily and sub-daily variations of water vapor transported into the TP under the influence of the ISM still need to be further investigated. The diurnal cycle of the whole TP precipitation is marked with a nighttime peak [35,36]. Xu and Zipser (2011) found that the central and eastern TP was dominated by nocturnal rainfall [37]; this was also reported by Bao at al. (2011) [38]. Chen et al. [39,40] reported that water vapor transport can affect the precipitation climatological characteristics and rainfall events over the TP.
Moreover, the detailed characteristics of water vapor transport across southern boundaries and its impact on the precipitation in the TP still need to be further investigated. This paper analyses the characteristics of water vapor transport across the southern boundary and the corresponding precipitation characteristics over the TP in the monsoon season (June through September). Possibilities responsible for the precipitation change in the TP are further discussed.
2. Materials and Methods
The ERA5 hourly reanalysis data for the duration of 2000–2019 in the monsoon season (June through September) produced by the European Centre for Medium-Range Weather Forecasts (ECMWF) is used in this study. Compared with ERA-Interim, ERA5 has a higher spatial and temporal resolution [41,42], so it performs better in capturing the spatial pattern of water vapor transport over the TP [12,43,44,45]. To analyze the water vapor transport to the TP, the hourly specific humidity, temperature, surface latent heat flux, surface sensible heat flux, surface pressure, total precipitation, and wind field from the ERA5 reanalysis data set are used in this study, which has a horizontal resolution of 0.25° × 0.25° with 137 vertical levels [46].
The hourly CMORPH precipitation product, which is merged by the China Automatic Weather Station (CAWS), is used in this study. The time period is 2000–2019 in the monsoon season (June through September). The probability density function–optimal interpolation (PDF-OI) methods have been applied in this product to merge the gauge observations from more than 30,000 automatic weather stations in China with the Climate Precipitation Center Morphing (CMORPH) precipitation product [47]. The improved merged precipitation product over China at hourly, 0.1° resolution has been certified as having better quality than the CMORPH and is more applicable to the precipitation study in China [48].
The Asian summer monsoon (ASM) is the largest and strongest monsoon system in the world [49], of which the Indian summer monsoon (ISM) is one of the monsoon subsystems. The strength of the ISM can be characterized by the ISM Index (IMI). Wang and Fan (1999) proposed an IMI, which is defined as the difference in the 850-hPa zonal winds between a region in the Arabian Sea (5°–15° N, 40°–80° E) and a region in the eastern TP (20°–30° N, 70°–90° E), and this index is used in this study [50]. The zonal wind shear has a stronger correlation with the rainfall, and this IMI well-represents the rainfall anomalies averaged over the BoB, India, and the eastern Arabian Sea [51].
The strong and weak ISM months are classified based on the standardized anomaly of IMI in the monsoon season (June through September) for the years 2000–2019. A strong (weak) ISM month is flited out when the monthly standardized anomaly of the IMI is greater (less) than 1.0 (−1.0). Other months with the monthly standardized anomaly of the IMI between −1 and 1 are normal ISM months. The standardized anomaly is computed by Equation (1), and the selection results are shown in Table 1.
where is the standardized anomaly, is the IMI of each month in JJAS (June–September) from 2000–2019, is the mean value of IMI, and is the standard deviation of IMI.

Table 1.
Strong and weak ISM months in JJAS from 2000 to 2019.
Moisture availability and transport can be estimated and described by integrated water vapor transport (IVT) [52]. The IVT can be used to investigate the total amount of water vapor transport in an atmospheric column. The atmospheric data are used to calculate the IVT according to Equation (2). The meridional and zonal water vapor flux across the southern boundaries can be calculated as Equations (3) and (4).
where is the acceleration due to gravity (m·s−2), is the specific humidity (kg·kg−1), is the wind vector (m·s−1), are the meridional and zonal wind (m·s−1). is the surface pressure (hPa), as the surface pressure of the plateau is relatively low, its actual number of integral layers is less than that of other regions. Previous studies usually set the top atmospheric pressure as 300 hPa [23,53,54], while the water vapor content above 300 hPa has shown a slight increasing trend in recent years due to the enhancement of evaporation over the TP [55,56]. Deep convection in the summer monsoon region can also transport low-level water vapor into the upper troposphere [8]. Considering that there is still a slight but non-negligible amount of water vapor above 300 hPa, the top atmospheric pressure () in this study is set to be 100 hPa. Previous studies usually divided the TP boundary into several sub-boundaries, which can help to understand the detailed characteristics of the water vapor transport to the TP [17,57,58]. According to the geometric shape of the TP, 10 boundaries are divided around the areas where the altitude is above 3000 m, as shown in Figure 1. Since many studies have emphasized the importance of the southern boundary as a water vapor input boundary for the TP [23,24,26,31], this study focuses on B7, B8, B9, and B10 which are subdivided by the southern boundary as illustrated in Figure 1.
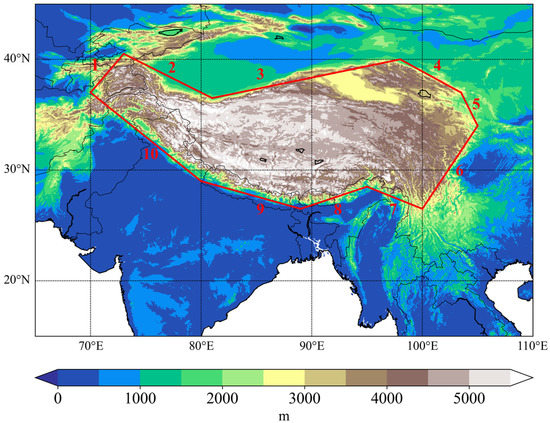
Figure 1.
The area boundaries of the TP. The shaded color denotes the altitude (m), and the red lines denote the study boundary for the vapor transport between the TP and its surrounding areas. The boundaries are marked as boundary 1 (70° E, 37° N–73° E, 40.5° N), boundary 2 (73° E, 40.5° N–81° E, 36.5° N), boundary 3 (81° E, 36.5° N–98° E, 40° N), boundary 4 (98° E, 40° N–103.5° E, 37° N), boundary 5 (103.5° E, 37° N–105° E, 34° N), boundary 6 (105° E, 34° N–100° E, 26.5° N), boundary 7 (95° E, 28.5° N–100° E, 26.5° N), boundary 8 (89° E, 26.5° N–95° E, 28.5° N), boundary 9 (80° E, 29° N–89° E, 26.5° N), boundary 10 (70° E, 37° N–80° E, 29° N).
In addition, the Pearson correlation coefficient is used to characterize the correlation between precipitation and IVT. If the significance level was better than 0.05, the correlation coefficient was statistically significant.
3. Results
3.1. Characteristics of Water Vapor Transport and Precipitation over the TP in Normal ISM Months
Figure 2 shows the IVT spatial distribution of diurnal variation over and around the TP in the normal ISM months at (a) 16LT(LT = UTC + 6 h), (b) 17LT, (c) 18LT, and (d) 19LT. It is shown that the BoB located south of the TP is an essential external water vapor source for the TP. The warm-moist airflow originating from the BoB carries a large amount of water vapor to the TP across B8 and B7. Part of the airflow changes toward the west with a cyclonic rotation over northern India, reaching the TP across B9. The mid-latitude westerlies are also water vapor transport paths that drive water vapor to the TP across B10.
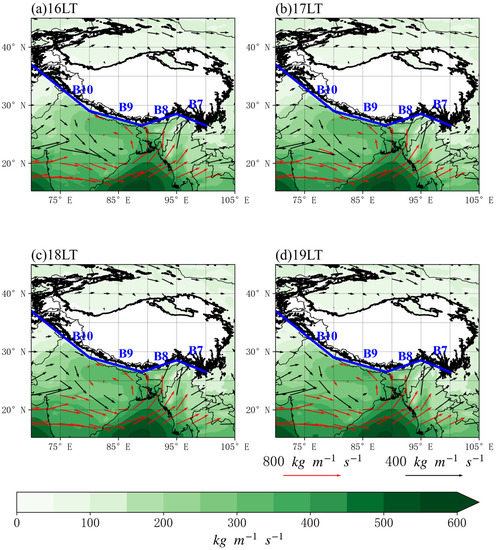
Figure 2.
IVT (units: kg·m−1·s−1) spatial distribution of diurnal variation over and around the TP in the normal ISM months at (a) 16LT, (b) 17LT, (c) 18LT, (d) 19LT. The IVT above 300 kg·m−1·s−1 is expressed by red arrow and that less than 300 kg·m−1·s−1 is expressed by black arrow. The bold black lines denote the topographic height of 3000 m. The blue solid lines represent the locations of B7 (95° E, 28.5° N–100° E,26.5° N), B8 (89° E, 26.5° N–95° E, 28.5° N), B9 (80° E, 29° N–89° E, 26.5° N), B10 (70° E, 37° N–80° E, 29° N).
Figure 3 demonstrates the spatial distribution of hourly rain intensity (mm/h−1) over the TP and surrounding regions during normal ISM months at (a) 16LT, (b) 17LT, (c) 18LT, and (d) 19LT. An area with concentrated spatial precipitation in both strong and weak ISM months is regarded as a precipitation concentration region (PCR, red boxes in Figure 3). It can be seen that precipitation mainly occurs in the southeastern TP [54], especially above the lakes, such as Siling Co and Zhari Namco [59]. Kukulies et al. (2020) have found that the precipitation of the whole TP shows an afternoon peak at 15LT. The PCR precipitation exhibits later diurnal peaks with maximum precipitation at 17LT compared with the whole TP (Figure 4). Figure 5 demonstrates that precipitation in PCR has a good correlation with the water vapor transport across B10, which is mainly affected by the mid-latitude westerlies. As is shown in Figure 6a, the meridional water vapor fluxes across B10 show a significant increasing trend from 10LT to 18LT. Moreover, there is zonal water vapor transport through B10 from 09LT to 17LT (Figure 6b). Both of these conditions contribute to moisture supply for increased precipitation in PCR. For B8 and B9, mountains, e.g., the Himalayas, act as huge barriers to airflow. Driving by the sloping lateral surface heating over the southern TP, the moisture in the airflow could turn into precipitation while climbing up the southern slope of the TP before reaching PCR. Contrary to the decreasing trend of precipitation in PCR during the nighttime, the precipitation in front of the Himalayas shows a significant ascending trend during the nocturnal hours (00–04LT), which has been reported by previous studies [11,29,53,60,61]. According to the study of Barros and Lang (2003), the atmospheric instability and moisture over the Himalayas increase gradually during the day and are then released around midnight, leading to the nocturnal peak in rainfall along the Himalayas [62].
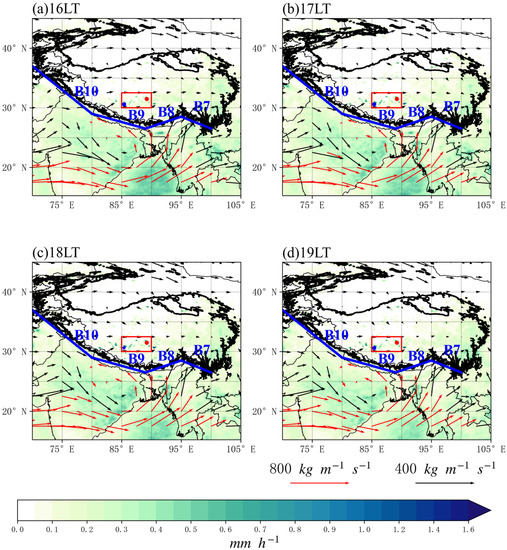
Figure 3.
Spatial distribution of hourly rain intensity (shading; units: mm·h−1) and IVT (vectors; units: kg·m−1·s−1) over the TP and surrounding regions during normal ISM months at (a) 16LT, (b) 17LT, (c) 18LT, and (d) 19LT. The IVT above 300 kg·m−1·s−1 is expressed by red arrow and that less than 300 kg·m−1·s−1 is expressed by black arrow. The bold black lines denote the topographic height of 3000 m. The blue solid lines represent the locations of B7 (95° E, 28.5° N–100° E,26.5° N), B8 (89° E, 26.5° N–95° E, 28.5° N), B9 (80° E, 29° N–89° E, 26.5° N), B10 (70° E, 37° N–80° E, 29° N). The PCR (30°–32.5° N, 85°–90° E) location is shown in red boxes. The blue point represents the location of Zhari Namco and the red point represents the location of Siling Co.
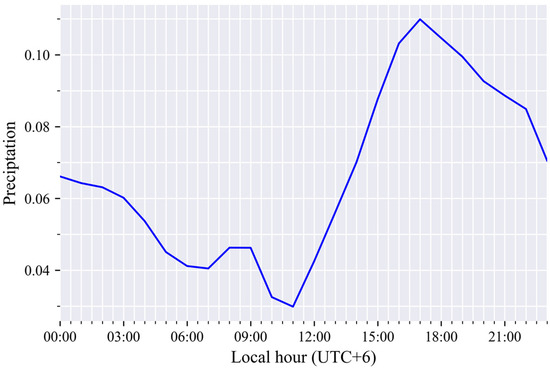
Figure 4.
Diurnal cycle of the precipitation (units: mm·h−1) in PCR during normal ISM months.
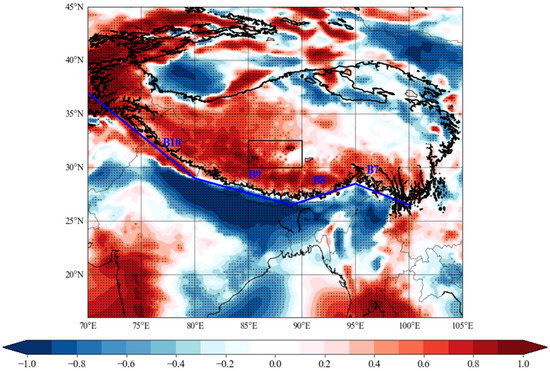
Figure 5.
Distribution of correlation between precipitation in PCR and IVT over the TP and the surrounding regions during normal ISM months. The dotted areas denote the 95% confidence interval from the significance test. The blue solid lines represent the locations of B7 (95° E, 28.5° N–100° E,26.5° N), B8 (89° E, 26.5° N–95° E, 28.5° N), B9 (80° E, 29° N–89° E, 26.5° N), B10 (70° E, 37° N–80° E, 29° N). The bold black lines denote the topographic height of 3000 m. The black box indicates the location of PCR (30°–32.5° N, 85°–90° E).
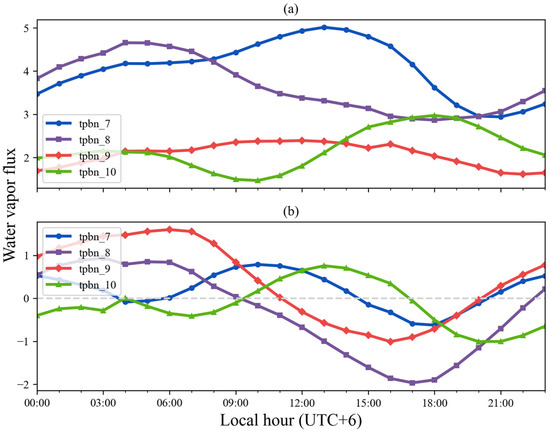
Figure 6.
Diurnal cycle of (a) meridional and (b) zonal water vapor flux (units: 10−4·g·m−1·Pa−1·s−1) transported across B7, B8, B9, B10 during normal ISM months.
3.2. Difference in IVT and Precipitation over the TP between Strong ISM Months and Normal ISM Months
Figure 7 shows the spatial distribution differences in precipitation and IVT between the strong and normal ISM months over the TP and surroundings at (a) 08LT, (b) 09LT, (c) 10LT, (d) 17LT, (e) 18LT, and (f) 19LT. When the ISM is enhanced, precipitation increases slightly in most parts of the TP. The diurnal cycle of the precipitation differences between the strong and normal ISM months in PCR is displayed in Figure 8. For the PCR, the strong ISM months’ precipitation is greater than normal ISM months in each hour of the day. The diurnal cycle is characterized by a morning peak at 09LT and an early evening peak at 18LT. Figure 9 depicts the spatial distributions of correlation coefficients of precipitation difference in PCR with IVT difference over the TP and the surroundings between strong and normal ISM months. The water vapor transported across B8, B9, and B10 shows positive correlations with the PCR precipitation. Since water vapor flows out from the TP to the south across these four boundaries from 00LT to 09LT (Figure 10b), the peak of increased precipitation in PCR at 09LT is mainly caused by the meridional water vapor input. As shown in Figure 10a, the water vapor can be meridionally transported into the TP through B10 from 00LT to 09LT. At the same time, the meridional water vapor fluxes across B9 also show a significant increasing tendency from 04LT to 09LT. Figure 11a–c illustrate that the enhanced northwest airflows can transport the water vapor into the TP. Both of them contribute to the increase in the PCR precipitation from 00LT to 09LT. Then in the afternoon (15LT–18LT), the PCR precipitation increases again and reaches its daily maximum at 18LT. On the one hand, the meridional water vapor flux across B9 increases during the same time (Figure 10a). Meanwhile, it is noticed that the IVT around B7 shows a slightly enhanced trend during this time. The enhanced southwest air flows help the water vapor into the TP, so the meridional water vapor fluxes across B7 show an increasing tendency from 15LT to 20LT. While considering that the enhanced westerly airflows dominate the TP, it may be challenging for the moisture transported across B7 to reach PCR. Therefore, water vapor transport across B7 may contribute little to the increased precipitation in PCR. On the other hand, the zonal water vapor flux across B8 shows a notable increasing trend during this time (Figure 10b). As shown in Figure 11d,e, the IVT increased significantly near B8, which is beneficial to the water vapor transport from the northern BoB to the TP, and then the water vapor can be carried to PCR by the airflow.
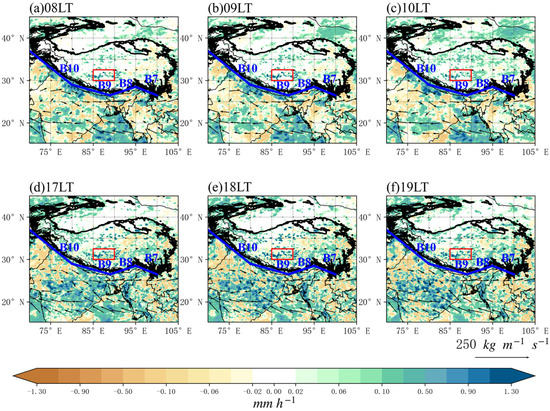
Figure 7.
Spatial distribution of precipitation differences (shading; units: mm·h−1) and IVT differences (vectors; units: kg·m−1·s−1) between the strong ISM and normal ISM months over the TP and surroundings at (a) 08LT, (b) 09LT, (c) 10LT, (d) 17LT, (e) 18LT, and (f) 19LT. The bold black lines denote the topographic height of 3000 m. The blue solid lines represent the locations of B7 (95° E, 28.5° N–100° E,26.5° N), B8 (89° E, 26.5° N–95° E, 28.5° N), B9 (80° E, 29° N–89° E, 26.5° N), B10 (70° E, 37° N–80° E, 29° N). The PCR (30°–32.5° N, 85°–90° E) location is shown in red boxes.
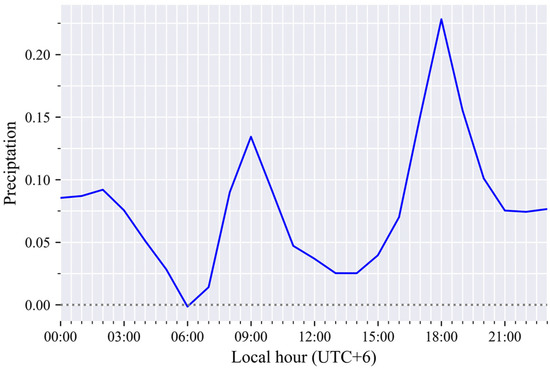
Figure 8.
Diurnal cycle of the precipitation (units: mm·h−1) difference between the strong ISM months and normal ISM months in PCR.
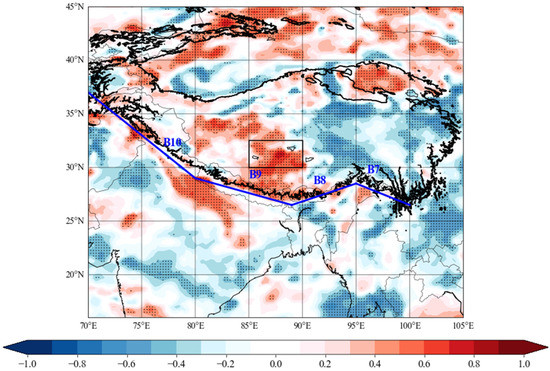
Figure 9.
Spatial distributions of correlation coefficients of precipitation difference in PCR with IVT difference over the TP and the surroundings between strong ISM months and normal ISM months. The dotted areas denote the 95% confidence interval from the significance test. The blue solid lines represent the locations of B7 (95° E, 28.5° N–100° E, 26.5° N), B8 (89° E, 26.5° N–95° E, 28.5° N), B9 (80° E, 29° N–89° E, 26.5° N), B10 (70° E, 37° N–80° E, 29° N). The bold black lines denote the topographic height of 3000 m. The black box indicates the location of PCR (30°–32.5° N, 85°–90° E).
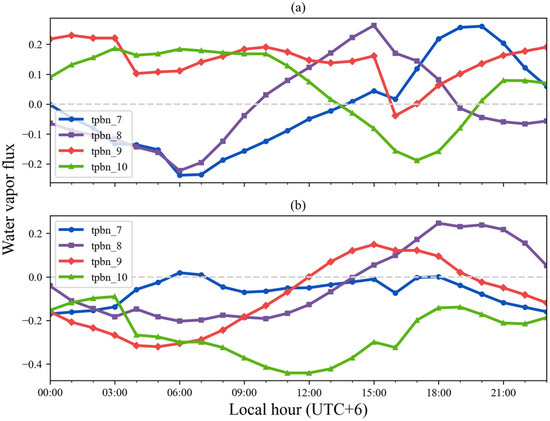
Figure 10.
Diurnal cycle of the differences of (a) meridional and (b) zonal water vapor flux (units: 10−4·g·m−1·Pa−1·s−1) transport across B7, B8, B9, B10 between strong ISM months and normal ISM months.
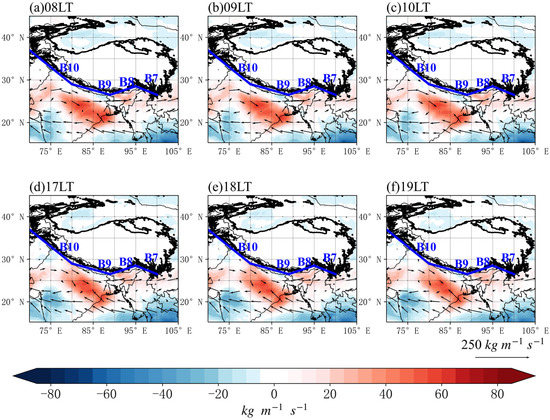
Figure 11.
The IVT (units: kg·m−1·s−1) spatial distribution of diurnal variation of the difference between the strong ISM months and normal ISM months at (a) 08LT, (b) 09LT, (c) 10LT, (d) 17LT, (e) 18LT, and (f) 19LT. The blue solid lines represent the locations of B7 (95° E, 28.5° N–100° E, 26.5° N), B8 (89° E, 26.5° N–95° E, 28.5° N), B9 (80° E, 29° N–89° E, 26.5° N), B10 (70° E, 37° N–80° E, 29° N). The bold black lines denote the topographic height of 3000 m.
3.3. Difference in IVT and Precipitation between Weak ISM Months and Normal ISM Months
Figure 12 shows the spatial distribution of precipitation differences and IVT differences between the weak and normal ISM months at (a) 06LT, (b) 07LT, (c) 08LT, (d) 20LT, (e) 21LT, and (f) 22LT. It shows that the TP precipitation changes in the weak ISM months are smaller than in the strong ISM months. It can be seen from Figure 13 that the PCR precipitation in weak ISM months is smaller than that in normal ISM months for most of the day. The precipitation in PCR only increases in the evening (19–22LT) and reaches a peak at 21LT. Figure 14 shows the distribution of correlation of differences in the PCR precipitation and the IVT over the TP and the surroundings between weak and normal ISM months. As shown in Figure 14, the water vapor transport across B10 and B8 correlates well with the PCR precipitation. First, the IVT increases around B10 (Figure 15), suggesting that water vapor can be transported from the Arabian Sea to the TP across B10. It can be seen in Figure 16b that the zonal water vapor transports out across B7, B8, and B9 except B10 during the whole day. Both the meridional and zonal water vapor flux across B10 show increasing tendencies from afternoon to evening (16–22LT), contributing to the PCR precipitation increase. Secondly, it can be seen in Figure 14 that PCR precipitation shows a good correlation with IVT around the area (29° N, 82° E) of B9. The water vapor transport between TP and the Arabian Sea is active, resulting in the increment of the IVT around B9 (Figure 15d–f). As is shown in Figure 16a, the meridional water vapor transport across B9 increases from 18LT to 21LT. These two factors contribute together to the precipitation increment in PCR. Finally, the lower terrain near B8 provides a favorable condition for the water vapor entrance of the TP. Since the IVT around B8 is enhanced (Figure 15), B8 is an efficient boundary for the water vapor transport between the TP and the south during the day. The meridional water vapor transport across B8 shows an increasing trend during 14–19LT, contributing moisture to the maximum precipitation in PCR at 21LT.
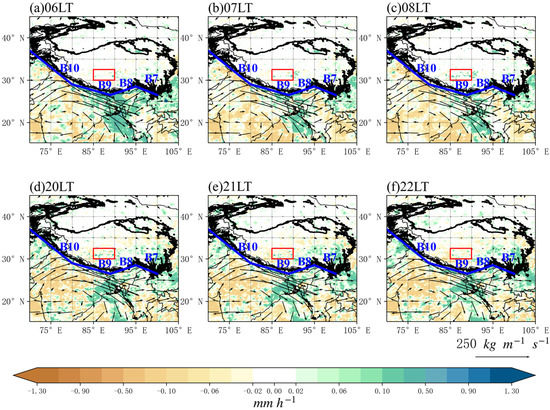
Figure 12.
Spatial distribution of precipitation differences (contour; units: mm·h−1) and IVT differences (vectors; units: kg·m−1·s−1) between the weak ISM and normal ISM months over the TP and surroundings (a) 06LT, (b) 07LT, (c) 08LT, (d) 20LT, (e) 21LT, and (f) 22LT. The bold black lines denote the topographic height of 3000 m. The blue solid lines represent the locations of B7 (95° E, 28.5° N–100° E, 26.5° N), B8 (89° E, 26.5° N–95° E, 28.5° N), B9 (80° E, 29° N–89° E, 26.5° N), B10 (70° E, 37° N–80° E, 29° N). The PCR (30°–32.5° N, 85°–90° E) location is shown in red boxes.
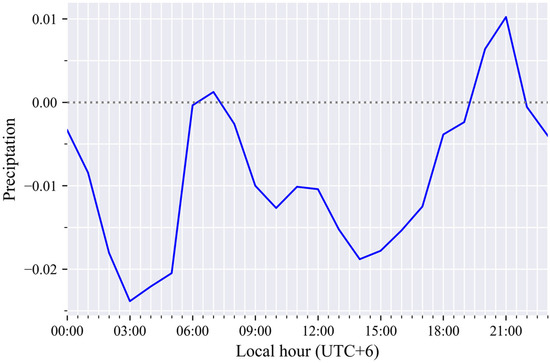
Figure 13.
Diurnal cycle of the precipitation differences (units: mm·h−1) between the weak ISM months and normal ISM months in PCR.
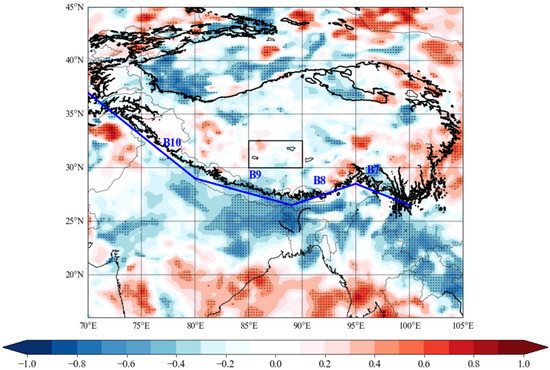
Figure 14.
Spatial distributions of correlation coefficients of precipitation difference in PCR with IVT difference over the TP and the surroundings between weak ISM months and normal ISM months. The dotted areas denote the 95% confidence interval from the significance test. The blue solid lines represent the locations of B7 (95° E, 28.5° N–100° E,26.5° N), B8 (89° E, 26.5° N–95° E, 28.5° N), B9 (80° E, 29° N–89° E, 26.5° N), B10 (70° E, 37° N–80° E, 29° N). The bold black lines denote the topographic height of 3000 m. The black box indicates the location of PCR (30°–32.5° N, 85°–90° E).
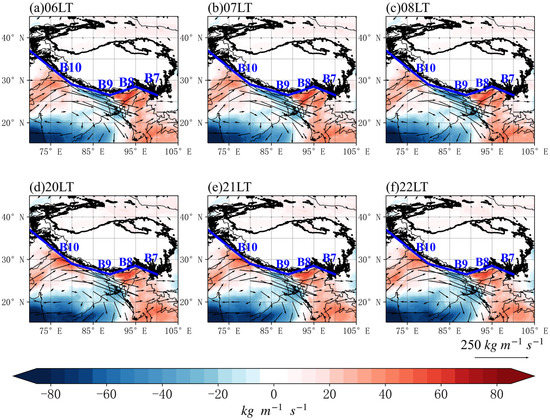
Figure 15.
The IVT (units: kg·m−1·s−1) spatial distribution of diurnal variation of the difference between the weak ISM months and normal ISM months at (a) 06LT, (b) 07LT, (c) 08LT, (d) 20LT, (e) 21LT, and (f) 22LT. The blue solid lines represent the locations of B7 (95° E, 28.5° N–100° E, 26.5° N), B8 (89° E, 26.5° N–95° E, 28.5° N), B9 (80° E, 29° N–89° E, 26.5° N), B10 (70° E, 37° N–80° E, 29° N). The bold black lines denote the topographic height of 3000 m.
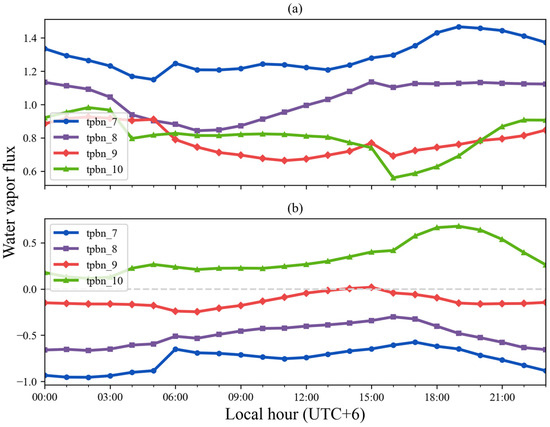
Figure 16.
Diurnal cycle of the differences in (a) meridional and (b) zonal water vapor flux (units: 10−4·g·m−1·Pa−1·s−1) transport across B7, B8, B9, B10 between weak ISM months and normal ISM months.
4. Conclusions
This study focuses on the effects of the ISM on the characteristics of water vapor transport across the southern boundary of the TP and its impacts on the change in precipitation over the TP. The ERA5 reanalysis data from 2000 to 2019 and CMORPH precipitation products are used to investigate this issue. The main conclusions are summarized as follows.
The water transport of the TP southern boundary is affected by both mid-latitude westerlies and ISM. The precipitation in PCR shows a positive correlation relationship with the water vapor transport across B10, which is influenced by mid-latitude westerlies, no matter whether the ISM is strong or weak. In weak ISM months, the correlation between the PCR precipitation and the water vapor transport across B9 and B8 originating from the BoB and the Arabian Sea is weaker compared with strong ISM months. The ISM-dominated B7 is a water vapor source boundary in both strong and weak ISM months. PCR is located northwest of B7. The circulation pattern over the TP is dominated by the westerly winds in strong and weak ISM months. As a result, it is challenging for the southwesterly warm-moist airflows flowing across B7 to reach the PCR.
Compared with the precipitation in the normal ISM months, the PCR precipitation in the strong ISM months is greater in each hour of the day. It shows a significant increasing trend from 14LT to 18LT and reaches its peak at 18LT. The zonal water vapor flux transported across B8 and meridional water vapor flux transported across B9 increase during that time. The enhanced IVT around B8 and B9 indicates that the airflow carries moisture from the BoB to the plateau and contributes to the increased PCR precipitation. Meanwhile, the zonal water vapor transport across B10 also brings moisture to the PCR and is beneficial to increasing the PCR precipitation.
Similar to the PCR precipitation difference between strong and normal ISM months, the PCR precipitation difference between weak and normal ISM months also increases from the afternoon to the evening. In the weak ISM months, the precipitation is smaller than that in normal ISM months for most of the day and is greater during nighttime with maximum precipitation at 21LT. The PCR precipitation is mainly affected by water vapor transport across B10, primarily driven by mid-latitude westerlies. Both the meridional and zonal water vapor flux across B10 show increasing tendencies from 15LT to 17LT, contributing to the increased PCR precipitation. The meridional water vapor transport across B8 increases during the afternoon. Part of the water vapor can also be transported meridionally to PCR via B8.
Although both mid-latitude westerlies and ISM can carry water vapor to the TP direction in strong ISM months, the water vapor that is efficiently transported into the TP is less in strong ISM months than in weak ISM months, which agrees with the study of Sugimoto et al. (2008) [11]. When the ISM is strong, there is a cyclonic circulation with a low-pressure area over northern India. It will change the moisture transportation direction from the southwest to the southeast. The southeasterly air flows converge with the enhanced northwesterly flows in the north of India, causing a large amount of precipitation. A lot of water vapor could be consumed by these precipitation events before it reaches the TP. For the weak ISM months, water vapor can be transported by the enhanced northwest flows from the Arabian Sea and reach the TP more efficiently. Therefore, a large amount of water vapor can be transported to the TP in weak ISM months.
It is noticed that less water vapor is transported to PCR, but the precipitation is greater in strong ISM months. One possible reason for this is that PCR locates in the mid-western region of TP, where the precipitation recycling ratio (PRR) is relatively high. The PRR is the local evaporation that contributes to the local precipitation [63]. The higher PRR value represents a greater contribution of local moisture to local precipitation. Since precipitation in PCR is greater than the TP in other regions in both the strong and weak ISM months, precipitation in PCR may not depend much on external water vapor transport. Zhang et al. (2017) also found that the estimated PRR increased at a rate of 1.4% decade−1 with the precipitation increased in the mid-western TP [64].
In the procedure of the study, some issues still deserve further analysis. For example, further analyses could quantify the water vapor entered from the southern boundary and transported to the PCR, figure out the factors that influence PCR precipitation besides external water vapor transport, and take into account the influence of the dynamic process such as the Tibetan Plateau vortex (TPV) with converging updrafts [65,66].
In future work, more detailed cloud characteristics (e.g., cloud macro- and micro- physical features) can be investigated to understand the mechanism of the ISM affecting the TP cloud and precipitation processes. In addition, other areas of the TP could be selected as study areas to investigate the impacts of the water vapor transported across the southern boundary on precipitation in different regions of the TP.
Author Contributions
Conceptualization, J.C.; methodology, J.C.; software, K.Y.; formal analysis, T.L.; investigation, T.L.; data curation, T.L., K.Y. and Z.G.; writing—original draft preparation, T.L.; writing—review and editing, J.C. and L.D. All authors have read and agreed to the published version of the manuscript.
Funding
This research was funded by the Second Tibetan Plateau Scientific Expedition and Research (STEP) program (Grant No. 2019QZKK0105), and National Science Foundation of China (Grant Nos. 42075067, and 42075068).
Institutional Review Board Statement
Not applicable.
Informed Consent Statement
Not applicable.
Data Availability Statement
The ERA5 reanalysis data is downloaded from the Copernicus Climate Data Store (https://climate.copernicus.eu/climate-reanalysis) (accessed on 18 March 2022) and the hourly CMORPH precipitation product is downloaded from National Meteorological Information Center (http://data.cma.cn/) (accessed on 18 September 2021). The IMI can be freely accessed from the Monsoon Monitoring Page (http://apdrc.soest.hawaii.edu/projects/monsoon/seasonal-monidx.html) (accessed on 20 April 2022).
Conflicts of Interest
The authors declare no conflict of interest.
References
- Xu, X.; Lu, C.; Shi, X.; Gao, S. World Water Tower: An Atmospheric Perspective. Geophys. Res. Lett. 2008, 35, L20815. [Google Scholar] [CrossRef]
- Qiu, J. The Third Pole. Nature 2008, 454, 393–396. [Google Scholar] [CrossRef] [PubMed]
- Yao, T.D.; Thompson, L.; Yang, W.; Yu, W.S.; Gao, Y.; Guo, X.J.; Yang, X.X.; Duan, K.Q.; Zhao, H.B.; Xu, B.Q.; et al. Different glacier status with atmospheric circulations in Tibetan Plateau and surroundings. Nat. Clim. Chang. 2012, 2, 663–667. [Google Scholar] [CrossRef]
- Li, Y.; Liao, J.; Guo, H.; Liu, Z.; Shen, G. Patterns and Potential Drivers of Dramatic Changes in Tibetan Lakes, 1972–2010. PLoS ONE 2014, 9, e111890. [Google Scholar] [CrossRef] [PubMed]
- Zhao, L.; Zou, D.; Hu, G.; Du, E.; Pang, Q.; Xiao, Y.; Li, R.; Sheng, Y.; Wu, X.; Sun, Z.; et al. Changing climate and the permafrost environment on the Qinghai–Tibet (Xizang) plateau. Permafr. Periglac. Process. 2020, 31, 396–405. [Google Scholar] [CrossRef]
- Li, S.-L.; Yue, F.-J.; Liu, C.-Q.; Ding, H.; Zhao, Z.-Q.; Li, X. The O and H isotope characteristics of water from major rivers in China. Chin. J. Geochem. 2014, 34, 28–37. [Google Scholar] [CrossRef]
- Bothe, O.; Fraedrich, K.; Zhu, X. Tibetan Plateau summer precipitation: Covariability with circulation indices. Theor. Appl. Climatol. 2011, 108, 293–300. [Google Scholar] [CrossRef]
- Chen, B.; Xu, X.D.; Yang, S.; Zhao, T.L. Climatological Perspectives of Air Transport from Atmospheric Boundary Layer to Tropopause Layer over Asian Monsoon Regions during Boreal Summer Inferred from Lagrangian Approach. Atmos. Chem. Phys. 2012, 12, 5827–5839. [Google Scholar] [CrossRef]
- Gao, Y.; Cuo, L.; Zhang, Y. Changes in Moisture Flux over the Tibetan Plateau during 1979–2011 and Possible Mechanisms. J. Clim. 2014, 27, 1876–1893. [Google Scholar] [CrossRef]
- Hua, L.; Zhong, L.; Ke, Z. Characteristics of the Precipitation Recycling Ratio and Its Relationship with Regional Precipitation in China. Theor. Appl. Climatol. 2017, 127, 513–531. [Google Scholar] [CrossRef]
- Sugimoto, S.; Ueno, K.; Sha, W. Transportation of Water Vapor into the Tibetan Plateau in the Case of a Passing Synoptic-Scale Trough. J. Meteorol. Soc. Jpn. Ser. II 2008, 86, 935–949. [Google Scholar] [CrossRef]
- Sun, C.; Xu, X.; Zhao, T.; Yao, T.; Zhang, D.; Wang, N.; Ma, Y.; Ma, W.; Chen, B.; Zhang, S.; et al. Distinct impacts of vapor transport from the tropical oceans on the regional glacier retreat over the Qinghai-Tibet Plateau. Sci. Total Environ. 2022, 823, 153545. [Google Scholar] [CrossRef] [PubMed]
- Xu, K.; Zhong, L.; Ma, Y.; Zou, M.; Huang, Z. A Study on the Water Vapor Transport Trend and Water Vapor Source of the Tibetan Plateau. Theor. Appl. Climatol. 2020, 140, 1031–1042. [Google Scholar] [CrossRef]
- Yu, J.; Li, Q.; Ding, Y.; Zhang, J.; Wu, Q.; Shen, X. Long-Term Trend of Water Vapor over the Tibetan Plateau in Boreal Summer under Global Warming. Sci. China Earth Sci. 2022, 65, 662–674. [Google Scholar] [CrossRef]
- Zhou, C.; Zhao, P.; Chen, J. The Interdecadal Change of Summer Water Vapor over the Tibetan Plateau and Associated Mechanisms. J. Clim. 2019, 32, 4103–4119. [Google Scholar] [CrossRef]
- Wang, Z.; Duan, A.; Yang, S.; Ullah, K. Atmospheric moisture budget and its regulation on the variability of summer precipitation over the Tibetan Plateau. J. Geophys. Res. Atmos. 2017, 122, 614–630. [Google Scholar] [CrossRef]
- Li, Y.; Su, F.; Chen, D.; Tang, Q. Atmospheric Water Transport to the Endorheic Tibetan Plateau and Its Effect on the Hydrological Status in the Region. J. Geophys. Res. Atmos. 2019, 124, 12864–12881. [Google Scholar] [CrossRef]
- Vaid, B.H.; Kripalani, R.H. Strikingly Contrasting Indian Monsoon Progressions during 2013 and 2014: Role of Western Tibetan Plateau and the South China Sea. Theor. Appl. Climatol. 2021, 144, 1131–1140. [Google Scholar] [CrossRef]
- An, Z.; Colman, S.M.; Zhou, W.; Li, X.; Brown, E.T.; Jull, A.J.T.; Cai, Y.; Huang, Y.; Lu, X.; Chang, H.; et al. Interplay between the Westerlies and Asian monsoon recorded in Lake Qinghai sediments since 32 ka. Sci. Rep. 2012, 2, 619. [Google Scholar] [CrossRef]
- Liu, W.; Wang, L.; Chen, D.; Tu, K.; Ruan, C.; Hu, Z. Large-Scale Circulation Classification and Its Links to Observed Precipitation in the Eastern and Central Tibetan Plateau. Clim. Dyn. 2016, 46, 3481–3497. [Google Scholar] [CrossRef]
- Webster, P.J.; Magaña, V.O.; Palmer, T.; Shukla, J.; Tomas, R.A.; Yanai, M.; Yasunari, T. Monsoons: Processes, predictability, and the prospects for prediction. J. Geophys. Res. Oceans 1998, 103, 14451–14510. [Google Scholar] [CrossRef]
- Yao, T.; Masson-Delmotte, V.; Gao, J.; Yu, W.; Yang, X.; Risi, C.; Sturm, C.; Werner, M.; Zhao, H.; He, Y.; et al. A review of climatic controls on δ18O in precipitation over the Tibetan Plateau: Observations and simulations. Rev. Geophys. 2013, 51, 525–548. [Google Scholar] [CrossRef]
- Feng, L.; Zhou, T. Water vapor transport for summer precipitation over the Tibetan Plateau: Multidata set analysis. J. Geophys. Res. Atmos. 2012, 117, D20114. [Google Scholar] [CrossRef]
- Simmonds, I.; Bi, D.; Hope, P. Atmospheric Water Vapor Flux and Its Association with Rainfall over China in Summer. J. Clim. 1999, 12, 1353–1367. [Google Scholar] [CrossRef]
- Zhu, L.; Lü, X.; Wang, J.; Peng, P.; Kasper, T.; Daut, G.; Haberzettl, T.; Frenzel, P.; Li, Q.; Yang, R.; et al. Climate change on the Tibetan Plateau in response to shifting atmospheric circulation since the LGM. Sci. Rep. 2015, 5, 13318. [Google Scholar] [CrossRef] [PubMed]
- Lin, H.; You, Q.; Zhang, Y.; Jiao, Y.; Fraedrich, K. Impact of Large-Scale Circulation on the Water Vapour Balance of the Tibetan Plateau in Summer. Int. J. Climatol. 2016, 36, 4213–4221. [Google Scholar] [CrossRef]
- Lu, C.; Yu, G.; Xie, G. Tibetan Plateau Serves as a Water Tower. Int. Geosci. Remote Sens. Symp. 2005, 5, 3120–3123. [Google Scholar] [CrossRef]
- Xu, X.; Lu, C.; Shi, X.; Ding, Y. Large-Scale Topography of China: A Factor for the Seasonal Progression of the Meiyu Rainband? J. Geophys. Res. 2010, 115, D02110. [Google Scholar] [CrossRef]
- Wang, Z.; Duan, A.; Wu, G.; Yang, S. Mechanism for Occurrence of Precipitation over the Southern Slope of the Tibetan Plateau without Local Surface Heating. Int. J. Climatol. 2016, 36, 4164–4171. [Google Scholar] [CrossRef]
- Wu, G.; Liu, Y.; Zhang, Q.; Duan, A.; Wang, T.; Wan, R.; Liu, X.; Li, W.; Wang, Z.; Liang, X. The Influence of Mechanical and Thermal Forcing by the Tibetan Plateau on Asian Climate. J. Hydrometeorol. 2007, 8, 770–789. [Google Scholar] [CrossRef]
- Xu, X.; Zhao, T.; Lu, C.; Guo, Y.; Chen, B.; Liu, R.; Li, Y.; Shi, X. An Important Mechanism Sustaining the Atmospheric “Water Tower” over the Tibetan Plateau. Atmos. Chem. Phys. 2014, 14, 11287–11295. [Google Scholar] [CrossRef]
- Xu, X.; Miao, Q.; Wang, J.; Zhang, X. The Water Vapor Transport Model at the Regional Boundary during the Meiyu Period. Adv. Atmos. Sci. 2003, 20, 333–342. [Google Scholar] [CrossRef]
- Dong, W.; Lin, Y.; Wright, J.S.; Ming, Y.; Xie, Y.; Wang, B.; Luo, Y.; Huang, W.; Huang, J.; Wang, L.; et al. Summer rainfall over the southwestern Tibetan Plateau controlled by deep convection over the Indian subcontinent. Nat. Commun. 2016, 7, 10925. [Google Scholar] [CrossRef] [PubMed]
- Zhang, C.; Tang, Q.; Chen, D.; Van Der Ent, R.J.; Liu, X.; Li, W.; Haile, G.G. Moisture Source Changes Contributed to Different Precipitation Changes over the Northern and Southern Tibetan Plateau. J. Hydrometeorol. 2019, 20, 217–229. [Google Scholar] [CrossRef]
- Kukulies, J.; Chen, D.; Wang, M. Temporal and Spatial Variations of Convection, Clouds and Precipitation over the Tibetan Plateau from Recent Satellite Observations. Part II: Precipitation Climatology Derived from Global Precipitation Measurement Mission. Int. J. Climatol. 2020, 40, 4858–4875. [Google Scholar] [CrossRef]
- Hu, L.; Yang, S.; Li, Y.; Gao, S. Diurnal Variability of Precipitation Depth over the Tibetan Plateau and Its Surrounding Regions. Adv. Atmos. Sci. 2010, 27, 115–122. [Google Scholar] [CrossRef]
- Xu, W.; Zipser, E.J. Diurnal Variations of Precipitation, Deep Convection, and Lightning over and East of the Eastern Tibetan Plateau. J. Clim. 2011, 24, 448–465. [Google Scholar] [CrossRef]
- Xinghua, B.; Fuqing, Z.; Sun, J. Diurnal Variations of Warm-Season Precipitation East of the Tibetan Plateau over China Xinghua. Mon. Weather Rev. 2011, 139, 2790–2810. [Google Scholar]
- Chen, J.; Wu, X.; Yin, Y.; Lu, C. Large-Scale Circulation Environment and Microphysical Characteristics of the Cloud Systems Over the Tibetan Plateau in Boreal Summer. Adv. Earth Sp. Sci. 2020, 7, e2020EA001154. [Google Scholar] [CrossRef]
- Chen, J.; Wu, X.; Lu, C.; Yin, Y.; Al, C.E.T. Seasonal and Diurnal Variations of Cloud Systems over the Eastern Tibetan Plateau and East China: A Cloud-Resolving Model Study. Adv. Atmos. Sci. 2022, 39, 1034–1049. [Google Scholar] [CrossRef]
- Hoffmann, L.; Günther, G.; Li, D.; Stein, O.; Wu, X.; Griessbach, S.; Heng, Y.; Konopka, P.; Müller, R.; Vogel, B.; et al. From ERA-Interim to ERA5: The considerable impact of ECMWF’s next-generation reanalysis on Lagrangian transport simulations. Atmos. Chem. Phys. 2019, 19, 3097–3124. [Google Scholar] [CrossRef]
- Laurila, T.K.; Sinclair, V.A.; Gregow, H. Climatology, variability, and trends in near-surface wind speeds over the North Atlantic and Europe during 1979–2018 based on ERA5. Int. J. Climatol. 2021, 41, 2253–2278. [Google Scholar] [CrossRef]
- Jiang, Y.; Yang, K.; Shao, C.; Zhou, X.; Zhao, L.; Chen, Y.; Wu, H. A Downscaling Approach for Constructing High-Resolution Precipitation Dataset over the Tibetan Plateau from ERA5 Reanalysis. Atmos. Res. 2021, 256, 105574. [Google Scholar] [CrossRef]
- Slättberg, N.; Lai, H.; Chen, X.; Ma, Y.; Chen, D. Spatial and Temporal Patterns of Planetary Boundary Layer Height during 1979–2018 over the Tibetan Plateau Using ERA5. Int. J. Climatol. 2022, 42, 3360–3377. [Google Scholar] [CrossRef]
- Zhao, Y.; Zhou, T. Asian Water Tower Evinced in Total Column Water Vapor: A Comparison among Multiple Satellite and Reanalysis Data Sets. Clim. Dyn. 2020, 54, 231–245. [Google Scholar] [CrossRef]
- Hersbach, H.; Bell, B.; Berrisford, P.; Hirahara, S.; Horanyi, A.; Muñoz-Sabater, J.; Nicolas, J.; Peubey, C.; Radu, R.; Schepers, D.; et al. The ERA5 global reanalysis. Q. J. R. Meteorol. Soc. 2020, 146, 1999–2049. [Google Scholar] [CrossRef]
- Shen, Y.; Zhao, P.; Pan, Y.; Yu, J. A high spatiotemporal gauge-satellite merged precipitation analysis over China. J. Geophys. Res. Atmos. 2014, 119, 3063–3075. [Google Scholar] [CrossRef]
- Pan, Y.; Shen, Y.; Yu, J.J.; Zhao, P. Analysis of the Combined Gauge-Satellite Hourly Precipitation over China Based on the OI Technique. Acta Meteor. Sin. 2012, 70, 1381–1389. [Google Scholar]
- Liu, Y.; Chen, H.; Zhang, G.; Sun, J.; Wang, H. The advanced South Asian monsoon onset accelerates lake expansion over the Tibetan Plateau. Sci. Bull. 2019, 64, 1486–1489. [Google Scholar] [CrossRef]
- Wang, B.; Fan, Z. Choice of South Asian Summer Monsoon Indices. Bull. Am. Meteorol. Soc. 1999, 80, 629–638. [Google Scholar] [CrossRef]
- Wang, B.; Wu, R.; Lau, K.M. Interannual Variability of the Asian Summer Monsoon: Contrasts between the Indian and the Western North Pacific-East Asian Monsoons. J. Clim. 2001, 14, 4073–4090. [Google Scholar] [CrossRef]
- Sousa, P.M.; Ramos, A.M.; Raible, C.C.; Messmer, M.; Tomé, R.; Pinto, J.G.; Trigo, R.M. North Atlantic Integrated Water Vapor Transport—From 850 to 2100 CE: Impacts on Western European Rainfall. J. Clim. 2020, 33, 263–279. [Google Scholar] [CrossRef]
- Chen, B.; Xu, X.-D.; Yang, S.; Zhang, W. On the origin and destination of atmospheric moisture and air mass over the Tibetan Plateau. Theor. Appl. Clim. 2012, 110, 423–435. [Google Scholar] [CrossRef]
- Sun, L.; Yang, Y.; Fu, Y.; Zhang, X.; Zhong, L.; Zhao, C.; Ma, M. Summertime Atmospheric Water Vapor Transport between Tibetan Plateau and Its Surrounding Regions during 1990–2019: Boundary Discrepancy and Interannual Variation. Atmos. Res. 2022, 275, 106237. [Google Scholar] [CrossRef]
- Xu, X.; Tian, H.; Qie, K.; He, X.; Zhang, R.; Tu, H. A Study on the Trend of the Upper Tropospheric Water Vapor over the Tibetan Plateau in Summer. Asia-Pac. J. Atmos. Sci. 2021, 57, 277–288. [Google Scholar] [CrossRef]
- Zhang, P.; Liu, Y.; He, B. Impact of East Asian Summer Monsoon Heating on the Interannual Variation of the South Asian High. J. Clim. 2016, 29, 159–173. [Google Scholar] [CrossRef]
- Li, J.; Jin, L.; Li, J.; Zheng, Z.; Yan, Z. Variation in the Positioning of the Asian Summer Monsoon Boundary in the Tibetan Plateau and Potential Drivers. Adv. Meteorol. 2022, 2022, 7206137. [Google Scholar] [CrossRef]
- Lin, C.; Chen, D.; Yang, K.; Ou, T. Impact of Model Resolution on Simulating the Water Vapor Transport through the Central Himalayas: Implication for Models’ Wet Bias over the Tibetan Plateau. Clim. Dyn. 2018, 51, 3195–3207. [Google Scholar] [CrossRef]
- Sun, J.; Yang, K.; Guo, W.; Wang, Y.; He, J.; Lu, H. Why Has the Inner Tibetan Plateau Become Wetter since the Mid-1990s? J. Clim. 2020, 33, 8507–8522. [Google Scholar] [CrossRef]
- Barros, A.P.; Joshi, M.; Putkonen, J.; Burbank, D.W. A study of the 1999 monsoon rainfall in a mountainous region in central Nepal using TRMM products and rain gauge observations. Geophys. Res. Lett. 2000, 27, 3683–3686. [Google Scholar] [CrossRef]
- Ohasawa, T.; Ueda, H.; Hayashi, T.; Watanabe, A. Diurnal Variations of Convec- Tive Activity and Rainfall in Tropical Asia. J. Meteorol. Soc. Jpn. 2001, 79, 333–352. [Google Scholar] [CrossRef]
- Barros, A.P.; Lang, T.J. Monitoring the Monsoon in the Himalayas: Observations in Central Nepal, June 2001. Mon. Weather Rev. 2003, 131, 1408–1427. [Google Scholar] [CrossRef]
- Dirmeyer, P.A.; Brubaker, K.L. Characterization of the Global Hydrologic Cycle from a Back-Trajectory Analysis of Atmospheric Water Vapor. J. Hydrometeorol. 2007, 8, 20–37. [Google Scholar] [CrossRef]
- Zhang, C.; Tang, Q.; Chen, D. Recent Changes in the Moisture Source of Precipitation over the Tibetan Plateau. J. Clim. 2017, 30, 1807–1819. [Google Scholar] [CrossRef]
- Yuan, G.; Yao, X. Impact of Dynamic and Thermal Forcing on the Intensity Evolution of the Vortices over the Tibetan Plateau in Boreal Summer. J. Trop. Meteorol. 2020, 26, 239–252. [Google Scholar] [CrossRef]
- Li, L.; Zhang, R.; Wen, M.; Duan, J.; Qi, Y. Characteristics of the Tibetan Plateau Vortices and the Related Large-Scale Circulations Causing Different Precipitation Intensity. Theor. Appl. Climatol. 2019, 138, 849–860. [Google Scholar] [CrossRef]
Disclaimer/Publisher’s Note: The statements, opinions and data contained in all publications are solely those of the individual author(s) and contributor(s) and not of MDPI and/or the editor(s). MDPI and/or the editor(s) disclaim responsibility for any injury to people or property resulting from any ideas, methods, instructions or products referred to in the content. |
© 2022 by the authors. Licensee MDPI, Basel, Switzerland. This article is an open access article distributed under the terms and conditions of the Creative Commons Attribution (CC BY) license (https://creativecommons.org/licenses/by/4.0/).