Communication

Impact of Thermal Forcing over the Southeast of the Tibetan Plateau on Frequency of Tropical Cyclones Affecting Guangxi during Boreal Summer

Climate Center, Guangxi Meteorological Bureau, Nanning 530022, China
*
Author to whom correspondence should be addressed.
Atmosphere 2023, 14(1), 18; https://doi.org/10.3390/atmos14010018
Submission received: 21 November 2022 / Revised: 20 December 2022 / Accepted: 20 December 2022 / Published: 22 December 2022
(This article belongs to the Special Issue Advances in Tropical Cyclone Climate Research)

Abstract

:
Tropical cyclones entering coastal areas adversely affect southern China. However, changes in the frequency of tropical cyclones affecting the west of southern China remain unclear. Our study reveals the possible impact of the thermal forcing anomaly over the southeast Tibetan Plateau (TP) on the frequency of tropical cyclones affecting Guangxi formed within the west of 120° E during boreal summer. Further analysis indicates that the cooling over the southeast TP is accompanied by local descending motions over southeastern TP and compensating ascending motions over eastern Indochina Peninsula and results in a reduced 850–200 hPa vertical wind shear over the north of 15° N in South China Sea (SCS), which is conducive to the westward development of tropical cyclones and favorable conditions for the formation of TCs affecting Guangxi over the SCS. Finally, the results from a linear baroclinic model experiment also verify that the changes in the 850–200 hPa vertical wind shear over southern SCS and compensating vertical motions over eastern Indochina Peninsula are associated with the thermal forcing anomaly over the southeast TP. Our results imply that in summer the thermal forcing anomaly over TP should be emphasized when interpreting and predicting the frequency of tropical cyclones affecting local areas in southern China.

1. Introduction

Tropical cyclones with violent storms often lead to massive economic losses and several fatalities in coastal areas [1,2,3,4]. Previous studies have suggested that landfalling tropical cyclones in southern China are generated over the Philippine Sea and the South China Sea (SCS) and then gradually move northwest toward the southern coast. These tropical cyclones can be tracked along the southwestern edge of the western North Pacific subtropical high [5,6,7]. In particular, the frequency of landfalling typhoons in southern China has increased since the year 2000 [8,9,10]. Tropical cyclones such as Haiyan (in 2013), Rammasun (in 2014), and Mangkhut (in 2018) have caused tremendous damages in southern China [11,12,13]. In addition to the intensity and track of tropical cyclones, the spatial distribution of the population is also an important factor in exposing people to the hazardous tropical cyclones events. In recent years, the total population has increased dramatically in the coastal areas of China [14]. Guangxi Zhuang Autonomous Region is located in the western part of southern China (Figure 1a). It covers an area of 237,600 square kilometers and has a coastline of 1628 km. The region has a population of about 50,000,000 (http://www.gov.cn/guoqing/, accessed on 1 November 2022). Based on the information diffusion method, under the three risk levels (returning period = 10, 20, 30 years), annual TC-related direct economic losses in Guangxi are shown at especially serious degrees [15]. According to TC disaster data from China Meteorological Administration during 1984–2017, Guangxi is one of the three regions with the most serious annual average economic loss caused by TCs in China [16]. It is worth mentioning that Rammasun (in 2014) caused a direct economic loss of 261.63 million US dollars in Guangxi [17]. More than 3.4 million people have been affected (https://v.gxnews.com.cn/a/10771610, accessed on 1 November 2022).
Compared with the tracks of tropical cyclones affecting the eastern part of southern China, the tracks of tropical cyclones affecting Guangxi is more westward. Since the tropical cyclones affecting Guangxi moved northwestward from the western North Pacific, the track density of these tropical cyclones has become the most concentrated on the Leizhou Peninsula (Figure 1b). Considering the need of local disaster prevention work and the specificity of tracks of tropical cyclones affecting Guangxi (hereafter, referred to as Guangxi TCs), it is important to study the tropical cyclone activities in Guangxi both scientifically and socially. The findings of such a study will help to better improve the refined understanding of the characteristics of the northwestward migration of tropical cyclones over the western North Pacific and formulate localized defense strategies to manage such natural disasters.
The Tibetan Plateau (TP) is the largest and highest plateau of the world and is also known as the world’s third pole [18,19]. The TP is located in the subtropical Eurasian continent and to the northwest of Guangxi. Compared to the extremely steep Himalayas, the elevation of TP gradually decreases along the Hengduan Mountains toward western China and Indochina Peninsula. Correspondingly, the elevation of Guangxi gradually decreases from the northwest to the southern coastal areas (Figure 1a). With respect to climate states, the snowpack in the eastern TP almost melts away in summer, while the western TP (e.g., some high elevation areas) is covered with year-round snow [20,21]. Thus, the summertime atmospheric heat source is dominated by latent heat over the eastern TP and is dominated by sensible heat over the western TP [22,23]. In addition, the atmospheric heat source mainly comprises interannual variations of latent heating [24]. Latent heating (rainfall) in summer over eastern TP has significant impacts on the surrounding weather and climate [25,26,27,28]. Jiang et al. [26] showed that latent heating over the southeastern TP excites descending motion over the northern Indian subcontinent. The study also reported that the latent heating reduces water vapor transport into the northern Indian subcontinent from the southern Arabian Sea, suppressing rainfall over the northern Indian subcontinent. Wang et al. [27] also pointed out that positive heating over southern TP can lead to below-normal monsoon rainfall in Pakistan. In addition to the impact of thermal forcing over TP on South Asia, the southern TP heating generates a Rossby wave train that propagates northeastward from the southern TP to East Asia, resulting in anomalous rainfall over East China [28]. However, whether latent heating over TP modulates the activity of Guangxi TCs has not yet been investigated. Hence, the present study will provide insights into the relationship between thermal forcing over the southeast of the TP and the frequency of tropical cyclones (FTC) affecting Guangxi.
This study is organized as follows. Section 2 briefly describes the data and methods. Section 3 presents the relationship between thermal forcing over the southeast of the TP and the FTC affecting Guangxi. The possible potential mechanism is also examined in this section. Section 4 presents the conclusions and discussion of this research work.

2. Materials and Methods

In this work, we use monthly mean reanalysis data with a 2.5° × 2.5° resolution from the National Centers for Environmental Prediction (NCEP) and National Center for Atmospheric Research (NCAR) for the period of 1979–2019 [29]. The meteorological fields include horizontal winds, geopotential height (GH), and omega. The monthly mean rainfall data with a 1° × 1° resolution was procured from the Precipitation Reconstruction over Land (PREC/L). Monthly interpolated outgoing longwave radiation (OLR) data with a 2.5° × 2.5° resolution was obtained from the National Oceanic and Atmospheric Administration (NOAA) [30]. The TC best-track data [31], including the intensity and location with a 6-h interval during 1979–2019, were obtained from the Shanghai Typhoon Institute of the China Meteorological Administration. According to Guangxi standards information in operation service (https://dbba.sacinfo.org.cn/stdDetail/4d8d346db9311499f4c3dd7758ca6c042655f5daf0a493140a1f4a48482c17ca, accessed on 1 November 2022. If you cannot access the website, please contact the corresponding author) and previous work [17], tropical cyclones (including all tropical cyclones recorded in this dataset) affecting Guangxi are defined as tropical cyclones entering the red box in Figure 1a (19° N–28° N, 104° E–112° E). The FTC affecting Guangxi index indicates the number of Guangxi TCs in each summer. The big FTC affecting Guangxi index corresponds to the active Guangxi TCs years and vice versa.
According to a previous work [6], steering flow (SF) is represented by the pressure-weighted wind averaged from 850 hPa to 300 hPa. The Diabatic heating (Q1) is calculated based on the thermodynamic equation [32].
Q 1 C p = T t + V · T + ( P P 0 ) R C p ω θ p
In Equation (1), the four terms from left-hand to right-hand are diabatic heating, local temperature variation, horizontal temperature advection, and vertical temperature advection, respectively. Q1 is the apparent heat source and C p is the specific heat of dry air at constant pressure; T is air temperature; V is the horizontal velocity; P and P 0 are the pressure and surface pressure, respectively; ω is the vertical pressure velocity; R is the gas constant; θ is the potential temperature.
Following a previous study [33], an improved dynamic GPI (DGPI) is used to represent the interannual variations of TC by dynamic environmental factors. The DGPI is calculated as follows:
DGPI = ( 2 + 0.1 V s ) 1.7 ( 5.5 U y 500 10 5 ) 2.3 ( 5 20 ω 500 ) 3.3 ( 5.5 + | 10 5 Vor 850 | ) 2.4 e 11.8 1
where V s is the magnitude of the vertical wind shear between 850 hPa and 200 hPa, U y 500 is the meridional gradient of zonal wind at 500 hPa, ω 500 is the vertical velocity in P-Coordinate at 500 hPa, Vor 850 is the absolute vorticity at 850 hPa, and e is the natural logarithm.
In the present study, the linear baroclinic model (LBM) is used to simulate the atmospheric response to the thermal forcing anomaly over the southeast of the TP. This model is developed by the Center for Climate System Research, University of Tokyo [34]. The model is horizontally discretized by spherical harmonics having a resolution of T42 and vertically represented 20 σ levels. The climatological varying basic state for this model is taken from the NCEP-NCAR reanalysis during 1979–2019. The solution of the model reaches the steady state after about 15 days. Therefore, only the average of the last 10 days in the 30-day integration is applied in this study.

3. Results

3.1. Relationship between Thermal Forcing over the Southeast of the TP and the FTC Affecting Guangxi

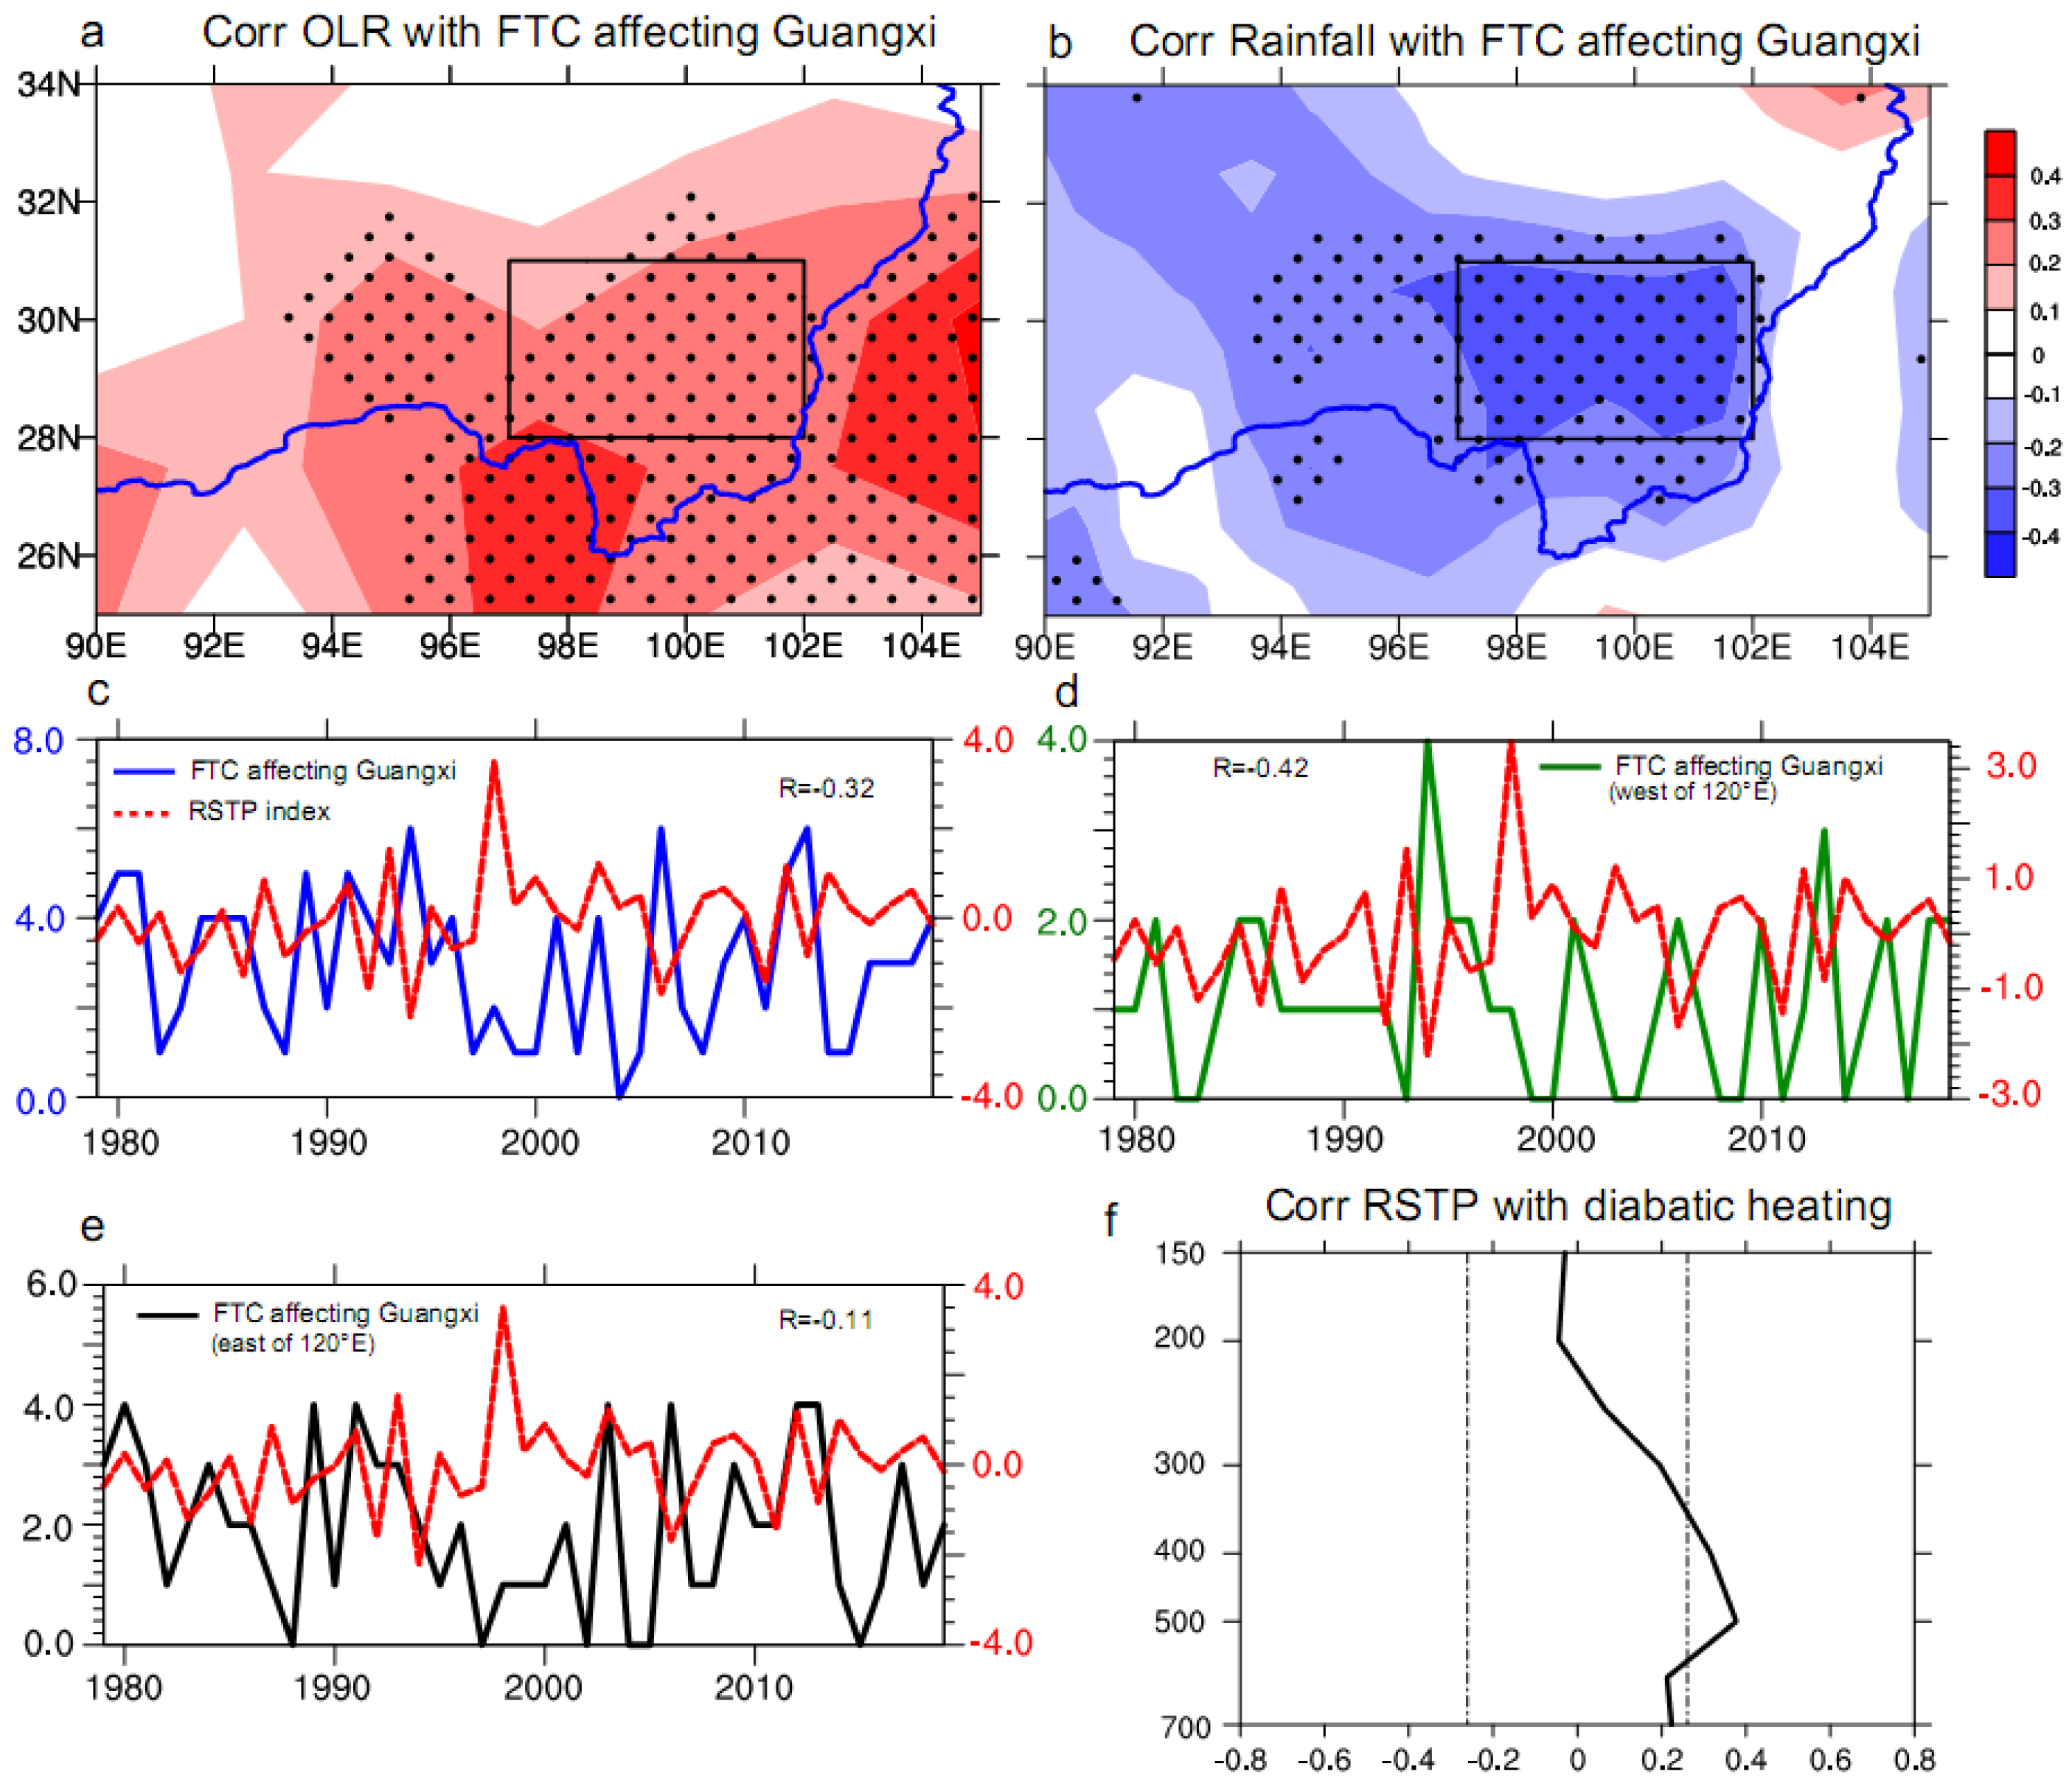
Many studies have suggested that rainfall-related atmospheric latent heating dominates the total diabatic heating over the TP in boreal summer [27,28]. Figure 2a,b show the correlations of OLR and rainfall over the southeast TP with the FTC affecting Guangxi in boreal summer for 1979–2019. As can be seen in the figure, the FTC affecting Guangxi is closely associated with the convection activities over the southeast TP. In the active Guangxi TC years, the reduced rainfall and increased OLR are centered over the southeast TP. Accordingly, we define the rainfall index over southeastern TP (RSTP), which is the summer (June to August) rainfall area averaged over the red box (28° N–31° N, 97° E–102° E), as shown in Figure 2a,b. Figure 2f shows the positive and significant correlation between interannual variability of local diabatic heating profile at the mid-troposphere and RSTP during 1979–2019. Thus, in this study, the RSTP is used as a measure of southeast TP thermal forcing. The correlation coefficient between the RSTP and the FTC affecting Guangxi is −0.32 during 1979–2019; this obtained value is significant at a 95% confidence level. The TC geneses location is the main factor determining the TC activities [35,36,37]. Here, TCs affecting the Guangxi can be divided into two types: (1) TCs formed within the west of 120° E and (2) TCs formed within the east of 120° E. TCs affecting the Guangxi formed within the west of 120° E (east of 120° E) account for about 36% (64%) of the total. Note that only the correlations between RSTP and the FTC affecting Guangxi formed within the west of 120° E remain significant (Figure 2d,e). These results imply that summer RSTP is closely linked to simultaneous FTC affecting Guangxi formed within the west of 120° E.
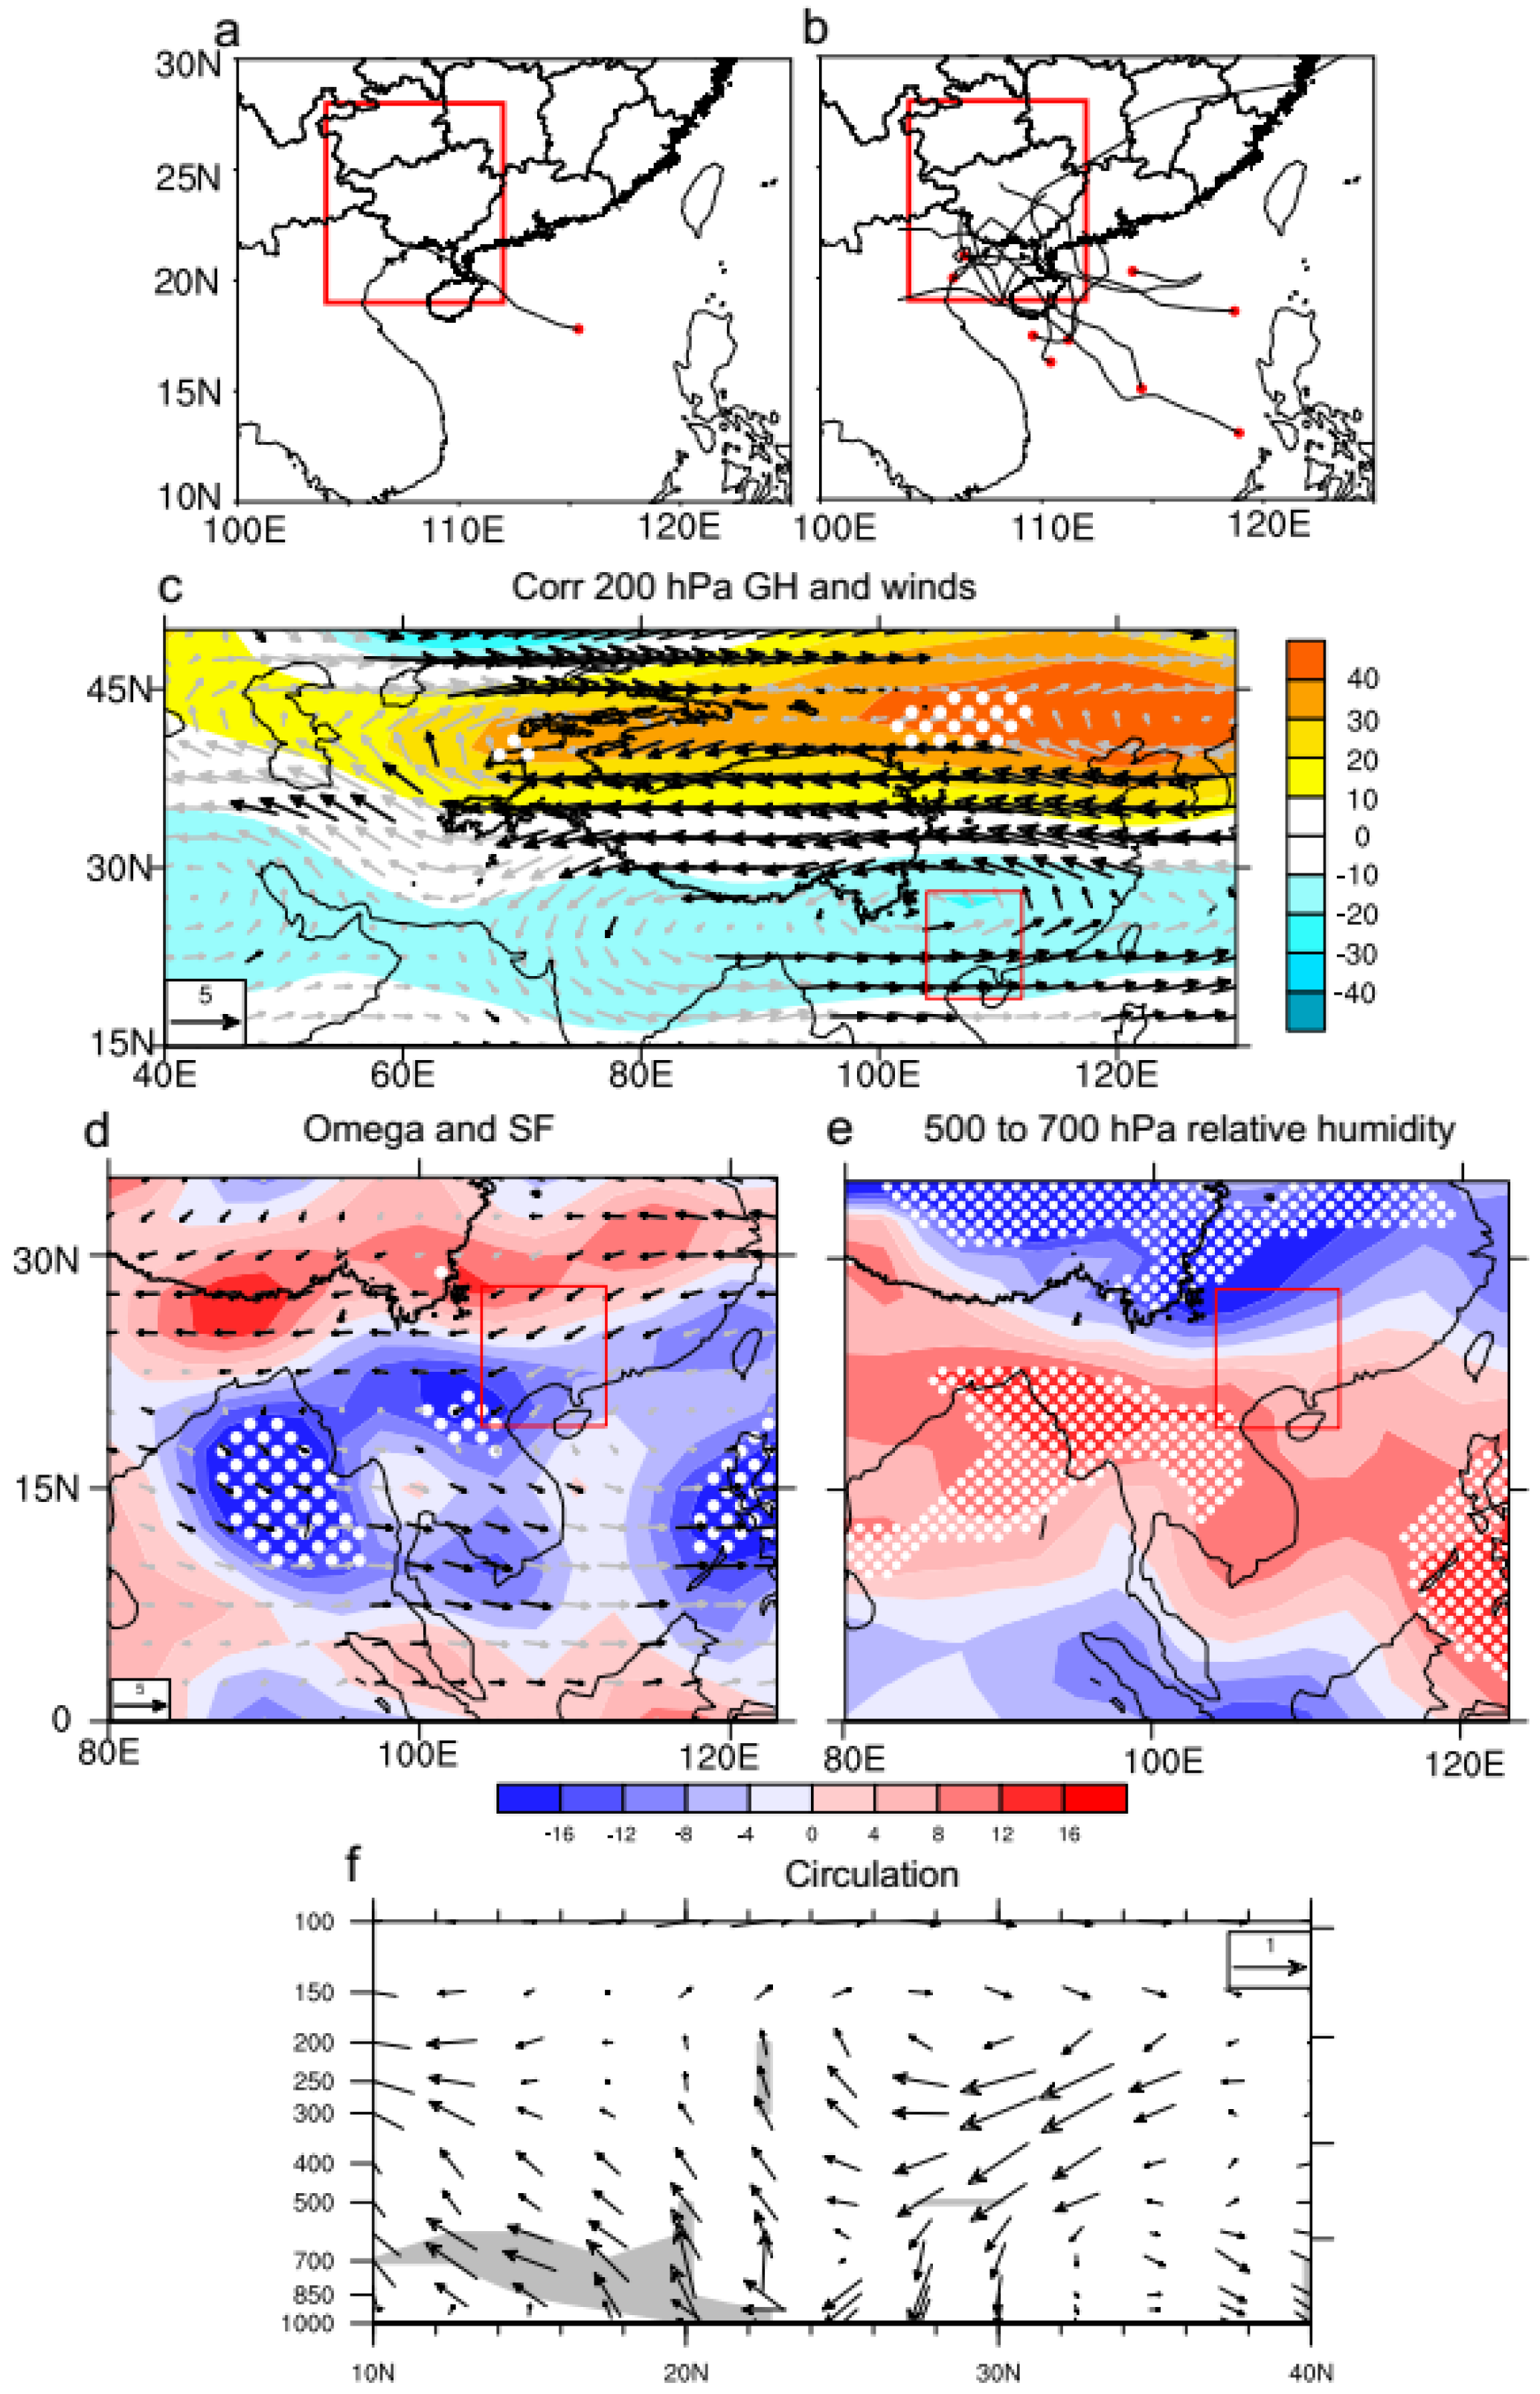
According to the values greater than +1.2 and less than −1.2 standard deviations of normalized RSTP, five negative RSTP years (1986, 1992, 1994, 2006, and 2011) and three years (1993, 1998, and 2003) are selected (Figure 3a,b). The mean frequency of FTC affecting Guangxi during the negative and positive RSTP years is 1.8 and 0.33. To investigate the role of RSTP-related large-scale flows on TC affecting Guangxi tracks, Figure 3c–e shows the composite differences in the 200 hPa GH, wind, SF, and middle troposphere omega between the negative and positive RSTP years. Figure 3c shows that a negative GH center in the upper troposphere is found over south TP, implying a weakening of the South Asian high. Correspondingly, there is anomalous cyclonic circulation over south TP, accompanied by an anomalous westerly flow over the Indian Ocean. However, a pair of anticyclonic circulations is found to the northeast and northwest of the TP. A recent study [38] pointed out that a cyclonic circulation anomaly was found in the South China Sea during the weak South Asian high years. This observation is conducive to local convective activities and enhancement tropical cyclone genesis in the South China Sea. However, strong convection has not been detected in the southern South China Sea (Figure 3d). In addition, many studies have pointed out that the steering flow anomaly pattern is the most important factor for the track of tropical cyclones and results in changes in the FTC affecting coastal areas [39,40]. The SF over the coastal areas of southern China in Figure 3d does not seem to be significantly related to the RSTP. In addition, local descending motions over southeastern TP and compensating ascending motions over eastern Indochina Peninsula around 20° N (Figure 3d,e) are also observed. This observation is in agreement with the findings of previous work [41,42]. Although the climatological negative omega center was centered from the southern Bay of Bengal to the eastern Indochina Peninsula [43], the anomalous ascending motions over eastern Indochina Peninsula leads to the eastward expansion of this convention center. On the one hand, two Guangxi TCs were generated near the coastal areas of northeast Indochina Peninsula during negative RSTP years (Figure 3b). Ren et al. [44] reported that TC best-track data (from China Meteorological Administration) usually tracks the overland portion of TCs for a longer time than other agencies. This may be the reason that the location of TC genesis is near the coastal areas. Therefore, the enhanced convection over eastern Indochina Peninsula is beneficial to the formation of Guangxi TCs. On the other hand, according to recent [45,46], the decay timescale of TC making landfall on the continent is positively linked the vertical motion and relative humidity at the mid-troposphere in coastal areas. Six Guangxi TCs entering the coastal areas of northeast Indochina Peninsula were found during negative RSTP years (Figure 3b). The enhanced convection is accompanied by the increased relative humidity at the mid-troposphere [38,47,48]. The increased relative humidity at the mid-troposphere was found over northeastern Indochina Peninsula (Figure 3e). These provide favorable conditions for the maintenance of Guangxi TCs. Such convective enhancement over the eastern Indochina Peninsula at around 20° N seems to be conducive to the westward development of tropical cyclones and affects the Guangxi region.
Additionally, the atmospheric circulation anomalies may affect the genesis of the Guangxi TCs formed within the west of 120° E. In comparison, the TCs affecting Guangxi formed within the west of 120° E are more likely to form over the north of 15° N during the negative RSTP years (Figure 3a,b). Following previous studies [6,33], TC genesis-related environmental conditions are further examined. The composite differences DGPI between the negative and positive RSTP years are shown in Figure 4a–e. Positive DGPI is located in the southern side of the SCS, which is consistent with the spatial distribution of Guangxi TC genesis in negative RSTP years (Figure 3b and Figure 4a). Four components of the DGPI (500 hPa omega, 850–200 hPa vertical wind shear, 500 hPa meridional gradient of zonal wind, and 850 hPa absolute vorticity) are further examined (Figure 4b–e). Compared with the positive RSTP years, the reduced 850–200 hPa vertical wind shear was concentrated over north of 15° N in SCS. Correspondingly, the increased 500 hPa meridional gradient of the zonal wind, increased 850 hPa absolute vorticity, and ascending motions at the midlevel near the west of the Philippines were found. Since most of Guangxi TCs formed over the north of 15° N in SCS during the negative RSTP years, the 850–200 hPa vertical wind shear contributes largely to the Guangxi TCs genesis induced by the RSTP. The above-mentioned results imply that negative southeast TP thermal forcing-related reduced 850–200 hPa vertical wind shear over the north of 15° N in SCS and convective enhancement over the eastern Indochina Peninsula provide favorable conditions for higher-than-normal Guangxi TCs formed within the west of 120° E.

3.2. Results from LBM Experiments

According to Hu and Duan [49], the southeast TP latent heating anomaly in summer occupies the main part of the local diabatic heating anomaly on an interannual scale. In the present study, the ideal cooling served as a negative heating source and was conducted to simulate the atmospheric circulation in response to the negative condensational latent heating anomaly. Figure 5c shows the ideal cooling profile with the maximum at a sigma of 0.5 to mimic local rainfall anomalies in the experiment. The horizontal structure of the heating depends on the correlation patterns of rainfall over the southeast TP with the FTC affecting Guangxi (Figure 2b). Therefore, the elliptical cooling centers related to FTC affecting Guangxi were located in 29° N, 98° W (Figure 5d,e). The minimum cooling rate was 5 K per day.
The climatological mean 850 hPa winds and 200 hPa winds in LBM are shown in Figure 5a,b. Figure 5d–f present the responses of atmospheric circulation in cooling experiments. Stronger cooling over the southeast TP can lead to weakening of the South Asian high (Figure 5d); this feature is consistent with previous studies [41,50]. An anticyclonic anomaly to the northwest of the TP can be observed as a response of cooling forcing over southeastern TP (Figure 5d). The 200 hPa southwest winds over southern SCS respond to the southeast TP cooling. These features are consistent with the observed statistical results (Figure 3c). A cyclonic anomaly exists to the northeast TP; this finding is contrary to the observations (Figure 3c). This difference may be because the simple mode simulations are limited for East Asian summer monsoon circulation at mid-latitude [28]. The responses of 850 hPa northeast winds over southern SCS to the southeast TP cooling are similar to the composite differences in 850 hPa winds between the negative and positive RSTP years (figure not shown). Compared with the climatic state, in cooling experiments, the wind speed in upper and lower troposphere are reduced, but the wind speed in the upper troposphere is weakened more (Figure 5a,b,d,e). Such responses lead to reduced 850–200 hPa vertical wind shear (Figure 4f), resulting in favorable conditions for the formation of Guangxi TCs over the SCS. Meanwhile, the southeast TP cooling also induces the ascending motion over eastern Indochina Peninsula (Figure 5e,f), favorable for higher-than-normal Guangxi TCs formed within the west of 120° E. Overall, the results from the LBM experiments demonstrated the direct impact of southeast TP thermal forcing on the summer local circulation over South Asia and mainly supported the observed statistical results as shown in Section 3.1.

4. Conclusions and Discussion

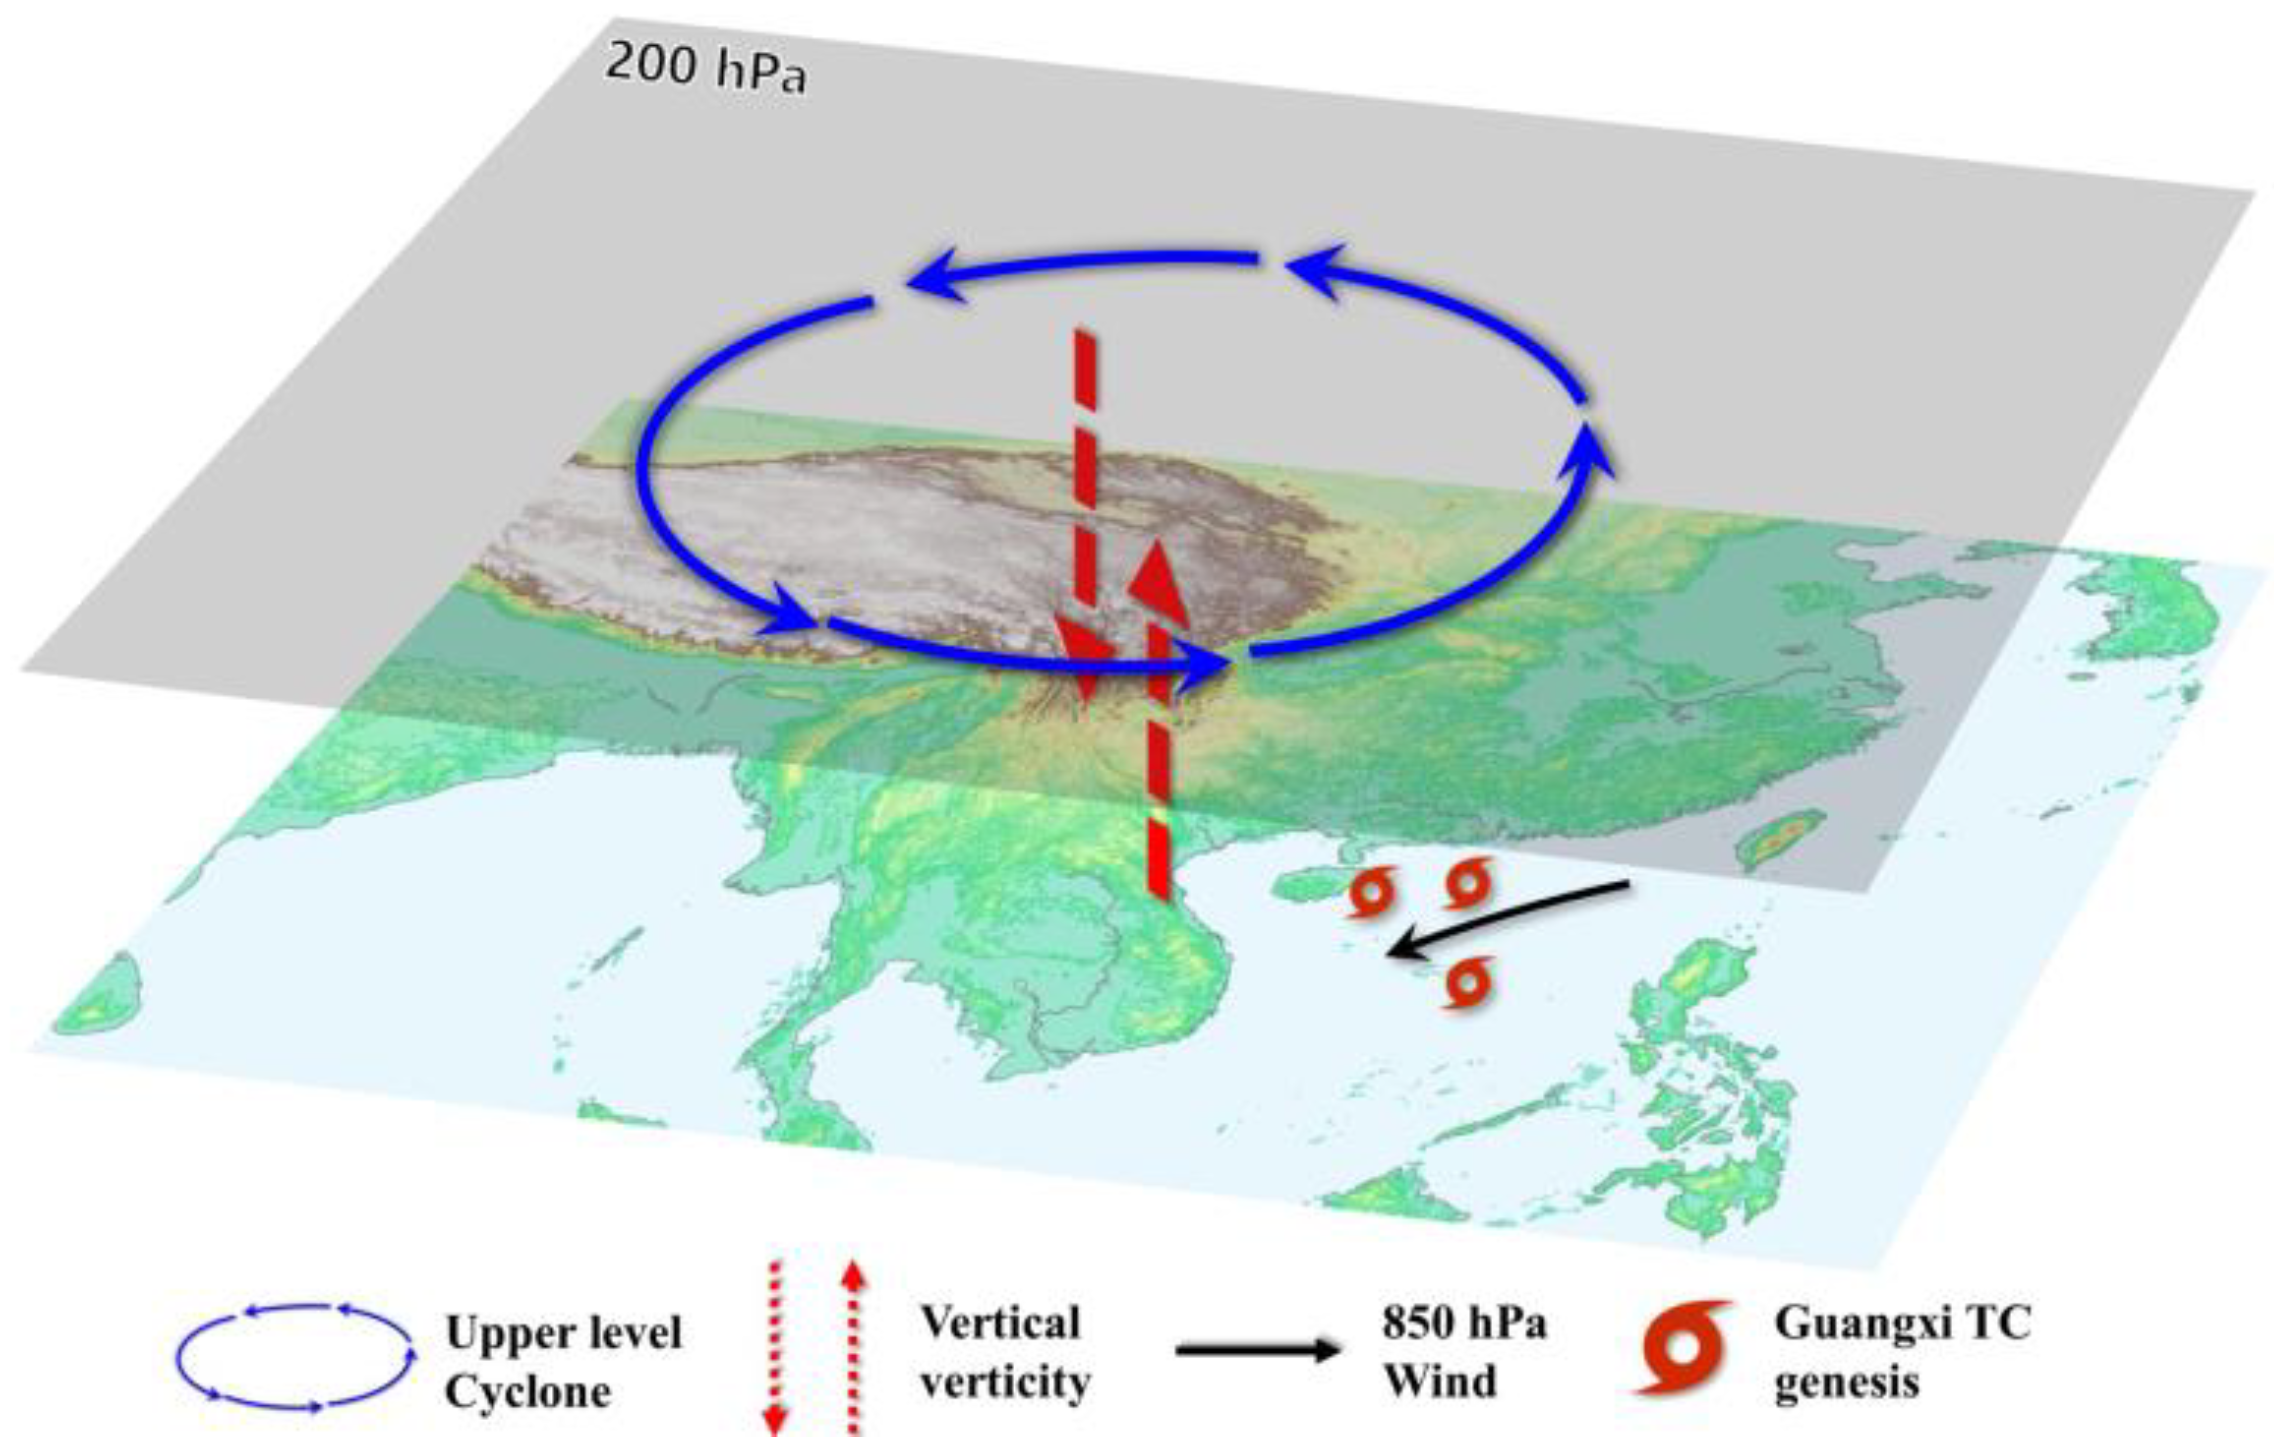
About three TCs affected Guangxi in each summer during 1979–2019 (Figure 1c). Our work reveals the possible impact of the thermal forcing anomaly over the southeast TP on the frequency of tropical cyclones affecting Guangxi formed within the west of 120° E during boreal summer. Our findings provide insights into improving the seasonal predictability of Guangxi TCs. In this study, the correlation coefficient between the rainfall over the southeastern TP and the FTC affecting Guangxi formed within the west of 120° E is −0.42 in summer during 1979–2019, which is significant at a 99% confidence level. This could be because the cooling over the southeastern TP reduces the South Asian high, leading to local descending motions over southeastern TP. Meanwhile, the compensating ascending motion over eastern Indochina Peninsula accompanied with the reduced 850–200 hPa vertical wind shear over southern SCS resulted in higher-than-normal Guangxi TCs formed within the west of 120° E. Figure 6 shows the dynamical mechanisms described above. On the other hand, the correlation relationship between RSTP and FTC affecting Guangxi formed within the east of 120° E is not significant. FTC affecting Guangxi formed within the east of 120° E is closely related to the westward extension of the western North Pacific subtropical high (figure not shown).
About one Guangxi TC formed within the west of 120° E in each summer during 1979–2019 (Figure 1d). We only focus on the average in summer, and cannot further explain the difference of the Guangxi TC formed within the west of 120° E in three summer months. Considering the small sample size of Guangxi TCs formed within the west of 120° E, the influence of the RSTC-related anomalous vertical motion over the eastern Indochina Peninsula on Guangxi TCs formed within the west of 120° E is more uncertain than that of the RSTC-related anomalous vertical wind shear over the SCS. It is worth mentioning that Wang and Wang [38] reported that the strength of the South Asia High can affect TC genesis in the SCS. However, their results showed that the South Asia High cannot affect the vertical wind shear over the SCS. The present work further emphasizes the impact of summer TP thermal forcing on the 850–200 hPa vertical wind shear over southern SCS and provides valuable insights into the regional TCs in southern China. In addition, some studies also confirmed the relationship between rainfall over southern TP and wave trains at mid-latitudes [28,51]. Lu et al. [52] showed that the relationship between summer precipitation over the southern TP and Southeast Asian summer monsoon is enhanced when the SST and convection increase over the tropical Atlantic. How the Atlantic SST or mid-latitude wave train affects Guangxi TCs or the Guangxi TC-RSTP relationship will be further discussed in future work. Moreover, in the extremely active Guangxi TC years, other factors, such as atmospheric low frequency oscillation, monsoon trough, and Walker circulation also impacted the FTC affecting Guangxi [53]. Hence, the synergistic impacts of summer TP thermal forcing and other factors are critical for interpreting and predicting the regional TC activity in different areas over southern China, which warrant further investigations.

Author Contributions

Conceptualization, C.Z. and F.Z.; Methodology, C.Z.; Software and model experiment, S.L.; Validation, all; Formal Analysis, all; Investigation, all; Resources and Data Curation, L.H. and X.L.; Writing—Original Draft Preparation, all; Writing—Review and Editing, C.H.; Visualization, X.Z.; Supervision, F.Z. and H.H.; All authors have read and agreed to the published version of the manuscript.

Funding

This research is supported by Guangxi Key Research and Development Program (Grant No. AB20159013), Science and Technology Program of Guangxi (GuiKeAB21075008), and Guangxi Typhoon-Ocean Forecast Service Innovation Team.

Institutional Review Board Statement

Not applicable.

Informed Consent Statement

Not applicable.

Data Availability Statement

The reanalysis data in this paper were downloaded from NCEP–NCAR (https://www.esrl.noaa.gov/psd/data/gridded/data.ncep.reanalysis.html, accessed on 1 November 2022). The TC best-track data were obtained from the Shanghai Typhoon Institute of the China Meteorological Administration (https://tcdata.typhoon.org.cn/en/index.html, accessed on 1 November 2022).

Acknowledgments

The authors would like to express their sincere thanks to funding organizations. The five anonymous reviewers provided valuable comments and suggestions for improving the overall quality of the paper.

Conflicts of Interest

The authors declare no conflict of interest.

References

  1. Woodruff, J.D.; Irish, J.L.; Camargo, S.J. Coastal flooding by tropical cyclones and sea-level rise. Nature 2013, 504, 44–52. [Google Scholar] [CrossRef] [PubMed] [Green Version]
  2. Zhao, H.; Jiang, X.; Wu, L. Modulation of Northwest Pacific tropical cyclone genesis by the intraseasonal variability. J. Meteorol. Soc. Jpn. 2015, 93, 81–97. [Google Scholar] [CrossRef] [Green Version]
  3. Peduzzi, P.B.; Chatenoux, B.; Dao, H.; De Bono, A.; Herold, C.; Kossin, J.; Mouton, F.; Nordbeck, O. Global trends in tropical cyclone risk. Nat. Clim. Change 2012, 2, 289–294. [Google Scholar] [CrossRef]
  4. Zhao, K.; Zhao, H.; Raga, G.B.; Yoshida, R.; Wang, W.; Klotzbach, P.J. Changes in extended boreal summer tropical cyclogenesis associated with large-scale flow patterns over the western North Pacific in response to the global warming hiatus. Clim. Dyn. 2021, 56, 515–535. [Google Scholar] [CrossRef]
  5. Zhang, C.; Hu, C.; Huang, G.; Yao, C.; Zheng, Z.; Wang, T.; Wu, Z.; Yang, S.; Chen, D. Perspective on landfalling frequency and genesis location variations of southern China typhoon during peak summer. Geophys. Res. Lett. 2019, 46, 6830–6838. [Google Scholar] [CrossRef] [Green Version]
  6. Chen, W.; Yang, S.; Wu, Z.; Cai, F. Large-scale atmospheric features favoring the tropical cyclone activity affecting the Guangdong–Hong Kong–Macao Greater Bay Area of China. Environ. Res. Lett. 2022, 17, 104057. [Google Scholar] [CrossRef]
  7. Zhang, S.; Zheng, Y.; Liu, C.; Huang, Z.; Weng, H.; Xu, J.; Tu, S. Climatology of Different Classifications of Tropical Cyclones Landfalling in Guangdong Province of China during 1951–2020. Atmosphere 2022, 13, 1306. [Google Scholar] [CrossRef]
  8. Liu, K.S.; Chan, J.C.L. Recent increase in extreme intensity of tropical cyclones making landfall in South China. Clim. Dyn. 2020, 55, 1059–1074. [Google Scholar] [CrossRef]
  9. Shan, K.; Yu, X. Variability of tropical cyclone landfalls in China. J. Clim. 2021, 34, 9235–9247. [Google Scholar] [CrossRef]
  10. Yao, C.; Xiao, Z.; Yang, S.; Luo, X. Increased severe landfall typhoons in China since 2004. Int. J. Climatol. 2021, 41, E1018–E1027. [Google Scholar] [CrossRef]
  11. Liu, H.; Wang, L.; Dai, Y.; Chen, H. Relationships between the Southwest Monsoon Surge and the Heavy Rainfall Associated with Landfalling Super Typhoon Rammasun. Atmosphere 2022, 13, 130. [Google Scholar] [CrossRef]
  12. Hoarau, K.; Lander, M.; De Guzman, R.; Guard, C.; Barba, R. Did Typhoon Haiyan have a new record-minimum pressure? Weather 2017, 72, 291–295. [Google Scholar] [CrossRef]
  13. Choy, C.-W.; Wu, M.-C.; Lee, T.-C. Assessment of the damages and direct economic loss in Hong Kong due to Super Typhoon Mangkhut in 2018. Trop. Cyclone Res. Rev. 2017, 9, 193–205. [Google Scholar] [CrossRef]
  14. Yi, L.; Fang, W.; Duan, X. On the Driving Forces of Historical Changes in the Fatalities of Tropical Cyclone Disasters in China from 1951~2014. Nat. Hazards 2019, 98, 507–533. [Google Scholar]
  15. Gao, G.; Huang, D.P.; Zhao, S.S. Annual and monthly risk assessment of typhoon disasters in China based on the information diffusion method. Meteor. Mon. 2019, 45, 1600–1610. (In Chinese) [Google Scholar]
  16. Lu, Y.; Zhao, H.k.; Zhao, D.; Li, Q. Spatial-temporal characteristic of tropical cyclone disasters in China during 1984–2017. Haiyang Xuebao 2021, 43, 45–61. (In Chinese) [Google Scholar]
  17. Huang, Y.; Jin, L.; Zhao, H.S.; Huang, X.Y. Fuzzy neural network and LLE Algorithm for forecasting precipitation in tropical cyclones: Comparisons with interpolation method by ECMWF and stepwise regression method. Nat. Hazards 2018, 91, 201–220. [Google Scholar] [CrossRef]
  18. Duan, A.; Wu, G.; Liu, Y.; Ma, Y.; Zhao, P. Weather and climate effects of the Tibetan Plateau. Adv. Atmos. Sci. 2012, 29, 978–992. [Google Scholar] [CrossRef]
  19. Wu, G.; Liu, Y.; Zhang, Q.; Duan, A.; Wang, T.; Wan, R.; Liu, X.; Li, W.; Wang, Z.; Zhang, Q. The influence of mechanical and thermal forcing by the Tibetan Plateau on Asian climate. J. Hydrometeorol. 2007, 8, 770–789. [Google Scholar] [CrossRef] [Green Version]
  20. Xiao, Z.; Duan, A.; Wang, Z. Atmospheric heat sinks over the western Tibetan Plateau associated with snow depth in late spring. Int. J. Climatol. 2019, 39, 5170–5180. [Google Scholar] [CrossRef]
  21. Xu, W.; Ma, L.; Ma, M.; Zhang, H.; Yuan, W. Spatial–temporal variability of snow cover and depth in the Qinghai–Tibetan Plateau. J. Clim. 2017, 30, 1521–1533. [Google Scholar] [CrossRef]
  22. Zhao, P.; Chen, L. Climatic features of atmospheric heat source/sink over the Qinghai-Xizang Plateau in 35 years and its relation to rainfall in China. Sci. China 2001, 44, 858–864. [Google Scholar] [CrossRef]
  23. Yang, K.; Guo, X.; He, J.; Qin, J.; Koike, T. On the climatology and trend of the atmospheric heat source over the Tibetan Plateau: An experiments-supported revisit. J. Clim. 2011, 24, 1525–1541. [Google Scholar] [CrossRef] [Green Version]
  24. Jiang, X.; Li, Y.; Yang, S. Interannual variation of summer atmospheric heat source over the Tibetan Plateau and the role of convection around the western Maritime Continent. J. Clim. 2016, 29, 121–138. [Google Scholar] [CrossRef]
  25. Gong, Y.; Ji, L. The numerical experiment of the medium-range change of the subtropical high I: The influence of the heat source over Tibetan Plateau. J. Trop. Meteorol. 1998, 14, 106–112. [Google Scholar]
  26. Jiang, X.; Ting, M. A Dipole Pattern of Summertime Rainfall across the Indian Subcontinent and the Tibetan Plateau. J. Clim. 2017, 30, 9607–9620. [Google Scholar] [CrossRef]
  27. Wang, Z.; Yang, S.; Duan, A.; Hua, W.; Ullah, K.; Liu, S. Tibetan Plateau heating as a driver of monsoon rainfall variability in Pakistan. Clim. Dyn. 2019, 52, 6121–6130. [Google Scholar] [CrossRef] [Green Version]
  28. Wang, Z.; Yang, S.; Lau, N.-C.; Duan, A. Teleconnection between Summer NAO and East China Rainfall Variations: A Bridge Effect of the Tibetan Plateau. J. Clim. 2018, 31, 6433–6444. [Google Scholar] [CrossRef]
  29. Kalnay, E.; Kanamitsu, M.; Kistler, R.; Collins, W.; Deaven, D.; Gandin, L.; Iredell, M.; Saha, S.; White, G.; Woollen, J.; et al. The NCEP/NCAR 40-Year Reanalysis Project. Bull. Am. Meteorol. Soc. 1996, 77, 437–471. [Google Scholar] [CrossRef]
  30. Liebmann, B.; Smith, C.A. Description of a complete (interpolated) outgoing longwave radiation dataset. Bull. Am. Meteorol. Soc. 1996, 77, 1275–1277. [Google Scholar]
  31. Ying, M.; Zhang, W.; Yu, H.; Lu, X.; Feng, J.; Fan, Y.; Zhu, Y.; Chen, D. An overview of the China Meteorological Administration tropical cyclone database. J. Atmos. Ocean. Technol. 2014, 31, 287–301. [Google Scholar] [CrossRef] [Green Version]
  32. Yanai, M.; Esbensen, S.; Chu, J.H. Determination of bulk properties of tropical cloud clusters from large-Scale heat and moisture budgets. J. Atmos. Sci. 1973, 30, 611–627. [Google Scholar] [CrossRef]
  33. Wang, B.; Murakami, H. Dynamic genesis potential index for diagnosing present-day and future global tropical cyclone genesis. Environ. Res. Lett. 2020, 15, 114008. [Google Scholar] [CrossRef]
  34. Watanabe, M.; Kimoto, M. Atmosphere-ocean thermal coupling in the North Atlantic: A positive feedback. Q. J. R. Meteorol. Soc. 2000, 126, 3343–3369. [Google Scholar] [CrossRef]
  35. Goh, A.; Chan, J.C.L. An improved statistical scheme for the prediction of tropical cyclones making landfall in South China. Weather Forecast. 2010, 25, 587–593. [Google Scholar]
  36. Zhang, W.; Graf, H.-F.; Leung, Y.; Herzog, M. Different El Nino types and tropical cyclone landfall in East Asia. J. Clim. 2012, 24, 6510–6523. [Google Scholar] [CrossRef]
  37. Yang, L.; Du, Y.; Wang, D.; Wang, C.; Wang, X. Impact of intraseasonal oscillation on the tropical cyclone track in the South China Sea. Clim. Dyn. 2015, 44, 1505–1519. [Google Scholar] [CrossRef]
  38. Wang, C.; Wang, B. Impacts of the South Asian high on tropical cyclone genesis in the South China Sea. Clim. Dyn. 2021, 56, 2279–2288. [Google Scholar] [CrossRef]
  39. Li, R.C.Y.; Zhou, W.; Shun, C.M.; Lee, T.C. Change in destructiveness of Landfalling tropical cyclones over China in recent decades. J. Clim. 2017, 30, 3367–3379. [Google Scholar] [CrossRef]
  40. Tu, J.; Chen, J. Large-scale indices for assessing typhoon activity around Taiwan. Int. J. Climatol. 2019, 39, 921–933. [Google Scholar] [CrossRef]
  41. Liu, B.; Zhu, C.; Yuan, Y. Two interannual dominant modes of the South Asian High in May and their linkage to the tropical SST anomalies. Clim. Dyn. 2017, 49, 2705–2720. [Google Scholar] [CrossRef]
  42. Wang, Z.; Duan, A.; Wu, G.; Yang, S. Mechanism for occurrence of precipitation over the southern slope of the Tibetan Plateau without local surface heating. Int. J. Climatol. 2016, 36, 4164–4171. [Google Scholar] [CrossRef] [Green Version]
  43. Webster, P.; Yang, S. Monsoon and ENSO: Selectively interactive systems. Q. J. R. Meteorol. Soc. 1992, 118, 877–926. [Google Scholar] [CrossRef]
  44. Ren, F.; Liang, J.; Wu, G.; Dong, W.; Yang, X. Reliability Analysis of Climate Change of Tropical Cyclone Activity over the Western North Pacific. J. Clim. 2011, 24, 5887–5898. [Google Scholar] [CrossRef] [Green Version]
  45. Song, J.; Klotzbach, P.J.; Zhao, H.; Duan, Y. Slowdown in the decay of western North Pacific tropical cyclones making landfall on the Asian continent. Front. Earth Sci. 2021, 9, 749287. [Google Scholar] [CrossRef]
  46. Li, L.; Chakraborty, P. Slower decay of landfalling hurricanes in a warming world. Nature 2020, 587, 230–234. [Google Scholar] [CrossRef] [PubMed]
  47. Couhert, A.T.; Schneider, J.; Li, D.; Waliser, E.; Tompkins, A.M. The maintenance of the relative humidity of the subtropical free troposphere. J. Clim. 2010, 23, 390–403. [Google Scholar] [CrossRef] [Green Version]
  48. Qiao, S.; Chen, D.; Wang, B.; Cheung, H.-N.; Liu, F.; Cheng, J.; Tang, S.; Zhang, Z.; Feng, G.; Dong, W. The longest 2020 Meiyu season over the past 60 years: Subseasonal perspective and its predictions. Geophys. Res. Lett. 2021, 48, e2021GL093596. [Google Scholar] [CrossRef]
  49. Hu, J.; Duan, A. Relative contributions of the Tibetan Plateau thermal forcing and the Indian Ocean sea surface temperature basin mode to the interannual variability of the East Asian summer monsoon. Clim. Dyn. 2015, 45, 2697–2711. [Google Scholar] [CrossRef]
  50. Ge, J.; You, Q.; Zhang, Y. The influence of the Asian summer monsoon onset on the northward movement of the South Asian high towards the Tibetan Plateau and its thermodynamic mechanism. Int. J. Climatol. 2018, 38, 543–553. [Google Scholar] [CrossRef]
  51. Wang, Z.; Yang, S.; Luo, H.; Li, J. Drying tendency over the southern slope of the Tibetan Plateau in recent decades: Role of a CGT-like atmospheric change. Clim. Dyn. 2022, 59, 2801–2813. [Google Scholar] [CrossRef]
  52. Lu, M.; Yang, S.; Zhu, C.; Wang, J.; Lin, S.; Wei, W.; Fan, H. Thermal Impact of the Southern Tibetan Plateau on the Southeast Asian Summer Monsoon and Modulation by the Tropical Atlantic SST. J. Clim. 2022; in press. [Google Scholar] [CrossRef]
  53. Qin, W.; Zhou, M.; Xu, S. Causality analysis of more tropical cyclones affecting Guangxi in 2013. Meteorol. Mon. 2015, 42, 709–715. (In Chinese) [Google Scholar]
Figure 1. The maps in (a) denote the altitude (shading, units: m) over South Asia. The black line represents Guangxi. The domain of TC affecting Guangxi (19° N–28° N, 104° E–112° E) is outlined by the red box. (b) Spatial patterns of the climatological mean track of tropical cyclones affecting Guangxi (shading, year−1) with a 1° × 1° resolution during boreal summer in 1979–2019.
Atmosphere 14 00018 g001
Figure 2. Correlations of (a) OLR (unit: W m−2) and (b) rainfall (unit: mm day−1) over the southeast TP with FTC affecting Guangxi in boreal summer for 1979–2019. Dotted areas indicate values exceeding 90% confidence level. (c) The time series of normalized RSTP (red line) and FTC affecting Guangxi (blue line) during 1979–2019. As (c), but for FTC affecting Guangxi generated in the west of 120° E (green line) and FTC affecting Guangxi generated in the east of 120° E (black line) in (d,e). (f) Correlations of diabatic heating (K day−1) over southeast TP (black box in (a) and (b): 28° N–31° N, 97° E–102° E) with RSTP.
Atmosphere 14 00018 g002
Figure 3. (a) The tracks and genesis locations of the TCs during the positive RSTP years. (b) Is the same as (a), but for negative RSTP years. Composite differences in (c) 200 hPa GH (shading) and wind (vector), (d) omega (shading) at average from 500 to 700 hPa and SF (vector), (e) relative humidity (shading) at average from 500 to 700 hPa, and (f) meridional to vertical cross to section of circulation averaged over 95° E–108° E between the negative and positive RSTP years. The black vectors (c,d), white dots (d,e), and the shading (f) indicate the values significantly exceeding the 90% confidence level.
Atmosphere 14 00018 g003
Figure 4. Composite differences in (a) dynamic genesis potential index, (b) 500 hPa vertical velocity (5 × 10⁻² Pa s−1), (c) vertical wind shear (4 m s−1), (d) 500 hPa meridional gradient of zonal wind (10−5 s−1), (e) 850 hPa absolute vorticity (10−5 s−1) between the negative and positive RSTP years. White dots denote the significant values above the 90% confidence level. (f) The responses of the vertical wind shear (m s−1) to cooling over the southeast TP in LBM.
Atmosphere 14 00018 g004
Figure 5. Spatial patterns of climatological mean 850 hPa winds (a) and 200 hPa winds (b) during boreal summer in 1979–2019. (c) Vertical profile of specific heat source (K day−1). The x-axis and y-axis in (c) denote the magnitude of heating and height represented by sigma, respectively. (d) The responses of winds and GH at 200 hPa to cooling over the southeast TP. (e) The responses of 850 hPa winds and vertical p to velocity average from 500 to 850 hPa to cooling over the southeast TP. (f) The responses of meridional to vertical cross-section of circulation averaged over 95° E–108° E to cooling over the southeast TP. The cooling forcing patterns (the blue dashed lines represent −4, −2.5, −1, and −0.1 K day−1) are shown in (d,e).
Atmosphere 14 00018 g005
Figure 6. A schematic diagram of the impacts of thermal forcing over the southeast TP on the frequency of tropical cyclones affecting Guangxi formed within the west of 120° E.
Atmosphere 14 00018 g006
Disclaimer/Publisher’s Note: The statements, opinions and data contained in all publications are solely those of the individual author(s) and contributor(s) and not of MDPI and/or the editor(s). MDPI and/or the editor(s) disclaim responsibility for any injury to people or property resulting from any ideas, methods, instructions or products referred to in the content.