Article

Automatic Center Detection of Tropical Cyclone Using Image Processing Based on the Operational Radar Network

Weather Radar Center of Korea Meteorological Administration, Seoul 07062, Republic of Korea
*
Author to whom correspondence should be addressed.
Atmosphere 2023, 14(1), 168; https://doi.org/10.3390/atmos14010168
Submission received: 8 November 2022 / Revised: 3 January 2023 / Accepted: 9 January 2023 / Published: 12 January 2023

Abstract

:
This study presents the algorithm ACTION, defined as automatic center detection of tropical cyclone (TC) using image processing based on the operational radar network. Based on the high visibility of weather radar imagery, a TC’s motion vector is calculated from the continuous image change using optical flow, producing the TC’s rotation center. The algorithm performance was verified by analyzing the typhoons (TCs in the northwestern Pacific) that affected the Korean Peninsula from 2018–2021, demonstrating a high detection rate of 80.8% within an error distance of 40 km against the best track of the Korea Meteorological Administration (KMA). The detection rate was 100% for typhoons with temporally consistent morphological characteristics. ACTION automatically generates TC center information upon the TC’s initial entry inside the observation radius even in the absence of uniform radar data. As ACTION is capable of performing real-time calculations that are directly applied to rapidly generated weather radar images, it is currently being utilized by the KMA. The high temporal resolution TC center information calculated through ACTION is expected to improve the efficiency of TC forecasting.

Graphical Abstract

1. Introduction

TCs are one of the world’s most severe weather phenomena, causing property damage and fatalities. TCs are driven by complex air–sea interactions and are developed as low-pressure systems over tropical oceans with intense warm-cored cyclonic vortices [1]. Accurate and rapid analysis of the TC central location is crucial for disaster mitigation. Analyzing the intensity and forecasting the path of TCs is essential [2,3] to provide rapidly updated information for issuing TC warnings as early as possible.
Although many forms of meteorological data are collected automatically, TC center determination is often conducted manually. TC center information, which does not sufficiently exclude the subjectivity of the analysis, may show an error of approximately 0.3° depending on forecaster error [4]. Many TC center automatic detection methods are based on satellite data [5,6,7]. However, by utilizing weather radar as an observation network, better results should be expected because this approach has an observation range that can sufficiently monitor TCs with high spatial and temporal resolution. Furthermore, weather radar is useful for monitoring severe weather phenomena not only because of its high-density data, but also the high visibility of radar images. Considering the visibility advantage of radar images, image processing methods can be applied to them. In particular, TCs can easily be analyzed with such methods because the characteristics of their movement can serve as key signals in the image processing techniques.
In the context of manual or semiautomatic TC center analysis using radar data, automatic estimation of the TC center through image processing methods using radar images is a novel approach. A standard image processing method for computing motion vectors is optical flow, which derives motion vectors from the differences in subsequent images. Operational weather radar images are usually produced every 10 min or less, hence radar image differences can be obtained by comparing the intervals. From the image differences, a motion vector field can be calculated. While this vector may contain some actual TC movement components, it does not represent 100% of the TC movement or atmospheric flow around the TC. However, the vector derived from the instantaneous change in the radar image is important in detecting the complete change in the TC movement, and if the TC is continuously tracked, information on its movement path can be confirmed.
Multiple methods have been used for TC center detection, and their main concepts can be broadly classified into four categories. The first is to determine the geometrical TC characteristics [8]; the second is to determine if the wind speed at the center of the TC is zero [9,10]; the third is to detect the dynamic center using features such as pressure, position elevation, and stream function [11,12]; and finally, the fourth is to detect the maximum circulation of the TC center [13].
Ref. [8] defines the geometric center of the TC eye wall as the center of the typhoon using airborne radar data as a pattern-matching method considering geometric features. The center of the rotation that best fits the location of the inner edge of the eye wall provides an objective estimate of the center position.
In [10], a TC is identified by detecting the areas with cyclonic shear with radar Doppler velocity data and an axisymmetric TC vortex flow model is established to locate ideal TCs. However, the process of detecting the centers of non-ideal TCs was not explained.
In [11,12], the dynamic center is detected based on the air flow characteristics around the TC center for the kinematic structure of air pressure. Special observation data such as direct synoptic data or aircraft observation were used, which may be difficult to use for real-time forecasting.
This study locates the center of TC circulation as in [13]. In addition, we attempted to use radar data with high resolution and wide observation ranges in addition to special observations or ground-based synoptic observation data with more limited observation ranges. The purpose of this study is to introduce a method utilizing the concept of locating the maximum circulation point of the TC center using a motion vector field derived from radar image changes. As the derived vector field is made through computer image processing, minimizing the subjective judgment of forecasters who simply select TC centers from radar images is possible. Our proposed algorithm is the automatic center detection of tropical cyclone using image processing based on operational radar network, abbreviated as ACTION. ACTION is intended to expand the various fields of the application of radar using the visibility of radar imagery.

2. Materials and Methods
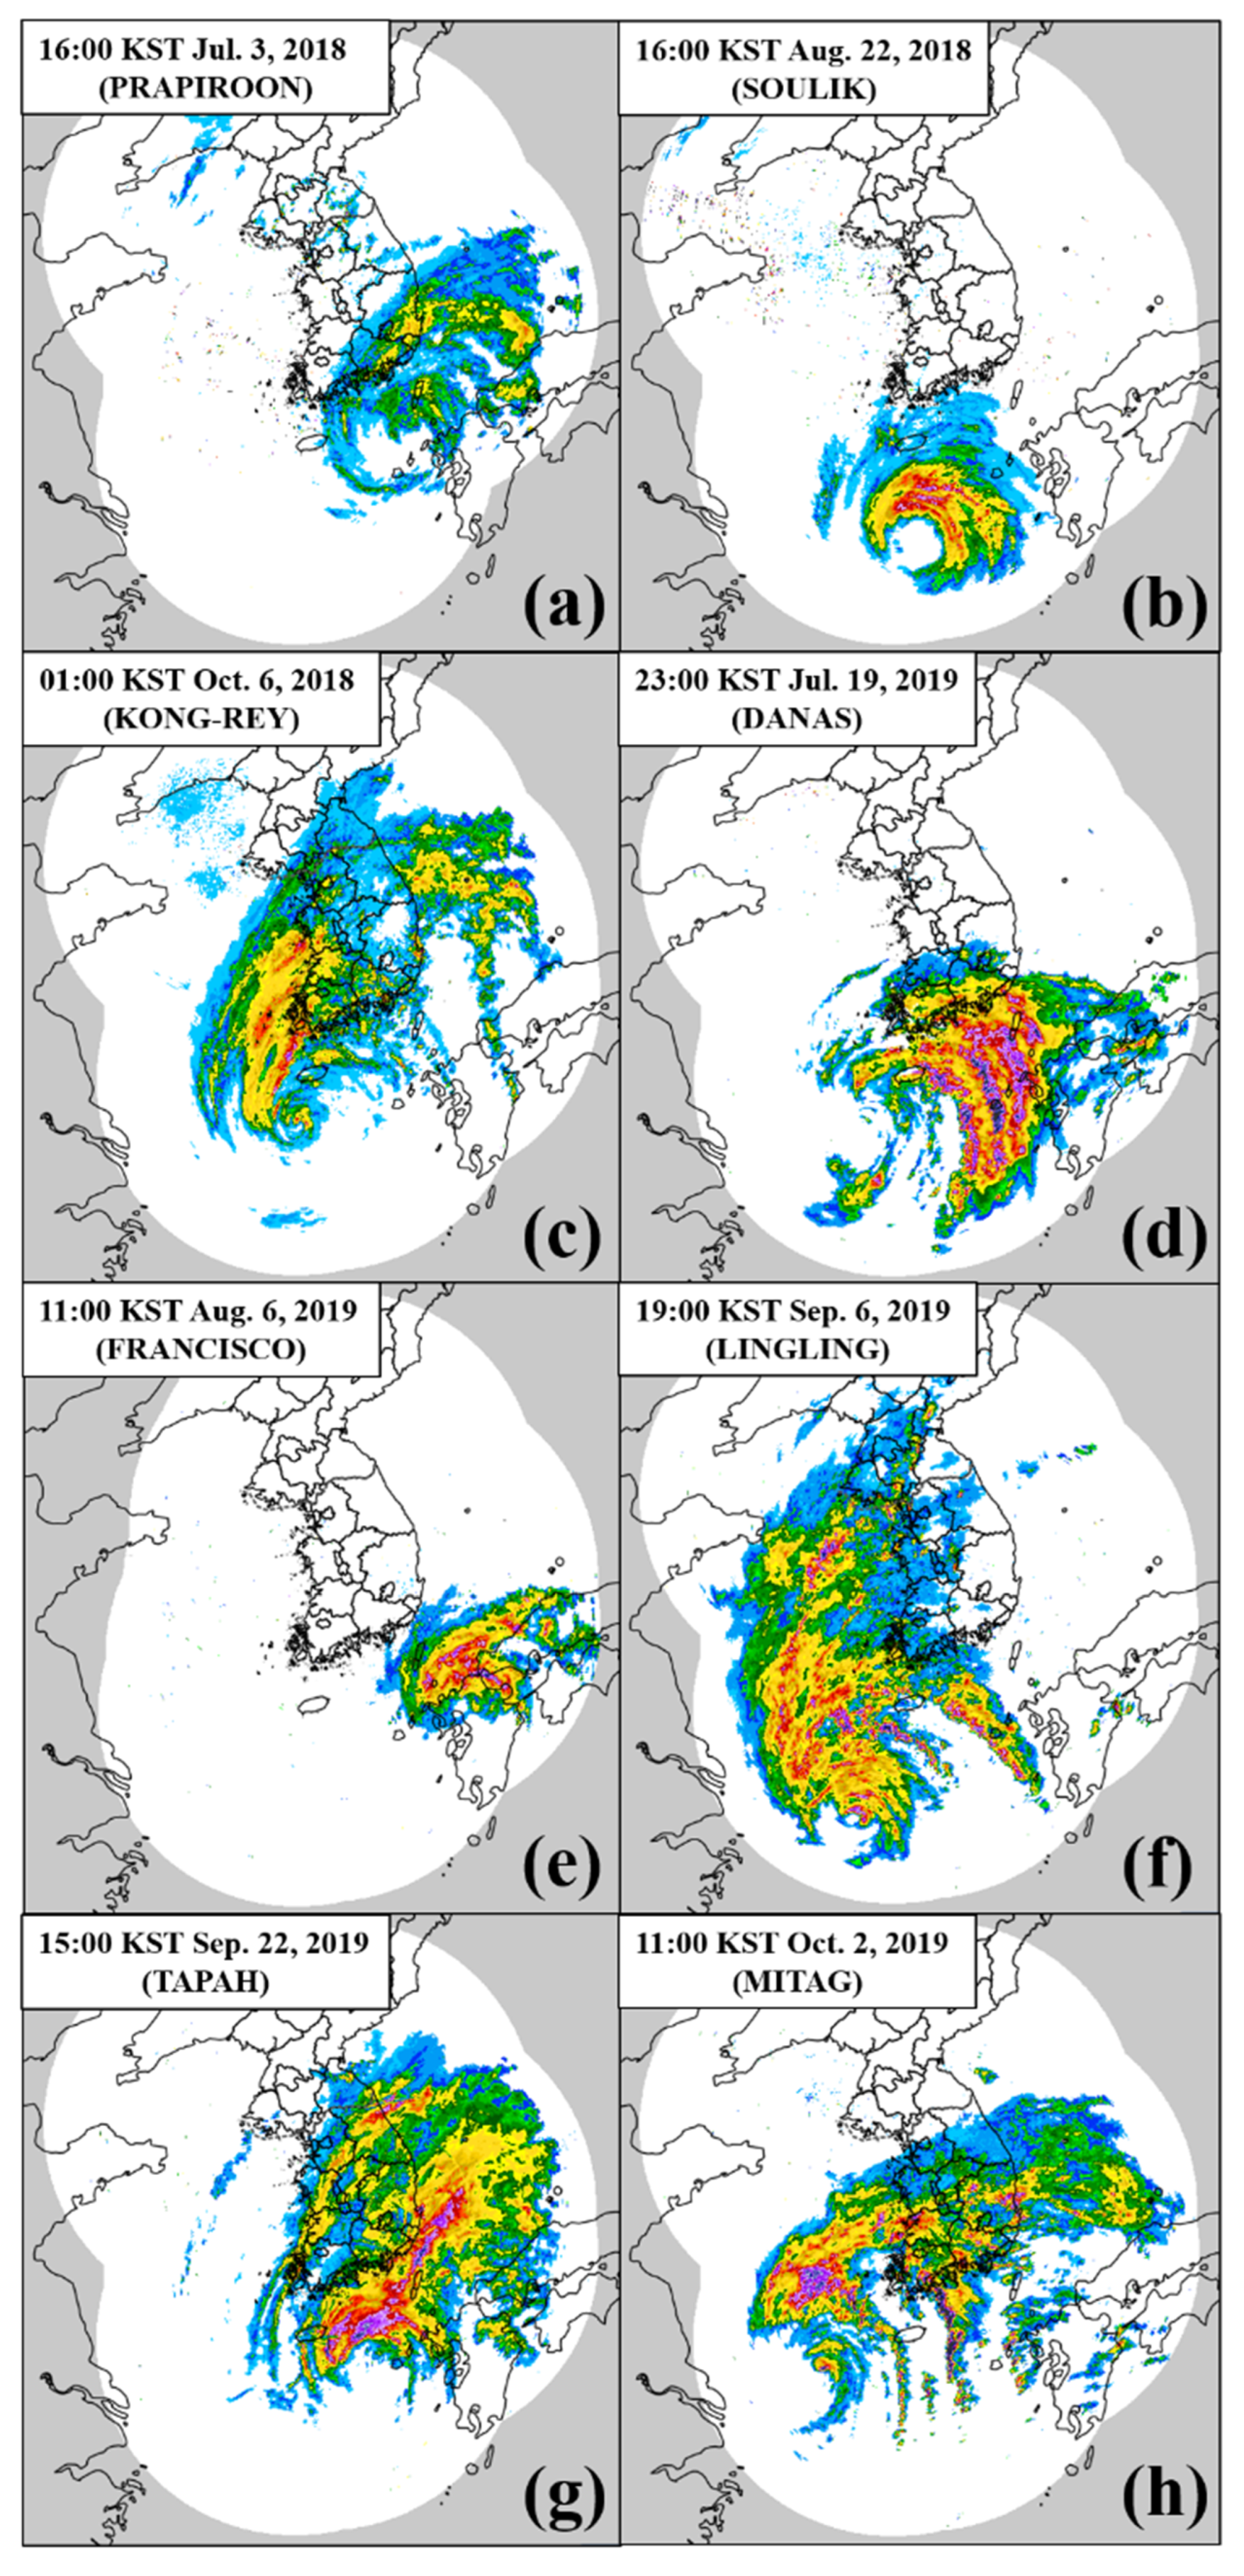
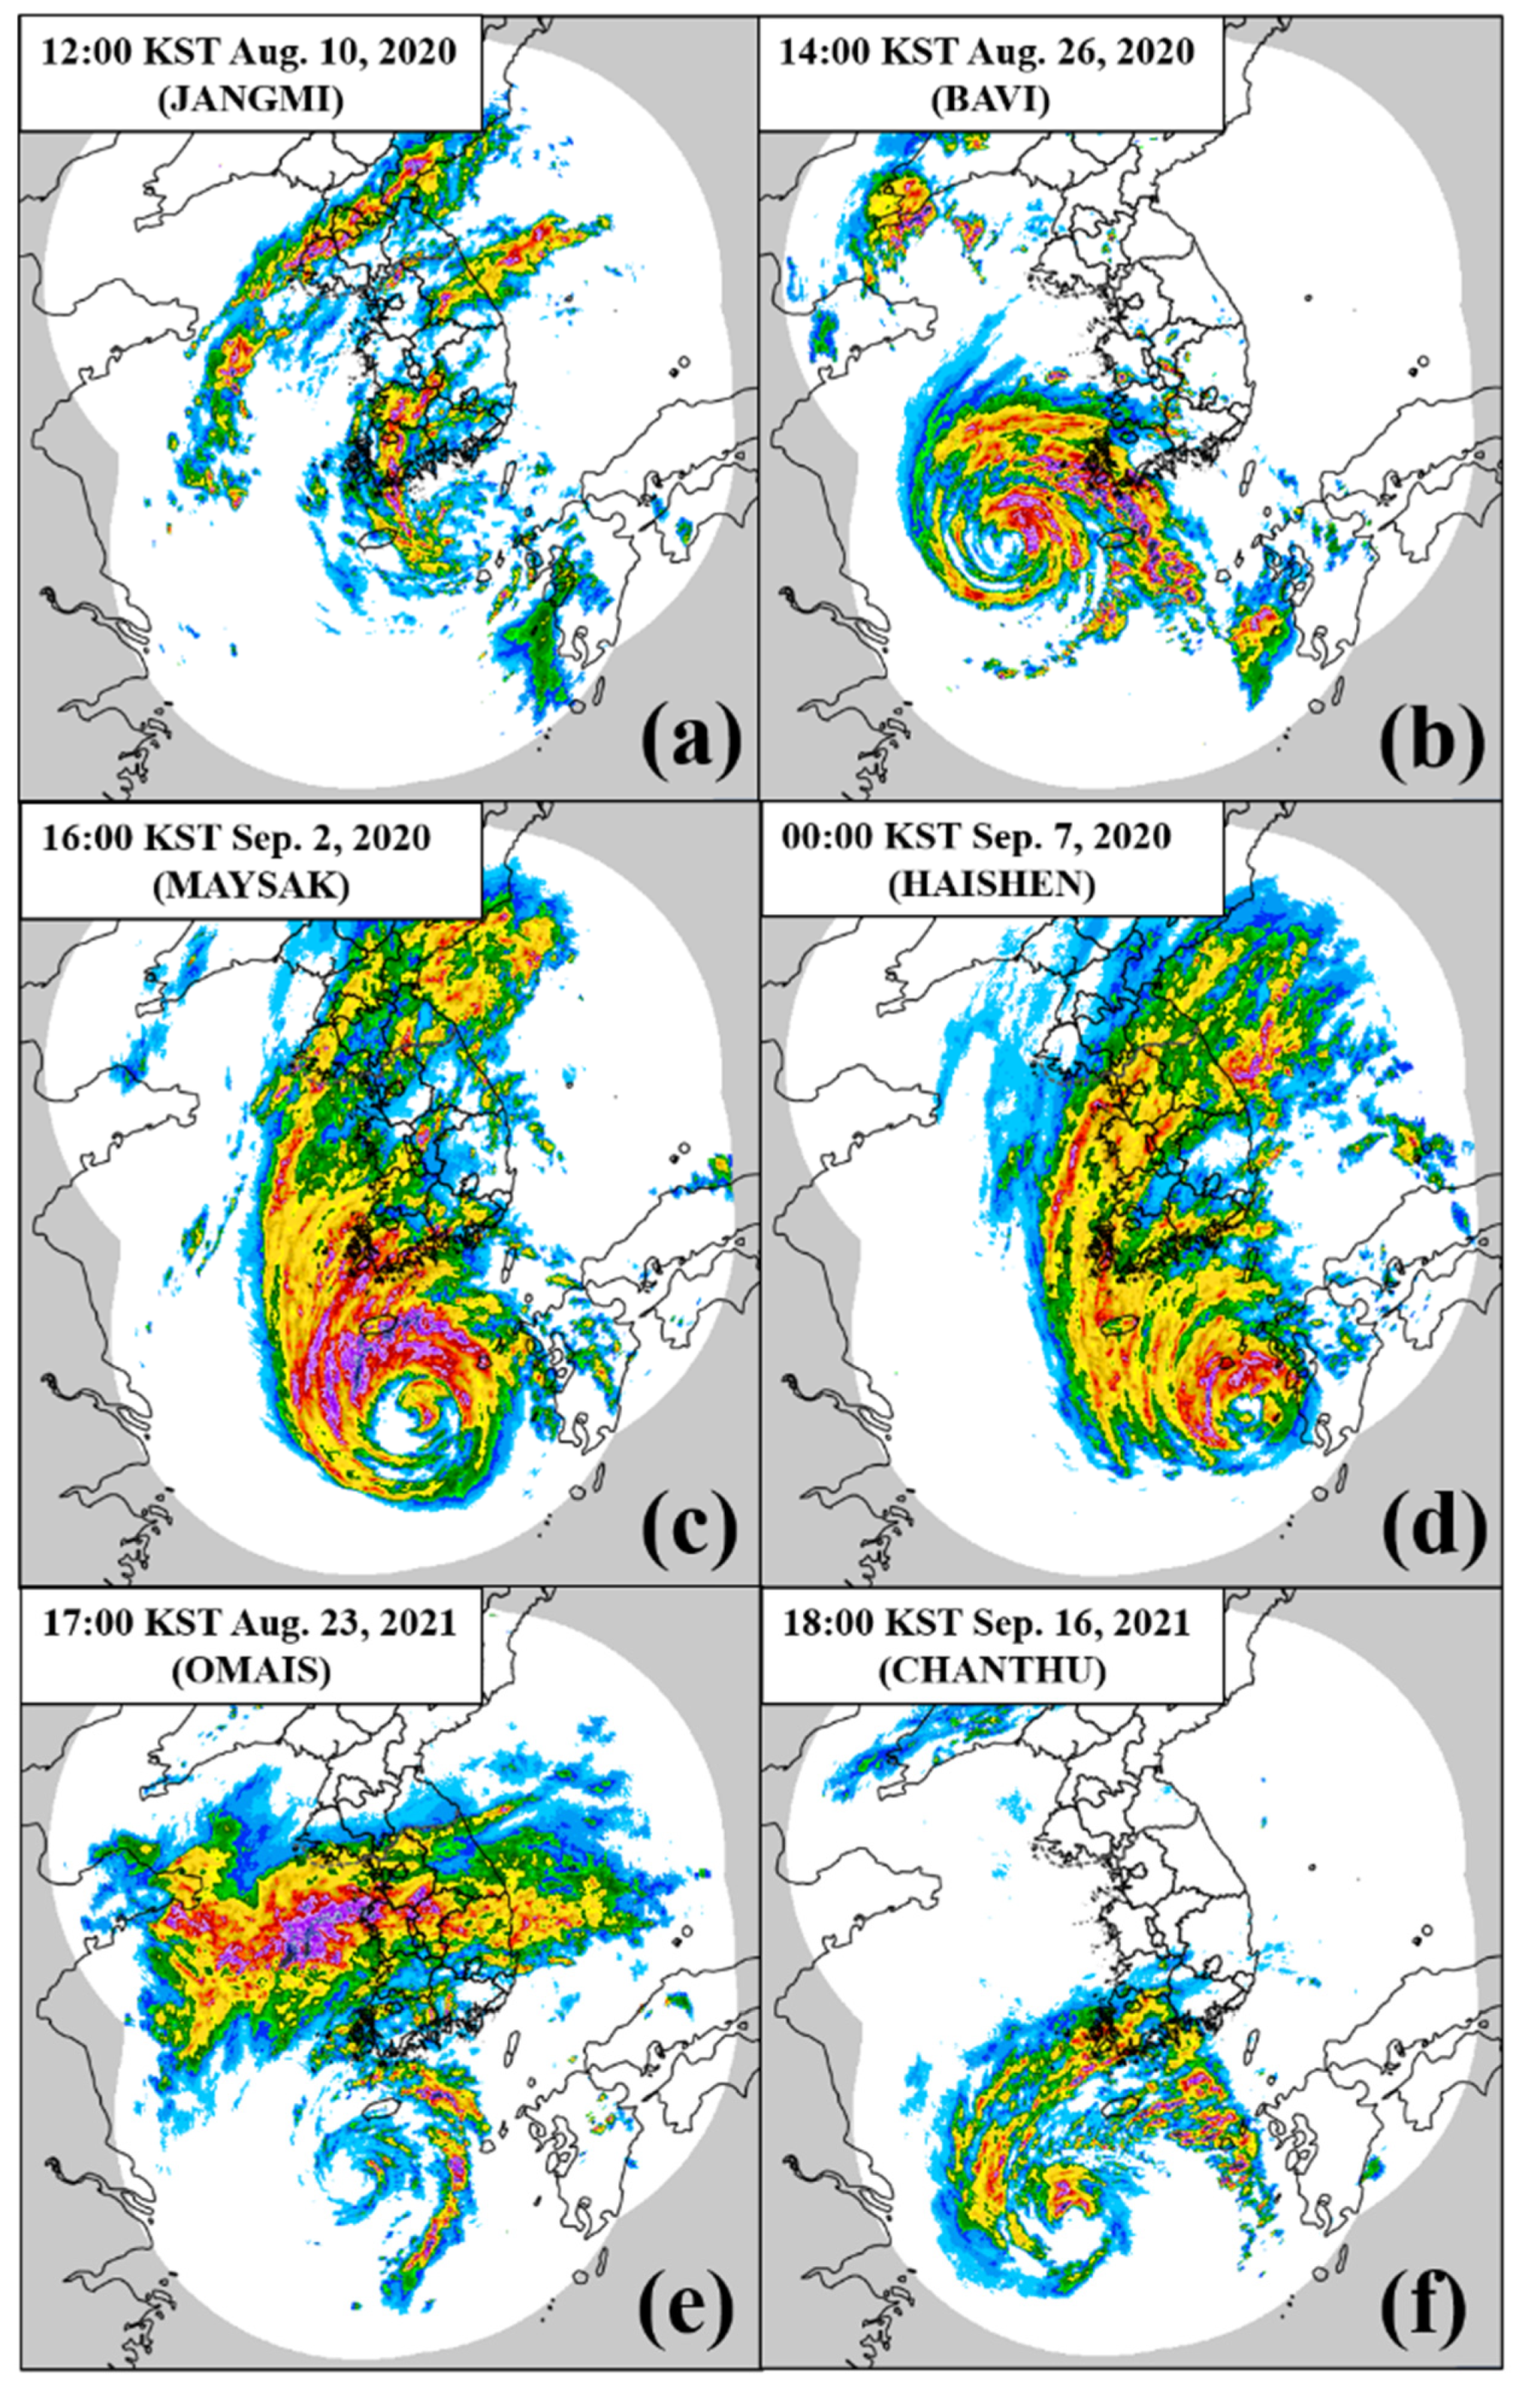
2.1. Radar Image

This study intends to introduce radar data used in meteorology to other perspectives. Although the physical meaning of radar data variables is more generally used, actual weather forecasting agencies are more sensitive to visible changes in the radar image itself. Forecasters primarily focus on how rapidly the precipitation system approaches the region of interest in the radar image and how its intensity changes. In the case of a TC, where the center is located and how it moves in a radar image is important. Therefore, in this study, we attempted to automatically detect the TC center based on radar images.
The radar image used is a composite image of the reflectivity of the ground-based S-band dual-polarization radar observation network operated by the KMA. The KMA has installed ten S-band dual-polarization radars across the Korean Peninsula and observes them at 5 min intervals. These operational radars observe low-altitude single elevation angle observations within a 480 km radius and nine elevation angle volume observations within a 240 km radius at 5 min intervals. The number of elevation angles for volume observation may change depending on the situation determined by a radar scan strategy. In this study, composite reflectivity images from a single elevation observation within a 480 km radius were used. The detailed radar image preprocessing method is described in Section 2.3.

2.2. Optical Flow Technique

ACTION primarily calculates the center of rotation, which characterizes the location of the TC, by extracting visible changes in radar echo images. To extract the image changes, the optical flow technique is used. Optical flow attempts to calculate the motion between two image frames taken at times t and t + Δt at every pixel position. With this technique, pixel intensities of an object are assumed as constant between consecutive image frames. The change of pixel location (x, y, t) with intensity I(x, y, t) will change by Δx, Δy, and Δt between the two image frames. The image intensity can be understood as flows with the Taylor series, as shown in Equation (1):
I(x + Δx, y + Δy, t + Δt) = I(x, y, t) + (∂I/∂xx + (∂I/∂yy + (∂I/∂tt + ⋯
In this equation, ∂I/∂x and ∂I/∂y can be calculated using image gradients. Similarly, ∂I/∂t is the gradient according to time. By assuming minimal movement, truncating the higher order terms, and dividing by Δt, the optical flow equation can be expressed as Equation (2):
(∂I/∂x)u + (∂I/∂y)v + (∂I/∂t) = 0
u and v are basic elements of the vector field used to locate the TC flow extracted from radar images. However, they are unknown variables that cannot be solved for by using only one equation. Several methods can solve this type of problem, including Gunnar Farneback’s algorithm [14], based on polynomial expansion. Farneback’s method approximates the windows of image frames by quadratic polynomials through polynomial expansion transformation; the displacement fields from polynomial expansion coefficients are then defined by observing the polynomial transformation under motion. The algorithm computes dense optical flow under the assumption of a slowly fluctuating displacement field. This dense optical flow is understood to be suitable for calculating the displacement field of a radar image containing slight 5 or 10 min changes, which is the target derivation scale used in this study. In particular, OpenCV (Open source Computer Vision) provides a tool to easily calculate optical flow, and through this, even non-image processing experts can compute the motion vector based on a radar image. To achieve this, the present study uses the Python3.8.2 function “cv2.calcOpticalFlowFarneback” in its programming environment. Appendix A describes the detailed settings related to the use of this function.

2.3. Radar Image Preprocessing

To use the optical flow technique, three conditions must be met: image brightness constancy, temporal persistence, and spatial consistency. Based on the radar characteristics that produce data from a fixed observation point at regular time intervals, the temporal persistence and spatial consistency factors are sufficiently satisfied. However, maintaining the image brightness constancy is more challenging. Fortunately, radar reflectivity data are expressed as a one-dimensional size value, hence when the radar image is converted to grayscale using this value, the brightness constancy can be satisfied.
This study uses a composite of radar reflectivity observed from the S-band radar network of the KMA, specifically the reflectivity composite field expressed as a one-dimensional size value which was converted to grayscale for the optical flow calculation. As the radar composite field is uniformly calculated at 5 or 10 min intervals, temporal persistence can be adjusted easily. Although the radar composite image area should be constant according to the radar observation characteristics that perform constant radius observation, a specific window setting was required to improve its computational efficiency and focus more on the TC flow observation, which is the main target in this study. Therefore, an approximate TC area of 500 × 500 km was extracted using the TC prediction path. While the possibility of a sudden change in the predicted path of a TC cannot be excluded, a TC moving 500 km within 5 or 10 min has not been recorded; thus the selection of an appropriate optical flow calculation region using the central position of the TC center calculated in the previous frame is sufficient.

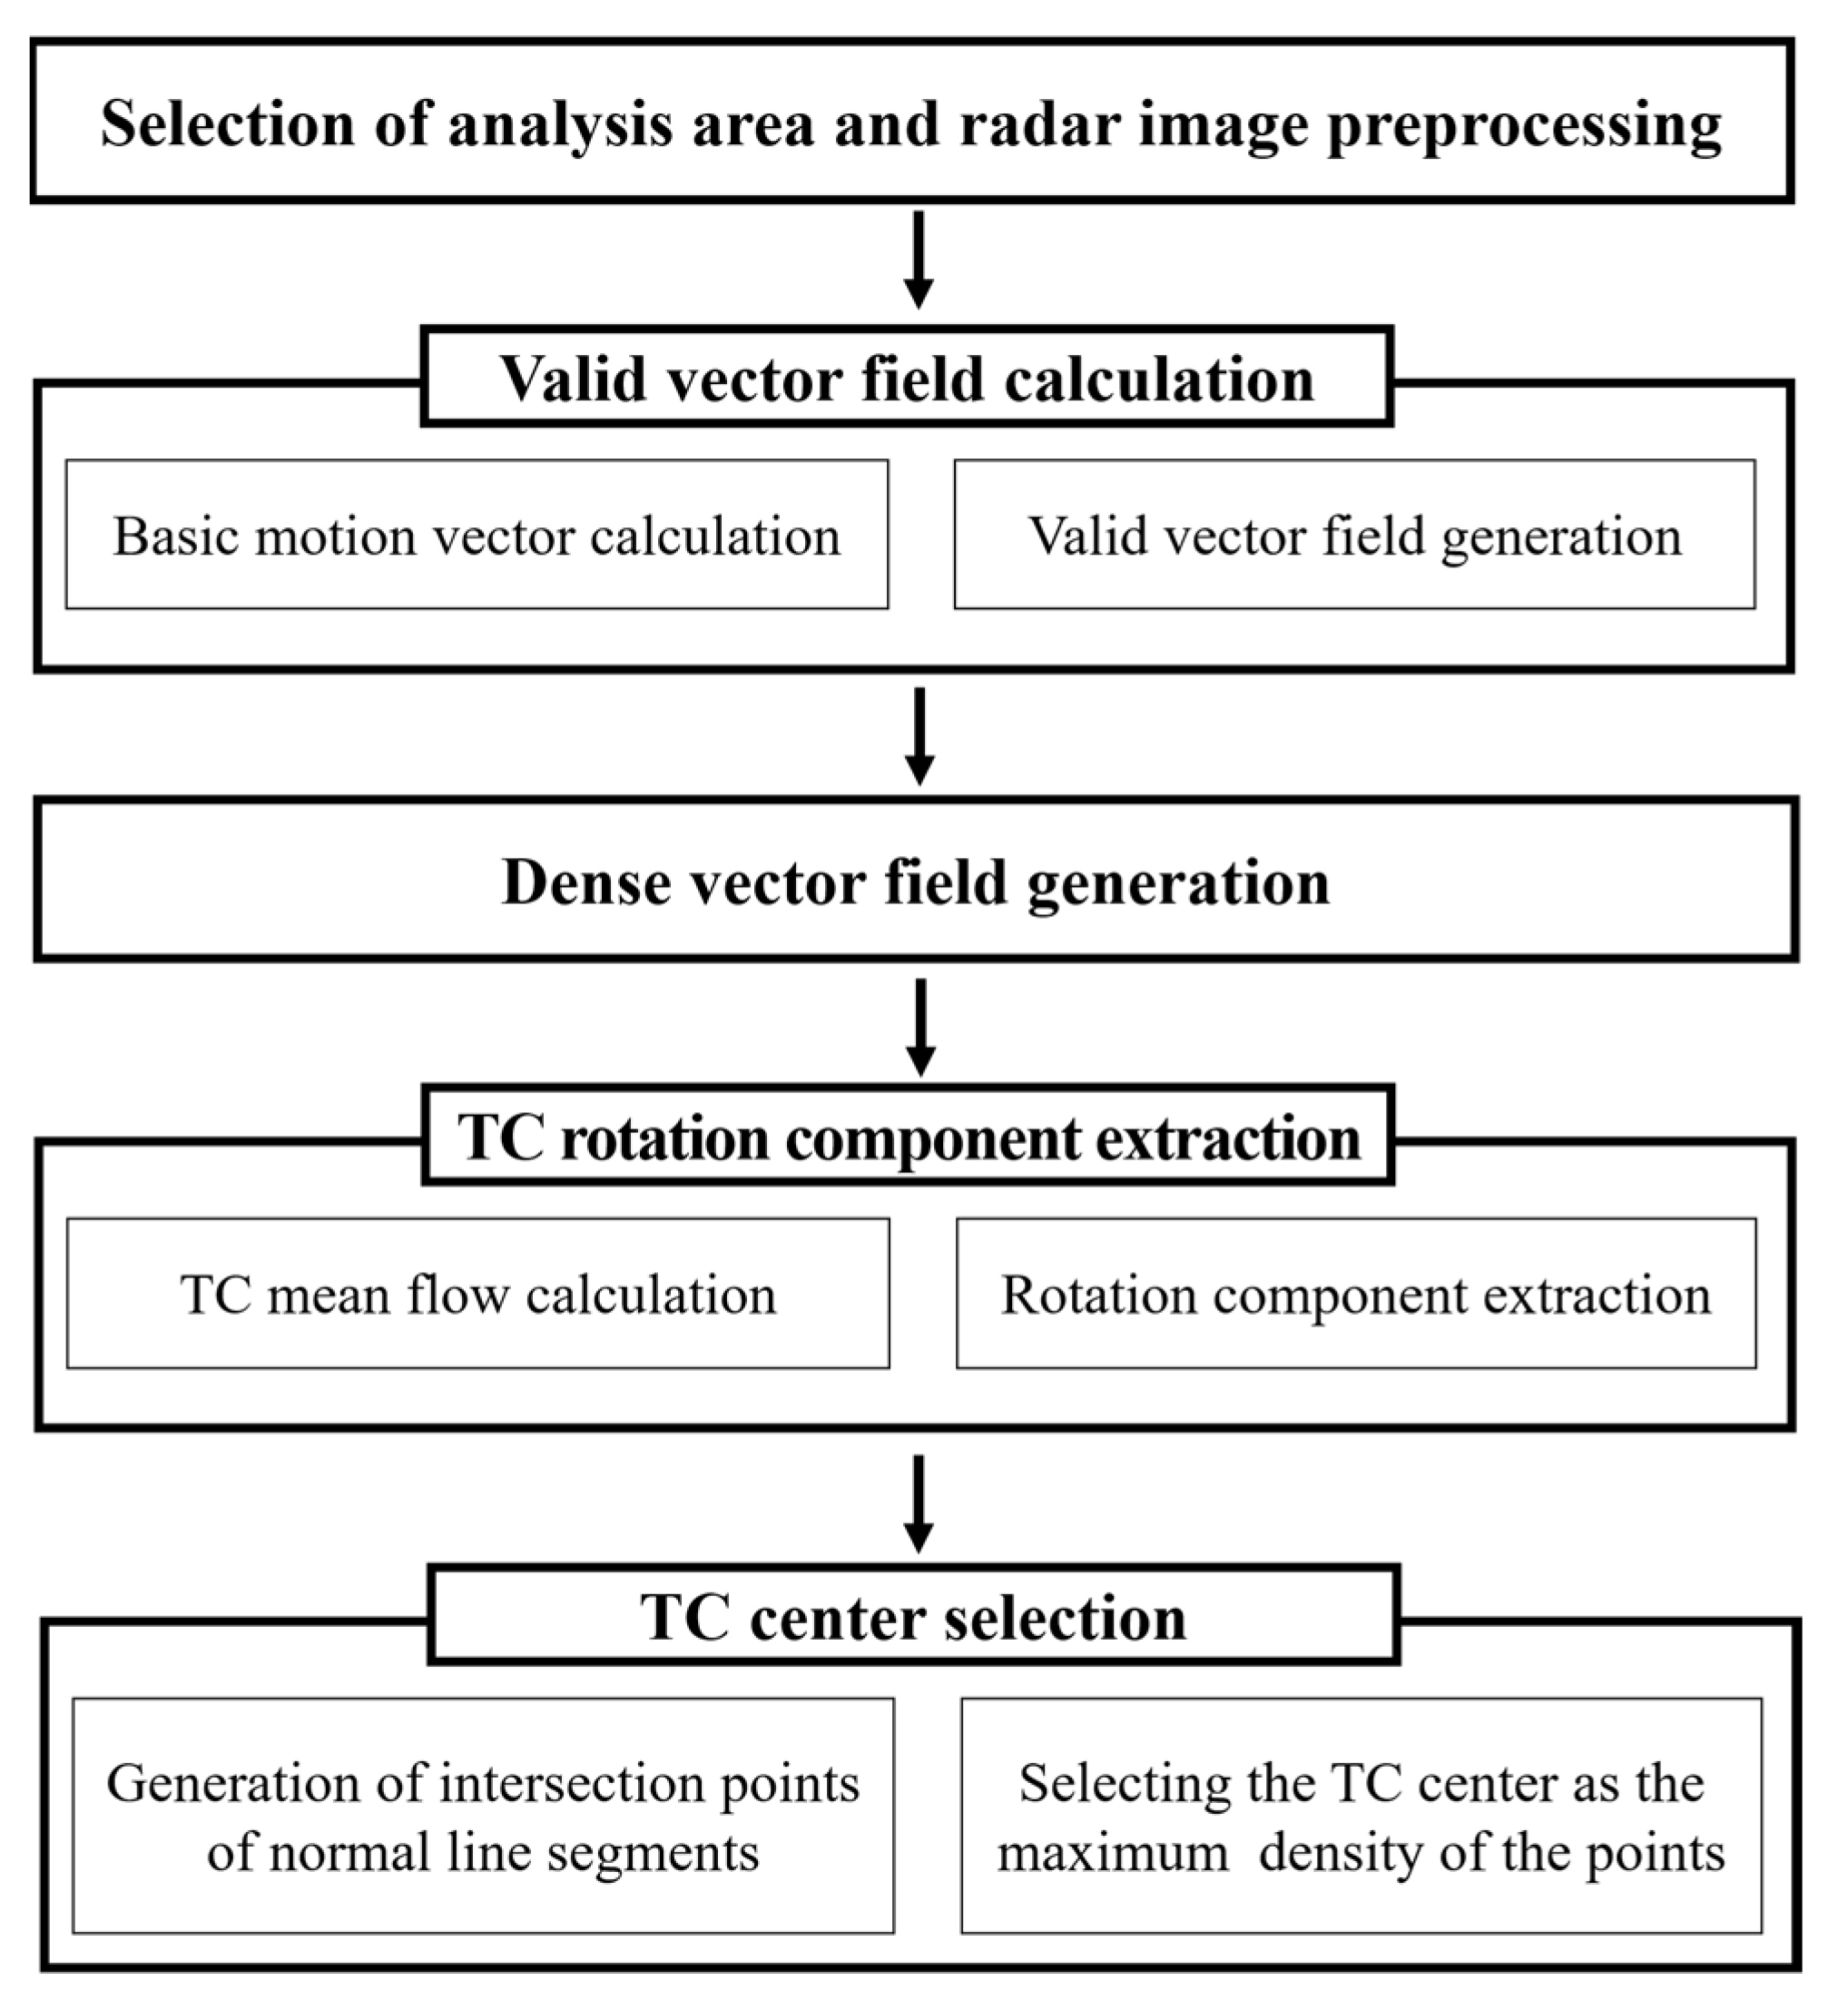
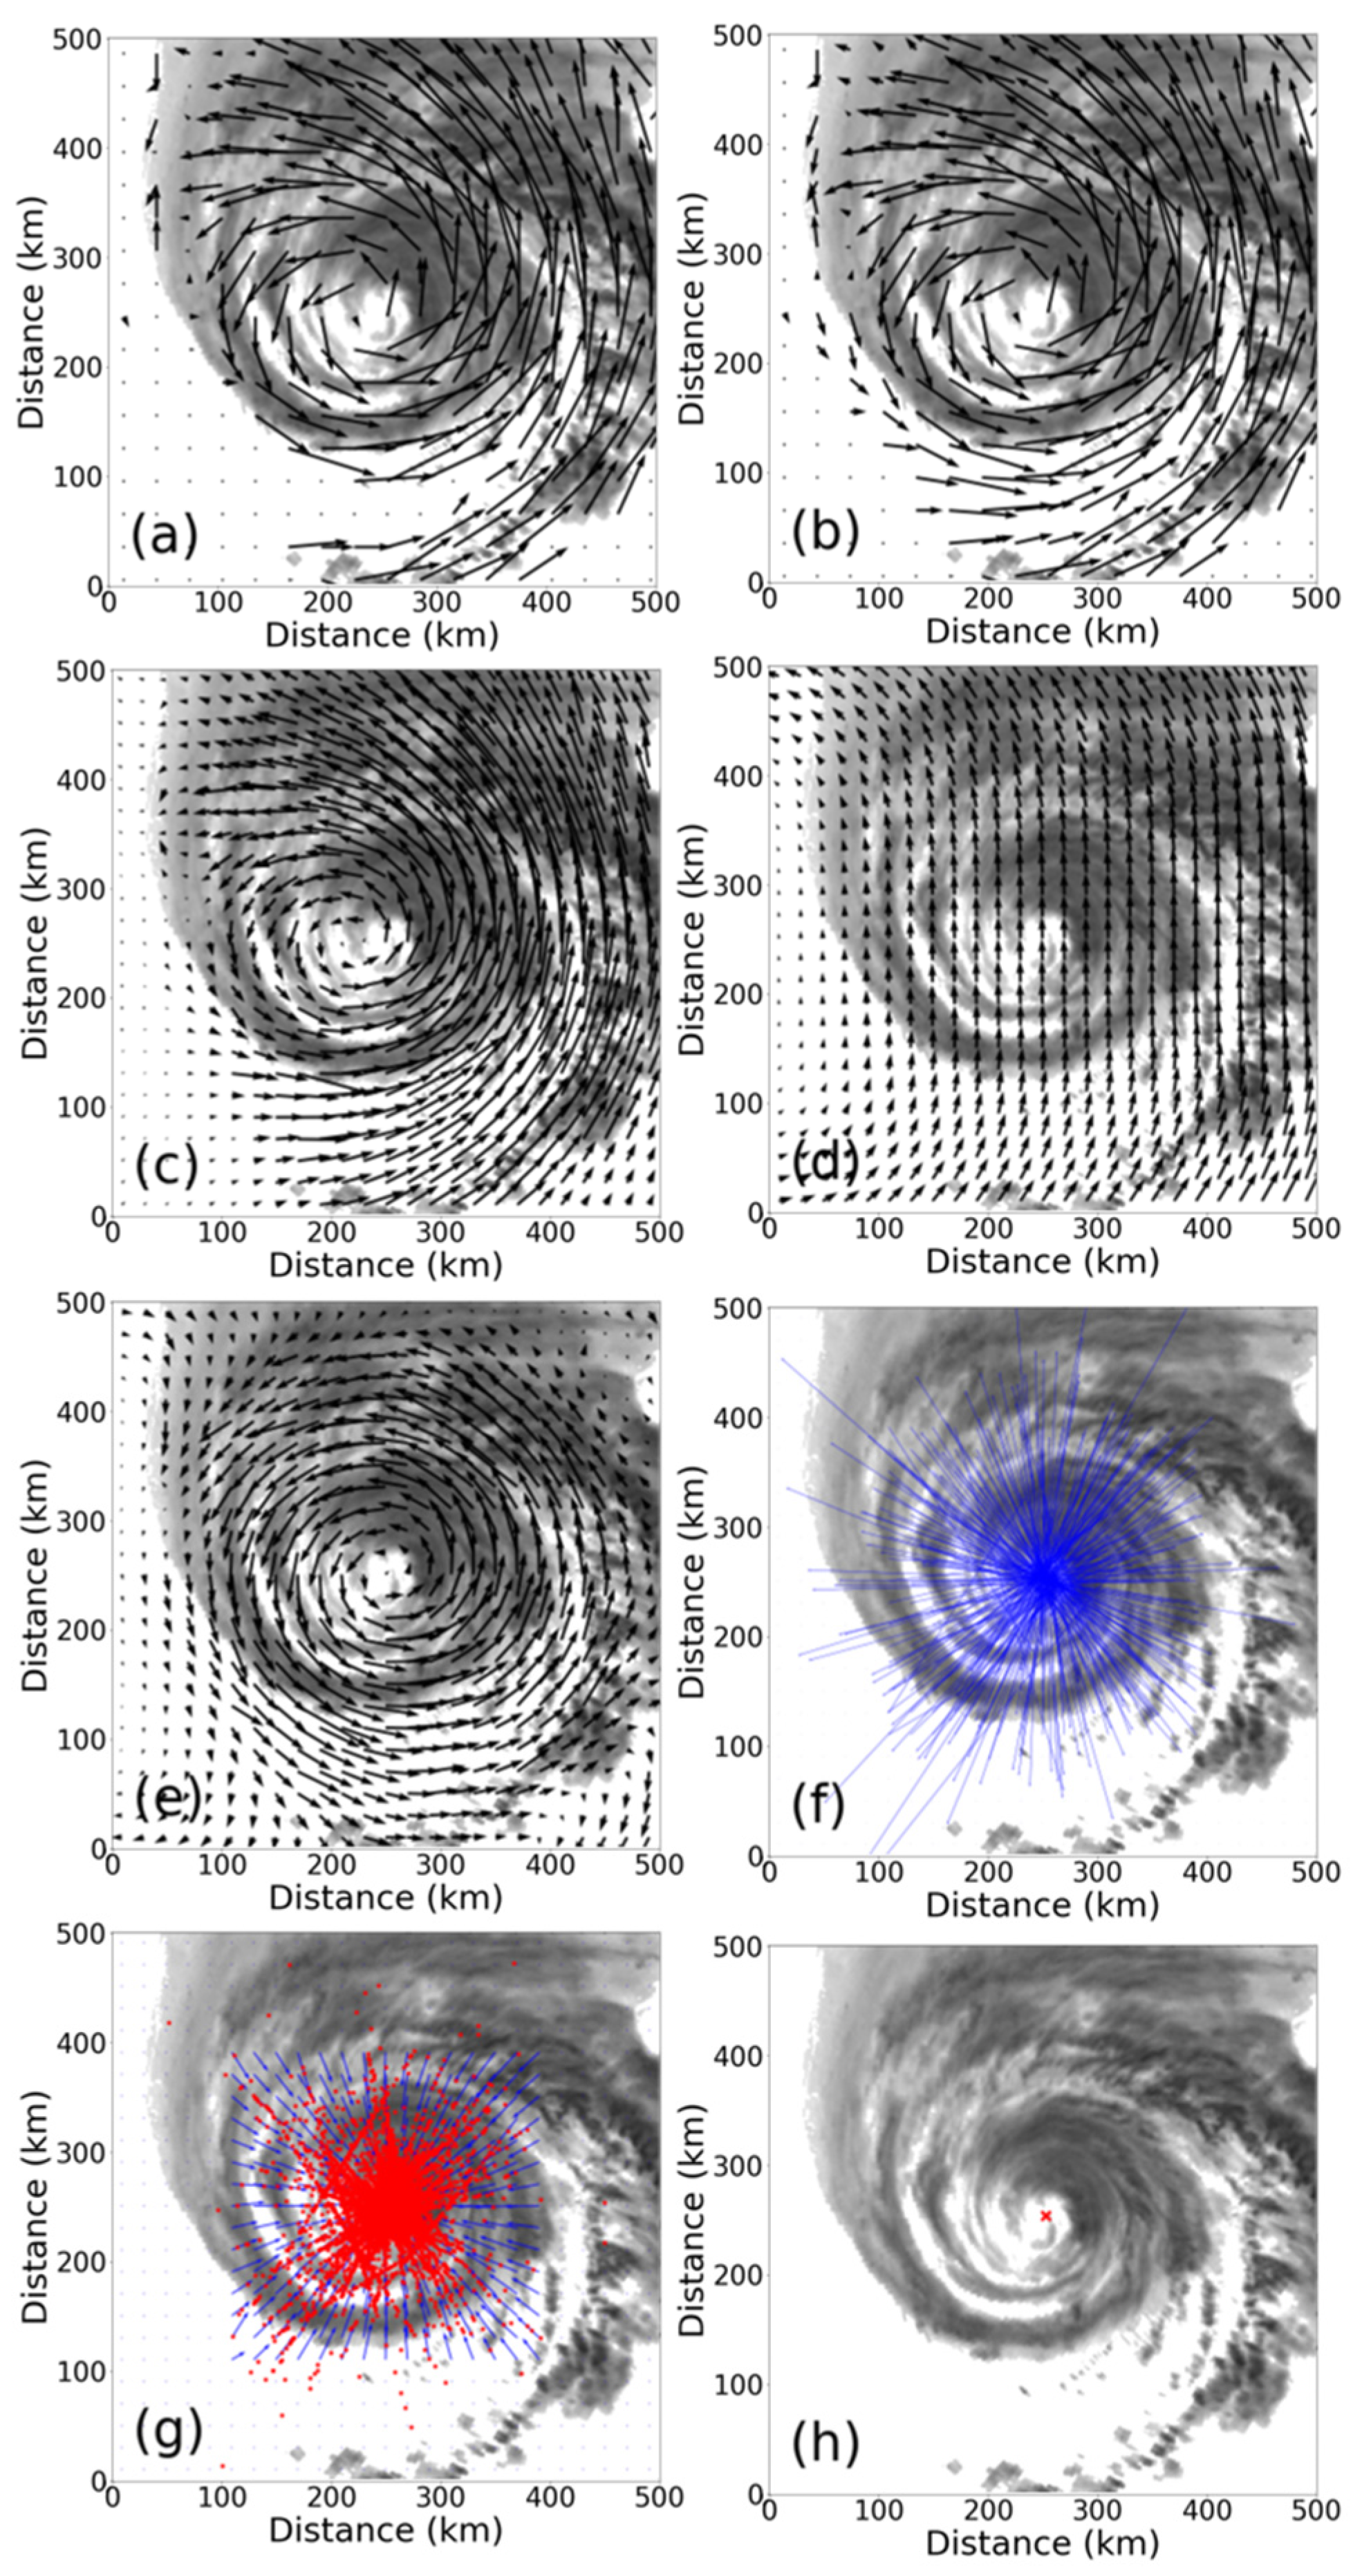
2.4. ACTION Methodology

Weather radar data are composed of multiple variables, including reflectivity, radial velocity, differential reflectivity, and differential phase shift, which are dual-polarization variables. Although comprehending the physical status of the precipitation system using these variables is possible, the major advantage of weather radar data is that it provides visual information about weather phenomena with high spatiotemporal resolution. The main feature of the ACTION algorithm is that it directly utilizes radar imagery. In the algorithm, the motion vector is extracted using the optical flow of the consecutive radar image changes. ACTION is primarily divided into four steps: (i) valid vector field calculation, (ii) dense vector field generation, (iii) TC rotation component extraction, and (iv) TC center selection. The flowchart is summarized in Figure 1. When a TC enters the radar observation radius, its analysis area is selected and the radar image to be used is preprocessed. The preprocessed radar image is input to the optical flow function to compute basic motion vectors and a valid vector field is generated by leaving only meteorologically meaningful vectors in the generated basic motion vectors. The valid vector field is regenerated into a dense vector field to extract the TC rotation component. Only this component is extracted by calculating and subtracting the mean flow of TC from the dense vector field. The normals of the extracted TC rotation component vectors are generated, and their maximum intersection point is selected as the TC rotation center. Detailed descriptions of each step are provided in the following sections.

2.4.1. Valid Vector Field Calculation

In the first step, basic motion vectors are extracted from continuous radar images through the optical flow technique. As optical flow is not intended to extract meteorologically meaningful vector fields, filtering out vectors with little meteorological significance is essential. Motion vectors lack meteorological significance when the u or v component has a value of 0. While an atmospheric flow with predominant u and v components may still exist, in meteorological terms, such a single u, v value persisting above a certain scale is extremely rare.
If the resolution is set too small, the generation of inhomogeneous vectors with major errors as well as the generation of unusual u and v vectors may occur. Using the dataset of 14 typhoons that affected the Korean Peninsula between 2018 and 2021 (Table 1), the error size of the inhomogeneous vector generated according to the change in resolution was confirmed to increase linearly with an increase in resolution (Figure 2). Motion vectors produced through the optical flow technique were delineated by detecting changes in the image pixels. If the resolution is too dense, extracting the continuity characteristics of the vector may be difficult. Therefore, setting an appropriate resolution according to the size of the area of analysis and the characteristics of the object to be analyzed is necessary. Figure 3 shows the number of pixels in the analysis field according to the resolution, the unusual u, v vector inclusion ratio, and the time required to create the vector intersection of each pixel when setting the TC center in the algorithm. A resolution of 40 km was determined to be an appropriate window size by considering the vector intersection creation time of ≤30, the number of at least 100 windows required for vector calculation, and the ratio containing the least abnormal u and v vectors when utilizing the algorithm.
As the motion vector can be calculated only in the region where the radar echo image exists, determining the total airflow required to derive the rotation component, which is a key factor for finding the center of the TC is necessary. In particular, if no radar echo and a high percentage of vector blank areas, which are areas where vectors are not calculated, are present, the accuracy of the TC center selection may be reduced. To minimize this problem in the algorithm, some vector blank areas of the radar echo proximity region are linearly interpolated using the neighboring vector data. The valid vector field is then calculated by removing a single u, v vector and averaging it with the previous motion vector field generated in the previous time. Figure 4 shows the radar reflectivity composite image of the 8th typhoon “BAVI” case at 14:00 KST on 26 August 2020. The red box is the area selected to calculate the valid vector field and is continuously updated over time based on the TC center position selected according to the operation of the ACTION algorithm. Figure 5a is the basic motion vector calculation and Figure 5b is the valid vector field.

2.4.2. Dense Vector Field Generation

As described above, among the methods of TC center selection using radar data, this study uses the approach that determines the maximum circulation of the TC center. In order to grasp the rotational flow of the TC more precisely, upscaling the vector resolution and interpolating far empty spots other than the area having radar echo is required. To create such a dense vector field, the resolution was increased from 40 to 20 km, and the vector empty area was interpolated using the radial basis function (RBF) to generate the dense motion vector field for the entire analysis field. Mathematically, the radial function is defined as a function of the distance from the origin to each point in the Euclidean space; hence, the RBF interpolation has the advantage of performing smooth interpolation in all areas while sufficiently maintaining the dominant vector flow characteristics. Figure 5c shows the dense vector field calculated through resolution upscaling and RBF interpolation, wherein, a dense and smooth vector field was produced while maintaining the dominant vector characteristics, making it possible to perform the subsequent background field removal and rotational component extraction more efficiently.

2.4.3. TC Rotation Component Extraction

The center of a TC can be regarded as a morphologically strong center of rotation. From a meteorological perspective, determining the TC center based on meteorological data such as air pressure and wind is also necessary, but the purpose of this study was to focus on the automatic selection of the TC centers using only radar image data. In order to solely extract the TC rotation component, the mean flow component of the entire analysis field should be separated and removed. To achieve this, the mean flow vector was obtained by calculating the average of the vectors while moving a 20-pixel window on the analysis field. Figure 5d shows the mean flow vector of the analyzed field calculated in this way, and Figure 5e illustrates the extraction of the TC rotation component by removing the mean flow vector. In the rotation vector field of the TC, the center can be selected as the convergence region of the rotation vector normal with consideration to the centripetal force principle of rotation.

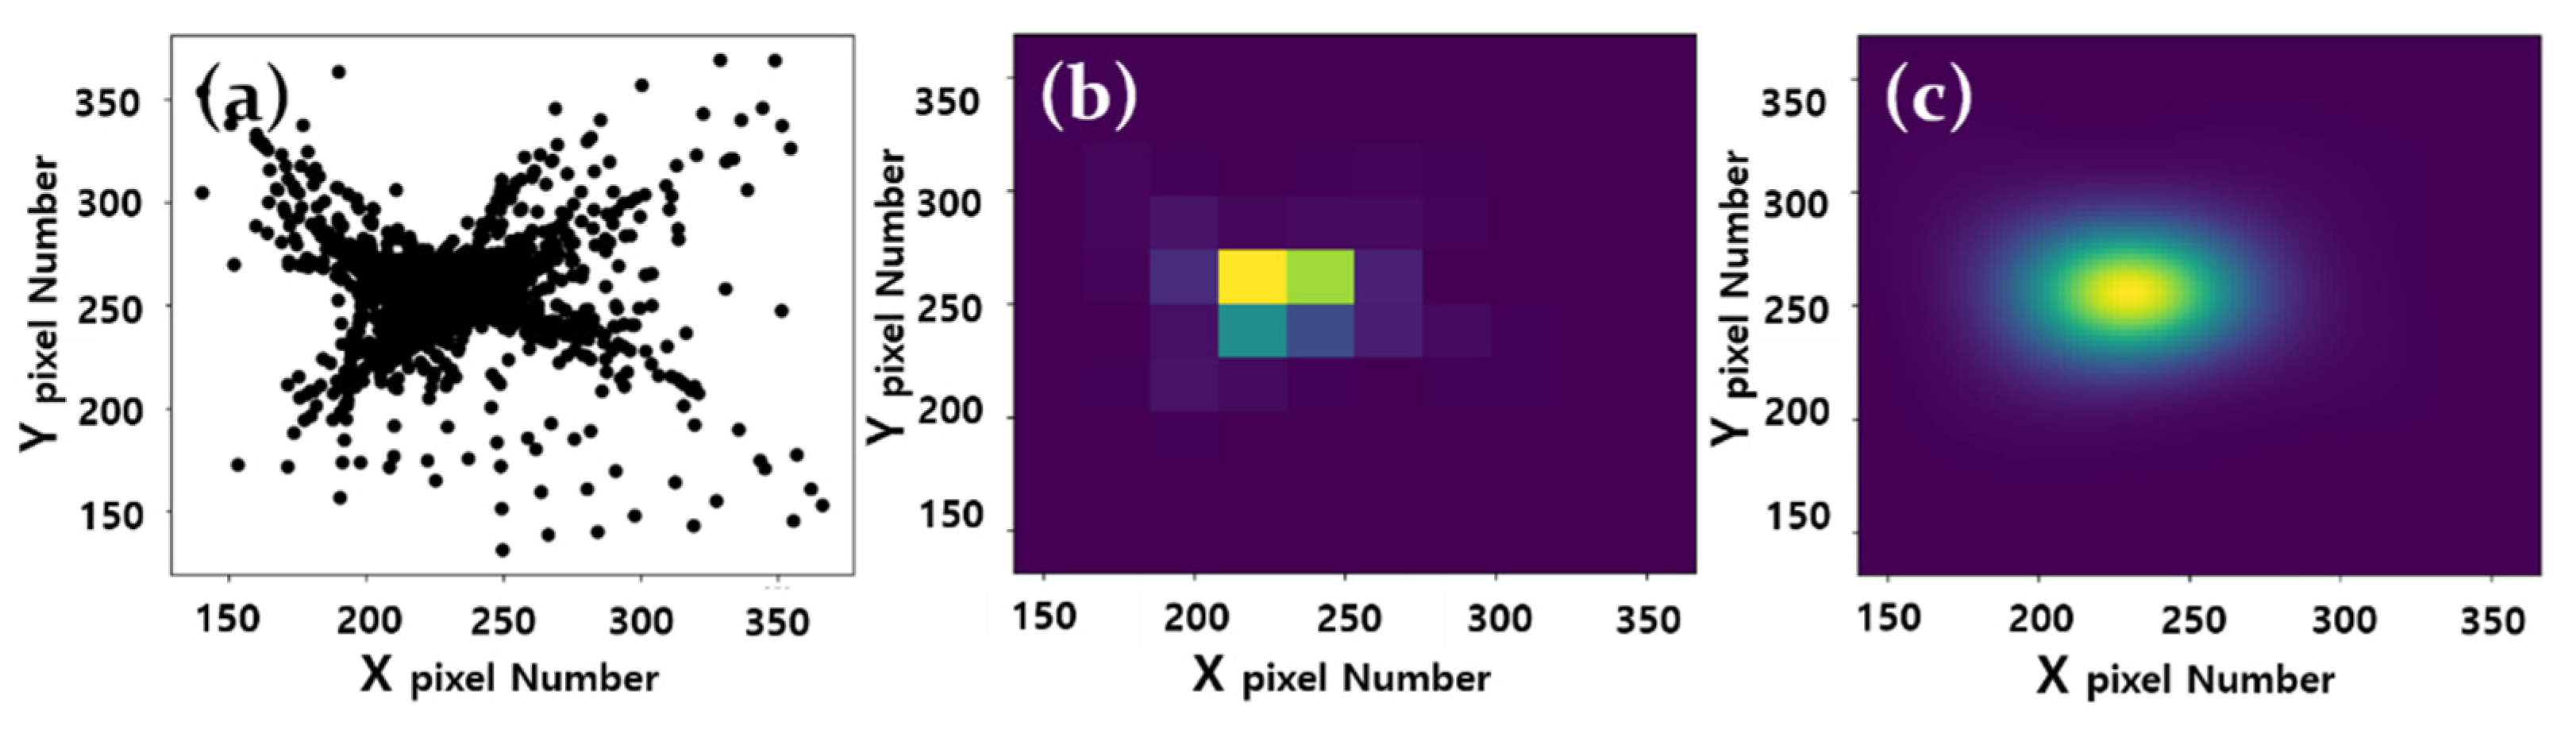
2.4.4. TC Center Selection

The center of the TC is determined in the ACTION algorithm by locating the convergence point of centripetal force, which is a virtual force acting in the direction of the center of rotation. Considering the counterclockwise rotation (in the northern hemisphere) of the TC an imaginary line segment of 90° is produced counterclockwise, and a length weight is applied to the normal to create intersection points. A weight of 30 was set in consideration of three items: the spatial resolution of the TC rotation component vector field of 20 km, the computing environment in which the algorithm is operated, and calculation time. This weight is appropriately adjusted according to the size of the analysis field to be analyzed, and the conditions of the computing environment. Figure 5f,g show the generation of intersection points of normal line segments to which the length weight is applied.
In the last step of the ACTION algorithm, the maximum density point among the intersection points is determined as the TC center. To establish the maximum density point, kernel density estimation (KDE) is used. The KDE technique compensates for the bin discontinuity of the two-dimensional histogram technique, which is usually the simplest form of density estimation, and can obtain a smooth-shaped probability density function. However, appropriate functions for efficient calculation and resolution of analysis data can be derived only by setting the appropriate bin size and band width. In this study, the bin size was set to 100 and the band width was set to 1. Figure 6 presents an example of the maximum density selection of the rotation vector normal intersection using the two-dimensional histogram and KDE technique, respectively, by applying the ACTION algorithm to the 5th typhoon case called “DANAS”, which occurred at 12:00 KST on 20 July 2019.

3. Results

In order to evaluate the performance of the ACTION algorithm, a total of 14 typhoons that affected the Korean Peninsula between 2018 and 2021 were analyzed (Table 1). Radar images of the lowest elevation angle of the radar reflectivity plan position indicator within 480 km were used. Since 2020, the radar observation time has improved from 10 to 5 min; thus, radar images at 10 min intervals during 2018–2019 and 5 min intervals during 2020–2021 were used for the evaluation. For each typhoon, the track generated by ACTION was compared to the corresponding best track data determined by the KMA based on ground meteorological data after the typhoon passed the Korean Peninsula.

3.1. Performance of the ACTION Algorithm

The major advantage of ACTION is that even when only a few radar echoes are present in the analysis area, it can still detect slight changes in the echoes and extract the central information of the TC. Figure 7 and Figure 8 show composite images of radar reflectivity for cases in which typhoons that affected the Korean Peninsula during 2018–2021 clearly showed their morphological characteristics. When selecting the center of a TC based on radar data, in the case of the methods using the TC geometry [15] or radar radial velocity information [10,16], calculating sufficient information is normally difficult if the radar echo itself is not sufficient. When this information is insufficient as the TC begins to enter the radar observation radius, or when its intensity is weakened after landing on the ground, the accuracy of the TC center information by these methods is likely to decrease. However, by using ACTION, despite the unclear geometrical characteristics of the TC (Figure 7e,g and Figure 8a), detecting the radar echo flow changes in the analysis area and calculating the TC center information is possible. As shown by the data listed in Table 2, ACTION results had an average detection rate of 80.8% within an error distance of 40 km for all 14 typhoons that were evaluated in this study. Among them, “JANGMI” and “HAISHEN”, whose morphological rotations were relatively well maintained in the typhoon’s movement path, showed a detection rate of 100% within an error distance of 40 km.
Figure 9 and Figure 10 compare the typhoon center calculated by ACTION every 10 min and the typhoon center selected by the KMA every hour for all 14 typhoon cases in the form of a track. In the figures, the red line indicates the typhoon center information calculated by ACTION, while the blue line indicates that selected by the KMA. In Figure 9 and Figure 10, the ACTION results are data at 10 min intervals showing the shaking of the typhoon center due to its rotation (see red lines). Meanwhile, because the typhoon center information selected by the KMA is displayed every hour, this fluctuation seems to have been somewhat alleviated (see blue lines). In the case of any given TC, because the movement of the synoptic barometer and rotational motion of the TC itself is complex, the center of the TC moves while shaking to some extent. Therefore, the continuous production of TC-centered information is incredibly useful for determining the boundaries of severe weather areas according to the movement of TCs, as well as for producing meteorological information. In the case of ACTION, it is useful for acquiring TC center location information in areas where direct observation data is difficult to utilize, such as over the open ocean. When the radar data in the observation area is sufficiently filled, it becomes simpler to determine the location of the center of the TC, even in sea areas, using a general radar image. However, as described above, when radar data are not uniformly distributed or when a TC has just entered within the radar observation radius, selecting a TC center using the characteristics of a general radar image is difficult. In this context, the results of ACTION for the 14 typhoon cases in this study are very encouraging.

3.2. Image Time Interval Change Effect

As an image processing technique, the basis of ACTION technology is that the shorter the interval between images, the better the performance, because if the interval between images is shortened, slight changes in the images are captured better, allowing high-quality motion vectors to be calculated. The Weather Radar Center of the KMA significantly improved their radar composite image generation time from 10 min to 5 min, hence when ACTION was applied, the results showed a noticeable performance improvement. As shown in Table 3, when images were used at 5 min intervals for five typhoons between 2020–2021, the average detection rate improved by 20% within an error distance of 20 to 40 km. When using the 5 min interval, the detection rate was over 85% within an error distance of 40 km, sufficient for the TC forecasting field. The acquisition of high-accuracy continuous TC location information enables more accurate hazard area setting and timely warning delivery in TC forecasting. Therefore, the use of ACTION, which is based on weather radar images with high temporal resolution, contributes to more accurate TC information production.

3.3. Utilization of ACTION

Since 2018, new research has been enabled by the expansion of the various uses of weather radar imagery through the development of ACTION. It has been recognized as an independent technology through Korean patent registration in 2020 and has been used for forecasting by the KMA since 2021. When a typhoon approaches the Korean Peninsula, as soon as it enters within the usable radar observation radius, ACTION is automatically executed and relevant information is calculated in real time. Currently, typhoon center information is produced every 10 min using a radar composite image of the Korean Peninsula at 5 min intervals, which is displayed along with the forecasted or selected path of typhoon by the KMA, and is readily available to analysts. This technology obtained a United States patent in 2022 and has been recognized at home and abroad; it is also being used as the basis for a new conceptual weather radar application to obtain real-time information in the field of weather forecasting. Figure 11 illustrates an example of ACTION being operated in real time by the KMA’s radar analysis system. The purple squares connected by purple lines indicate the typhoon center positions as derived through ACTION, and the blue circular connecting lines indicate the final typhoon center positions that were selected by the KMA.

4. Discussion

Most TC center selection studies using existing radar data use data values directly, but this study applies an image processing technique that maximizes the visibility of radar images. A weather radar is a major tool that enables weather forecasters to visually recognize precipitation in weather forecasting, and radar images themselves have a high value in the field. In addition, the ACTION technology, which quantitatively calculates changes in radar images and uses them for actual prediction, is meaningful. It can identify the movement characteristics of the echo even when many of the TC’s typical morphological characteristics have disappeared and it can be used in various aspects beyond simply calculating information about the TC. For example, by extracting the movement patterns of a precipitation system at various altitudes, it can determine the characteristics of a three-dimensional precipitation system or the retention of convective echoes in a specific area by accumulating motion vectors.
However, because the ACTION algorithm utilizes change information between radar images, uniform radar images are required at regular intervals. In case of radar failure, intermittent image changes can immediately be resolved by inserting the image uniformity check process into the algorithm, but if the range or shape of the radar image changes irregularly over a long period of time, the accuracy of the ACTION results may be reduced. In addition, if a TC lands in a high-altitude terrain, such as a mountainous area, the radar echo of the lower layer may not follow the actual movement of the TC and may partially stagnate due to the terrain effect, resulting in slightly less accurate ACTION results. However, looking at the areas affected by terrain effects differently, we can expect another use of the ACTION technique. The degree of inclination of the TC can be determined based on the change information in the movement of the upper and lower layers of the TC according to the topography. Although not introduced in this paper, meaningful results were confirmed in an experiment to derive the distance and direction differences of the TC center position from lower and upper radar images. Hopefully, more detailed research results in this field will be introduced in future papers after performing additional validation studies.
The ACTION technique effectively uses radar images in actual weather forecasting by focusing on the most basic aspects of radar data utilization. Of course, in order to utilize it, the uniform output of radar images, sufficient quality control, and detailed setting adjustments according to the computing environment of the institution that wants to implement the technology must be preceded. However, this technology has great significance as it can enable various uses of weather radar data.

5. Conclusions

The ACTION algorithm automatically estimates the TC center from operational radar imagery using the optical flow image processing technique. In the algorithm, a motion vector that explains the flow of a TC is calculated by extracting changes between successive radar images generated at regular time intervals. Gunnar Farneback’s algorithm [14] is then applied to perform dense vector extraction of each image pixel. In this study, the operational weather radar reflectivity composite images produced at 5–10 min intervals were first converted into grayscale to perform ACTION. Then, using 14 typhoon cases that affected the Korean Peninsula between 2018–2021, an appropriate basic motion vector generation resolution (40 km) was determined by comprehensively considering the computational calculation time and unusual vector calculation rate appropriate for real-time operation. Each TC center was finally determined through a series of basic motion vector generations, valid vector extraction, dense vector interpolation, background flow field removal, typhoon rotation components extraction, and tangential vector maximum junction generation.
This study verified the performance of ACTION through the analysis of the 14 typhoon cases. In comparing the ACTION performance results with the best tracks selected by the KMA based on various weather observation data, ACTION showed a high detection rate of 80.8% within an error distance of 40 km. Moreover, the typhoons with well-maintained morphologies showed a 100% detection rate. In this verification process, the improved time interval (from 10 to 5 min) of the images used in ACTION was confirmed to have greatly enhanced the accuracy of the technique; the performance improved by about 20% within an error distance of 20–40 km.
The main advantage of ACTION is its ability to automatically generate central information about a TC even when uniform radar data do not exist within the radar observation radius, or when a TC has just entered within it. Its ability to calculate and utilize new types of information by using the high visibility of radar images beyond the use of radar data is also encouraging. We expect that ACTION will contribute to improving the value of weather radar data by producing real-time automatic detection information of the TC center using image processing technology, a novel approach in the field of weather radar. This technology has been applied and operated in real time since 2021 by the KMA, and its originality has been recognized by Korean and United States patents. In the future, based on ACTION technology, we plan to conduct further applied research such as three-dimensional structural analysis of TCs using weather radar images at various altitudes.

6. Patents

Korean patent (Patent Number: 10-2239386), United States patent (Patent Number: US 11,333,795 B2) “Method for typhoon center automatic selection using vectors calculated from radar image data by optical flow technique, recording medium and device for performing the method.”

Author Contributions

This work was supported by significant contributions from all the authors. Conceptualization, S.-J.M. and J.-Y.G.; methodology, S.-J.M. and J.-Y.G.; software, S.-J.M.; validation, S.-J.M. and J.-Y.G.; formal analysis, S.-J.M. and J.-Y.G.; investigation, J.-Y.G.; writing—original draft preparation, J.-Y.G.; writing—review and editing, J.-Y.G.; visualization, S.-J.M. and J.-Y.G.; supervision, J.-Y.G.; project administration, J.-Y.G.; funding acquisition, J.-Y.G. All authors have read and agreed to the published version of the manuscript.

Funding

This research was supported by the grants “Development of analysis technologies for local-scale weather radar network and next generation radar (KMA2021-03221)” and “Development of radar based severe weather monitoring technology (KMA2021-03121)” of the “Development of integrated application technology for Korea weather radar project” funded by the Weather Radar Center, Korea Meteorological Administration.

Institutional Review Board Statement

Not applicable.

Informed Consent Statement

Not applicable.

Data Availability Statement

No new data were created.

Acknowledgments

Authors are very grateful to the members of the Radar Analysis Division, Weather Radar Center for their support of this research.

Conflicts of Interest

The authors declare no conflict of interest.

Appendix A

The default setting parameters for a Python function that computes optical flow based on Farneback’s method are “flow = cv2.calcOpticalFlowFarneback(prev, next, flow, pyr_scale, levels, winsize, iterations, poly_n, poly_sigma, flags).” The function was executed as “flow = cv2.calcOpticalFlowFarneback(prev, next, flow, pyr_scale = 0.5, levels = 3, winsize = 15, iterations = 10, poly_n = 10, poly_sigma = 1.2, flags = 0).” The set values were adjusted and used according to each research environment.
The role of each parameter in the OpenCV function is as follows: prev is the first input image; next is the second input image of the same type and size as prev; pyr_scale specifies the image scale; levels specifies the image layer; winsize is the averaging window size; iterations specifies the number of iterations to be performed at each level; poly_n designates the size of the pixel neighborhood used to find polynomial expansion for each pixel; poly_sigma is the Gaussian standard deviation used to smooth derivatives for the polynomial expansion; flow is the computed flow image that has a similar size and type as prev; and “flags” indicates the operation flags (the function used cv2.OPTFLOW_FARNEBACK_GAUSSIAN).

References

  1. Kepert, J.D. Tropical Cyclone Structure and Dynamics. In World Scientific Series on Asia-Pacific Weather and Climate; Chan, J.C.L., Kepert, J.D., Eds.; World Scientific Publishing Company: Singapore, 2010; Volume 4, pp. 3–53. [Google Scholar] [CrossRef]
  2. Wimmers, A.J.; Velden, C.S. Advancements in Objective Multi Satellite Tropical Cyclone Center Fixing. J. Appl. Meteorol. Climatol. 2016, 55, 197–212. [Google Scholar] [CrossRef]
  3. Jin, S.; Wang, S.; Li, X.; Jiao, L.; Zhang, J.A.; Shen, D. A Salient Region Detection and Pattern Matching-Based Algorithm for Center Detection of a Partially Covered Tropical Cyclone in a SAR Image. IEEE Trans. Geosci. Remote Sens. 2017, 55, 280–291. [Google Scholar] [CrossRef]
  4. Lam, C.Y. Operational Tropical Cyclone Forecasting from the Perspective of a Small Weather Service. In Proceedings of the ICSU/WMO International Symposium on Tropical Cyclone Disasters, Beijing, China, 12–16 October 1992. [Google Scholar]
  5. Dvorak, V.F. Tropical Cyclone Intensity Analysis and Forecasting from Satellite Imagery. Mon. Weather Rev. 1975, 103, 420–430. [Google Scholar] [CrossRef]
  6. Hasler, A.F.; Palaniappan, K.; Kambhammetu, C.; Black, P.; Uhlhorn, E.; Chesters, D. High Resolution Wind Fields Within the Inner-Core and Eye of a Mature Tropical Cyclone from GOES 1-Min Images. Bull. Am. Meteor. Soc. 1998, 79, 2483–2496. [Google Scholar] [CrossRef]
  7. Wimmers, A.; Velden, C. Satellite-Based Center-Fixing of Tropical Cyclones; New Automated Approaches. In Proceedings of the 26th Conference on Hurricanes and Tropical Meteorology, Miami, FL, USA, 3 May 2004. [Google Scholar]
  8. Griffin, J.S.; Burpee, R.W.; Marks, F.D., Jr.; Franklin, J.L. Real-Time Airborne Analysis of Aircraft Data Supporting Operational Hurricane Forecasting. Weather Forecast. 1992, 7, 480–490. [Google Scholar] [CrossRef]
  9. Wood, V.T.; Brown, R.A. Effects of Radar Proximity on Single-Doppler Velocity Signatures of Axisymmetric Rotation and Divergence. Mon. Weather Rev. 1992, 120, 2798–2807. [Google Scholar] [CrossRef]
  10. Wood, V.T. A Technique for Detecting a Tropical Cyclone Center Using a Doppler Radar. J. Atmos. Ocean. Technol. 1994, 11, 1207–1216. [Google Scholar] [CrossRef]
  11. Willoughby, H.E.; Chelmow, M.B. Objective Determination of Hurricane Tracks from Aircraft Observations. Mon. Weather Rev. 1982, 110, 1298–1305. [Google Scholar] [CrossRef]
  12. Dodge, P.; Burpee, R.W.; Marks, F.D., Jr. The Kinematic Structure of a Hurricane with Sea Level Pressure Less Than 900mb. Mon. Weather Rev. 1999, 127, 987–1004. [Google Scholar] [CrossRef]
  13. Marks, F.D.; Houze, R.A.; Gamache, J.F. Dual-Aircraft Investigation of the Inner Core of Hurricane Norbert. Part I: Kinematic Structure. J. Atmos. Sci. 1992, 49, 919–942. [Google Scholar] [CrossRef]
  14. Farnebäck, G.; Motion, T.-F. Estimation Based on Polynomial Expansion. In Proceedings of the 13th Scandinavian Conference on Image Analysis (SCIA), Halmstad, Sweden, 29 June 2003. [Google Scholar]
  15. Chang, P.-L.; Jong-Dao Jou, B.J.-D.; Zhang, J. An Algorithm for Tracking Eyes of Tropical Cyclones. Weather Forecast. 2009, 24, 245–261. [Google Scholar] [CrossRef]
  16. Lee, W.-C.; Marks, F.D., Jr. Tropical Cyclone Kinematic Structure Retrieved from Single-Doppler Radar Observations. Part Ⅱ: The GBVTD-Simplex Center Finding Algorithm. Mon. Weather Rev. 2000, 128, 1925–1936. [Google Scholar] [CrossRef]
Figure 1. Flowchart of the ACTION algorithm methodology.
Atmosphere 14 00168 g001
Figure 2. Inhomogeneous vector maximum error mean according to resolution changes of the motion vector calculation for 14 typhoon cases from 2018 to 2021.
Atmosphere 14 00168 g002
Figure 3. The calculation time (small dotted line) required to create the vector intersection of each pixel, the number of windows (thick dotted line) in the analysis field, and the unusual u and v vector generation rate (solid line) according to resolution (window size) when running the ACTION algorithm. Appropriate resolution selection conditions (black-outlined data) suitable for motion vector generation (computation time ≤30, number of windows 100 or more, minimum abnormal u and v vector generation rate).
Atmosphere 14 00168 g003
Figure 4. (a) Radar reflectivity and (b) grayscale converted composite images of the 8th typhoon case named “BAVI”, at 14:00 KST on 26 August 2020. The red boxes denote the valid vector calculation areas (500 × 500 km) used in the ACTION algorithm.
Atmosphere 14 00168 g004
Figure 5. ACTION algorithm process: (a) basic motion vector calculation, (b) valid vector field calculation, (c) dense vector field generation, (d) background airflow extraction, (e) TC rotation component extraction, (f) tangential(blue line) intersection generation of rotation components, (g) intersection(red dot) maximum density calculation, and (h) TC center selection.
Atmosphere 14 00168 g005
Figure 6. An example of the maximum density selection of (a) intersection points of the rotation vector normal lines using the (b) two-dimensional histogram and (c) kernel density function technique on the 5th typhoon case called “DANAS”, at 12:00 KST on 20 July 2019.
Atmosphere 14 00168 g006
Figure 7. Composite images of radar reflectivity of typhoons that affected the Korean Peninsula between 2018–2019: (a) “PRAPIROON”, (b) “SOULIK”, (c) “KONG-REY”, (d) “DANAS”, (e) “FRANCISCO”, (f) “LINGLING”, (g) “TAPAH”, and (h) “MITAG”.
Atmosphere 14 00168 g007
Figure 8. Composite images of radar reflectivity of typhoons that affected the Korean Peninsula between 2020–2021: (a) “JANGMI”, (b) “BAVI”, (c) “MAYSAK”, (d) “HAISHEN”, (e) “OMAIS”, and (f) “CHANTHU”.
Atmosphere 14 00168 g008
Figure 9. Comparison of ACTION results and KMA best track of typhoons that affected the Korean Peninsula between 2018–2019: (a) “PRAPIROON”, (b) “SOULIK”, (c) “KONG-REY”, (d) “DANAS”, (e) “FRANCISCO”, (f) “LINGLING”, (g) “TAPAH”, and (h) “MITAG”.
Atmosphere 14 00168 g009
Figure 10. Comparison of ACTION results and KMA best track of typhoons that affected the Korean Peninsula between 2020–2021: (a) “JANGMI”, (b) “BAVI”, (c) “MAYSAK”, (d) “HAISHEN”, (e) “OMAIS”, and (f) “CHANTHU”.
Atmosphere 14 00168 g010
Figure 11. An example of ACTION being operated in real time by the KMA’s radar analysis system (typhoon case of “OMAIS”, occurring at 00:00 KST, 24 August 2021).
Atmosphere 14 00168 g011
Table 1. List of typhoons that affected the Korean Peninsula between 2018–2021.
No.TyphoonYearPeriod
1PRAPIROON201829 Jun–4 Jul
2SOULIK201816–25 Aug
3KONG-REY201829 Sep–7 Oct
4DANAS201916–20 Jul
5FRANCISCO20192–6 Aug
6LINGLING20192–8 Sep
7TAPAH201919–23 Sep
8MITAG201928 Sep–3 Oct
9JANGMI20209–10 Aug
10BAVI202022–27 Aug
11MAYSAK202028 Aug–3 Sep
12HAISHEN20201–7 Sep
13OMAIS202120–24 Aug
14CHANTHU20217–18 Sep
Table 2. Detection rate by error distance of ACTION results for typhoons that affected the Korean Peninsula between 2018–2021.
No.TyphoonYearDetection Rate Within ** Error Distance (%)
** 40 km** 30 km** 20 km** 10 km** 5 km
1PRAPIROON201856.635.716.33.10.0
2SOULIK201887.872.333.58.62.5
3KONG-REY201876.648.725.29.00.9
4DANAS201983.261.831.57.91.1
5FRANCISCO201987.454.025.35.81.2
6LINGLING201951.833.313.55.00.7
7TAPAH201971.151.825.310.82.4
8MITAG201957.229.54.60.60.0
9JANGMI2020100.096.672.427.66.9
10BAVI202088.171.958.121.31.3
11MAYSAK202089.983.748.87.00.0
12HAISHEN2020100.064.526.36.61.3
13OMAIS202196.572.133.72.30.0
14CHANTHU202185.375.354.78.00.7
Mean:80.860.833.58.81.4
Table 3. Detection rate by error distance of ACTION results according to radar image interval improvement (from 10 to 5 min) for typhoons that affected the Korean Peninsula between 2020–2021.
Image
Interval
TyphoonYearDetection Rate within ** Error Distance (%)
** 40 km** 30 km** 20 km** 10 km** 5 km
10 minJANGMI2020100.087.958.624.15.2
BAVI202065.046.921.97.51.9
MAYSAK202076.060.521.71.60.0
HAISHEN202058.429.210.10.00.0
OMAIS202170.947.715.10.00.0
CHANTHU202178.766.040.06.01.3
Mean:74.856.427.96.51.4
5 minJANGMI2020100.096.672.427.66.9
BAVI202088.171.958.121.31.3
MAYSAK202089.983.748.87.00.0
HAISHEN2020100.064.526.36.61.3
OMAIS202196.572.133.72.30.0
CHANTHU202185.375.354.78.00.7
Mean:93.377.349.012.1.7
Mean of improved detection rates:18.521.021.15.60.3
Disclaimer/Publisher’s Note: The statements, opinions and data contained in all publications are solely those of the individual author(s) and contributor(s) and not of MDPI and/or the editor(s). MDPI and/or the editor(s) disclaim responsibility for any injury to people or property resulting from any ideas, methods, instructions or products referred to in the content.

