Abstract
The purpose of this study was to examine the potential effect of solar energy on vascular stroke mortality in a Greek region by using neural networks analysis. The time period studied was from 1985 to 1989. We employed the Active Cavity Radiometer Irradiance Monitoring (ACRIM) data as the main representatives of total solar irradiance (TSI) and correlated them with stroke deaths obtained from the Piraeus City Registry. The ACRIM data (parameters included TSI, TSI uncertainty, and EPOCH: time given by ACRIM) were correlated with stroke deaths using Principal Components Analysis (PCA), regressions, and, finally, neural networks. TSI was the most important parameter for the years 1985, 1986, 1987, and 1989, while EPOCH: time given by ACRIM was important for the year 1988. When considering the entire period 1985–1989, the key parameter emerged was EPOCH: time given by ACRIM. Neural networks are useful tools in exposomic investigation regarding solar energy and vascular strokes.
1. Introduction
The solar power output (i.e., energy per unit area) is realised by means of photon emission over the entire electromagnetic spectrum. This output has been collectively coined “total solar irradiance” (TSI). Despite the potential long-term trends in the TSI (e.g., [1,2]), whose impact on terrestrial climate is widely debated [3,4,5], the baseline TSI stemming from activity in the solar core is remarkably constant at the order of 1360–1370 W/m2, depending on the particular radiometer used for the measurement (see, e.g., Fröhlich 2013 and references therein). This number has been commonly called the “solar constant”, and constitutes the single most reliable source of information for the solar energy production. Small-scale variations of the “solar constant” TSI may be due to superposition of plasma convection and acoustic oscillations in the solar photosphere [6]; however, the best-known periodic variation is that of the 11-year solar cycle spurred by sunspot activity manifested in the photosphere and above. The sunspot activity originates at the so-called tachocline, namely, the lower boundary of the solar convection zone (see [7], and references therein). The sunspot cycle adds a variation of less than 0.2%, in accordance with the solar cycle, meaning, for instance, that the TSI increases by ≲3 W/m2 in solar maximum (more sunspots) and falls to nominal values at solar minimum (fewer sunspots), as shown in Figure 1 of [8]. The sunspot cycle produces eruptive and non-eruptive magnetic activity in the magnetized solar corona, whose electromagnetic spectral imprint is the cause of the above periodic TSI variation.
Vascular strokes rank second in the causality of death, globally [9,10], representing a severe manifestation of the chronic non-communicable diseases (NCDs). Prevention and treatment of these disorders and, hence, stokes, reside in proper lifestyle changes, i.e., limiting sugar/fat intake, increasing physical activity, sleeping properly, discontinuing smoking, controlling arterial blood pressure, and/or receiving appropriate medications, if necessary. Its risk factors involve several underlying diseases, such as overweight and obesity, chronic obstructive lung disease, diabetes mellitus, renal insufficiency, and genetic and epigenetic predisposition [11]. Stroke morbidity and mortality rates vary upon ethnicity, and socioeconomic class, as well as some unknown reasons. On the other hand, humans have adaptive powers to cope with extrinsic influences and to maintain their homeostasis.
The contribution of ambient solar activity to the pathology of strokes has been established [10,12,13]. In previous work, we had shown a common chronome of stroke mortality incidence and sunspot numbers, thus, solar activity [10]. In this work, we intend to extend the earlier analysis to the implications of solar irradiance for stroke deaths in a human population, granted that solar activity and solar irradiance correlate to each other in a non-linear manner [14]. The aim of this work is to establish prediction of stoke deaths under the influence of solar energy exposure in the period 1985–1989.
2. Materials and Methods
The stroke death events were collected in the archives of Piraeus Civil Registry and published in [15]. The events calculation was based on the underlined cause of death data (ICD-9 Table 5.3: recode 430, Table 5.4: recode 200) [10]. The total solar irradiance was provided by the Active Cavity Radiometer Irradiance Monitoring (ACRIM), constructed by the University of California https://www.ngdc.noaa.gov/stp/solar/solarirrad.html#acrim (accessed Wed, 20 April 2011). We downloaded and considered the following factors: TSI, TSI UNCERTAIN, and EPOCH.
The methodology of this this study is driven by its scopes:
- Classifying the importance of the certain factors (input), using neural network modelling;
- Gauging the predictive power of the proposing model using classification techniques.
Probabilistic assessment of the likelihood of life events and human activities is of high priority in phenomena of high variability and dimensionality, such as space weather and space climate forecasting, chronomics and exposomics, as well as chronotherapeutics orientation.
Logistic regression, artificial neural networks, k- nearest neighbour, and decision trees are used for constructing predictive models based on probability of class membership. We opted to adopt the neural network method, as: (i) it is an established method (>8500 publications so far), (ii) the loss of information along the way is inconsequential, (iii) without the hidden layer, the neural networks are identical to logistic regression; thus, the neural networks are more flexible, informative and accurate as the hidden layers are non-linear functions of the inputs [16], and (iv) the input factors of our input are numerical, of unknown power, and high dimensional. Thus, the network gains the ability to assimilate more information about the input data and greater complexity of interactions between of neurons that are created.
The techniques of classification (or otherwise categorisation), typically use a training set, where all the objects are already linked to known classes. In neural networks modelling, the algorithm classifier “learns” from this set, using this learning to build a model, and this model then classifies new objects in the appropriate classes [17,18,19,20].
A categorisation process can be defined as the process of two specific steps:
- Building a data model under learning;
- Applying the model to the data set.
Regarding the effect of the factors influencing the stroke mortality (dependent variable), a neural network was created, taking into consideration the following independent parameters (input): TSI, TSI UNCERTAIN, EPOCH, and STROKE DEATHS, where: TSI: satellite total irradiance observations by the Jet Propulsion Laboratory (JPL) of the California Institute of Technology, TSI UNCERTAIN: the uncertainty of the measured given by ACRIM satellites, and EPOCH: time given by ACRIM.
- 3.
- Results
The main created neural network model is presented in Figure 1. The idea behind it is to predict the stroke deaths from the total solar irradiance during 1985–1989, based on the importance of the parameters that affect TSI.

Figure 1.
Neural network model.
The model xj i = 1,..,n consists of the proposing parameters (input) and wkj i = 1,..,n represents the corresponding weights for neuron k, the bias bk is the effect of increasing or decreasing the input of the function activation, depending on whether it is positive or negative, respectively. It might be considered a threshold factor; vj is defined as activation potential combined input, weights and function activation; yj is defined as output. Σ is denoted as the summation of the multiplication between parameters and weights (wkj xj); ϕ(χ) is the activation function.
The mathematical formulation is given by the following [21,22]:
The activation function is an integral part of a neural network. Without an activation function, a neural network is a simple linear regression model. This means the activation function gives non-linearity to the neural network. In our case the hyperbolic tangent was considered [21,22].
In our case, the weight of the parameters are calculated by applying principal component analysis (PCA); TSI: 0.701; TSI UNCERT: 0.442; EPOCH: 0.778.
Under the PCA calculations, the important parameters are TSI and EPOCH. Correlation (under non-parametric measure Kendal) suggests that TSI vs. EPOCH0.697 (69.7% correlation between the two variables).
In the case of multilayer neural networks (or multilayer perceptions), the additional levels called hidden layers and their neurons termed hidden neurons, added computing power and better overall performance to the network.
For every year from 1985–1989, the values of TSI, EPOCH, and STROKE DEATHS are available as monthly values. To predict the stroke deaths in a multilayer neural network, we opted to combine the values of the parameters and their weights. For every year, a yearly prediction analysis has been further selected, because this quinquennium involves the minimum of the 21st solar cycle, as well as the maximum of the antecedent one. Thus, each year had its own value in solar cycle-timing evaluation. The proposed neural networks are given in Figure 2:

Figure 2.
Created neural networks: (a) 1985; (b) 1986; (c) 1987; (d) 1988; (e) 1989; (f) whole quinquennium. All six networks have one hidden layer. The dependent variable in every network is stroke death and the independent variables are TSI and EPOCH.
In Table 1, the results considering training data and sum of square errors (SSE) for the predicted models for every separate year, as well as the whole quinquennium, are illustrated.

Table 1.
Measures for every year as well as total years.
For the proposed model, the predicted graph for stroke death for every year, as well as in toto, are presented in Figure 3:
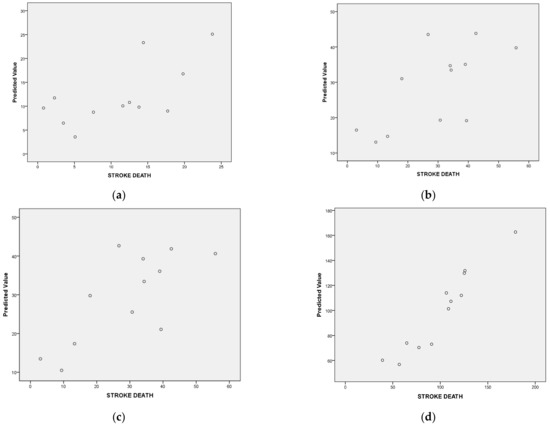

Figure 3.
The scatter plots display the relation of predicted values by observed stroke deaths for: (a) 1985; (b) 1986; (c) 1987; (d) 1988; (e) 1989; (f) whole quinquennium.
Thus, it is clear that the best results were predicted for 1985 and 1988, and the worst for 1989. Finally, in Table 2, the results for the importance of the correlated parameters TSI and EPOCH for every year, as well as in toto, are described.
Table 2.
Important parameters for every year, as well as in toto.
This latter table shows that TSI was important for the years 1985, 1986, 1987, 1989; the EPOCH was important for year 1988. Considering the entire period 1985–1989, the key parameter that emerged was the EPOCH.
3. Discussion
3.1. Solar Energy
Solar energy is the key vector of the influence of the sun on earth. The solar output variability is wavelength-dependent. The need for long-term observations and modelling of the TSI (from the order of magnitude years to millennia) may be useful in assessing the space climate at Earth’s vicinity. This has dictated the implementation of composite observations, with different space-borne radiometers contributing measurements at complementary intervals. The first space-based observations were achieved in 1978 onboard the NIMBUS 7 mission [23]. Soon thereafter [24], the Active Cavity Radiometer Irradiance Monitor (ACRIM) campaign started, initially onboard the Solar Maximum Mission. Two ACRIM extensions (II and III) continued until 2003, when the Total Irradiance Monitor (TIM) onboard NASA’s Solar Radiation and Climate Experiment (SORCE) took over [25]. Making a composite implies merging observations and shifting them to a common estimation. The data are available from 1978 to this day, and have been compiled by R. Wilson.
The running averages greatly reduce spikes in the data, which are otherwise real, granted that the radiometers’ photometric precision is extremely high, and the interval chosen for this study (1985–1989) corresponds to the minimum of solar cycle 21 and part of the ascending phase of cycle 22. The mean uncertainty of the original data stems directly from the radiometric precision, while the mean uncertainties of the different running averages are the means of the standard deviations at each averaging instance. Notably, the mean values of the TSI are identical in the original data and the different running averages. All in all, over the period of interest, TSI values never went lower than 1363.00 W/m2, and never higher than 1367.50 W/m2, with a very well-defined average of 1365.10 W/m2. The 25th–75th percentile variation is of an amplitude of 4.2 × 10⁻⁴ of the mean TSI value at most, while the minimum–maximum amplitude is 3.3 × 10⁻³ of the mean at most.
Notably, in this study, we considered monthly and yearly TSI gauges, thus, relevant to space climate, rather than space weather, which considers hourly and daily variations. We should clarify that the ACRIM TSI values reflect the power reaching the upper layer of Earth’s atmosphere, namely, the thermosphere, but do not translate all the way to Earth’s surface, i.e., at sea level. This may be attributed to atmospheric absorption of parts of this radiation, mainly by ozone, oxygen, water, and carbon dioxide compounds [26]. This TSI absorption can exceed 30% at sea level in mid geographic latitudes (i.e., ~1 kW/m2). However, in lack of a better and more detailed estimate of the TSI at the area of interest, we used the top-atmosphere TSI under the assumption that the sea level TSI is directly proportional to the undisturbed TSI at the top of the atmosphere.
3.2. Locality and Time Period Selected
Piraeus is the largest port in the Mediterranean Sea. The city is ranked third in population density in Greece and considered representative of the Greek urban population [10,27].
On the other hand, stroke ranks as the second leading cause of death globally [9]. Its risk factors include underlying chronic diseases, lifestyle, smoking, socioeconomic status, and genetic and epigenetic propensities [10,11,27].
The time period selected is meaningful because during this period confounding factors were sparse:
- It is the last period when the population was genetically homogeneous, as vast immigration flows started in 1990;
- Diet, lifestyle, physical activity, and smoking variations were narrow;
- Ambient pollution was finite;
- “Sunspot numbers and stroke mortality were inversely correlated, and… a violent fluctuation of sunspot numbers over 35% shifted monthly mortality with a phase delay of two months”, as already discussed in [10];
- In a previous work, in the same population and time frame, “a common, novel, non-anthropogenic chronome of 6.8 days in solar activity (sunspot numbers) and stroke mortality was uncovered” [10].
3.3. Strokes
As has already been reported, “the stroke death rate (stroke deaths in year x/overall deaths in year x × 100) was calculated as 17.668 in 1985, 20.089 in 1986, 19.372 in 1987, 17.647 in 1988, and 15.531 in 1989. The overall death rate (all deaths in year x/local population in year x × 100) was 5.5 in 1985, 4.4 in 1986, 4.9 in 1987, 3.5 in 1988, and 3.7 in 1989” [10,27].
The stroke pathology includes formation of hematoma within the brain parenchyma (intracerebral haemorrhage) and/or ischemic injury. Moreover, it is established that the nuclear peroxisome proliferator activated receptors (PPARs) are key regulators of both types of stroke [28,29]. This molecule is part of the nuclear steroid receptors R1 molecular network that retained its functionality across species in the evolutionary chain, thus, was strongly preserved over time [30]. Sun irradiance has ever influenced the planet and is considered a “proliferator” of life. It has been suggested that as soon as PPARs and other R1 members are disturbed following electromagnetic influence, haemorrhagic, inflammatory, and other pathological manifestations, such as strokes, may progress.
This study, profiting from a machine learning technique, reports that EPOCH is the key mediator of stroke mortality incidence in the total quinquennium, as well as in 1988. EPOCH is a satellite-constructed time-monitoring measure, providing evidence on the additive effect of solar irradiance either positively (as in vitamin D synthesis or biological clock activation), or negatively (for instance, UV effects on carcinogenesis and oxidative stress) [13,31,32,33]. Furthermore, our results confirm previous studies that established solar activity contribution to human morbidity and mortality: strokes, cardiac infarcts, systemic lupus erythematosus, cancer, etc. [10,33].
TSI was a key player in every separate year, except 1988. The energy was low in every separate year and this finding cannot be explained at this time; thus, it might be mediated by a factor not examined herein (i.e., space climate). It merits reporting for future consideration in larger timeframes, and with different populations living at different latitudes.
This study is limited by the short time period examined, but has employed a modern, advanced artificial intelligence method (neural networks), giving rather unexpected results.
4. Conclusions
Neural networks are an established and powerful tool for the evaluation of human exposure to solar electromagnetic radiation. Their construction gauges linearly and non-linearly known data for predicting their relationships, importance, and power, with high precision and accuracy. Thus, regarding stroke mortality incidence, TSI was important for the years 1985, 1986, 1987, 1989, unlike the year 1988, where EPOCH was important. When we considered the entire period 1985–1989, the key parameter that emerged was the EPOCH.
Author Contributions
Conceptualisation, S.G.; methodology, S.G. and S.Z.; software, S.Z.; validation, S.G., S.T., D.C. and G.P.C.; formal analysis, S.G. and S.Z.; investigation, S.G. and S.Z.; writing—original draft preparation, S.G. and S.Z.; writing—review and editing, all authors; visualisation, all authors; supervision, S.G., D.C. and G.P.C.; project administration, S.G. All authors have read and agreed to the published version of the manuscript.
Funding
This research received no external funding.
Institutional Review Board Statement
Not applicable.
Informed Consent Statement
Not applicable.
Data Availability Statement
The monthly stroke deaths were collected in the Civil Registry Office and published in DOI: 10.6084/m9.figshare.12601907.v1. The ACRIM data were downloaded from https://www.ngdc.noaa.gov/stp/solar/solarirrad.html#acrim (accessed on 20 April 2011).
Acknowledgments
We thank Manolis Georgoulis for kindly providing the ACRIM data.
Conflicts of Interest
The authors declare no conflict of interest.
References
- Frohlich, C. Evidence of a long-term trend in total solar irradiance. Astron. Astrophys. 2009, 501, L27–L30. [Google Scholar] [CrossRef]
- Steinhilber, F.; Beer, J.; Fröhlich, C. Total solar irradiance during the Holocene. Geophys. Res. Lett. 2009, 36, L19704. [Google Scholar] [CrossRef]
- Foukal, P.; Fröhlich, C.; Spruit, H.; Wigley, T.M. Variations in solar luminosity and their effect on the Earth’s climate. Nature 2006, 443, 161–166. [Google Scholar] [CrossRef] [PubMed]
- Lean, J.; Beer, J.; Bradley, R. Reconstruction of solar irradiance since 1610. Geophys. Res. Lett. 1995, 22, 3195. [Google Scholar] [CrossRef]
- Kopp, G.; Lean, J.L. A new, lower value of total solar irradiance: Evidence and climate significance. Geophys. Res. Lett. 2011, 38, L01706. [Google Scholar] [CrossRef]
- Penza, V.; Berrilli, F.; Bertello, L.; Cantoresi, M.; Criscuoli, S.; Giobbi, P. Total Solar Irradiance during the Last Five Centuries. Astrophys. J. 2022, 937, 84. [Google Scholar] [CrossRef]
- Hathaway, D.H. The Solar Cycle. Living Rev. Sol. Phys. 2015, 12, 4. [Google Scholar] [CrossRef]
- Fröhlich, C. Total Solar Irradiance: What Have We Learned from the Last Three Cycles and the Recent Minimum? Space Sci. Rev. 2013, 176, 237–252. [Google Scholar] [CrossRef]
- Mozaffarian, D.; Benjamin, E.J.; Go, A.S.; Arnett, D.K.; Blaha, M.J.; Cushman, M.; de Ferranti, S.; Després, J.P.; Fullerton, H.J.; Howard, V.J.; et al. Heart disease and stroke statistics--2015 update: A report from the American Heart Association. Circulation 2015, 131, e29–e322. [Google Scholar] [CrossRef]
- Geronikolou, S.; Leontitsis, A.; Petropoulos, V.; Davos, C.; Cokkinos, D.; Chrousos, G. Cyclic stroke mortality variations follow sunspot patterns. F1000Res 2020, 9, 1088. [Google Scholar] [CrossRef]
- Malik, R.; Dichgans, M. Challenges and opportunities in stroke genetics. Cardiovasc. Res. 2018, 114, 1226–1240. [Google Scholar] [CrossRef]
- Stienen, M.N.; Smoll, N.R.; Battaglia, M.; Schatlo, B.; Woernle, C.M.; Fung, C.; Roethlisberger, M.; Daniel, R.T.; Fathi, A.R.; Fandino, J.; et al. Intracranial aneurysm rupture is predicted by measures of solar activity. World Neurosurg. 2015, 83, 588–595. [Google Scholar] [CrossRef]
- Halgberg, F.; Cornélissen, G.; Watanabe, Y.; Otsuka, K.; Fiser, B.; Siegelova, J.; Mazankova, V.; Maggioni, C.; Sothern, R.B.; Katinas, G.S.; et al. Near 10-year and longer periods modulate circadians: Intersecting anti-aging and chronoastrobiological research. J. Gerontol. A Biol. Sci. Med. Sci. 2001, 56, M304–M324. [Google Scholar] [CrossRef]
- Hempelmann, A.; Weber, W. Correlation Between the Sunspot Number, the Total Solar Irradiance, and the Terrestrial Insolation. Solar Phys. 2012, 277, 417–430. [Google Scholar] [CrossRef]
- Lisboa, P.J. A review of evidence of health benefit from artificial neural networks in medical intervention. Neural Netw. 2002, 15, 11–39. [Google Scholar] [CrossRef]
- Martín-Guerrero, J.D.; Lamata, L. Quantum Machine Learning: A tutorial. Neurocomputing 2022, 470, 457–461. [Google Scholar] [CrossRef]
- Mitchell, T. Machine Learning; McGraw-Hill Education: New York, NY, USA, 1997. [Google Scholar]
- Qiu, J.; Wu, Q.; Ding, G.; Xu, Y.; Feng, S. A survey of machine learning for big data processing. EURASIP J. Adv. Signal Process. 2016, 2016, 67. [Google Scholar] [CrossRef]
- Taleb, I.; Serhani, M.A.; Dssouli, R. Big Data Quality: A Survey. In Proceedings of the 2018 IEEE International Congress on Big Data (BigData Congress), San Francisco, CA, USA, 2–7 July 2018; pp. 166–173. [Google Scholar]
- Gershenson, C. Artificial Neural Networks for Beginners; Cornell University: Ithaca, NY, USA, 2011. [Google Scholar]
- Stergiou, C.; Siganos, D. 2011. An Introduction to ANNs; Imperial College London: London, UK, 2011. [Google Scholar]
- Hoyt, D.V.; Kyle, H.L.; Hickey, J.R.; Maschhoff, R.H. The Nimbus 7 solar total irradiance: A new algorithm for its derivation. J. Geophys. Res 1992, 97, 51. [Google Scholar] [CrossRef]
- Willson, R.C.; Hudson, H.S. Variations of solar irradiance. Astrophys. J. 1981, 244, L185–L189. [Google Scholar] [CrossRef]
- Kopp, G.; Lawrence, G. The Total Irradiance Monitor (TIM): Instrument Design. Solar Phys. 2005, 230, 91–109. [Google Scholar] [CrossRef]
- Strobel, D.F. Parameterization of the atmospheric heating rate from 15 to 120 km due to O2 and O3 absorption of solar radiation. J. Geophys. Res. Ocean. 1978, 83, 6225–6230. [Google Scholar] [CrossRef]
- Geronikolou, S. Public Health in Piraeus 1985–1989; Public Hygiene, TIE: Athens, Greece, 1991. [Google Scholar]
- Zhao, X.R.; Gonzales, N.; Aronowski, J. Pleiotropic role of PPARγ in intracerebral hemorrhage: An intricate system involving Nrf2, RXR, and NF-κB. CNS Neurosci. Ther. 2015, 21, 357–366. [Google Scholar] [CrossRef] [PubMed]
- Culman, J.; Zhao, Y.; Gohlke, P.; Herdegen, T. PPAR-gamma: Therapeutic target for ischemic stroke. Trends Pharmacol. Sci. 2007, 28, 244–249. [Google Scholar] [CrossRef] [PubMed]
- Geronikolou, S.A.; Pavlopoulou, A.; Kanaka-Gantenbein, C.; Chrousos, G. Inter-species functional interactome of nuclear steroid receptors (R1). Front. Biosci. 2018, 10, 208–228. [Google Scholar] [CrossRef]
- Anna, B.; Blazej, Z.; Jacqueline, G.; Andrew, C.J.; Jeffrey, R.; Andrzej, S. Mechanism of UV-related carcinogenesis and its contribution to nevi/melanoma. Expert Rev. Dermatol. 2007, 2, 451–469. [Google Scholar] [CrossRef]
- Teng, Y.; Yu, Y.; Li, S.; Huang, Y.; Xu, D.; Tao, X.; Fan, Y. Ultraviolet Radiation and Basal Cell Carcinoma: An Environmental Perspective. Front. Public Health 2021, 9, 666528. [Google Scholar] [CrossRef]
- de Jager, T.L.; Cockrell, A.E.; Du Plessis, S.S. Ultraviolet Light Induced Generation of Reactive Oxygen Species. Adv. Exp. Med. Biol. 2017, 996, 15–23. [Google Scholar] [CrossRef]
- Hrushesky, W.J.; Sothern, R.B.; Du-Quiton, J.; Quiton, D.F.; Rietveld, W.; Boon, M.E. Sunspot dynamics are reflected in human physiology and pathophysiology. Astrobiology 2011, 11, 93–103. [Google Scholar] [CrossRef]


Disclaimer/Publisher’s Note: The statements, opinions and data contained in all publications are solely those of the individual author(s) and contributor(s) and not of MDPI and/or the editor(s). MDPI and/or the editor(s) disclaim responsibility for any injury to people or property resulting from any ideas, methods, instructions or products referred to in the content. |
© 2023 by the authors. Licensee MDPI, Basel, Switzerland. This article is an open access article distributed under the terms and conditions of the Creative Commons Attribution (CC BY) license (https://creativecommons.org/licenses/by/4.0/).