Article

Interdecadal Change of Ural Blocking Highs and Its Atmospheric Cause in Winter during 1979–2018

1
College of Meteorology, Lanzhou Resources & Environment Voc-Tech University, Lanzhou 730021, China
2
College of Atmospheric Sciences, Lanzhou University, Lanzhou 730000, China
3
Key Laboratory of Climate Resource Development and Disaster Prevention of Gansu Province, Research and Development Center of Earth System Model (RDCM), College of Atmospheric Sciences, Lanzhou University, Lanzhou 730000, China
*
Author to whom correspondence should be addressed.
Atmosphere 2022, 13(9), 1530; https://doi.org/10.3390/atmos13091530
Submission received: 18 August 2022 / Revised: 15 September 2022 / Accepted: 16 September 2022 / Published: 19 September 2022
(This article belongs to the Special Issue Atmospheric Blocking and Weather Extremes)

Abstract

:
The Ural blocking (UB) high is a weather system closely related to the cold air process during winter, which could trigger extreme cold events in East Asia. By retrieving five single blocking indexes, including accumulation frequency, central latitude, blocking intensity, mean duration and north rim, it is found that the UB in winter occurs more frequently, grows stronger, lasts longer and is located more northward after 2002, compared with 1985–2001. In order to describe the UB comprehensively, a new comprehensive blocking index (CBI) is developed based on the above five blocking indexes. The CBI can also reflect the interdecadal change of UB synthetically. Analysis on the corresponding atmospheric circulation shows that the relationship between the UB and atmospheric circulation, such as the polar vortex and jet, is closer in 2002–2018 than in 1985–2001. Compared with the atmospheric circulation in 1985–2001, the most prominent feature in 2002–2018 is that the intensity of the polar vortex is weaker at 100 hPa, and that the subtropical jet moves northward. Meanwhile, the East Asian trough downstream of the Urals deepens at 500 hPa and the Siberian high strengthens, indicating that the East Asia winter monsoon is stronger during 2002–2018. Further analysis on atmospheric waves and baroclinicity demonstrates that the meridional circulation of planetary waves strengthens, especially the 2-waves, which may increase the frequency of the UB and shift its location northward after 2002. Additionally, the baroclinicity ( T / y ) in the mid-high latitudes is weakened during winter since 2002, which is also beneficial for the establishment of meridional circulation, causing a stronger intensity and longer duration of the UB.

1. Introduction

The blocking high is one of the weather situations of atmospheric meridional anomaly development in mid-high latitudes which can lead to mass and heat of air mass exchange, resulting in abnormal weather and climate, and even disastrous weather [1,2]. In winter, the abnormal activity of the Ural blocking (UB) high always brings extremely cold events sweeping East Asia [3,4]. When the Rossby wave train in the upper troposphere, accompanied by upstream blocking, is coupled with the surface cold anomaly in Siberia, it will lead to the significant strengthening of the Siberian high (SH) and the East Asian winter monsoon (EAWM) and the emergence of a cold wave event [5]. For example, in January 2021, under the influence of the huge development and merger of the UB, China suffered from serious cold wave weather [6], with many meteorological stations recording the lowest temperature in the same period from 6 January to 8 January, when the temperature was at its minimum during the cold event. Especially under the background of global climate change, the relationship between UB and the EAWM is closer [7]. There are to be more important impacts of the UB on the weather and climate in East Asia from both weather and seasonal scales by the end of the 21st century [8,9]. Therefore, it is of great scientific value and practical significance to deeply study the UB in winter in order to further improve the weather and climate forecast in East Asia.
The change characteristics of the UB are of great concern to many researchers. Similar to the trend in blocking frequency in Eurasia declining since the 1980s [10], Wang et al. [7] calculate the UB indexes by the method which measures the resemblance of a particular circulation pattern with the UB regime, and also find that the indexes show a downward trend from 1957–2000. However, the decreasing trend in UB frequency changed after 2000; Yao et al. [11] find the frequency of UB increases after the 2000s. Luo et al. [12,13] further indicate that there is an obvious interdecadal change on the lifetime of the UB in winter: the duration of UB events is longer during 2000–2013 than during 1979–1999. The results from Chen et al. [14] also show that the quasi-stationary UB events increase significantly during 1999–2015. However, previous studies are too focused on the frequency and duration of UB, and these studies confirm the interdecadal change of the UB usually from aspects of frequency or duration. In fact, characteristics of the UB should include its frequency, intensity, duration and latitudinal location. These features are very important to describe the blocking high. Moreover, it is necessary to develop a comprehensive index which can reflect all features of the UB. Therefore, it is worth considering whether frequency, intensity, duration and latitudinal location of the UB all change interdecadally, and if so, whether a new comprehensive index can illustrate the interdecadal variation of the UB.
The UB, as the product of atmospheric circulation anomaly, is closely related to other circulation systems, such as the polar vortex, jet and so on. When the splitting polar vortex is situated in the Atlantic and East Asian regions, two blocking highs occurring in the Urals and North American areas precede these splitting processes [15]. As the zonal wind in the mid-high latitudes weakens after the 1990s, the north-south meanderings of the westerly jet stream will become more prominent, so that southward intrusions of polar cold air into the mid-latitudes and northward intrusions of warmer air into higher latitudes may be enhanced [16]. That such a meandering jet stream corresponds essentially to a blocking flow is demonstrated by Luo [17]. Yao et al. [18] point out that during weak mean westerly wind or vertical shear winters, as frequently observed during 2000–2015, persistent and large UB is found. Li et al. [19] studied the concurrent impacts between the jet and the UB during the two extremely cold weather events in 2008 and 2016 and have demonstrated that the East Asian subtropical jet (EASJ) is stronger and the polar front jet (PFJ) is weaker when the UB exists during the cold events. However, affected by global climate change, has the relationship between each system and the UB also changed?
Scholars have also paid much attention to the mechanism of the UB. Arctic warming with sea ice reduction over the Barents and Kara Seas after the 20th century could amplify atmospheric planetary waves such as the blocking flows and retard their eastward propagation [20,21,22,23]. The results from Luo et al. [24] show that under the background of Arctic warming, the meridional temperature gradient and westerly wind decrease over the mid-high latitudes of Eurasia, resulting in the decrease in the meridional potential vorticity (PV) gradient, following which, the baroclinicity is changed. Under such circulation background, the UB will show quasi-stationary (non-moving) characteristics, and its duration will also become longer. Based on the interdecadal change of the UB, it is necessary to explore whether there are corresponding variations of relations between the UB and other circulation systems, as well as quasi-stationary waves, such as planetary-scale waves and baroclinicity.
Based on the review and analysis of the previous related studies, this study is focused on the following scientific issues: (1) How do we develop a comprehensive index to reflect overall features of the UB including frequency, latitudinal location, intensity and duration? (2) Are there interdecadal changes in all characteristics of the UB? (3) If there are, what are the possible atmospheric causes for such interdecadal change? Addressing such issues can promote a deeper understanding of the mechanism of the UB event in winter.
The paper is organized as follows. Descriptions of the data and methods are given in Section 2. The interdecadal change characteristics of the UB are investigated in Section 3. The interdecadal changes of the atmospheric circulations associated with the UB are explored in Section 4. The dynamical diagnosis of atmospheric internal causes from the planetary wave amplitude and atmospheric baroclinicity are shown in Section 5. Finally, the conclusion and discussion are presented in Section 6.

2. Data and Methods

2.1. Data

The daily geopotential heights (GPHs) and other monthly reanalysis data, including temperature (T), zonal winds (U) and sea level pressure (SLP) data from 1979 to 2019, were provided by the National Centre for Environmental Prediction-Department of Energy (NCEP-DOE) [25]. The horizontal resolution was 2.5° × 2.5° in both latitude and longitude (https://psl.noaa.gov/data/gridded/data.ncep.reanalysis2.html.accessed on 1 March 2020). The NCEP-DOE data have been widely used in similar studies [26,27], which was helpful for providing reference information under the same standard as the reanalysis data.

2.2. Methods

Under the basics of one-dimensional blocking index by Tibaldi and Molteni [28], Scherrer et al. [29] constructed a two-dimensional blocking index by processing the daily 500 hPa geopotential height fields. Blocking events can be described more objectively by the two-dimensional index.
For each grid point, the geopotential height gradient of south (GHGS) and north (GHGN) at 500 hPa were calculated as follows:
G H G S ( λ 0 , ϕ 0 ) = Z 500 ( λ 0 , ϕ 0 ) Z 500 ( λ 0 , ϕ s ) ϕ 0 ϕ s
G H G N ( λ 0 , ϕ 0 ) = Z 500 ( λ 0 , ϕ n ) Z 500 ( λ 0 , ϕ 0 ) ϕ n ϕ 0
where 0° ≤ λ 0 ≤ 360°, 30° N ≤ ϕ 0 ≤ 75° N, ϕ s   = ϕ 0   − 15°,   ϕ n   =   ϕ 0   + 15°. When the GHGS > 0 and GHGN < −10 gpm/latitude on one grid, it is considered that an instantaneous blocking occurs on the lattice. When the instantaneous blocking extends more than 15 degrees of longitude, the blocking in this region can be judged as a large-scale blocking. A blocking high is defined if the grids covered by large scale blocking reach 10° longitude × 5° latitude and the blocking situation remains for 5 days or more.
The latitudinal position of blocking high is closely related to the ability of guiding cold air. So, the central latitude (CL) and north rim (NR) of the UB are defined here. The latitude of the maximum value of GHGS during the process of the blocking event is defined as the central latitude of the blocking high, which represents the main position of the UB. In addition, the northernmost latitude of GNGS value greater than 0 is defined as the north rim. The farther north the CL or NR is, the stronger the ability of the blocking high to guide cold air.
In addition, the blocking intensity index (BII) was calculated by referring to the method adopted by Wiedenmann et al. [30]. The calculation formula is as follows:
R C ( λ 0 , φ 0 ) = ( ( Z u + M Z ) / 2 + ( Z d + M Z ) / 2 ) / 2
B I I ( λ 0 , φ 0 ) = ( M Z / R C ) 1.0
For each point of longitude and latitude where an instantaneous blocking is detected as λ 0 and φ 0 , we first define MZ as the value of Z 500 ( λ 0 , ϕ 0 ), and the Z u and Z d as the minimum of Z 500 field within 60° upstream and downstream at the same latitude ( ϕ 0 ) of the chosen point, respectively. The larger (smaller) the BII, the stronger (weaker) the instantaneous blocking. The intensity of the blocking (IB) in winter was defined as the average of the maximum BII during the UB lifetime.
As the exact duration of the blocking high could not be obtained by the above method directly, the blocking high retrieval method adapted by Shi and Zhi [7] was used to define the duration of the UB. A blocking high is defined when:
(1)
There is a high and warm pressure center at 500 hPa which is located north of 50° N, indicating that warm air from the south is isolated in northern and high latitudes.
(2)
There is an apparent anticyclonic circulation around the high-pressure center in the wind fields, corresponding to the closed high-pressure center in the GPH field.
(3)
The high-pressure center moves no more than 12.5 degrees longitude every day.
(4)
The above situation exists continuously for at least 5 days.
The criterion for UB events was based on the atmospheric circulation at 500 hPa. By limiting slow-moving speed and the shortest duration, it was ensured that the UB is a stable and quasi-stationary weather system. The duration (DU) of the closed high-pressure contour is the number of days that the blocking high exists. Here, The UB refers to the blocking event occurring in the key Ural areas (40–80° E) during winter (December and the following January and February). When the weather situation at 500 hPa meets the above four conditions, it is recorded as a blocking high. The accumulated frequency (Fq) is the total frequency in winter every year.
The CL, IB, DU and NR were all used to describe a single blocking event and were associated with each other. The correlation coefficients between each two of them were higher than 0.7 (Table 1), and all passed the significance Student’s test (t-test) of 99%. In other words, the stronger the intensity of the blocking high, the more northerly its latitudinal location, as well as the longer its duration on average. Thus, we define a new blocking index (BI) by using the 4 quantities for a single blocking event. The formula is as follows,
B I = [ ( C B ) + ( I B ) + ( D U ) + ( N R ) ] / 4
where CB, IB, DU and NR represent the normalized central latitude, intensity, duration and north rim of a blocking event, respectively. As these four indexes are used to describe a single blocking high process and display equal importance, the differences between extreme values of each blocking index are, therefore, similar. Therefore, the BI was developed without considering different weights of different indexes.
The BI is convenient to analyze the change of a single UB process. As the cumulative frequency of the UB in one winter is an essential quantity to measure the interannual change, the comprehensive blocking index (CBI) was synthesized from cumulative frequency and BI, the formula of which is as followed,
C B I = [ F q + B I ] / 2
The Fq is on behalf of the normalized cumulative frequency of the UB in one winter. So far, the CBI is structured based on 5 single indexes which exhibited characteristics including frequency, intensity, duration, center latitude and north rim, which can be used to investigate the interannual change of blocking highs comprehensively.
By the Fourier expansion method, the planetary waves (wave numbers are 1, 2 and 3) were selected [31]. The specific formula is below,
f ( x ) = a 0   + n = 1 [ a n cos ( nx ) + b n sin ( nx ) ]
The geopotential height [ H ( λ , φ ) ] is expanded by the Fourier method, as follows,
H ( λ , φ ) = a 0 ( φ ) + n = 1 ( a n ( φ ) cos ( n λ ) + b n ( φ ) sin ( n λ ) )  
a 0 φ = 1 2 π 0 2 π H ( λ , φ ) d λ   a n φ = 1 π 0 2 π H ( λ , φ ) cos ( n λ ) d λ
b n ( φ ) = 1 π 0 2 π H ( λ , φ ) sin ( n λ ) d λ
a 0   , a n   ,   b n   are called the Fourier coefficients, and the n wave can be expressed as functions like this : a n cos n λ + b n sin n λ .
Some mathematical statistical methods were also used in this study. For example, the smoothing average used the two parameters smoothing method [32,33]. The moving t-test and (t-test [32,33] were used to determine whether there was interdecadal change of the UB characteristics and whether the anomalies of atmospheric circulation were significant between the different periods.

3. The Interdecadal Changes of the UB in Winter

According to the above method of defining the blocking high, there were 52 UB events retrieved from 40 winters from 1979 to 2019. 
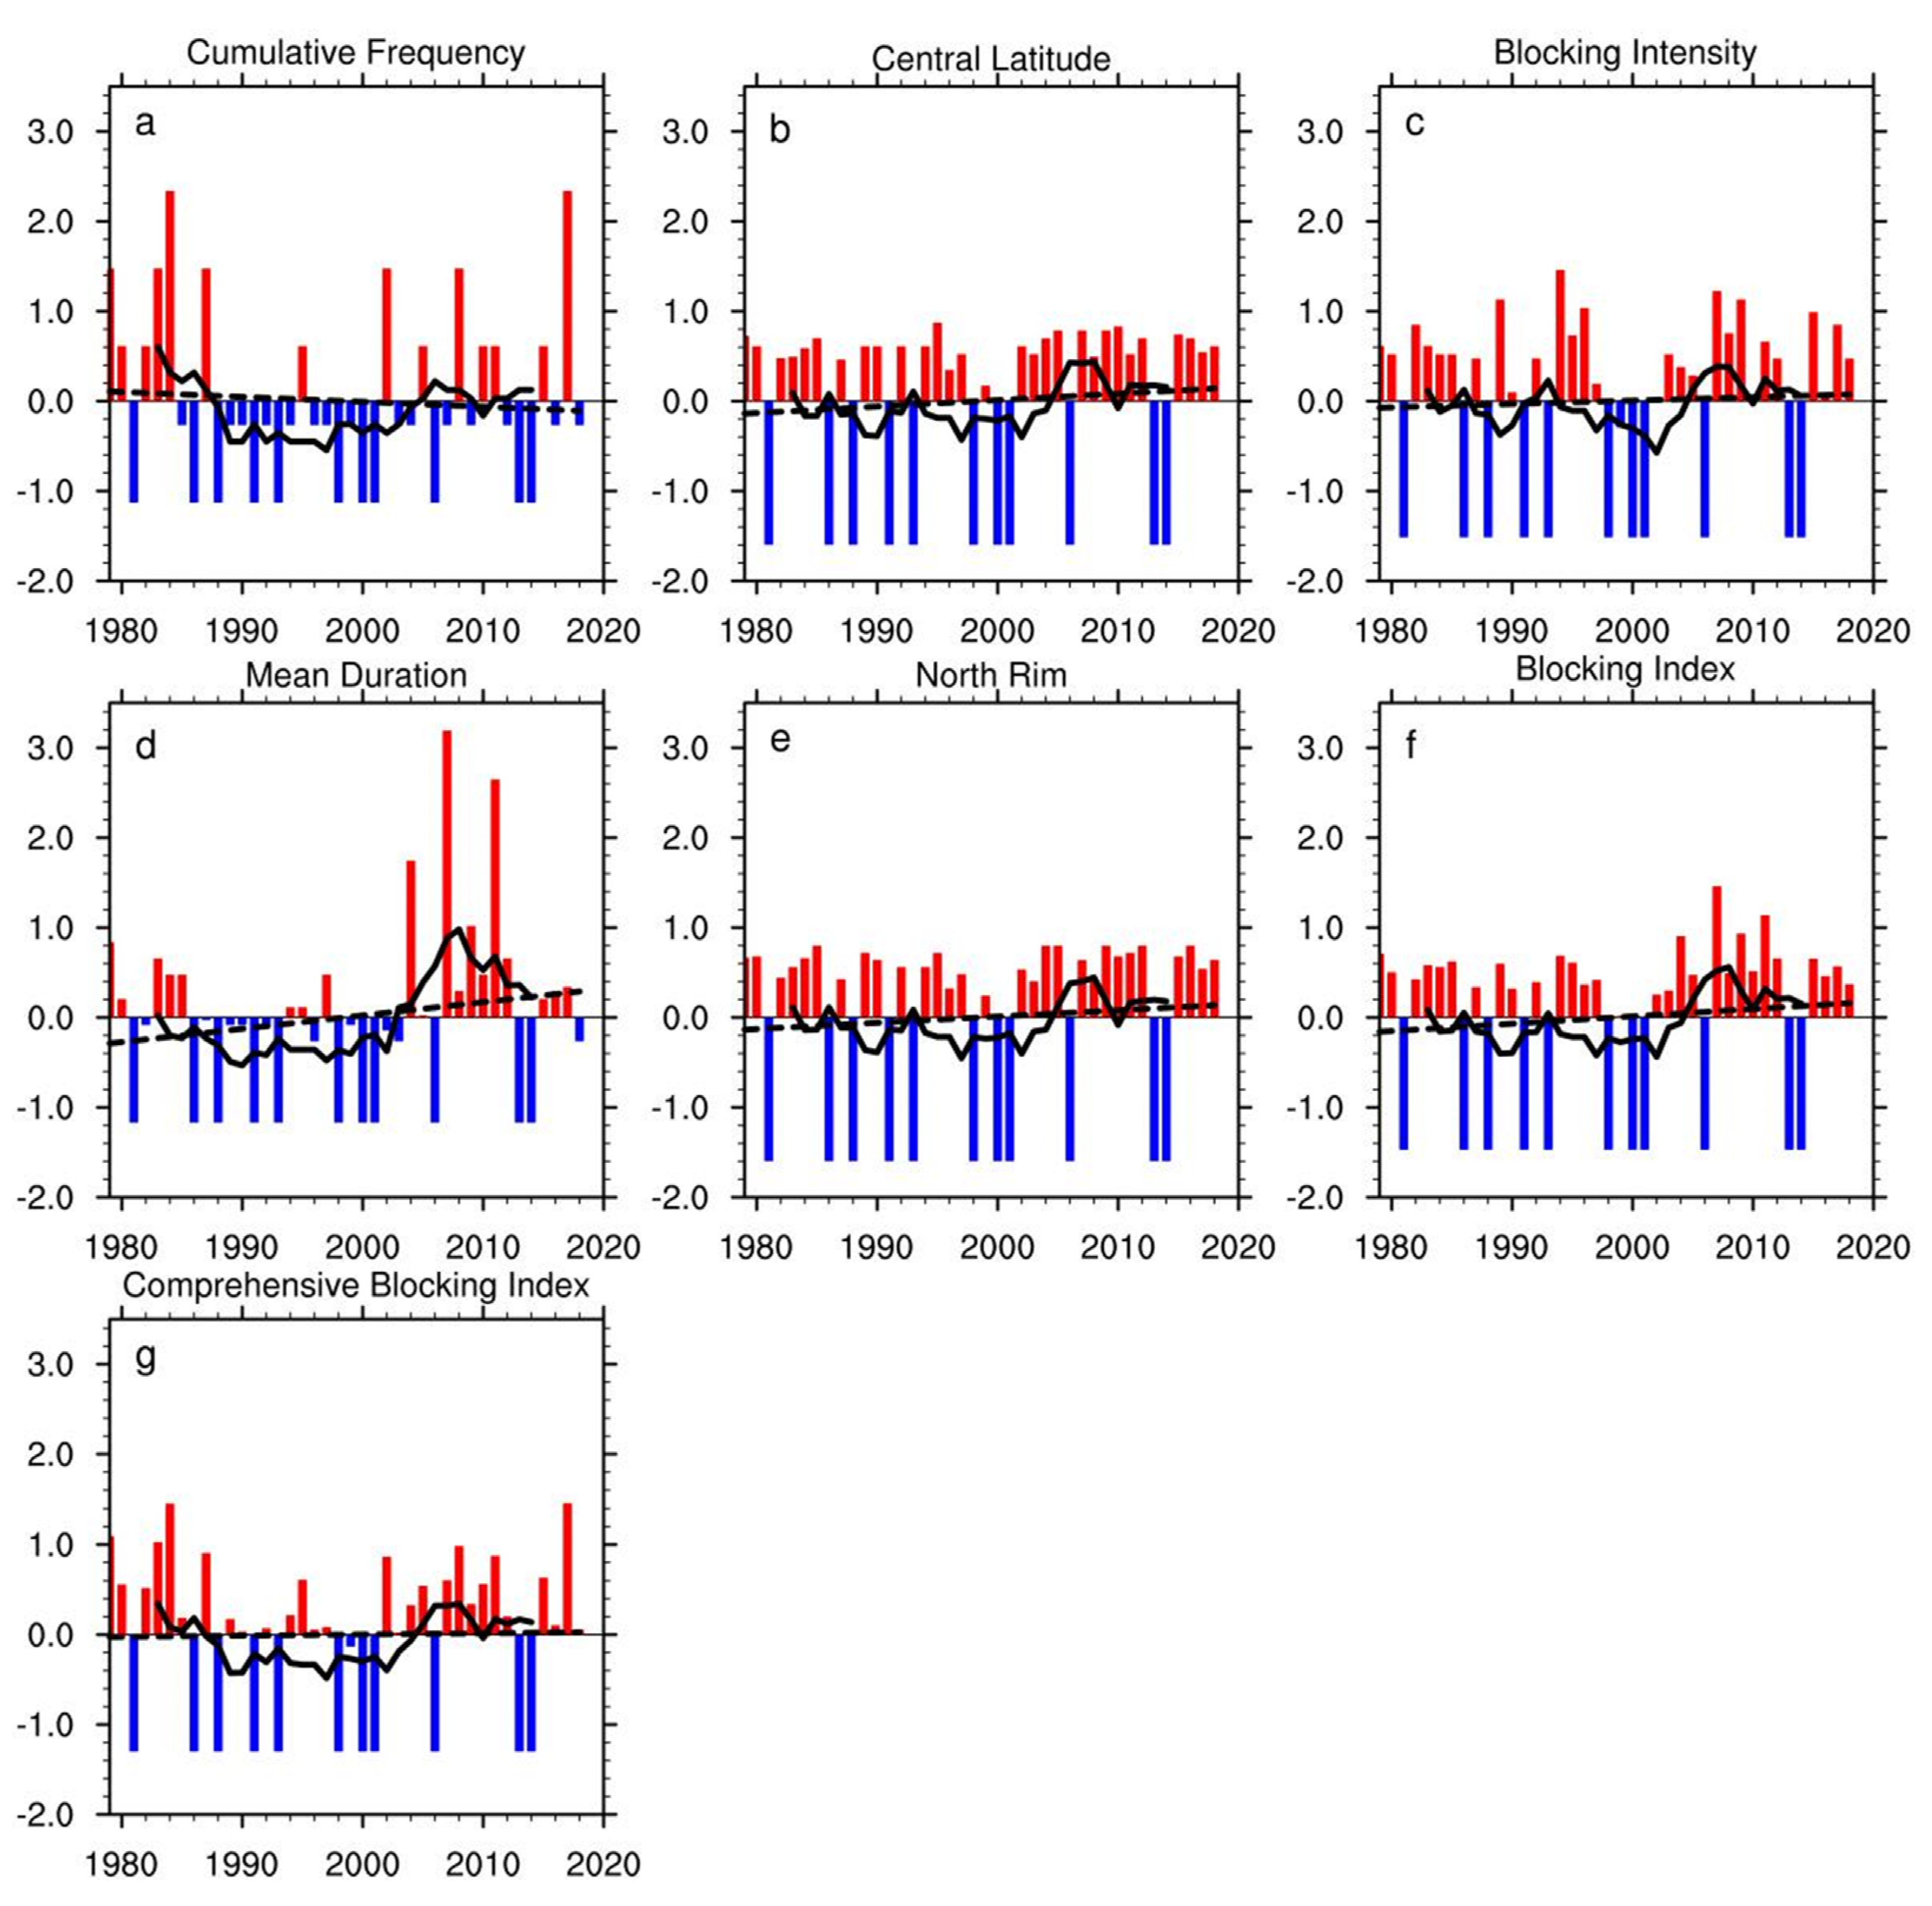
Figure 1 shows the interannual change characteristics of each normalized blocking high index in winter from 1979 to 2019. Figure 1a–e presents the five single blocking indexes (normalized: Fq, CL, IB, DU, NR) of the UB, which all show an obvious interdecadal abrupt change in roughly 2002. From 1985 to the early 21st century, the UB displays an obvious weak phase, and then the trend turns to rise. The change of Fq and DU are the most significant among them. This is consistent with previous studies which focused more on the frequency and duration of blocking highs since 2000 [11,12,13,14]. Further, besides the Fq, this study can indicate that the latitudinal location of the UB (center and north rim location) is more northward after the beginning of the 21st century. The interannual change above can be reproduced in Figure 1f,g, which shows the value of the newly constructed BI and CBI. Combining with the previous blocking index to retrieve blockings or to describe a single feature of the blocking high, the CBI not only considers the frequency and duration, but also includes the latitudinal location, such as the central latitude, north rim and intensity. In a simple mathematical expression, the CBI describes the blocking high from all respects, and it is more comprehensive and systematic.
Accompanying the interdecadal variation of the UB in winter after the beginning of the 21st century, the extreme cold winter events in East Asia have indeed occurred more frequently [34,35,36]. This has been demonstrated by studies from numerous researchers; for example, the number of extreme cold days in southeastern China begins to increase in the early 21st century, concluded by Chen et al. [14]. Qiao et al. [37] confirm that cold winters have been frequent in northern Europe since 2004. The cold events sweeping China in recent years not only show an increase in frequency and intensity, but also reveal a wider range of influence and a rise in the number of continuous days, leading to a large-scale persistent extreme low temperature event [38]. These phenomena are not only closely related to the variation of the frequency or intensity, but also closed to changes of the latitudinal position of the UB, such as stronger cold air usually accompanying a more northward UB [39].
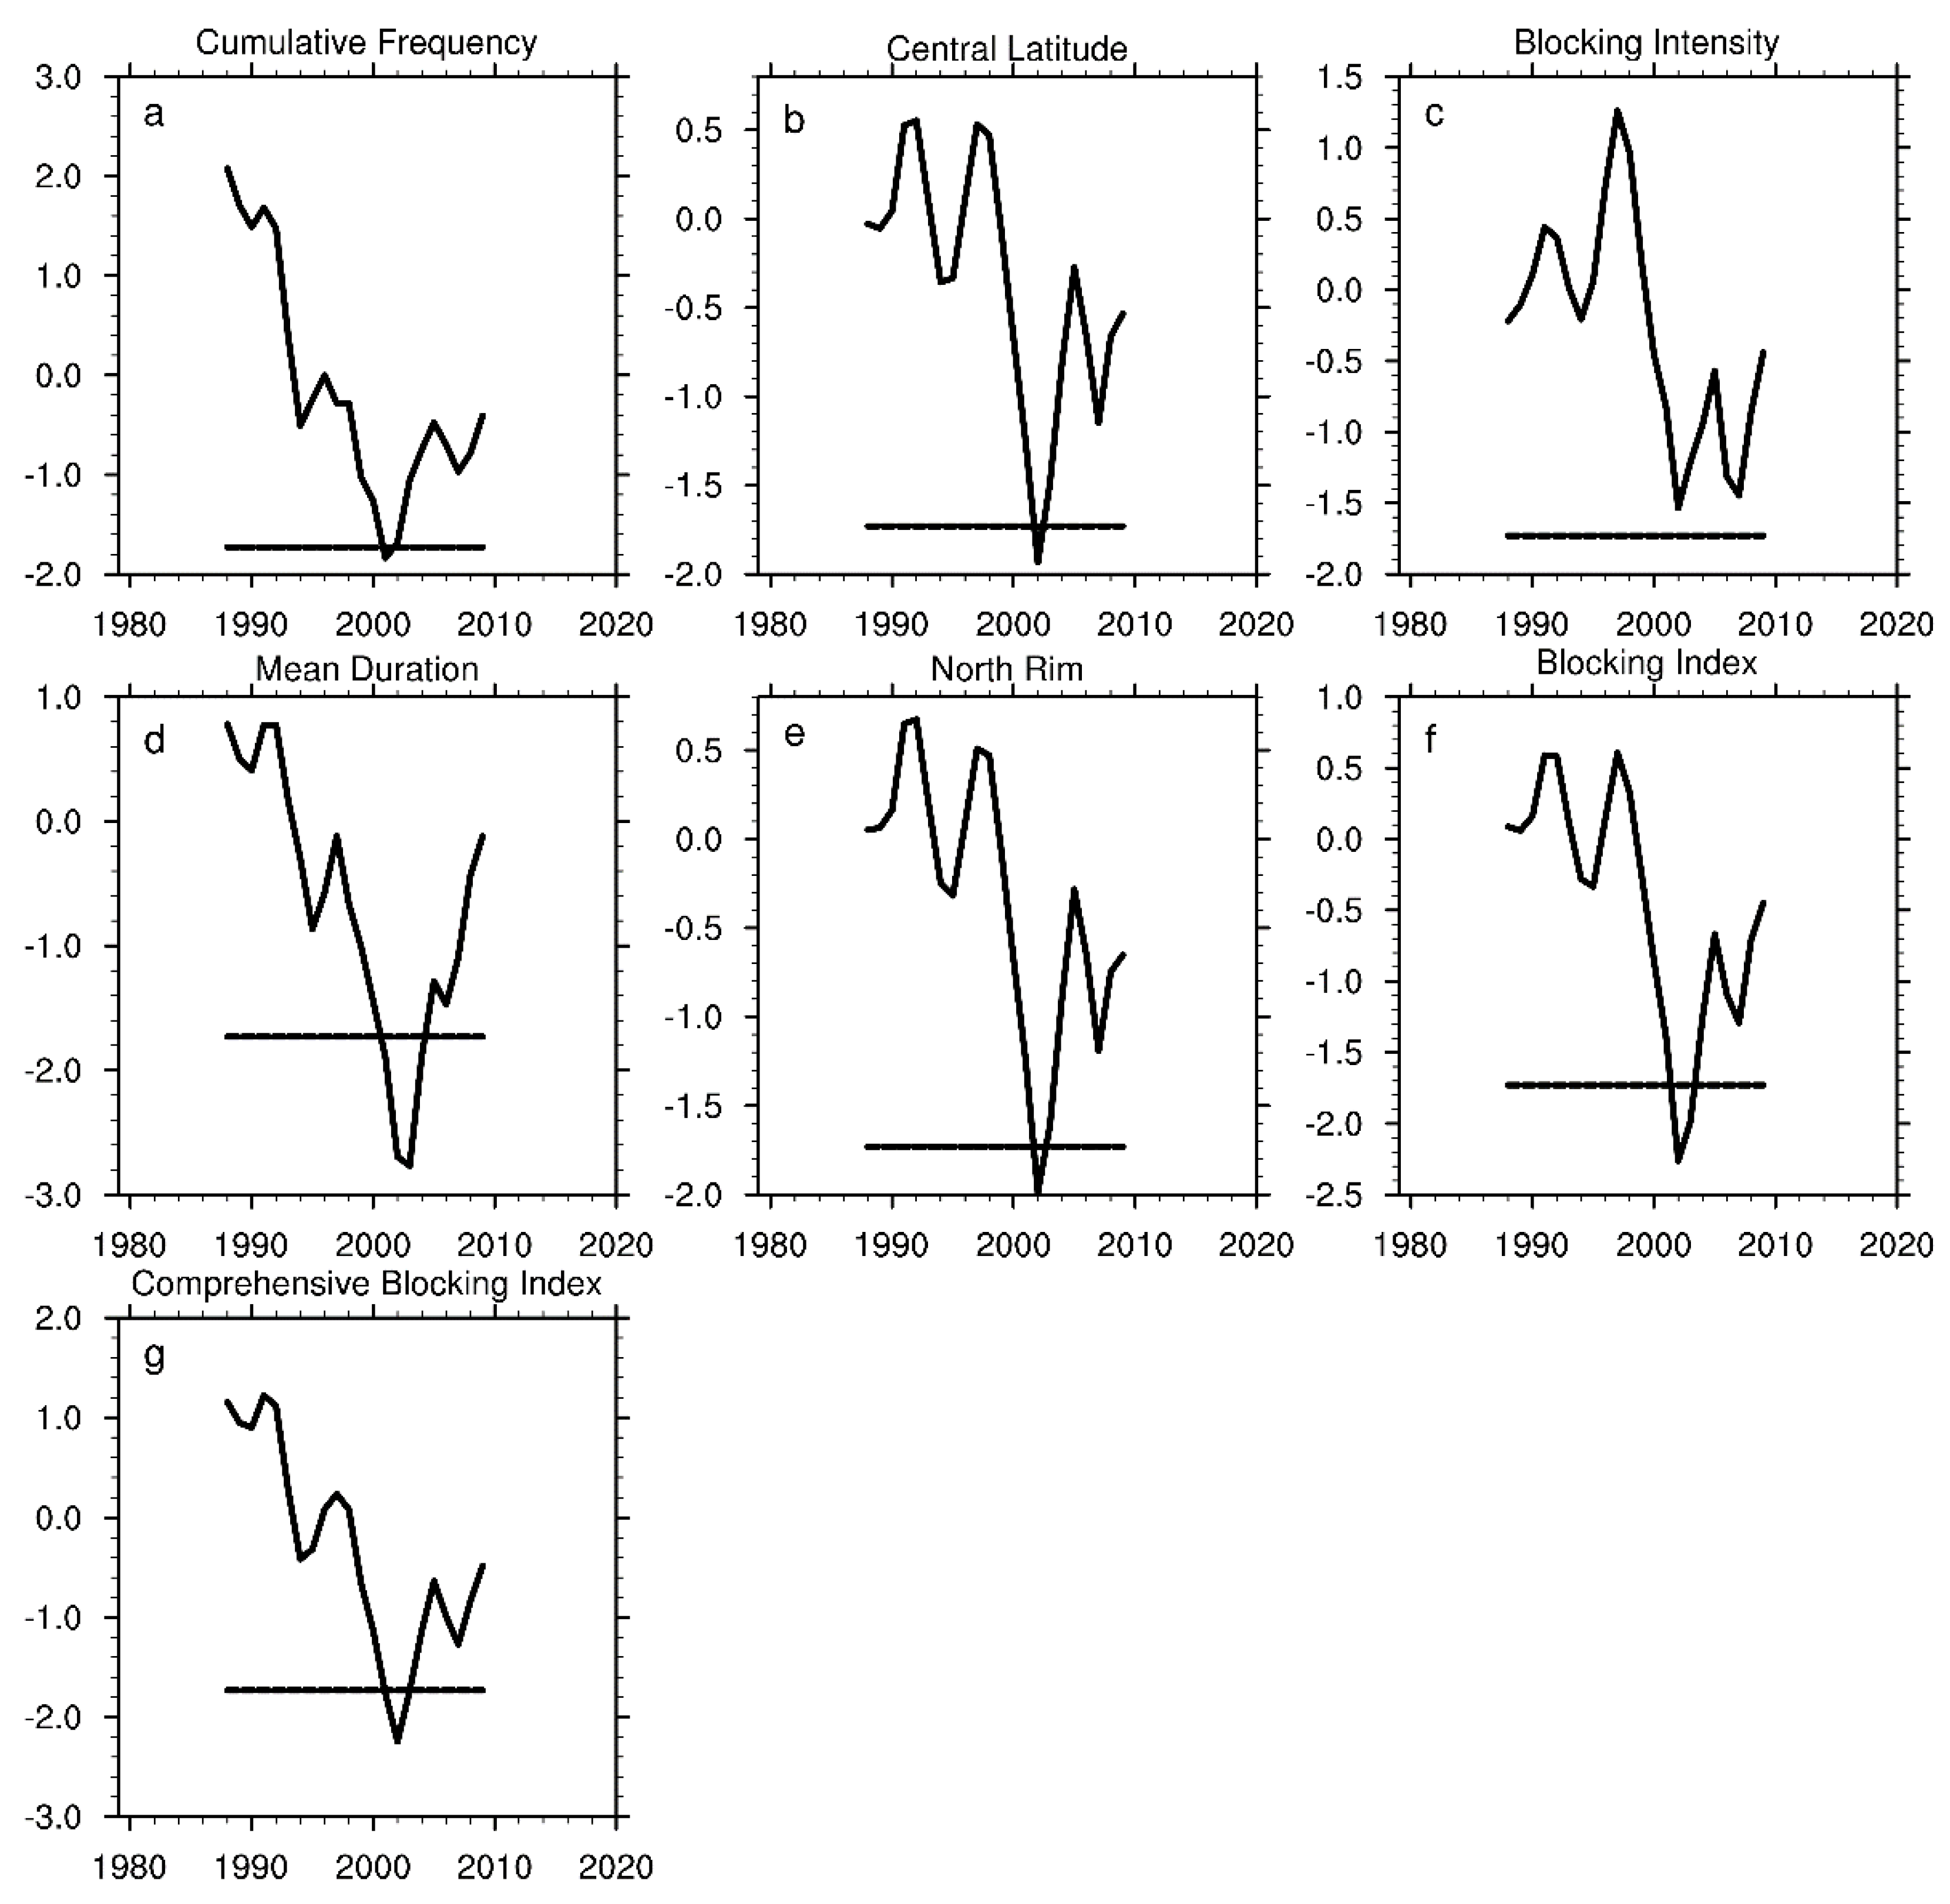
To confirm interdecadal characteristics of the UB in winter, the moving t-test is shown in Figure 2. It can be seen from Figure 2 that abrupt time of Fq, CL, DU and NR of the UB is around the winter of 2002, passing the significance test of 95%. Thereinto, the interdecadal change of DU is the most significant. Additionally, the interdecadal characteristics of intensity for the UB is not obvious. In other words, the UB occurs more frequently, lasts longer and is located more to the north in winter after 2002. The BI and CBI, as two newly constructed indexes, also turn the trend in winter 2002. Once again, the CBI is shown to be able to synthesize all aspects of blocking information.
The interdecadal change of the five single blocking indexes and the CBI may be related to Arctic warming. Previous studies have shown that the change of blocking highs in the Eurasian region in winter is closely related to Arctic Sea ice reduction [11,14,16]. A positive feedback mechanism between blocking highs and Arctic warming is also shown, i.e., Arctic warming is conducive for the stable maintenance of blocking, while the maintenance of the blocking high promotes further polar warming [40].
However, for a more direct reason for such an interdecadal change of the UB, we should analyze the atmospheric circulation and its internal factors. Synthesizing the analysis of Figure 1 and Figure 2, we define the 17 winters from 1985 to 2001 as Period 1 (P1), and the winters from 2002 to 2018 as Period 2 (P2) to explore the cause of atmospheric circulation related to interdecadal change of the UB in these two periods, respectively.

4. The Interdecadal Change of Atmospheric Circulation Related to the UB

The above analysis shows that there is a significant interdecadal change in the characteristics of the UB in winter around 2002. Then, are there also interdecadal changes in atmospheric circulation systems related to the UB? In this section, the interdecadal changes of atmospheric circulation are analyzed in the Northern Hemisphere (NH), aiming to understand the differences in circulation in winter before and after 2002.
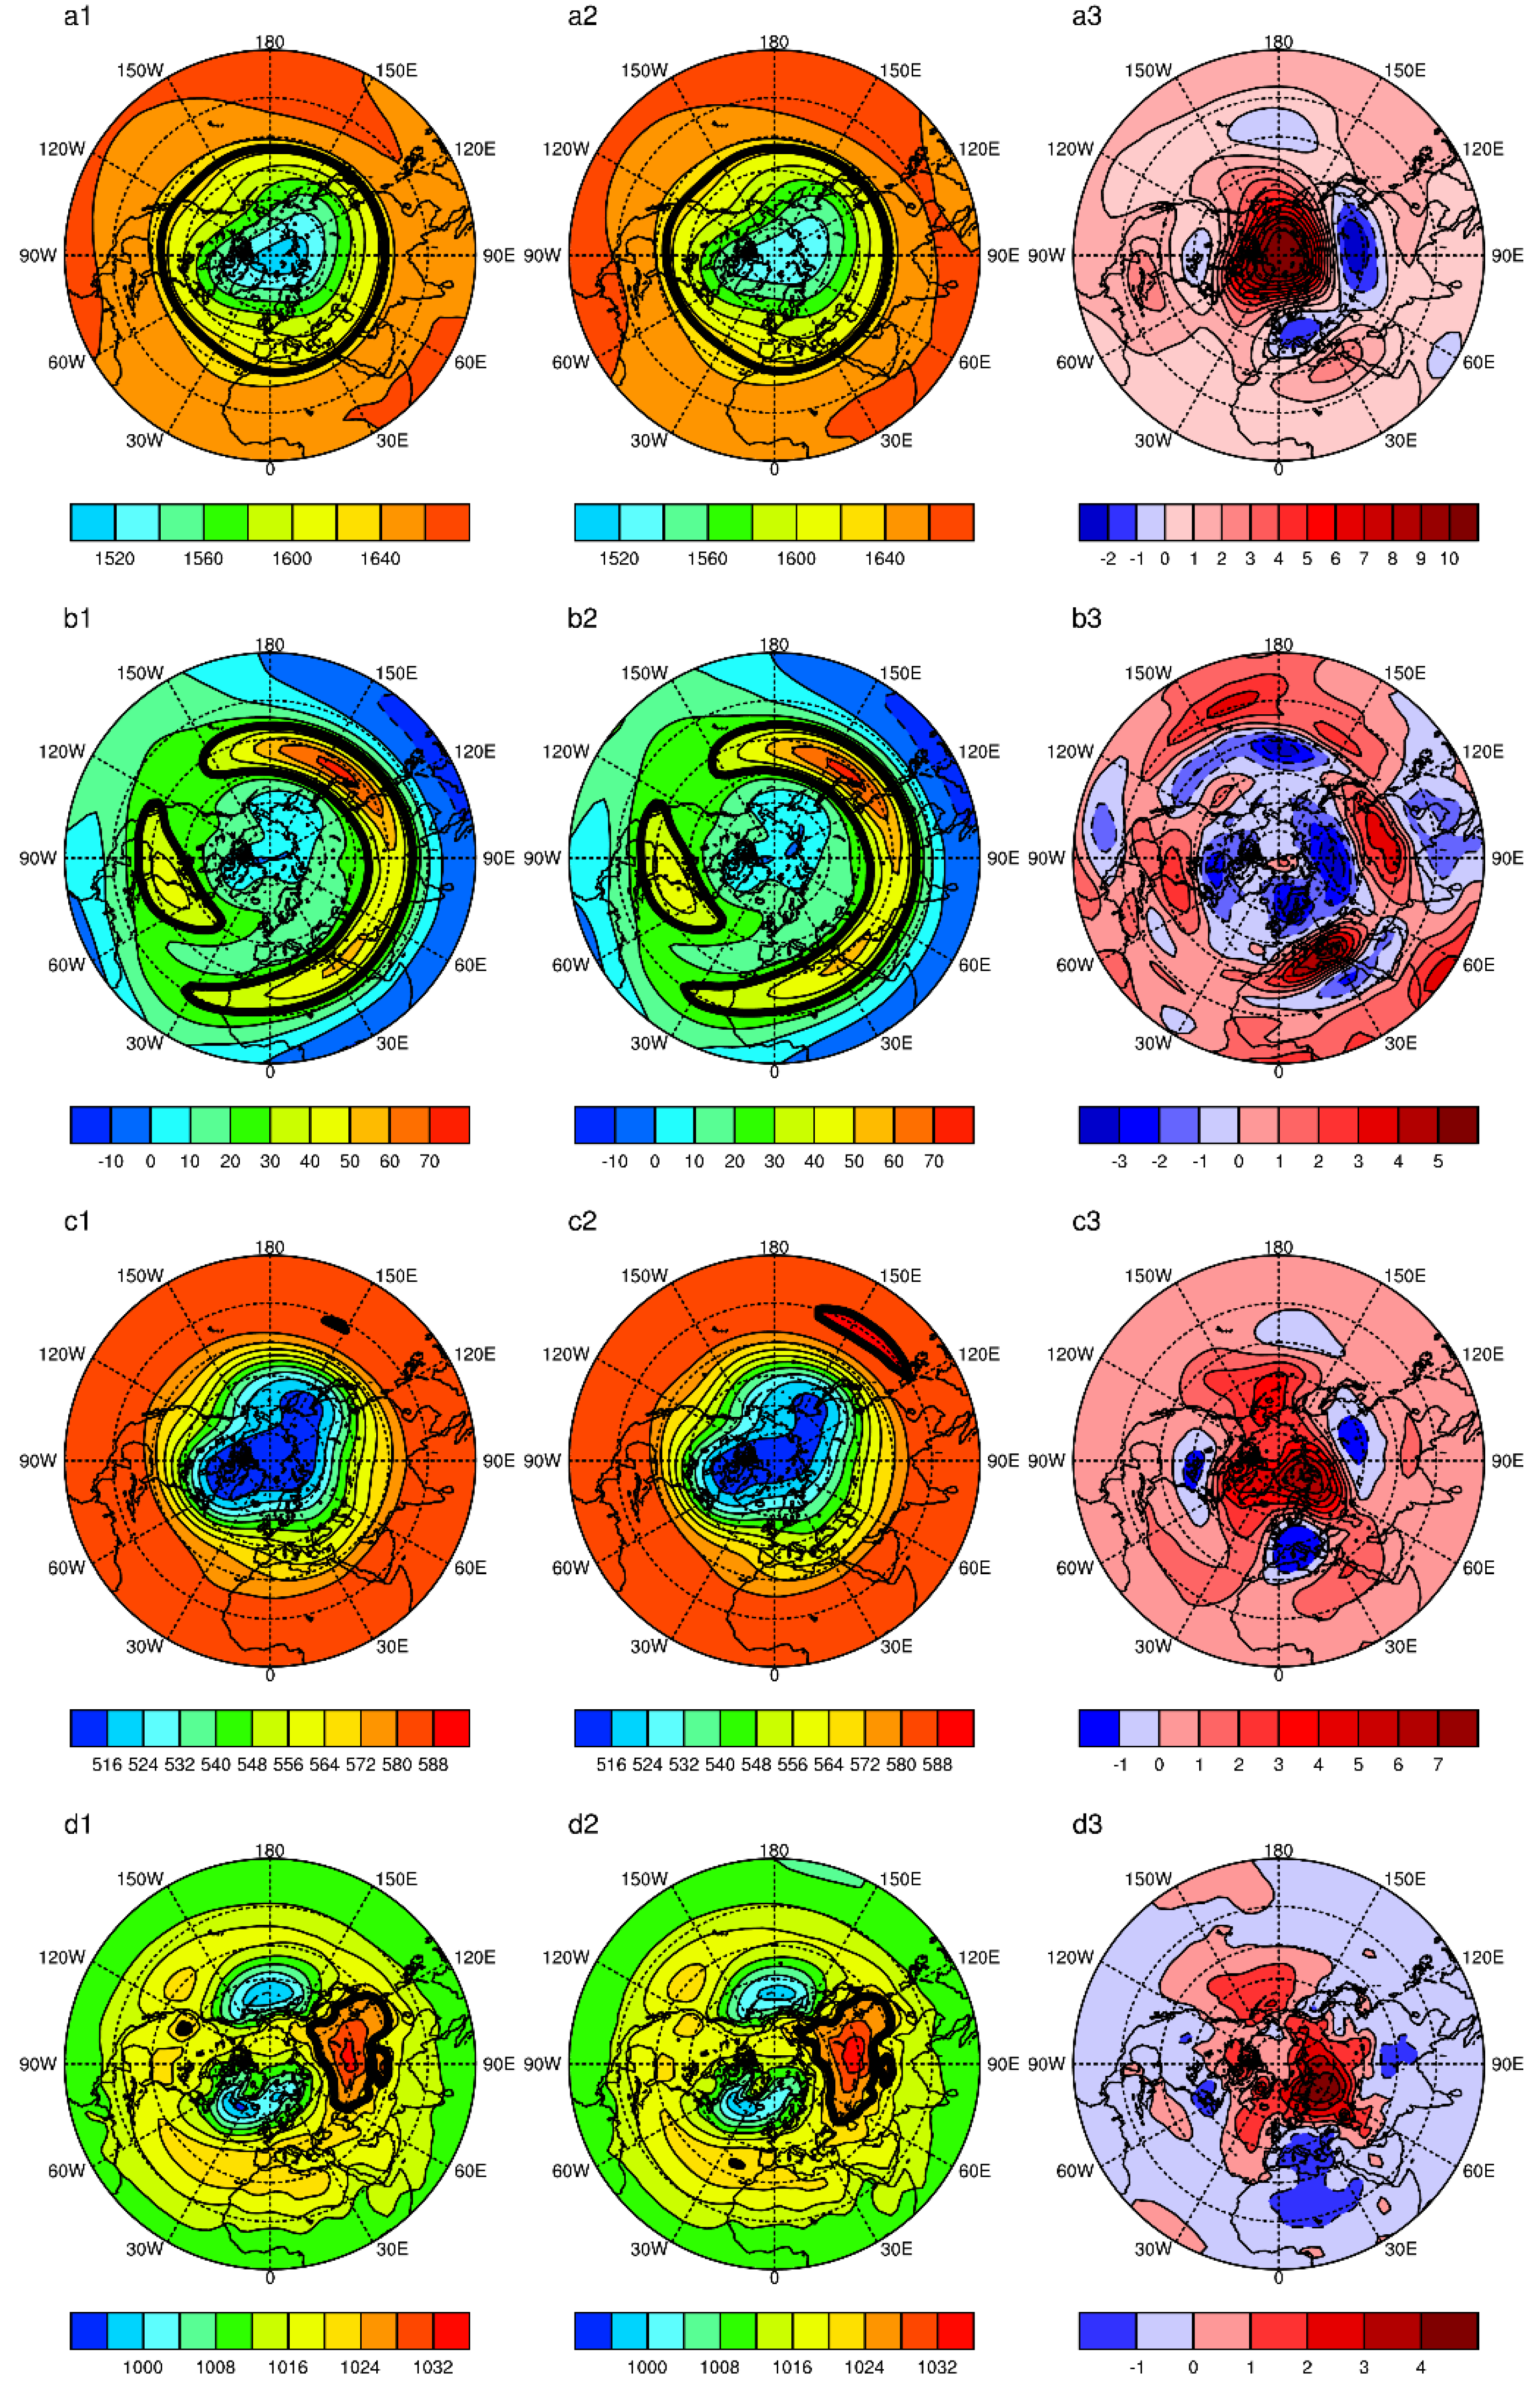
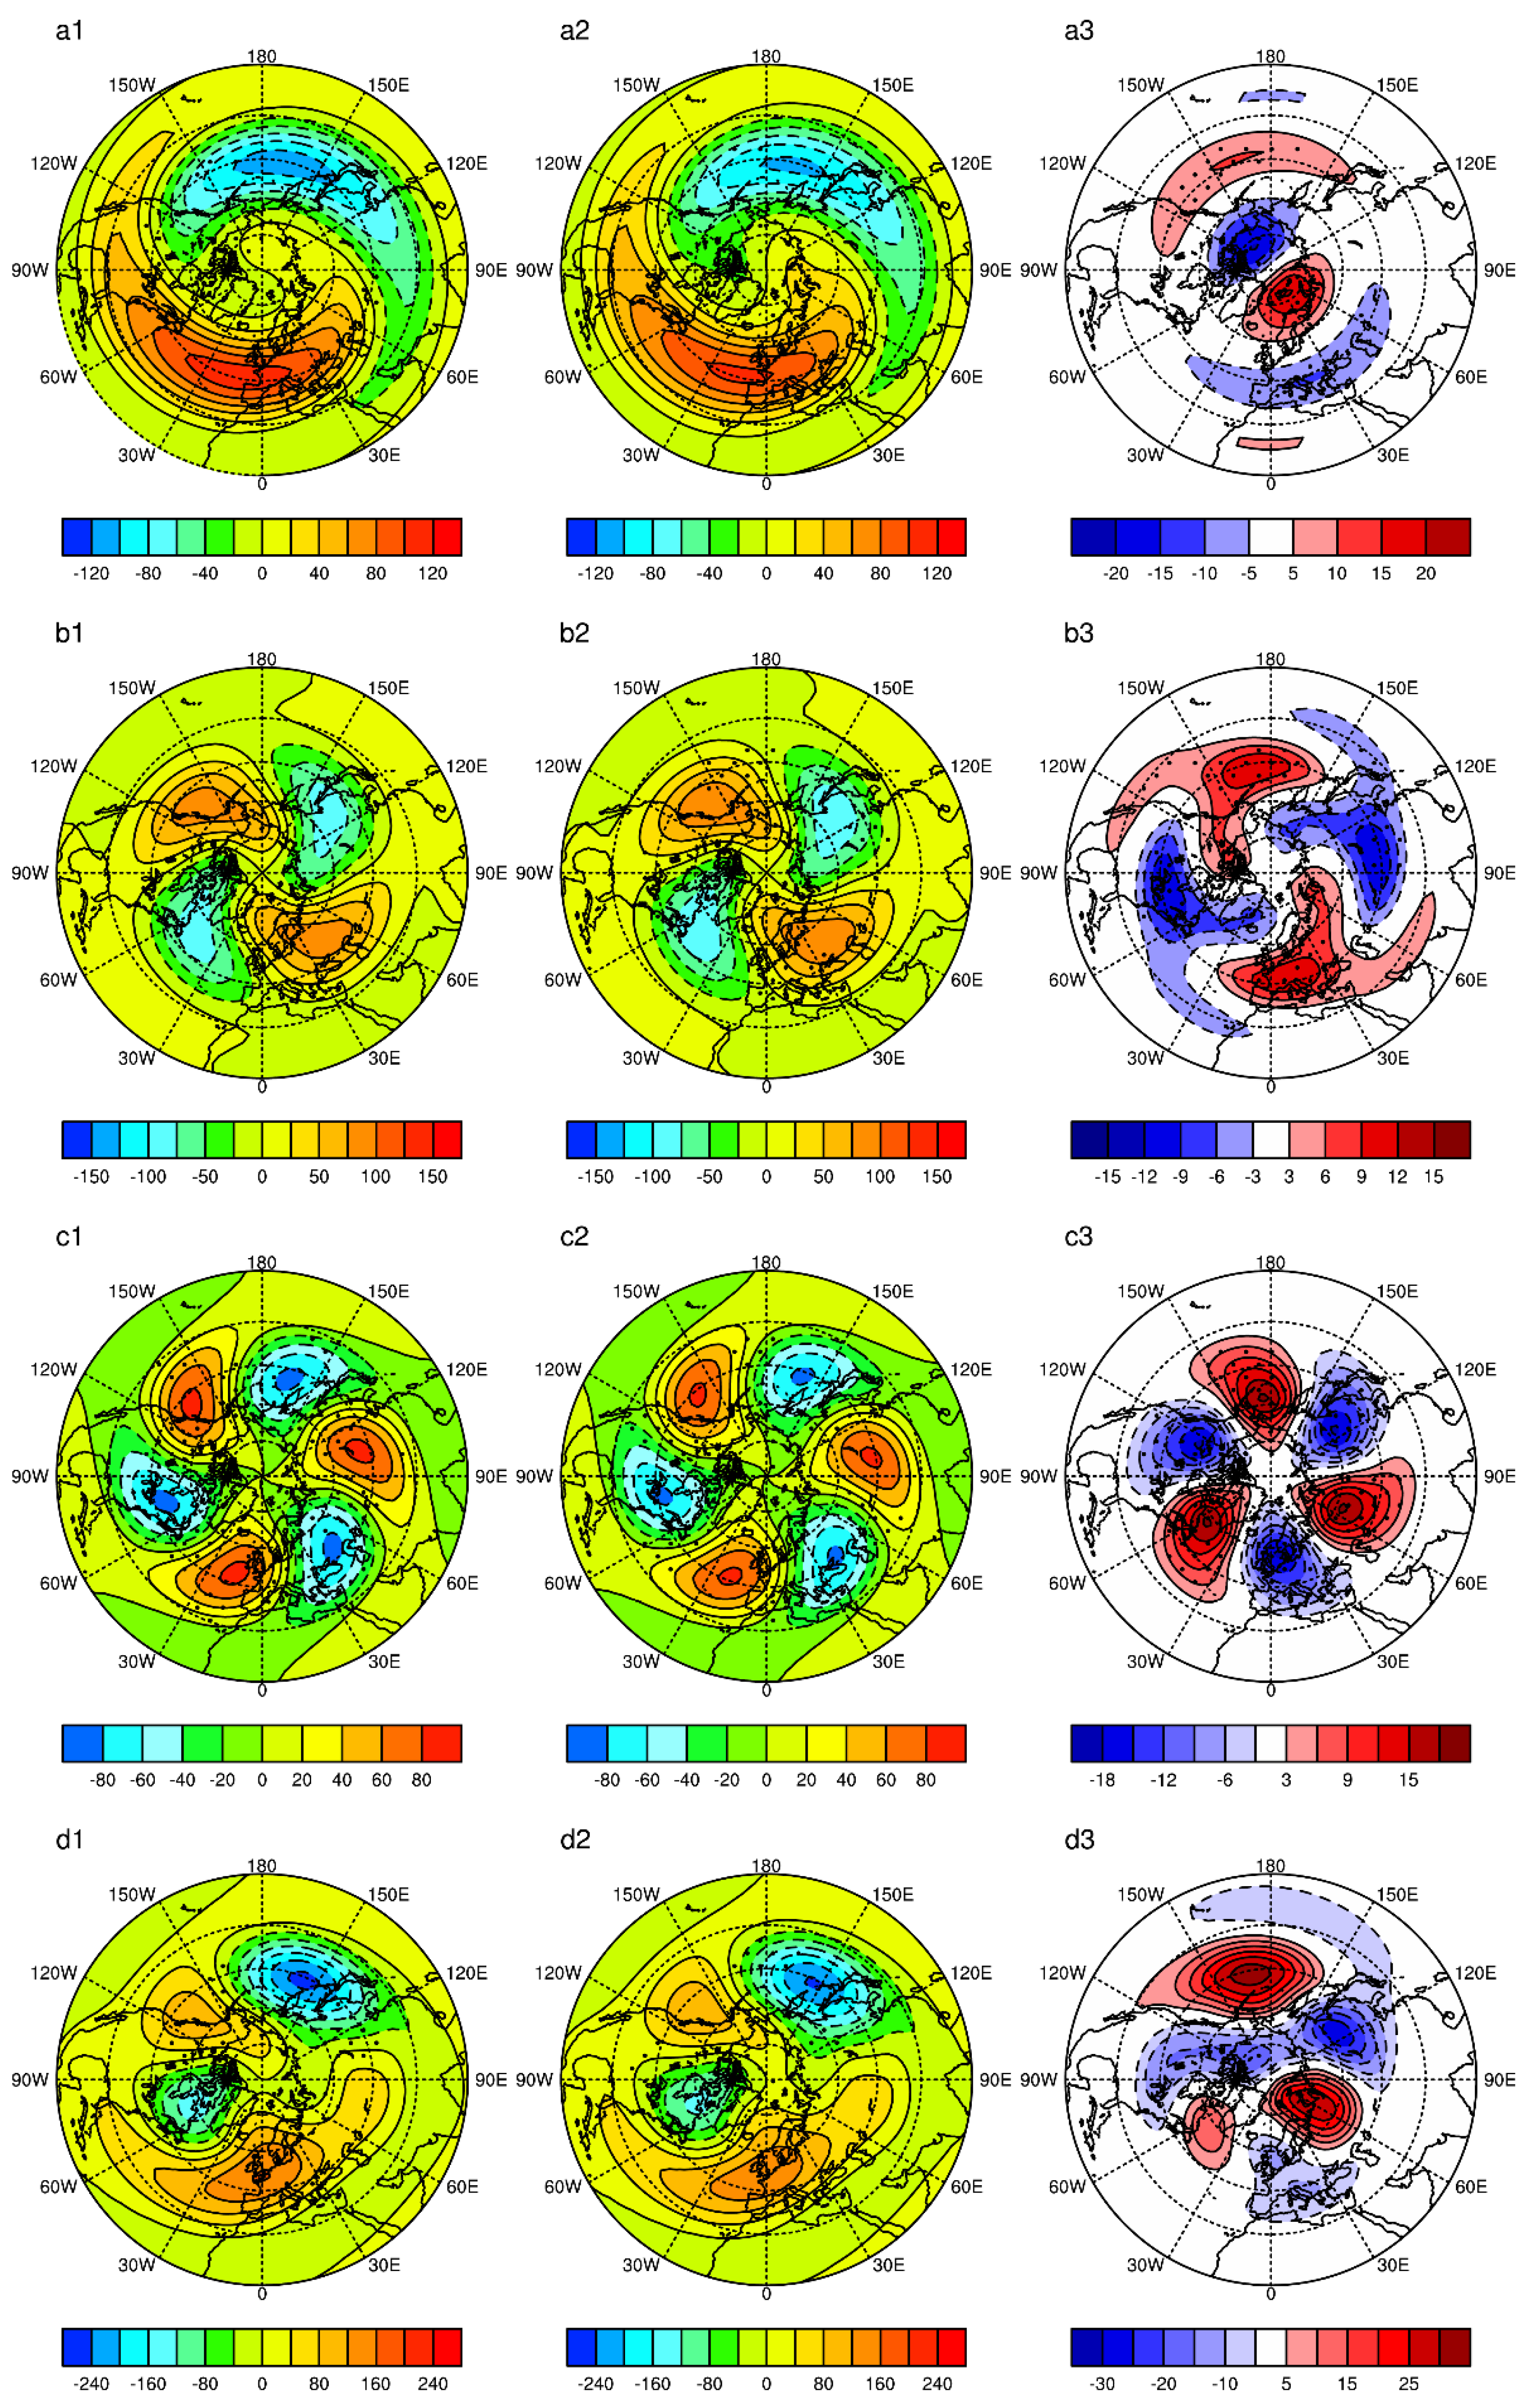
Figure 3 shows the GPH at 100 hPa Figure 3(a1,a2), the zonal winds at 200 hPa Figure 3(b1,b2), the GPH at 500 hPa Figure 3(c1,c2) and SLP Figure 3(d1,d2) during the two periods and their differences between the two periods, respectively (P2–P1, Figure 3(a3,b3,c3,d3)). The area above the North Pole is controlled by the low GPH, which is called the polar vortex at 100 hPa. There are small differences on the area surrounded by line 1628 dagpm, which is the characteristic contour of the polar vortex at 100 hPa during the two periods. However, the GPHs around high latitudes during the P2 are higher than that in P1, which is shown in Figure 3(a3), demonstrating that the intensity of the polar vortex at 100 hPa is weaker in P2. The weak polar vortex is favorable to provide a condition for the warm and wet airflow from the south to move northward, leading to the northern position and higher frequency of the UB. In addition, it is found that there are lower GPHs in the upper and downstream of the Urals (Figure 3(a3)), which may be caused by the cold air from the polar region pouring southward. The polar vortex is split towards Eurasia, which can easily lead to low temperature or cold weather in Eurasia [41].
A jet stream belt surrounding 30° N, called the subtropical jet stream, is separated around the Pacific (150° W), Atlantic (30° W) and the Urals (60° E), where the blocking highs are always located. There are small differences in the location of the subtropical jet at 200 hPa from Figure 3(b1,b2). However, the wind speeds are weaker in the above three locations in P2, indicating that the atmospheric circulation in the three key areas above become more sensitive during P2. Meanwhile, the westerly jet in mid-high latitude regions, especially north of the Urals, also weakens, which reduces the ability to hold cold air at the poles. In a word, the westerly jet in mid-high latitudes weakening is beneficial for the establishment of meridional circulation, which is in favor of the establishment and maintenance of the UB. It is shown that the subtropical jet over the Mediterranean and China are stronger in P2, indicating that the subtropical jet is stronger. As the atmospheric waveguide, the intensity changes of the jet stream can well instruct the weather evolution on the ground [42]. In winter, the EASJ plays a guiding role in cold air activities and guides frequent cold air activities [43].
From Figure 3(c3), it can be seen that the positive anomalies of GPH in high latitude regions are distributed around the North Pole, and they extend southward along the Pacific, Atlantic and especially the Urals at 500 hPa, where the jet streams rupture and blocking highs are always located. It also indicates that the change of the UB in middle latitudes is particularly closed to the polar changes. The area with the significant positive anomalies of GPH is biased toward the Urals, and the higher GPH over the Urals is more conducive for the occurrence and development of the UB. Meanwhile, there are negative anomalies of GPH downstream of the Urals that deepen the East Asian trough (EAT) in Figure 3(c3).
In Figure 3(d3), there are positive anomalies of SLP, especially over Siberia, which shows that the SH strengthens and the East Asian winter monsoon (EAWM) is stronger during P2. It will bring more cold air to most parts of Asia, causing extremely cold weather in most parts of Asia [3], which is consistent with the actual weather phenomenon.
In conclusion, accompanying the interdecadal change of the UB, the weather systems in the troposphere, such as the polar vortex, subtropical jet, westerly winds in the mid-high latitudes and SH, have obviously changed. The polar vortex is weaker, and it may deform and even split toward the Urals after 2002. At the same time, the westerly winds in the mid-high latitudes at 200 hPa are weak, the subtropical jet over China is strong and the SH strengthens. It is verified that the Urals will be a more sensitive area after 2002 during winter. Deformation of the polar vortex can be superimposed with the blocking high in the same phase to form an anticyclone opening, resulting in a penetrating outbreak of cold air at high to low latitudes [44], which is in favor of the extreme cold events forming.
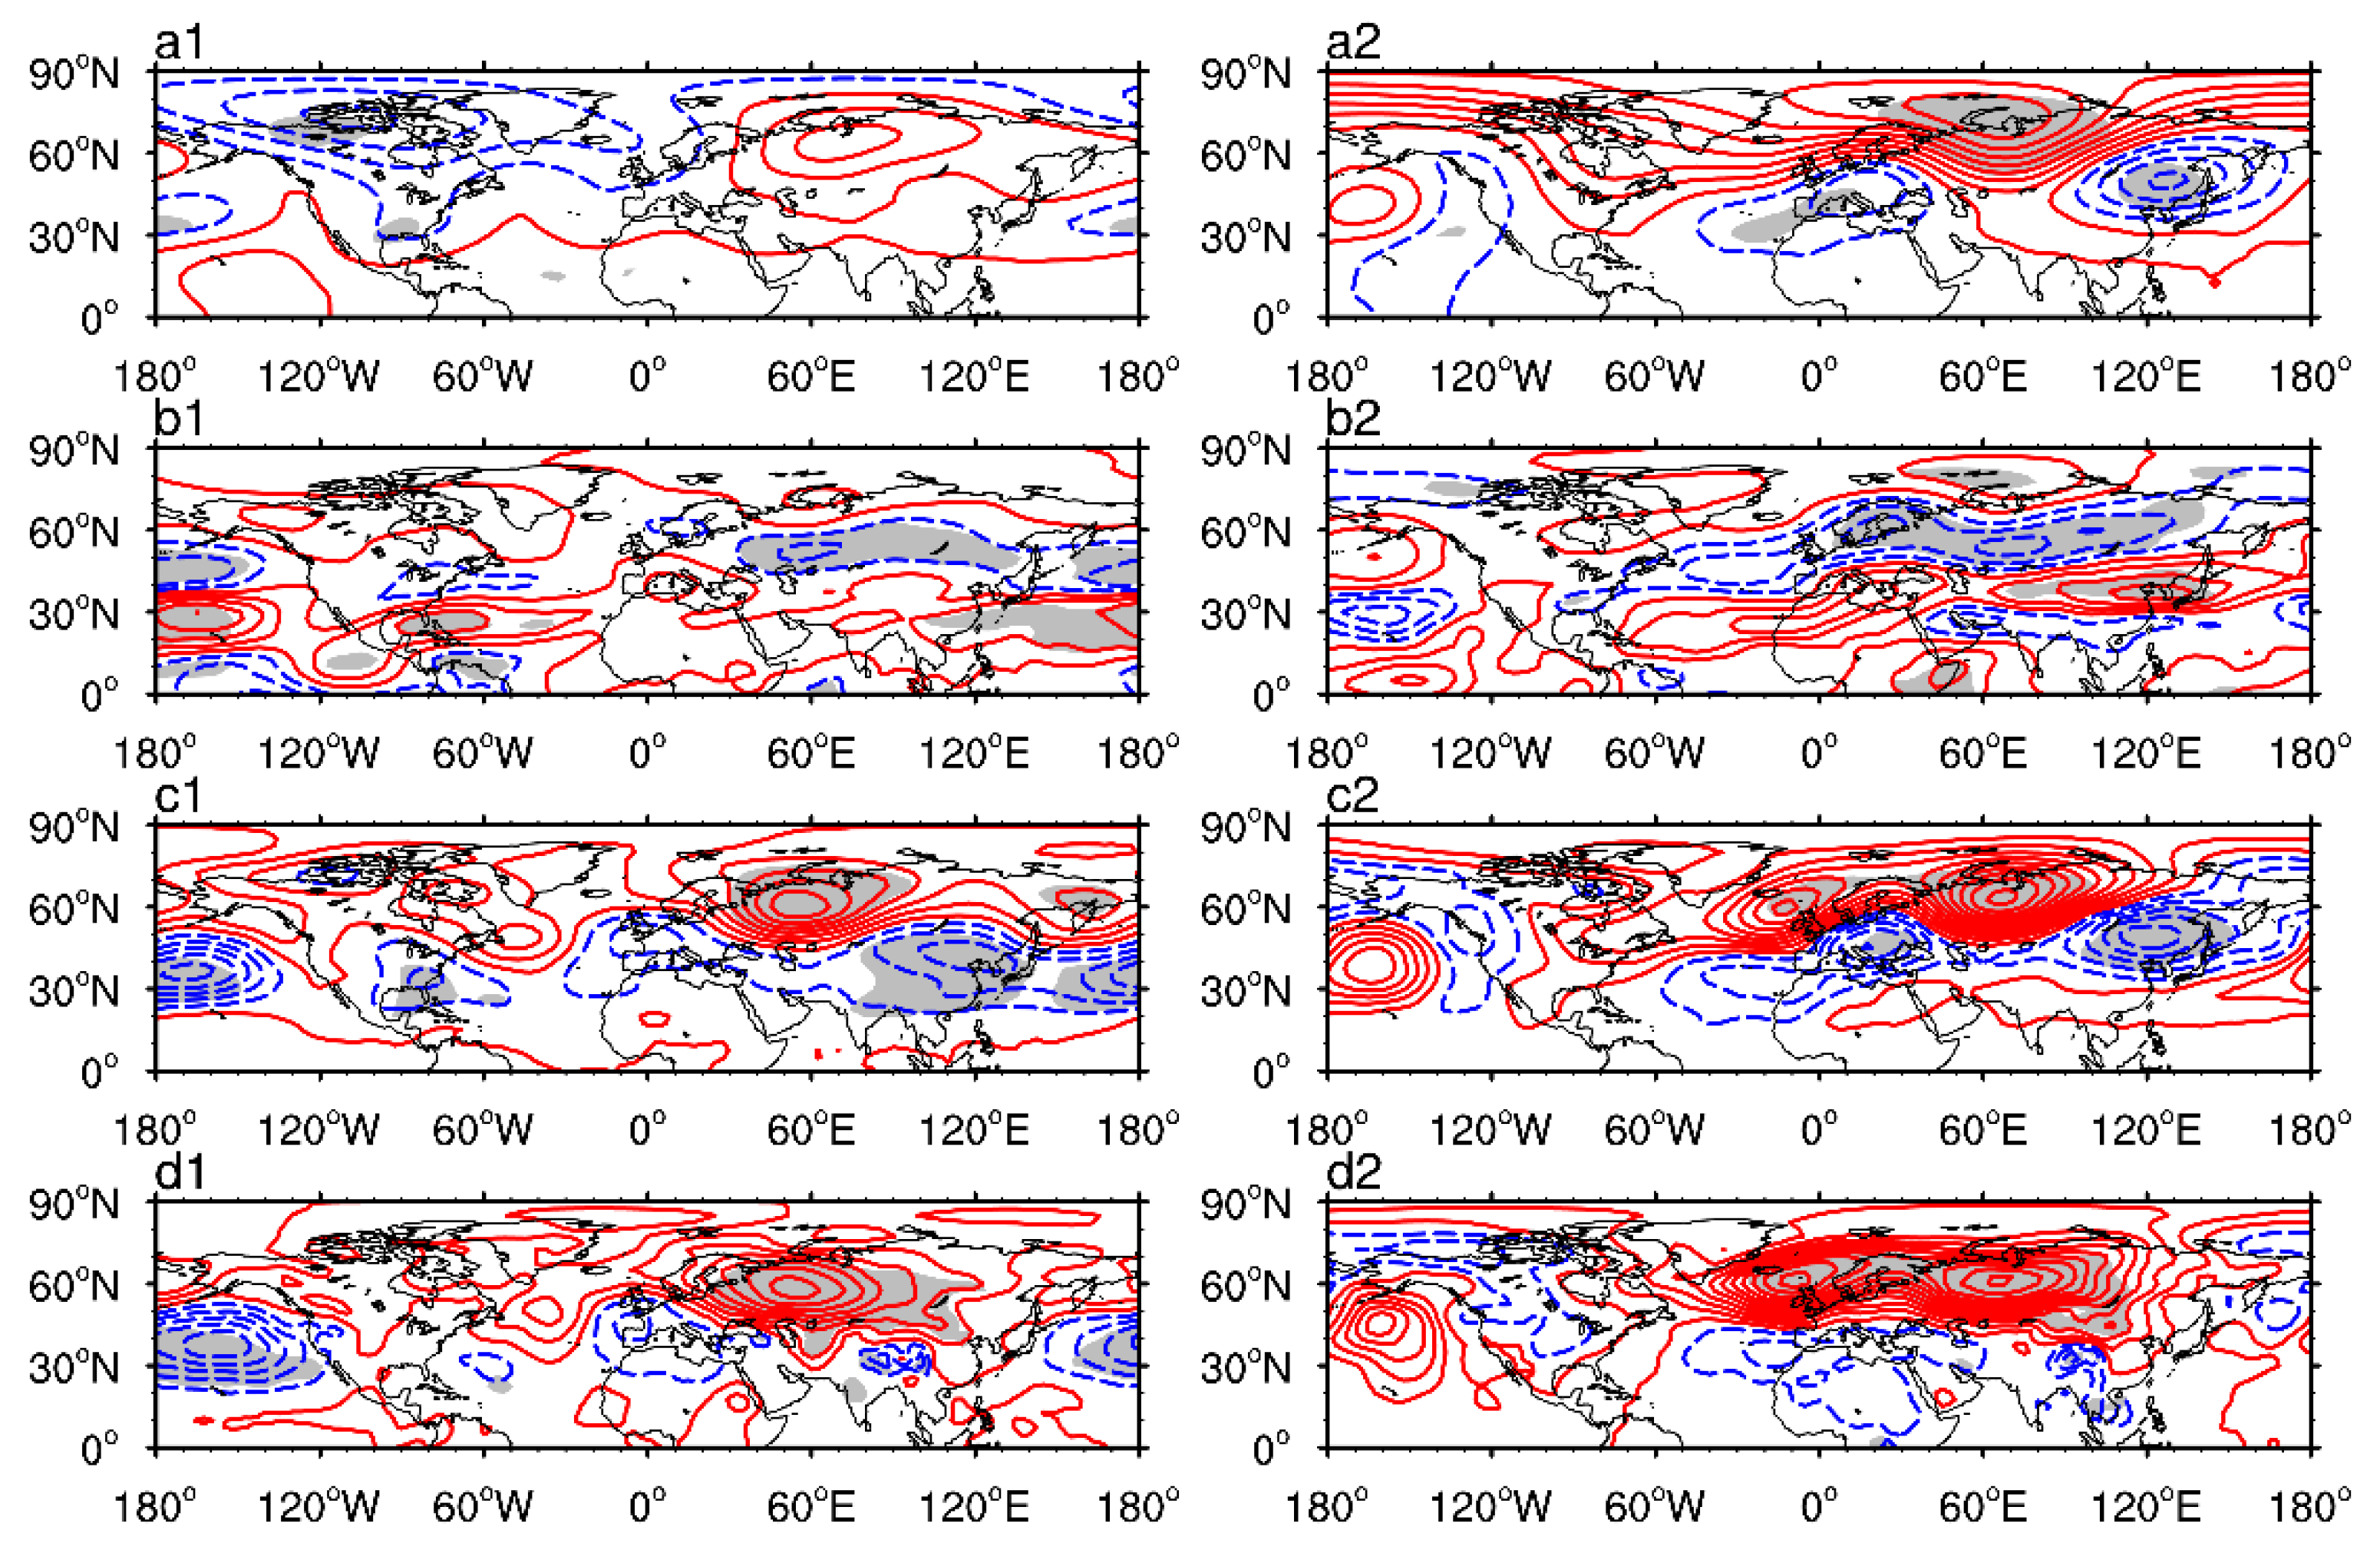
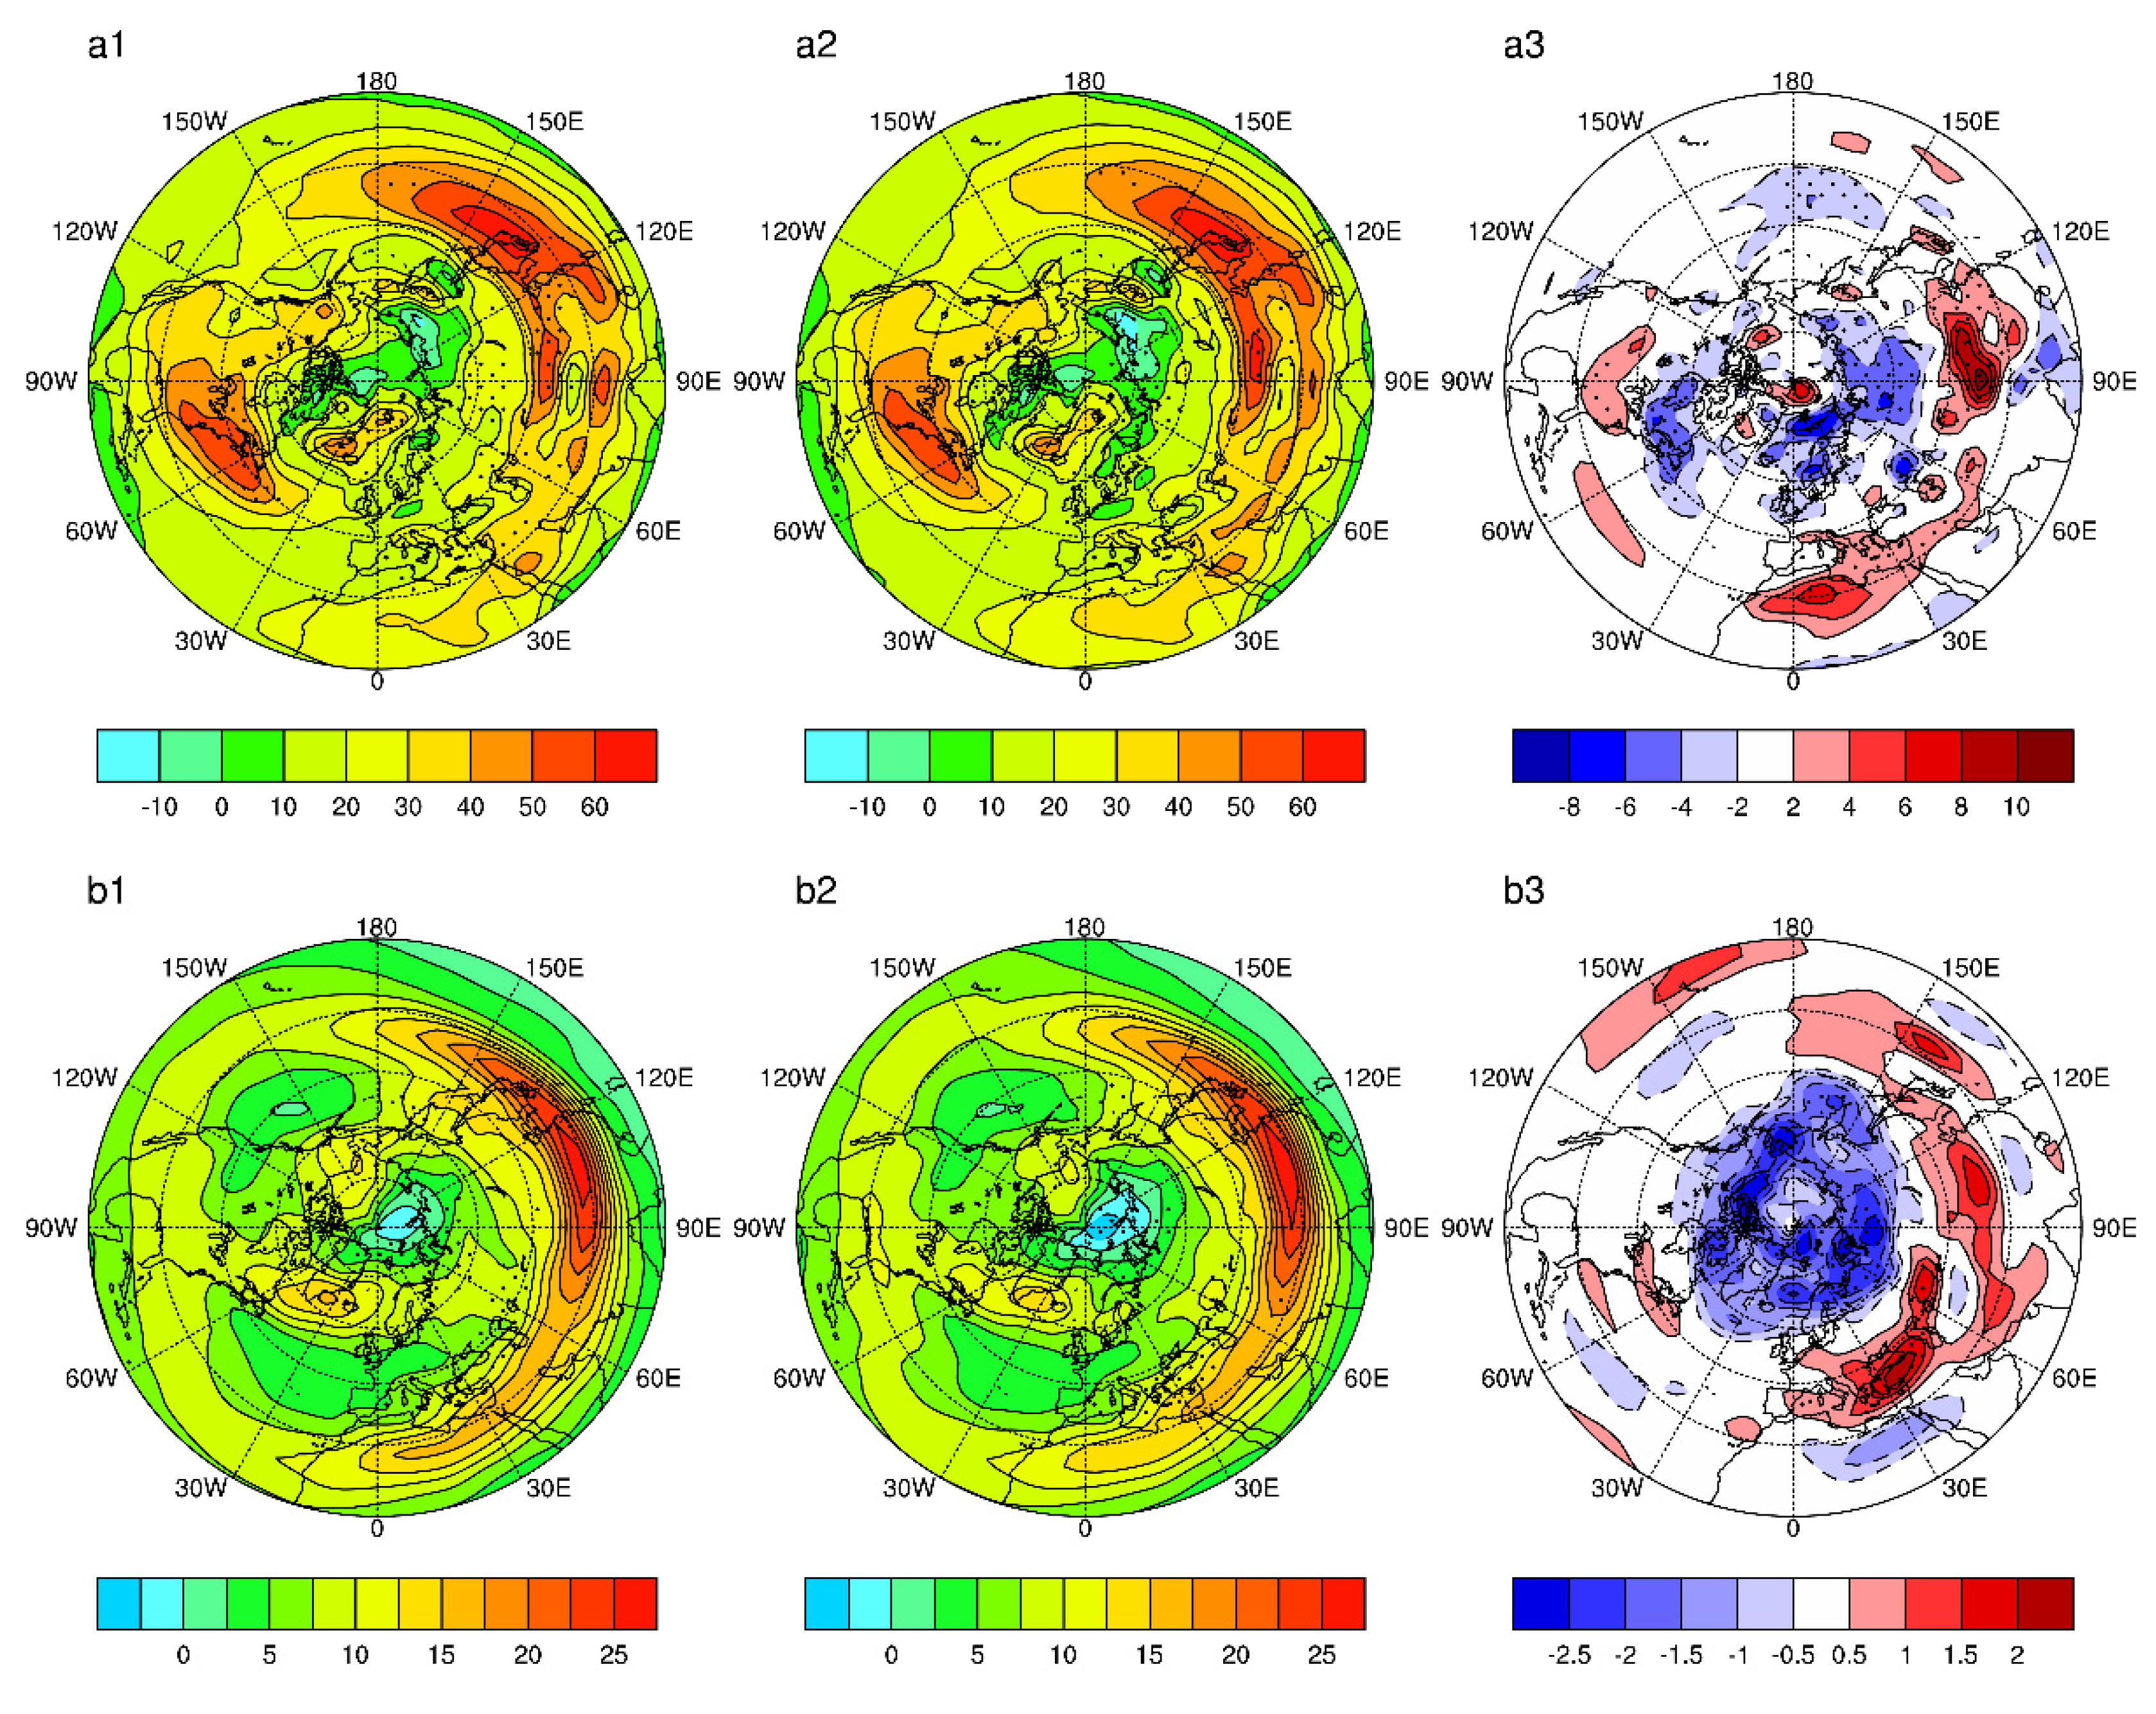
The study above has demonstrated that there are prominent interdecadal changes of the general circulation corresponding to the interdecadal change of the UB over these two periods. In addition, the CBI reflects the characteristics of the UB comprehensively. Thus, to confirm the closed relationship between UB and atmospheric circulation anomalies on the interdecadal scale, the linear regression coefficients of GPH at 100 and 500 hPa, U at 200 hPa and SLP against the CBI in winter are shown in Figure 4.
It is shown that there is a significantly negative correlation between the CBI and GPH north of North America at 100 hPa during 1985–2001 in winter in Figure 4(a1), which indicates that when the CBI is large, the polar vortex may be split toward North America, coupled with UB in winter during 1985–2001. However, the tight negative correlation is replaced by a positive one after 2002, shown in Figure 4(a2). Meanwhile, as the CBI is rather large, there are significant positive anomalies of GPH at high latitudes, indicating that the polar vortex is weaker. Additionally, the negative anomalies are located above the Sea of Japan at 100 hPa, illustrating that the polar vortex may split toward East Asia after 2002. It is consistent with research conclusions by Zhang et al. [41] that the polar vortex shifts towards the Eurasian continent and away from North America in winter after the 1980s. Compared with Figure 4(b1), it is shown in Figure 4(b2) that there is a more obviously negative correlation between the CBI and zonal winds over the Eurasian area at 200 hPa during 2002–2018 in winter, indicating that when the CBI is strong, the westerly winds here weaken. There is a stronger positive correlation between the CBI and the subtropical jet over China, which indicates that when the CBI is large, the subtropical jet over China is strong and guides the frequent activities of cold air during P2. When the CBI is large, the GPHs are high over the Urals at 500 hPa and low around the upstream and downstream of the Urals during the two periods, as shown in Figure 4(c1,c2). The negative anomalies are more significant over East Asia during P2, which demonstrates that the East Asian trough downstream of the Urals is stronger in winter after 2002. From Figure 4(d1,d2), there is a positive correlation between the CBI and the SLP around Siberia and the area is expanded, showing that when the CBI is large, the SH is strong in winter during 2002–2018.
In summary, it is shown that the characteristics of the UB and the relationship between the UB and atmospheric circulation do have interdecadal changes. After 2002, the UB occurs more frequently, strengthens, lasts longer and is located farther north. The relationship between the UB and polar vortex, subtropical jets, westerly winds in mid-high latitudes, EAT and SH in winter is more closed during 2002–2018 than it is in 1985–2001.
Since there are such obvious interdecadal changes in the atmospheric circulation in the NH, it must be affected by internal factors of the atmosphere, such as atmospheric waves, energy transformation and so on. The anomalies of large-scale circulation systems, such as the polar vortex and blocking high, are the external manifestation of the anomalies of large-scale waves. In addition, the fundamental energy for the evolution of weather systems in mid-high latitudes comes from the baroclinic energy. Moreover, previous studies have shown that there are also the significant changes of planetary scale waves and atmospheric baroclinicity under the background of global warming [45,46]. The results from Lu et al. [45] show that there is a transition of the spectral proportion of 1~3 waves in the 30–60° N latitude band at 500 hPa from less to more in the early 21st century. Additionally, Luo et al. [46] obtained the result that the atmospheric baroclinicity in winter reduces after the 1990s. Therefore, the internal causes of atmospheric circulation interdecadal changes in the NH will be explored in terms of planetary-scale waves and atmospheric baroclinicity in this study.

5. The Atmospheric Internal Causes of Interdecadal Changes

The distribution of atmospheric circulation anomalies at 100 and 500 hPa is similar, as shown in Figure 3 or Figure 4. Additionally, the blocking indexes in this study all are constructed by the GPH at 500 hPa, so we only study the atmospheric planetary scale waves at 500 hPa to represent the whole situation in the mid-upper troposphere. The distribution of 1, 2 and 3 waves and differences between two periods (P2–P1) at 500 hPa, respectively, are shown in Figure 5.
Compared with that in P1, the amplitude of wave 1, 2 and 3 increases north of 60° N, especially over the Urals during P2, as shown in Figure 5, indicating that meridional activity is stronger in P2. Meanwhile, one peak of planetary 2 wave is located over the Urals, demonstrating that the increase in amplitude of 2 wave has an important effect on the increase in frequency and northward location of the UB during P2.
Under the joint action of 1, 2 and 3 waves, the key area in the Urals is controlled by wave peaks, and the amplitude increases in P2. Additionally, the distribution pattern in Figure 5(d3) is similar to that in Figure 4(c2), which demonstrates that the anomalies of general circulation related to the UB are dominated by the combined effect of 1–3 waves mainly. This is consistent with the research conclusions from Lejenäs and Döös [47], which show that the amplitude of planetary scale waves is stronger than that in the climate when a blocking high occurs. Planetary scale waves provide a good atmospheric background for the activity of UB in winter.
The atmosphere baroclinicity is the most fundamental reason for the change of atmospheric circulation in a mid-high latitude area [46]. The integral of meridional temperature gradient ( T / y ) on different levels of troposphere is shown in Figure 6. The integral level is determined by the vertical distribution of tropospheric temperature. Compared with that in P1, the P b P t T / y d p is large at 30–45° N, especially over Eurasia, which accelerates and moves the subtropical jet north, corresponding to Figure 3b and Figure 4b. Additionally, the area north of 45° N is controlled by negative P b P t T / y d p anomalies, especially around the 60° E Urals regions, shown in Figure 6(a3,b3), which indicates that the baroclinicity is reduced and the zonal winds weaken during P2. This is consistent with the conclusions reached by Francis and Vavrus [20,21]. They believe that after the 1990s, under the influence of the Arctic amplification effect, the temperature difference between the polar region and the mid-high latitudes decreases, the baroclinicity weakens, the zonal wind weakens and the movement of large-scale Rossby wave slows down from west to east.
There are two ways the baroclinicity influences the UB. On one hand, the meridional circulation is strengthened due to the weak zonal wind in mid-latitudes, which is in favor of the occurrence of a blocking high and northward movement. Therefore, UB is more frequent and located farther north in P2. On the other hand, when the atmospheric baroclinicity weakens, there is weak dispersion and strong nonlinearity of blockings, which makes the duration of the blocking increase and the strength grow stronger.

6. Summary and Discussion

In this paper, five single blocking indexes, concluding the cumulative frequency (Fq), central latitude (CL), intensity (IB), duration (DU) and north rim (NR) index are defined, and they all show an obvious interdecadal change from negative to positive in winter around 2002 and during 1979–2018. In other words, the UB occurs more frequently, strengthens, lasts longer and is located more towards the north in winter after 2002. The newly constructed comprehensive blocking index which describes the blocking high broadly can reflect the interdecadal changes well. The researchers demonstrate that the anticyclone of the polar high merged with mid-latitude blocking highs will make the polar cold air form a penetrating outbreak from high latitude to low latitude [44], which results in extreme low temperature events affecting most areas of China in recent years.
The general atmospheric circulation related to the UB between the two periods (1985–2001 as Period 1 (P1); 2002–2018 as Period 2 (P2)) is compared, and we find the polar vortex is weaker during P2, and the weak polar vortex is deformed along the Pacific, Atlantic and the Urals. The three key regions are also where the subtropical jet breaks at 200 hPa. Additionally, the westerly winds at mid-high latitudes weaken during P2, which is beneficial for the establishment of meridional circulation, such as the UB. The GPH of 500 hPa at mid-high latitudes increases during P2, and growing GPH also invades southward along the above three key regions; the most significant tends to be the Urals, which highlights the sensitivity of the Urals. Additionally, the SH is stronger in P2 than during P1. Thus, the EAWM strengthens, leading the extreme cold events to occur more frequently.
The general circulation of the NH in P2 is shown as the polar vortex weakens, the subtropical jet over China strengthens and shifts northward, the westerly winds at mid-high latitudes weaken at 200 hPa and the EAT and SH strengthen. The relationship between the UB and the aforementioned atmospheric symptoms is more closed in P2 than that in P1.
The anomaly of atmospheric circulation in the NH related to the UB can be explained by the abnormal amplitude of wave 1–3; in particular, the increase in amplitude of wave 2 is beneficial for the development of meridional circulation in the Urals. In P2, the integral of meridional temperature gradient in the troposphere, especially in the upper-middle layer, is weaker at mid-high latitudes, then the weak baroclinicity may lead to a weak thermal wind; thus, the zonal wind weakens, which is conducive for the occurrence of meridional circulation similar to the blocking highs. Meanwhile, when the baroclinicity is weak, the weak dispersion and strong nonlinearity of the blockings makes the duration of the blocking increase and the strength strong.
The interaction between the upper and lower layers of the troposphere is mainly completed by the up and down propagation of large-scale waves. The study shows that the blocking high can affect the upper atmospheric circulation by adjusting the vertical wave flux [15]. The abnormal wave caused by blocking affects the upward planetary wave flux through the superposition of the same or opposite phase with the climate state [48]. The abnormal zonal winds associated with polar vortex can affect the blocking frequency by adjusting the jet driven by the troposphere vortex [49]. The blocking situation will force the upward anomaly of planetary waves and affect the polar vortex in the upper layer. At the same time, the upward planetary waves will also be reflected back to the middle troposphere, and then affect the blocking situation [50].
This paper only analyzes the interdecadal change characteristics of the UB and atmospheric circulation related to the UB in winter between different decades, and the theoretical thermodynamic mechanism under the interdecadal change is absent. The external forcing factors such as Arctic sea-ice and sea surface temperature anomalies are primary reasons of UB change which should be investigated. In addition, the feedback among atmospheric circulations in different time scales will be researched in our further study.

Author Contributions

Conceptualization, Y.L. (Yan Li) and C.W.; Data curation, Y.L. (Yao Lu); Formal analysis, Y.L. (Yao Lu), Q.X. and Q.Y.; Funding acquisition, Y.L. (Yan Li); Project administration, Y.L. (Yao Lu) and Q.X.; Validation, Y.L. (Yan Li) and C.W.; Writing-original draft, Y.L. (Yao Lu); Writing-review and editing, Y.L. (Yan Li), Q.X. and Q.Y. All authors have read and agreed to the published version of the manuscript.

Funding

The final funding project is “Gansu Province University Industry Support Plan Project (2020C-34), Major Scientific and Technological Project of Lanzhou Resources & Environment Voc-Tech University (XJZD2023-03), Gansu Natural Science Foundation (21JR7RA772; 21JR7RA497; 21JR7RA495), Natural Science Foundation of China (41775051) and Gansu Province University Innovation Funding Project in 2021 (2021A-248)”.

Conflicts of Interest

The authors declare no conflict of interest.

References

  1. Rex, D.F. Blocking action in the middle troposphere and its effect upon regional climate. Tellus 1950, 2, 196–211. [Google Scholar] [CrossRef]
  2. Charney, J.G.; Devore, J.G. Multiple flow equilibria in the atmosphere and blocking. J. Atmos. Sci. 1979, 36, 1205–1216. [Google Scholar] [CrossRef]
  3. Cheung, H.N.; Zhou, W.; Mok, H.Y.; Wu, M.C.; Shao, Y. Revisiting the climatology of atmospheric blocking in the Northern Hemisphere. Adv. Atmos. Sci. 2013, 30, 397–410. [Google Scholar] [CrossRef]
  4. Chen, D.; Qiao, S.; Tang, S.; Cheung, H.N.; Liu, J.; Feng, G. Predictability of the strong Ural blocking event in January 2012 in the sub-seasonal to seasonal models of Europe and Canada. Atmosphere 2020, 11, 538. [Google Scholar] [CrossRef]
  5. Takaya, K.; Nakamura, H. Mechanisms of intraseasonal amplification of the cold Siberian high. J. Atmos. Sci. 2005, 62, 4423–4440. [Google Scholar] [CrossRef]
  6. Yao, Y.; Zhang, W.; Luo, D.H.; Zhong, L.; Pei, L. Seasonal cumulative effect of Ural blocking episodes on the frequent cold events in China during the early winter of 2020/21. Adv. Atmos. Sci. 2022, 39, 609–624. [Google Scholar] [CrossRef]
  7. Wang, L.; Chen, W.; Zhou, W.; Chan, J.C.; Barriopedro, D.; Huang, R. Effect of the climate shift around mid 1970s on the relationship between wintertime Ural blocking circulation and East Asian climate. Int. J. Climatol. 2009, 30, 153–158. [Google Scholar] [CrossRef]
  8. Cheung, H.H.N.; Zhou, W. Implications of Ural blocking for East Asian winter climate in CMIP5 GCMs. Part I: Biases in the historical scenario. J. Clim. 2015, 28, 2203–2216. [Google Scholar] [CrossRef]
  9. Cheung, H.H.N.; Zhou, W. Implications of Ural blocking for East Asian winter climate in CMIP5 GCMs. Part II: Projection and uncertainty in future climate conditions. J. Clim. 2015, 28, 2217–2233. [Google Scholar] [CrossRef]
  10. Shi, X.; Zhi, X. Statistical characteristics of blockings in Eurasia from 1950 to 2004. J. Nanjing Inst. Meteorol. 2007, 30, 338–344. (In Chinese) [Google Scholar] [CrossRef]
  11. Yao, Y.; Luo, D.; Zhong, L. Effects of northern hemisphere atmospheric blocking on arctic sea ice decline in winter at weekly time scales. Atmosphere 2018, 9, 331. [Google Scholar] [CrossRef]
  12. Luo, D.; Xiao, Y.; Yao, Y.; Dai, A.; Simmonds, I.; Franzke, C.L. Impact of Ural blocking on winter warm Arctic-cold Eurasian anomalies. Part I: Blocking-induced amplification. J. Clim. 2016, 29, 3925–3947. [Google Scholar] [CrossRef]
  13. Luo, D.; Xiao, Y.; Diao, Y.; Dai, A.; Franzke, C.L.; Simmonds, I. Impact of Ural blocking on winter warm Arctic-cold Eurasian anomalies. Part II: The link to the North Atlantic Oscillation. J. Clim. 2016, 29, 3949–3971. [Google Scholar] [CrossRef]
  14. Chen, X.; Luo, D.; Feldstein, S.B.; Lee, S. Impact of winter Ural blocking on arctic sea ice: Short-time variability. J. Clim. 2017, 31, 2267–2282. [Google Scholar] [CrossRef]
  15. Lu, C.H.; Ding, Y.H. Observational responses of stratospheric sudden warming to blocking highs and its feedbacks on the troposphere. Sci. Bull. 2013, 11, 1374–1384. [Google Scholar] [CrossRef]
  16. Walsh, J.E. Intensified warming of the Arctic: Causes and impacts on middle latitudes. Glob. Planet. Chang. 2014, 117, 52–63. [Google Scholar] [CrossRef]
  17. Luo, D. Planetary-scale baroclinic envelope Rossby solitons in a two-layer model and their interaction with synoptic-scale eddies. Dyn. Atmos. Ocean. 2000, 32, 27–74. [Google Scholar] [CrossRef]
  18. Yao, Y.; Luo, D.; Dai, A.; Simmonds, I. Increased quasi stationarity and persistence of winter Ural blocking and Eurasian extreme cold events in response to arctic warming. Part I: Insights from observational analyses. J. Clim. 2017, 30, 3549–3568. [Google Scholar] [CrossRef]
  19. Li, Y.; Zhang, J.; Wang, J.; Ma, B.S.; Lu, Y. Features and concurrent impacts of upper-level jet stream and blocking high on typical extreme cold events. J. Lanzhou Univ. Nat. Sci. 2018, 54, 670–679690. [Google Scholar] [CrossRef]
  20. Francis, J.A.; Vavrus, S.J. Evidence linking Arctic amplification to extreme weather in mid-latitudes. Geophys. Res. Lett. 2012, 39, L06801. [Google Scholar] [CrossRef]
  21. Francis, J.A.; Vavrus, S.J. Evidence for a wavier jet stream in response to rapid Arctic warming. Environ. Res. Lett. 2015, 10, 014005. [Google Scholar] [CrossRef]
  22. Screen, J.A.; Simmonds, I. Exploring links between Arctic amplification and mid-latitude weather. Geophys. Res. Lett. 2013, 40, 959–964. [Google Scholar] [CrossRef]
  23. Screen, J.A.; Simmonds, I. Caution needed when linking weather extremes to amplified planetary waves. Proc. Natl. Acad. Sci. USA 2013, 110, E2327. [Google Scholar] [CrossRef] [PubMed]
  24. Luo, B.; Luo, D.; Wu, L.; Zhong, L.; Simmonds, I. Atmospheric circulation patterns which promote winter arctic sea ice decline. Environ. Res. Lett. 2017, 12, 1–13. [Google Scholar] [CrossRef]
  25. Kistler, R.; Kalnay, E.; Collins, W.; Saha, S.; White, G.; Woollen, J.; Chelliah, M.; Ebisuzaki, W.; Kanamitsu, M.; Kousky, V.; et al. The NCEP-NCAR50-year reanalysis: Monthly means CD-ROM and documentation. Bull. Am. Meteorol. Soc. 2001, 82, 247–268. [Google Scholar] [CrossRef]
  26. Zhou, W.; Chan, J.C.L.; Chen, W.; Ling, J.; Pinto, J.G.; Shao, Y. Synoptic-scale controls of persistent low temperature and icy weather over southern China in January 2008. Mon. Weather Rev. 2009, 137, 3978–3991. [Google Scholar] [CrossRef]
  27. Huang, J.; Tian, W.; Zhang, J.; Huang, Q.; Tian, H.; Luo, J. The connection between extreme stratospheric polar vortex events and tropospheric blockings. Q. J. R. Meteorol. Soc. 2017, 143, 1148–1164. [Google Scholar] [CrossRef]
  28. Tibaldi, S.; Molteni, F. On the operational predictability of blocking. Tellus Ser. A Dyn. Meteorol. Oceanogr. 1990, 42, 343–365. [Google Scholar] [CrossRef]
  29. Scherrer, S.; Croci-Maspoli, M.; Schwierz, C.; Appenzeller, C. Two-dimensional indices of atmospheric blocking and their statistical relationship with winter climate patterns in the Euro-Atlantic region. Int. J. Climatol. 2006, 26, 233–249. [Google Scholar] [CrossRef]
  30. Wiedenmann, J.M.; Lupo, A.R.; Mokhov, I.I.; Tikhonova, E.A. The Climatology of Blocking Anticyclones for the Northern and Southern Hemispheres: Block Intensity as a Diagnostic. J. Clim. 2002, 15, 3459–3473. [Google Scholar] [CrossRef]
  31. Bloomfield, P. Wiley Series in Probability and Statistics. In Fourier Analysis of Time Series (An Introduction), Harmonic Analysis; John Wiley & Sons: Hoboken, NJ, USA, 2000; p. 261. [Google Scholar]
  32. Daniel, S.W. Statistical Methods in the Atmospheric Sciences, 3rd ed.; Academic Press: Cambridge, MA, USA, 2011. [Google Scholar]
  33. Livingston, E.H. Who was student and why do we care so much about his t-test? J. Surg. Res. 2004, 118, 58–65. [Google Scholar] [CrossRef]
  34. Overland, J.E.; Wood, K.R.; Wang, M. Warm Arctic-cold continents: Climate impacts of the newly open Arctic sea. Polar Res. 2011, 30, 1–14. [Google Scholar] [CrossRef]
  35. Outten, S.; Esau, I. A link between Arctic Sea ice and recent cooling trends over Eurasia. Clim. Chang. 2012, 110, 1069–1075. [Google Scholar] [CrossRef]
  36. Cohen, J.; Screen, J.A.; Furtado, J.C.; Barlow, M.; Whittleston, D.; Coumou, D.; Francis, J.; Dethloff, K.; Entekhabi, D.; Overland, J.; et al. Recent arctic amplification and extreme mid-latitude weather. Nat. Geosci. 2014, 7, 627–637. [Google Scholar] [CrossRef]
  37. Qiao, S.; Shen, B.; Wang, X.; Feng, G.L. Feature analysis and preliminary causes study of frequent cooling winter in northern Eurasia since 2004. Acta Meteorol. Sin. 2014, 72, 1143–1154. [Google Scholar] [CrossRef]
  38. Bueh, C.; Peng, J.; Xie, Z.; Liren, J. Recent progresses on the studies of wintertime extensive and persistent extreme cold events in China and large-scale tilted ridges and troughs over the Eurasian Continent. Chin. J. Atmos. Sci. 2018, 42, 656–676. [Google Scholar] [CrossRef]
  39. Tedesco, M.; Mote, T.; Fettweis, X.; Hanna, E.; Jeyaratnam, J.; Booth, J.F.; Datta, R.; Briggs, K. Arctic cut-off high drives the poleward shift of a new Greenland melting record. Nat. Commun. 2016, 7, 11723. [Google Scholar] [CrossRef]
  40. Luo, B.; Yao, Y. Recent rapid decline of the arctic winter sea ice in the Barents-Kara seas owing to combined effects of the Ural blocking and SST. J. Meteorol. Res. 2018, 32, 191–202. [Google Scholar] [CrossRef]
  41. Zhang, J.; Tian, W.S.; Chipperfield, M.P.; Xie, F.; Huang, J. Persistent shift of the Arctic polar vortex towards the Eurasian continent in recent decades. Nat. Clim. Chang. 2016, 6, 1094–1099. [Google Scholar] [CrossRef]
  42. Xiao, C.; Zhang, Y. The East Asian upper-tropospheric jet streams and associated transient eddy activities simulated by a climate system model BCC_CSM1.1. Acta Meteorol. Sin. 2012, 26, 17. [Google Scholar] [CrossRef]
  43. Yang, S.; Lau, K.M.; Kim, K.M. Variations of the East Asian Jet Stream and Asian-Pacific-American Winter Climate Anomalies. J. Clim. 2002, 15, 306–325. [Google Scholar] [CrossRef]
  44. Liu, Q.; Chen, G.; Wang, L.; Kanno, Y.; Iwasaki, T. Southward cold airmass flux associated with the East Asian winter monsoon: Diversity and impacts. J. Clim. 2021, 34, 3239–3254. [Google Scholar] [CrossRef]
  45. Lu, Y.; Li, Y. Study on the relationship between atmospheric Ultra-long waves and blocking highs in key Eurasian Areas. Adv. Geosci. 2018, 8, 1233–1245. [Google Scholar] [CrossRef]
  46. Luo, D.H.; Chen, X.D.; Overland, J.; Simmonds, I.; Wu, Y.; Zhang, P. Weakened Potential Vorticity Barrier Linked to Recent Winter Arctic Sea Ice Loss and Midlatitude Cold Extremes. J. Clim. 2019, 32, 4235–4261. [Google Scholar] [CrossRef]
  47. Lejenäs, H.; Döös, R. The Behaviour of the Stationary and Travelling Planetary-Scale Waves during Blocking-A Northern Hemisphere Data Study. J. Meteorol. Soc. Jpn. 2007, 65, 709–725. [Google Scholar] [CrossRef]
  48. Nishii, K.; Nakamura, H.; Orsolini, Y.J. Geographical Dependence Observed in Blocking High Influence on the Stratospheric Variability through Enhancement and Suppression of Upward Planetary-Wave Propagation. J. Clim. 2011, 24, 6408–6423. [Google Scholar] [CrossRef]
  49. Davini, P.; Cagnazzo, C.; Anstey, J.A. A blocking view of the stratosphere-troposphere coupling. J. Geophys. Res.-Atmos. 2014, 119, 11,100–11,115. [Google Scholar] [CrossRef]
  50. Kodera, K.; Mukougawa, H.; Fujii, A. Influence of the vertical and zonal propagation of stratospheric planetary waves on tropospheric blockings. J. Geophys. Res. Atmos. 2013, 118, 8333–8345. [Google Scholar] [CrossRef]
Figure 1. Interannual change characteristics of the UB in winter from 1979 to 2019. (Normalized: Fq (a), CL (b), IB (c), DU (d), NR (e) and blocking index (f), comprehensive blocking index (g). The solid black line represents the result of a 9-point smoothing average, and the black dotted line represents the trend.)
Atmosphere 13 01530 g001
Figure 2. The moving t-test for each blocking index of the UB in winter over the period of 1979–2019. (Normalized: Fq (a), CL (b), BI (c), DU (d), NR (e), blocking index (f), comprehensive blocking index (g). The black lines represent the significance test of 95%).
Atmosphere 13 01530 g002
Figure 3. The distribution of geopotential heights at 100 hPa ((a1,a2), units: dagpm), zonal winds at 200 hPa ((b1,b2), units: m·s−1), geopotential heights at 500 hPa ((c1,c2), units: dagpm), sea level pressure ((d1,d2), units: hPa) during the P1 and P2 periods and their differences between the two periods (P2–P1, (a3,b3,c3,d3)). (The bold solid black lines in Figure (a1,a2) represent the 1628 dapgm geopotential heights. The bold solid black lines in Figure (b1,b2) represent the 30 m·s−1. The bold solid black lines in Figure (c1,c2) represent the 588 dapgm geopotential heights. The bold solid black lines in Figure (d1,d2) represent the 1023 hPa. The dotted areas represent the differences which pass the significance test of 90%. The outermost latitude is 0°).
Atmosphere 13 01530 g003
Figure 4. The linear regression of geopotential heights at 100 hPa ((a1,a2), unit: gpm, contour interval: 10 gpm), zonal winds on 200 hPa ((b1,b2), unit: m · s 1 , contour interval: 1 m·s−1), geopotential heights at 500 hPa ((c1,c2), unit: gpm, contour interval: 5 gpm) and sea level pressure ((d1,d2), unit: Pa, contour interval: 40 Pa) in winter against the comprehensive blocking indexes during P1 and P2. (The red lines represent that the regression coefficient is positive, and the blue is negative. The shaded area indicates that the regression coefficients have passed the significance test of 90%).
Atmosphere 13 01530 g004
Figure 5. The distribution of 1 wave (a1,a2), 2 wave (b1,b2), 3 wave (c1,c2), 1–3 wave (d1,d2) and differences (P2–P1, (a3,b3,c3,d3)) on 500 hPa in two periods. (Units: gpm, and the dotted areas represent that the differences pass the significance test of 95%. The outermost latitude is 15° N.)
Atmosphere 13 01530 g005
Figure 6. The distribution of P b P t T / y d p between surface-500 hPa (a1,a2) and 500–100 hPa (b1,b2) during the P1 and P2 periods and their differences between the two periods (P2–P1, (a3,b3)). (Units: hPa·K·m−1·10−4. The dotted areas represent that the differences pass the significance test of 95%. The outermost latitude is 15° N.)
Atmosphere 13 01530 g006
Table 1. The correlation coefficient between indexes of the UB in winter during 1979–2018.
Central LatitudeBlocking IntensityMean Duration North Rim
Central Latitude10.940.7440.997
Blocking Intensity 10.7370.935
Mean Duration 10.751
North Rim 1
All pass the significance t-test of 99%.
Publisher’s Note: MDPI stays neutral with regard to jurisdictional claims in published maps and institutional affiliations.

