


Spatio-Temporal Changes in Air Quality of the Urban Area of Chongqing from 2015 to 2021 Based on a Missing-Data-Filled Dataset


Abstract
:1. Introduction
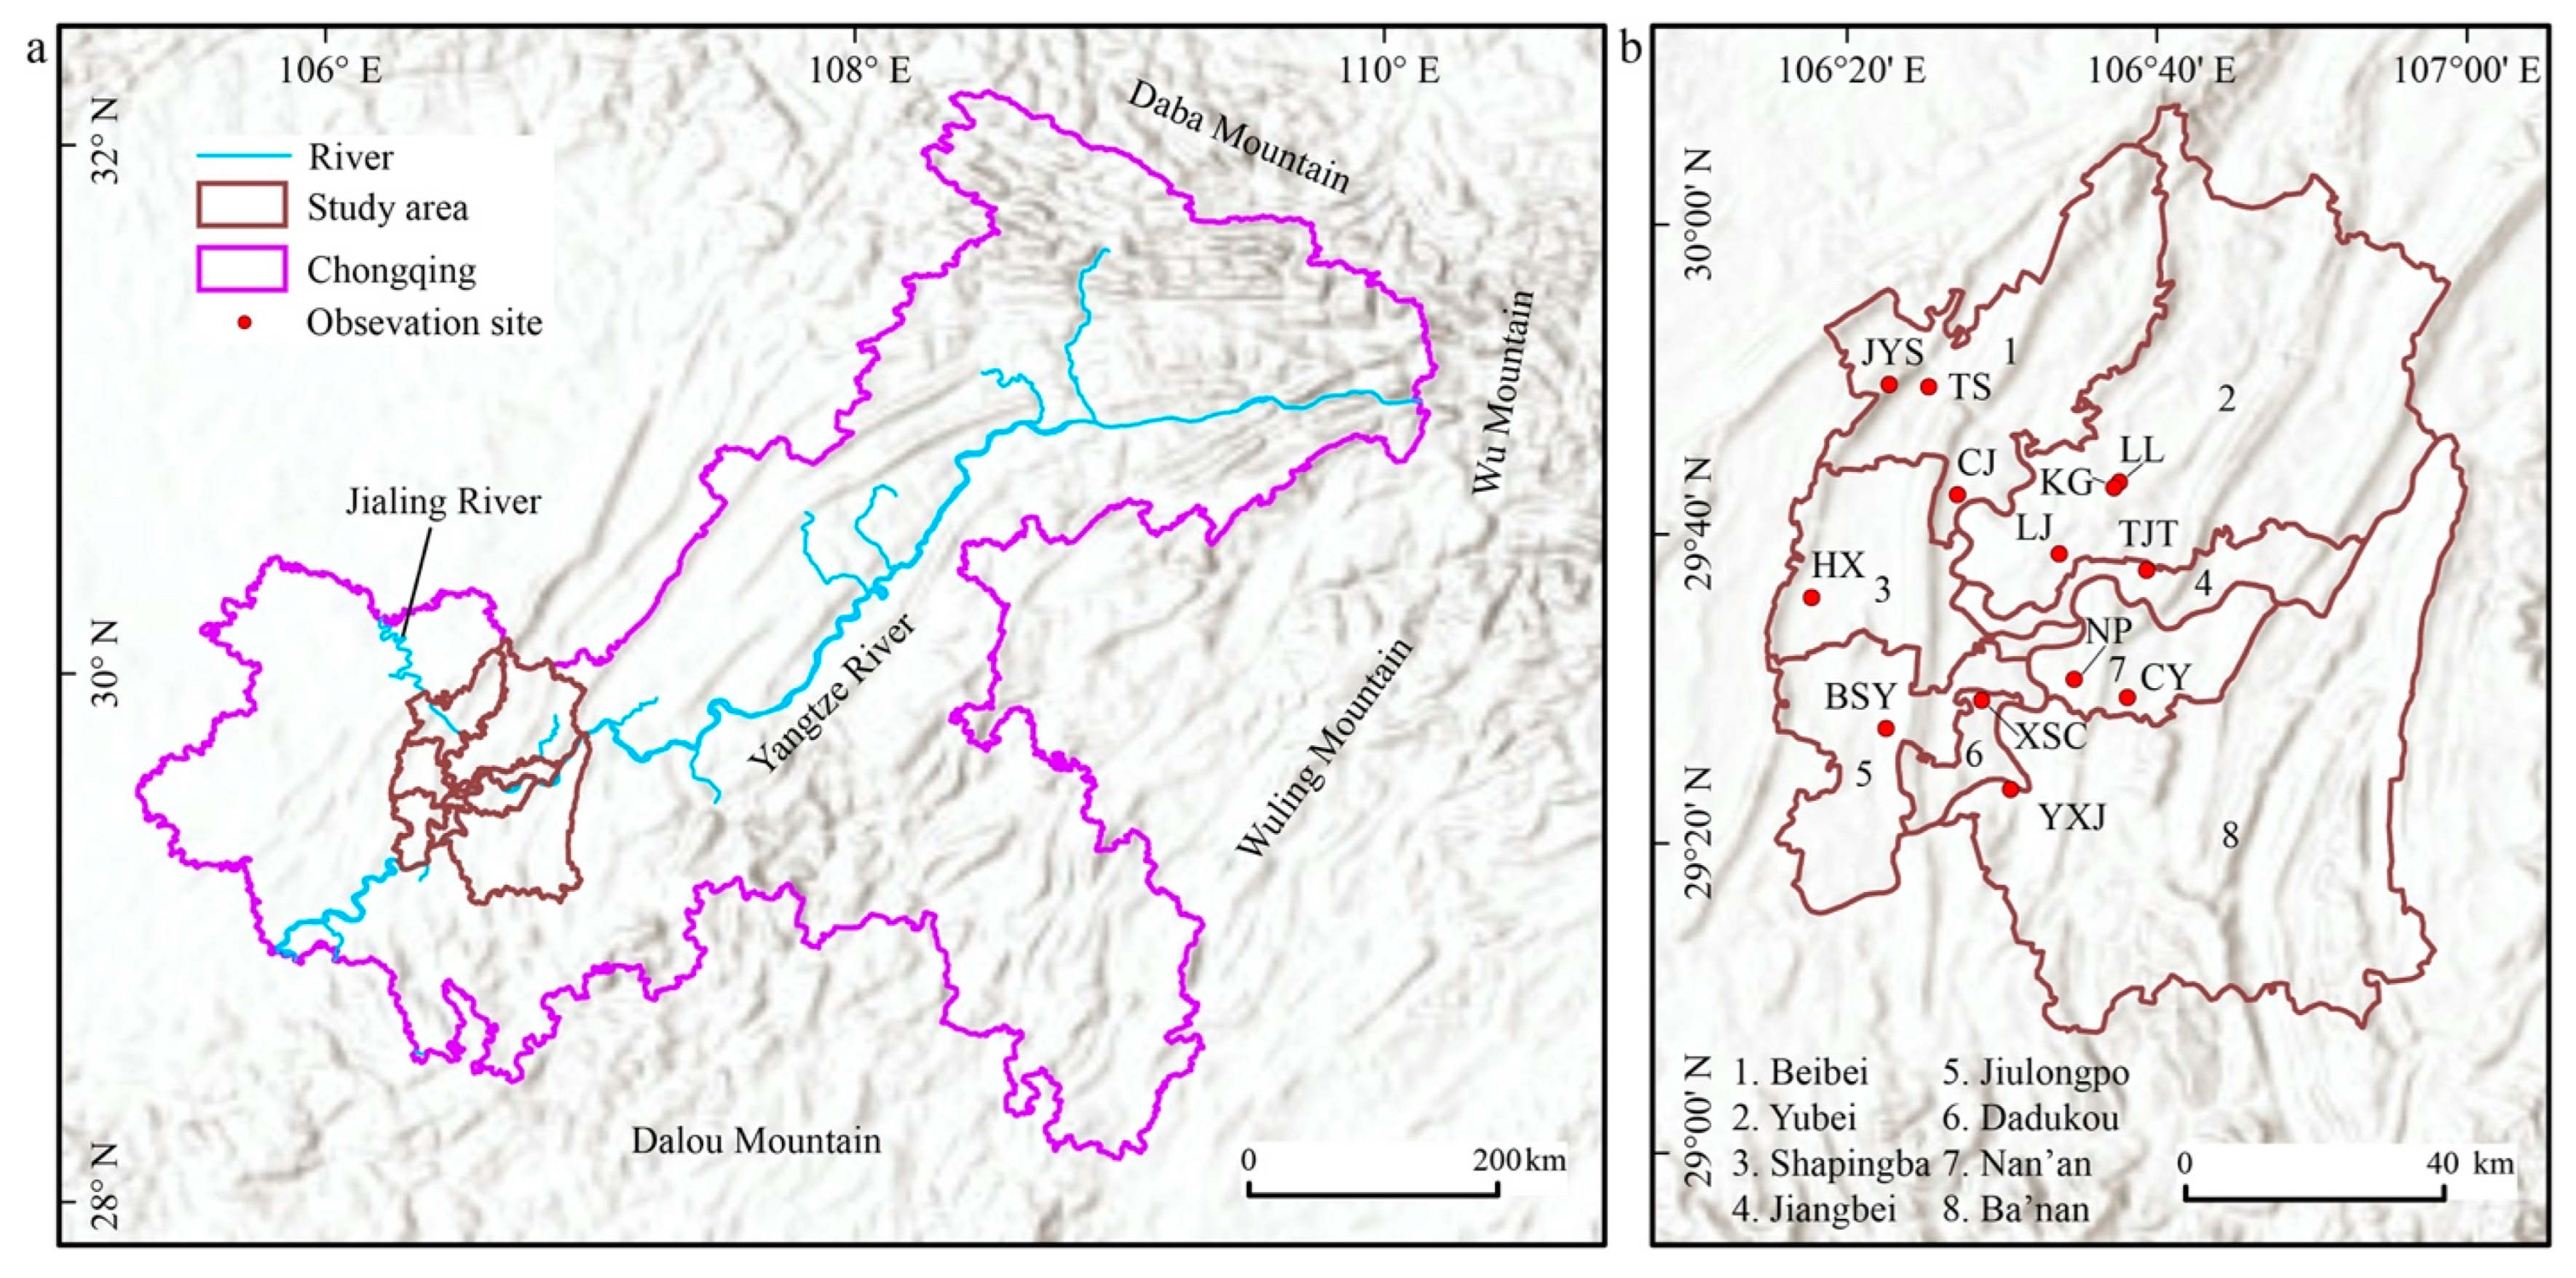
2. Study Area
3. Data and Methodology
3.1. Data
3.2. Methodology
3.2.1. AQI Calculation
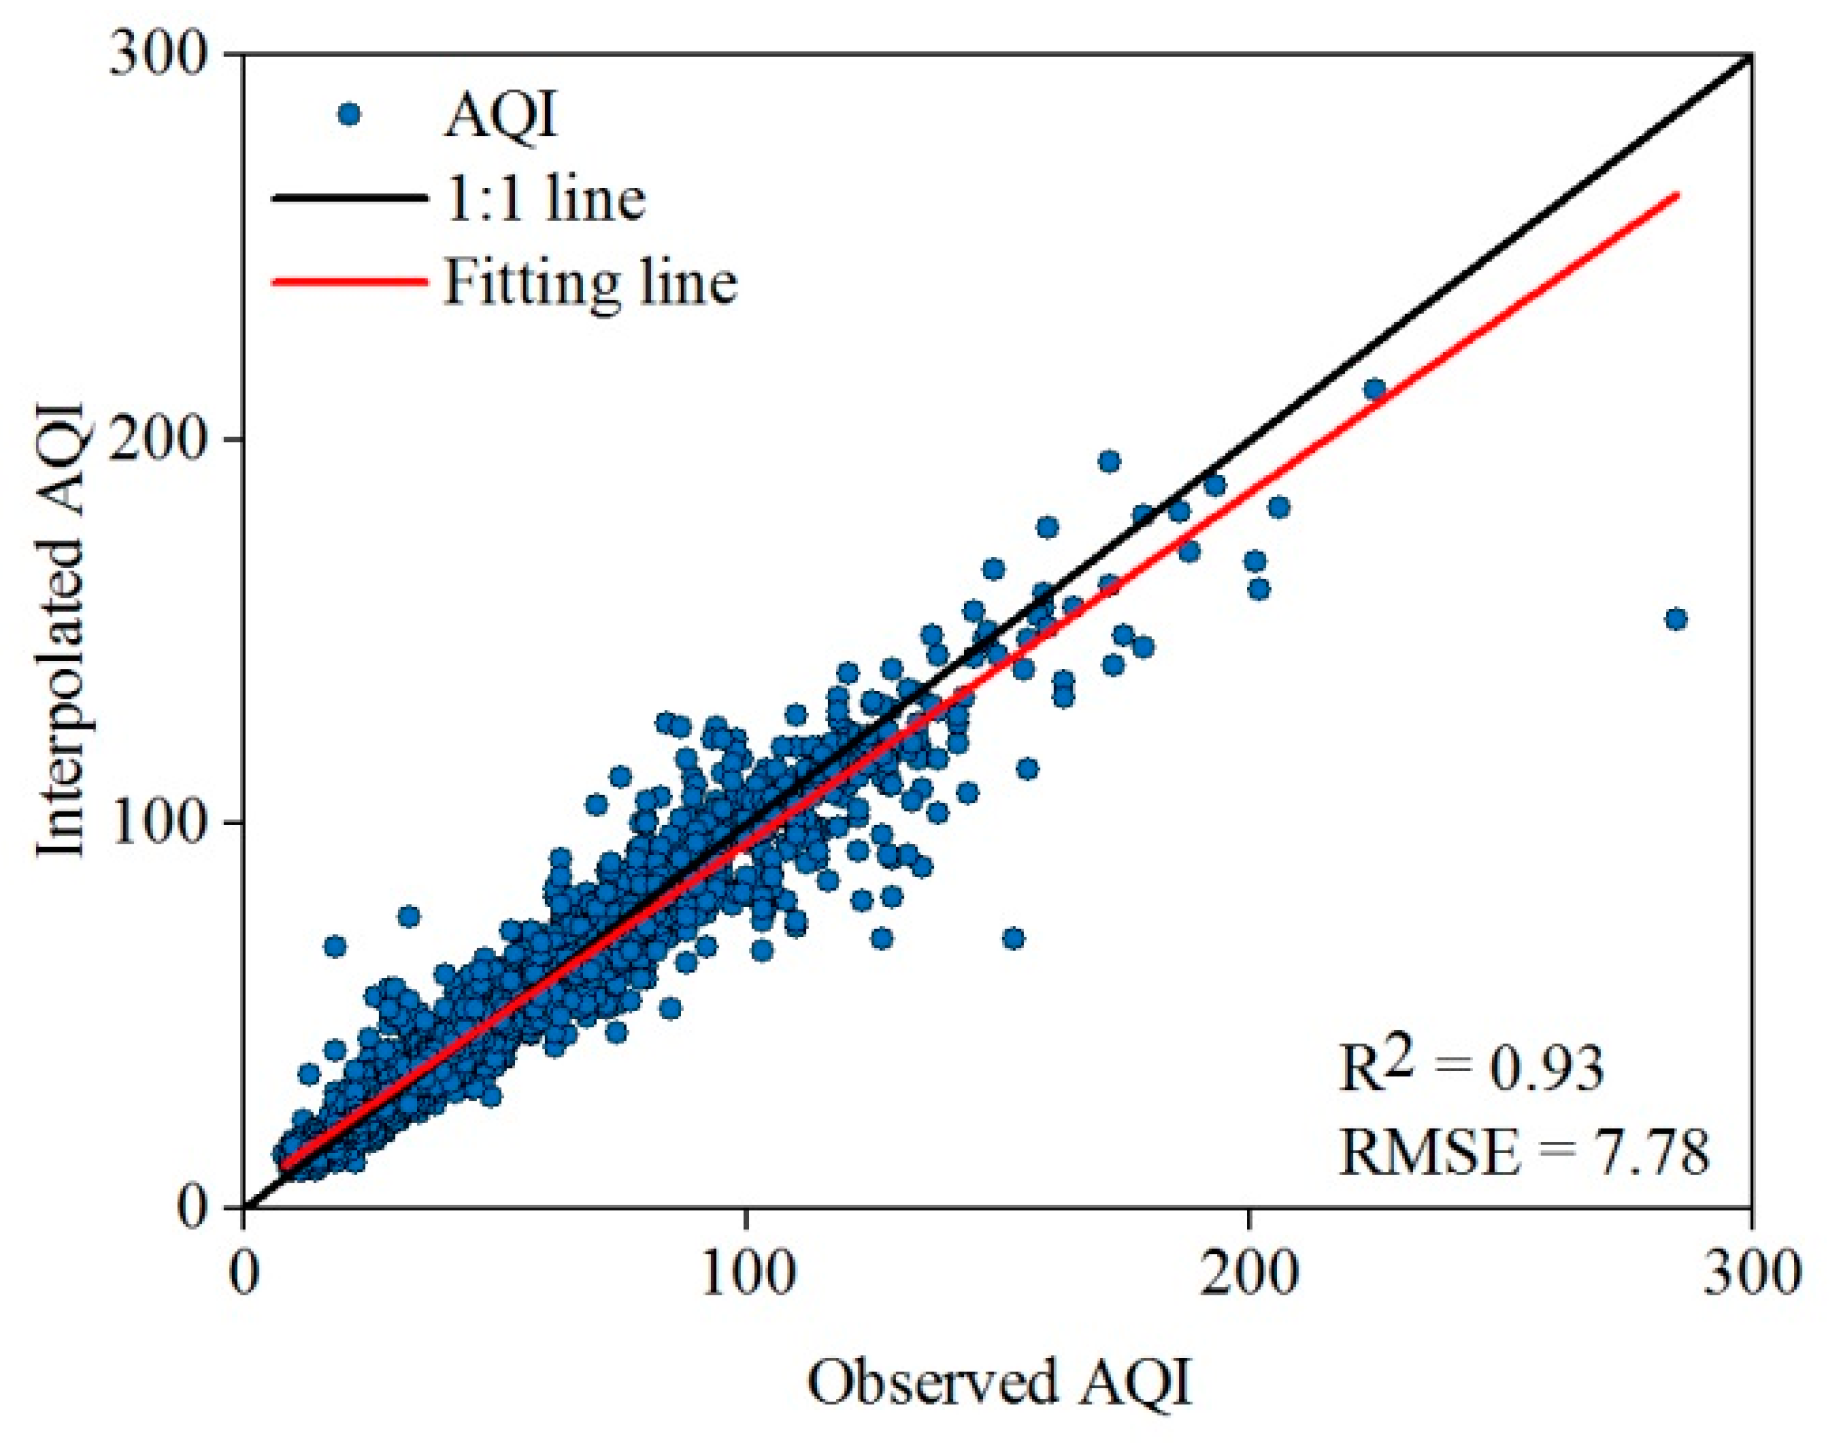
3.2.2. Missing Values Interpolation
3.2.3. Spatial and Temporal Analysis of AQI
4. Result
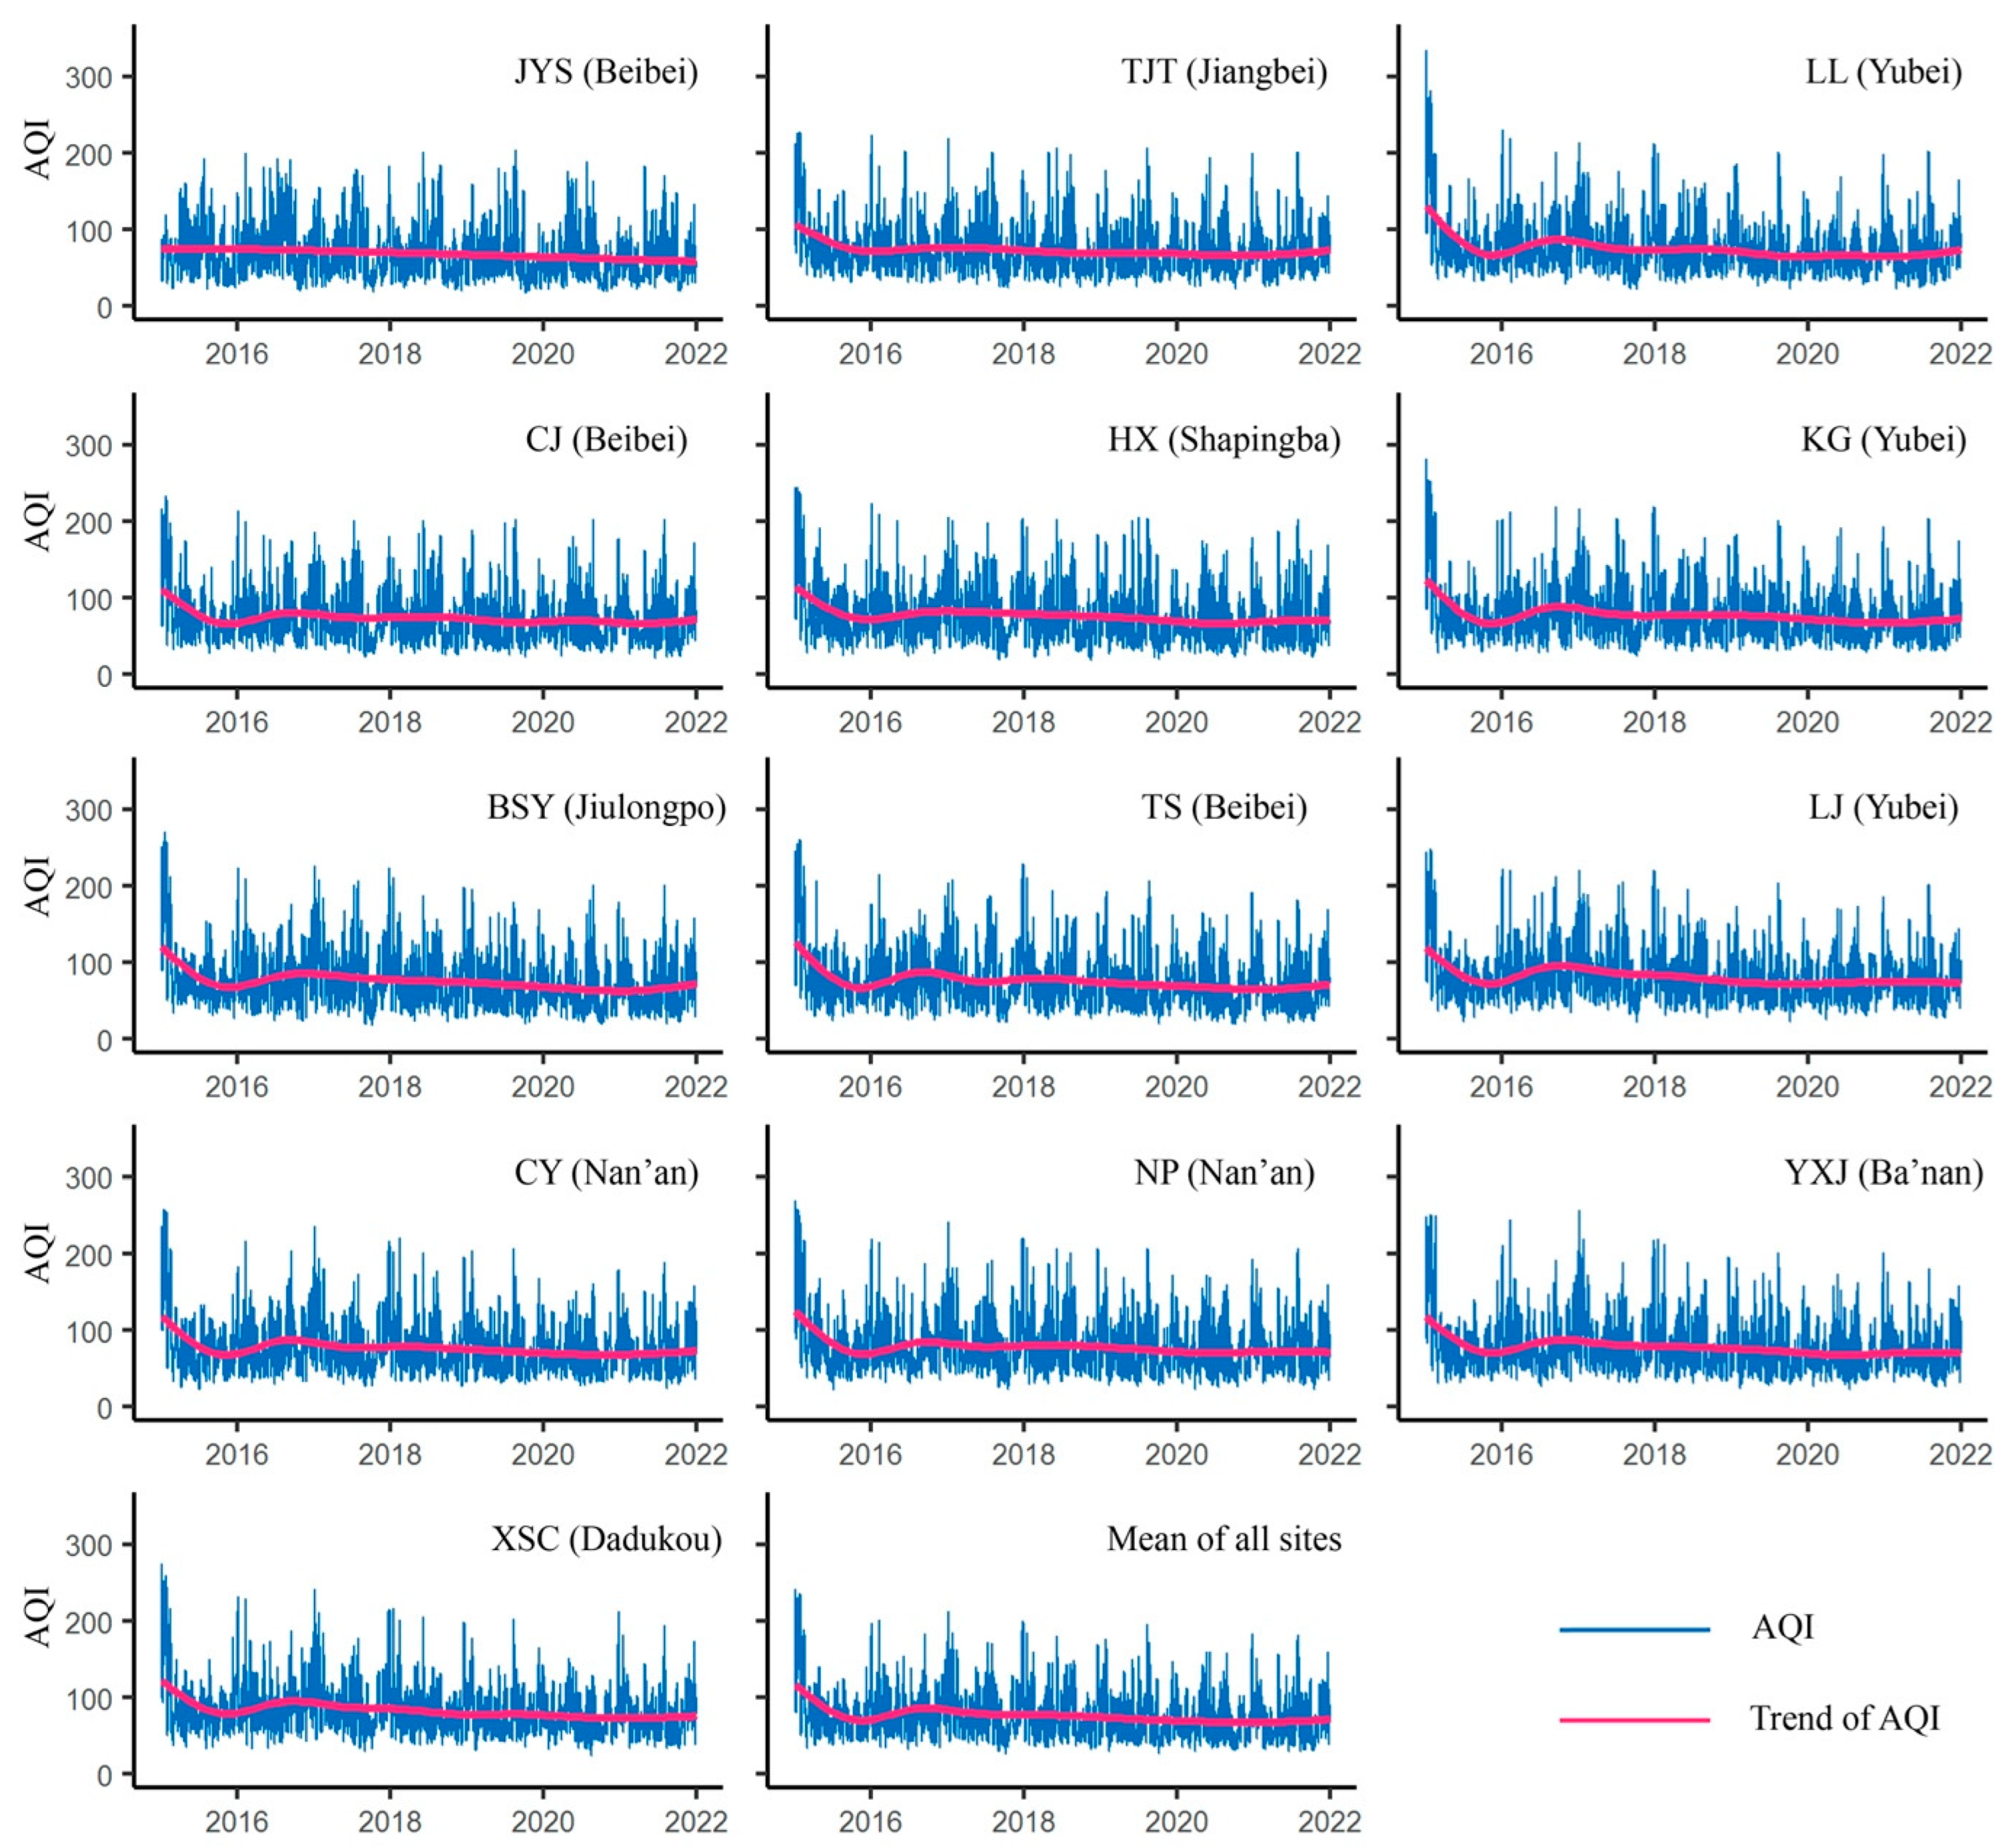
4.1. Distribution Characteristics of AQI
4.2. Temporal Variation Analysis
4.2.1. Hourly Variation
4.2.2. Daily Variation
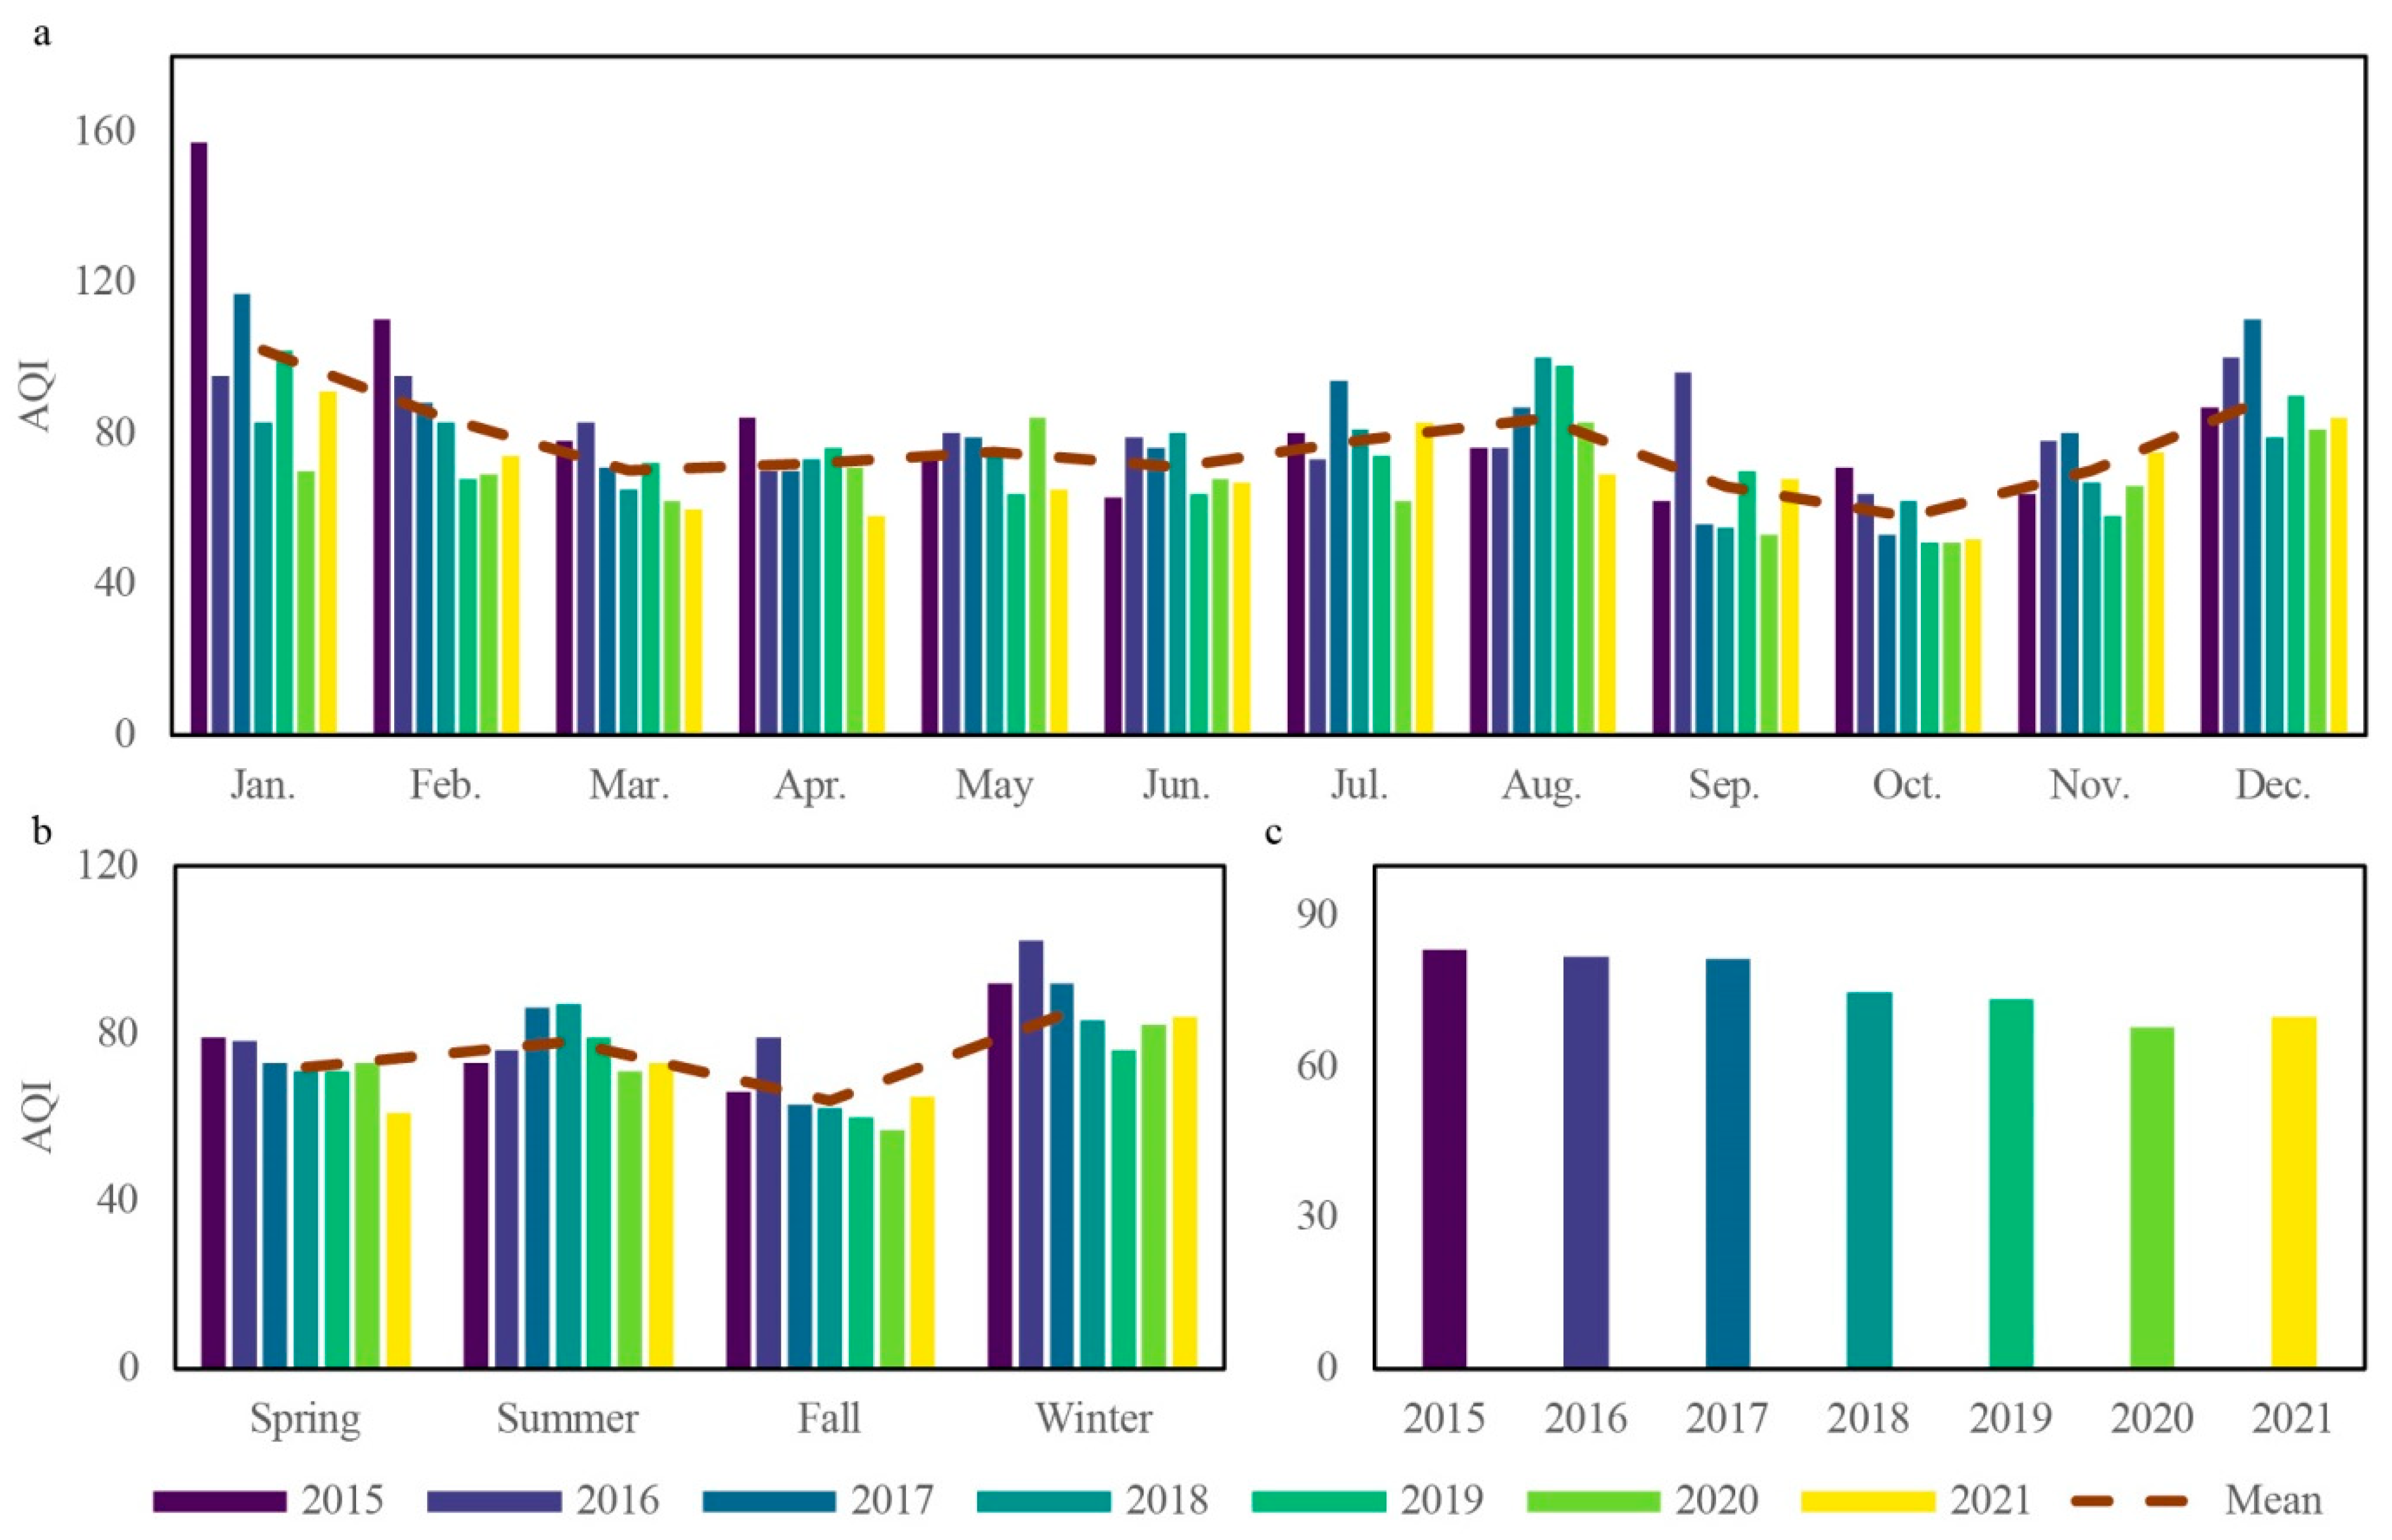
4.2.3. Monthly, Seasonal, and Annual Changes
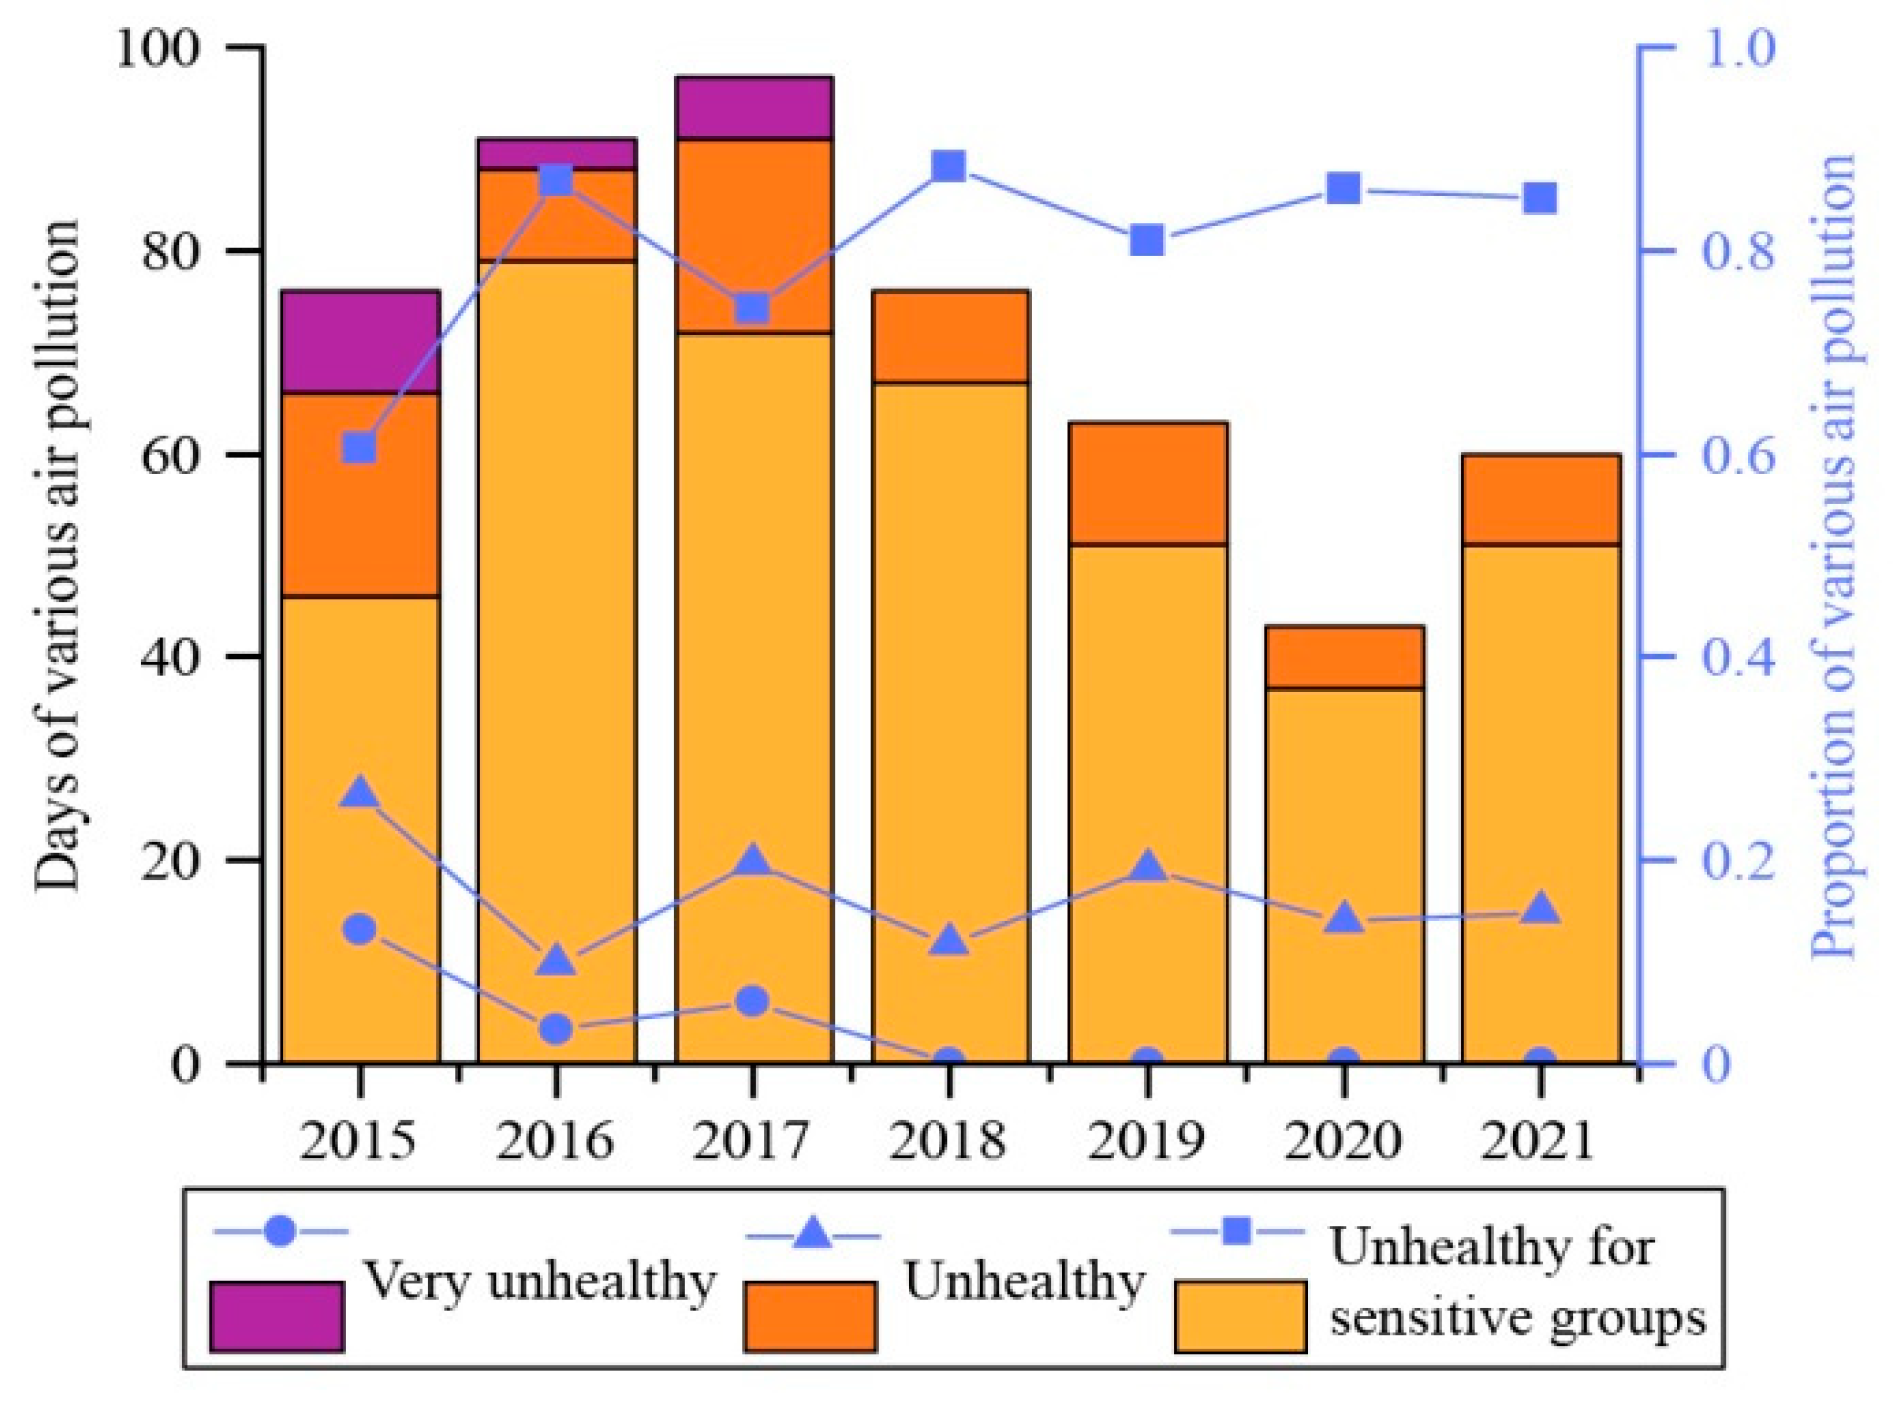
4.2.4. Contributors to Daily Air Pollution
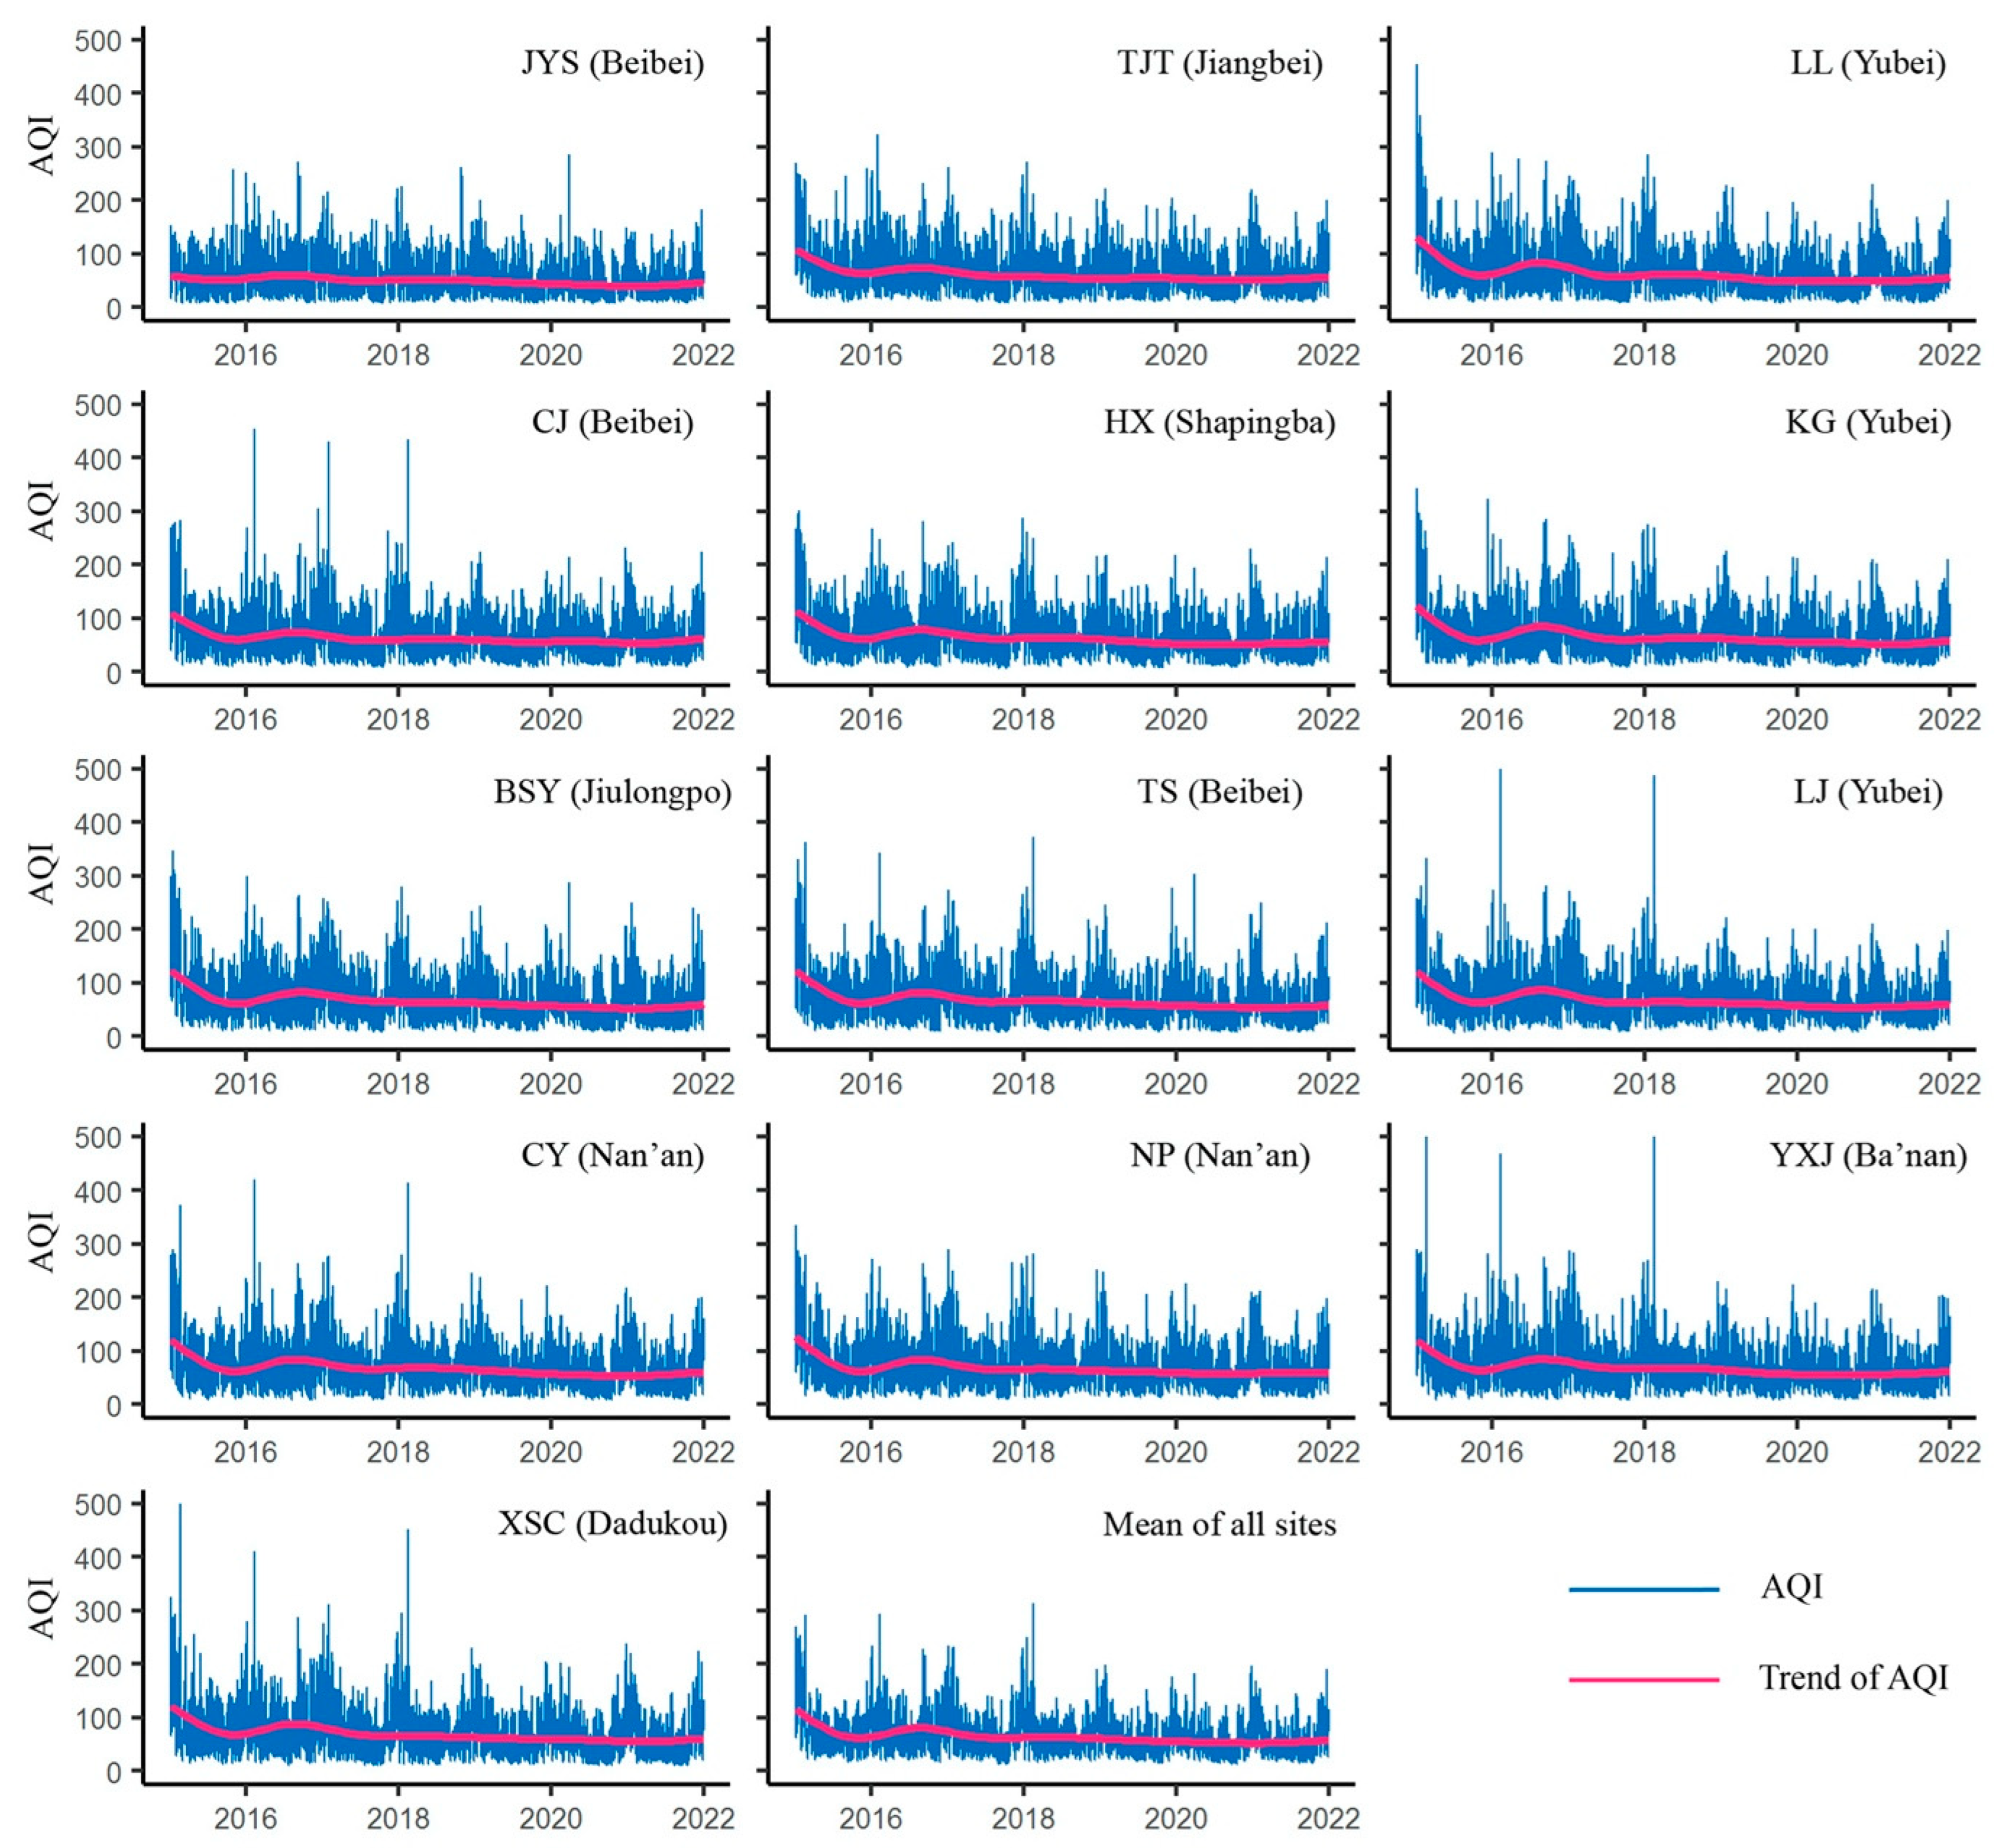
4.3. Spatial Heterogeneity of AQI Changes
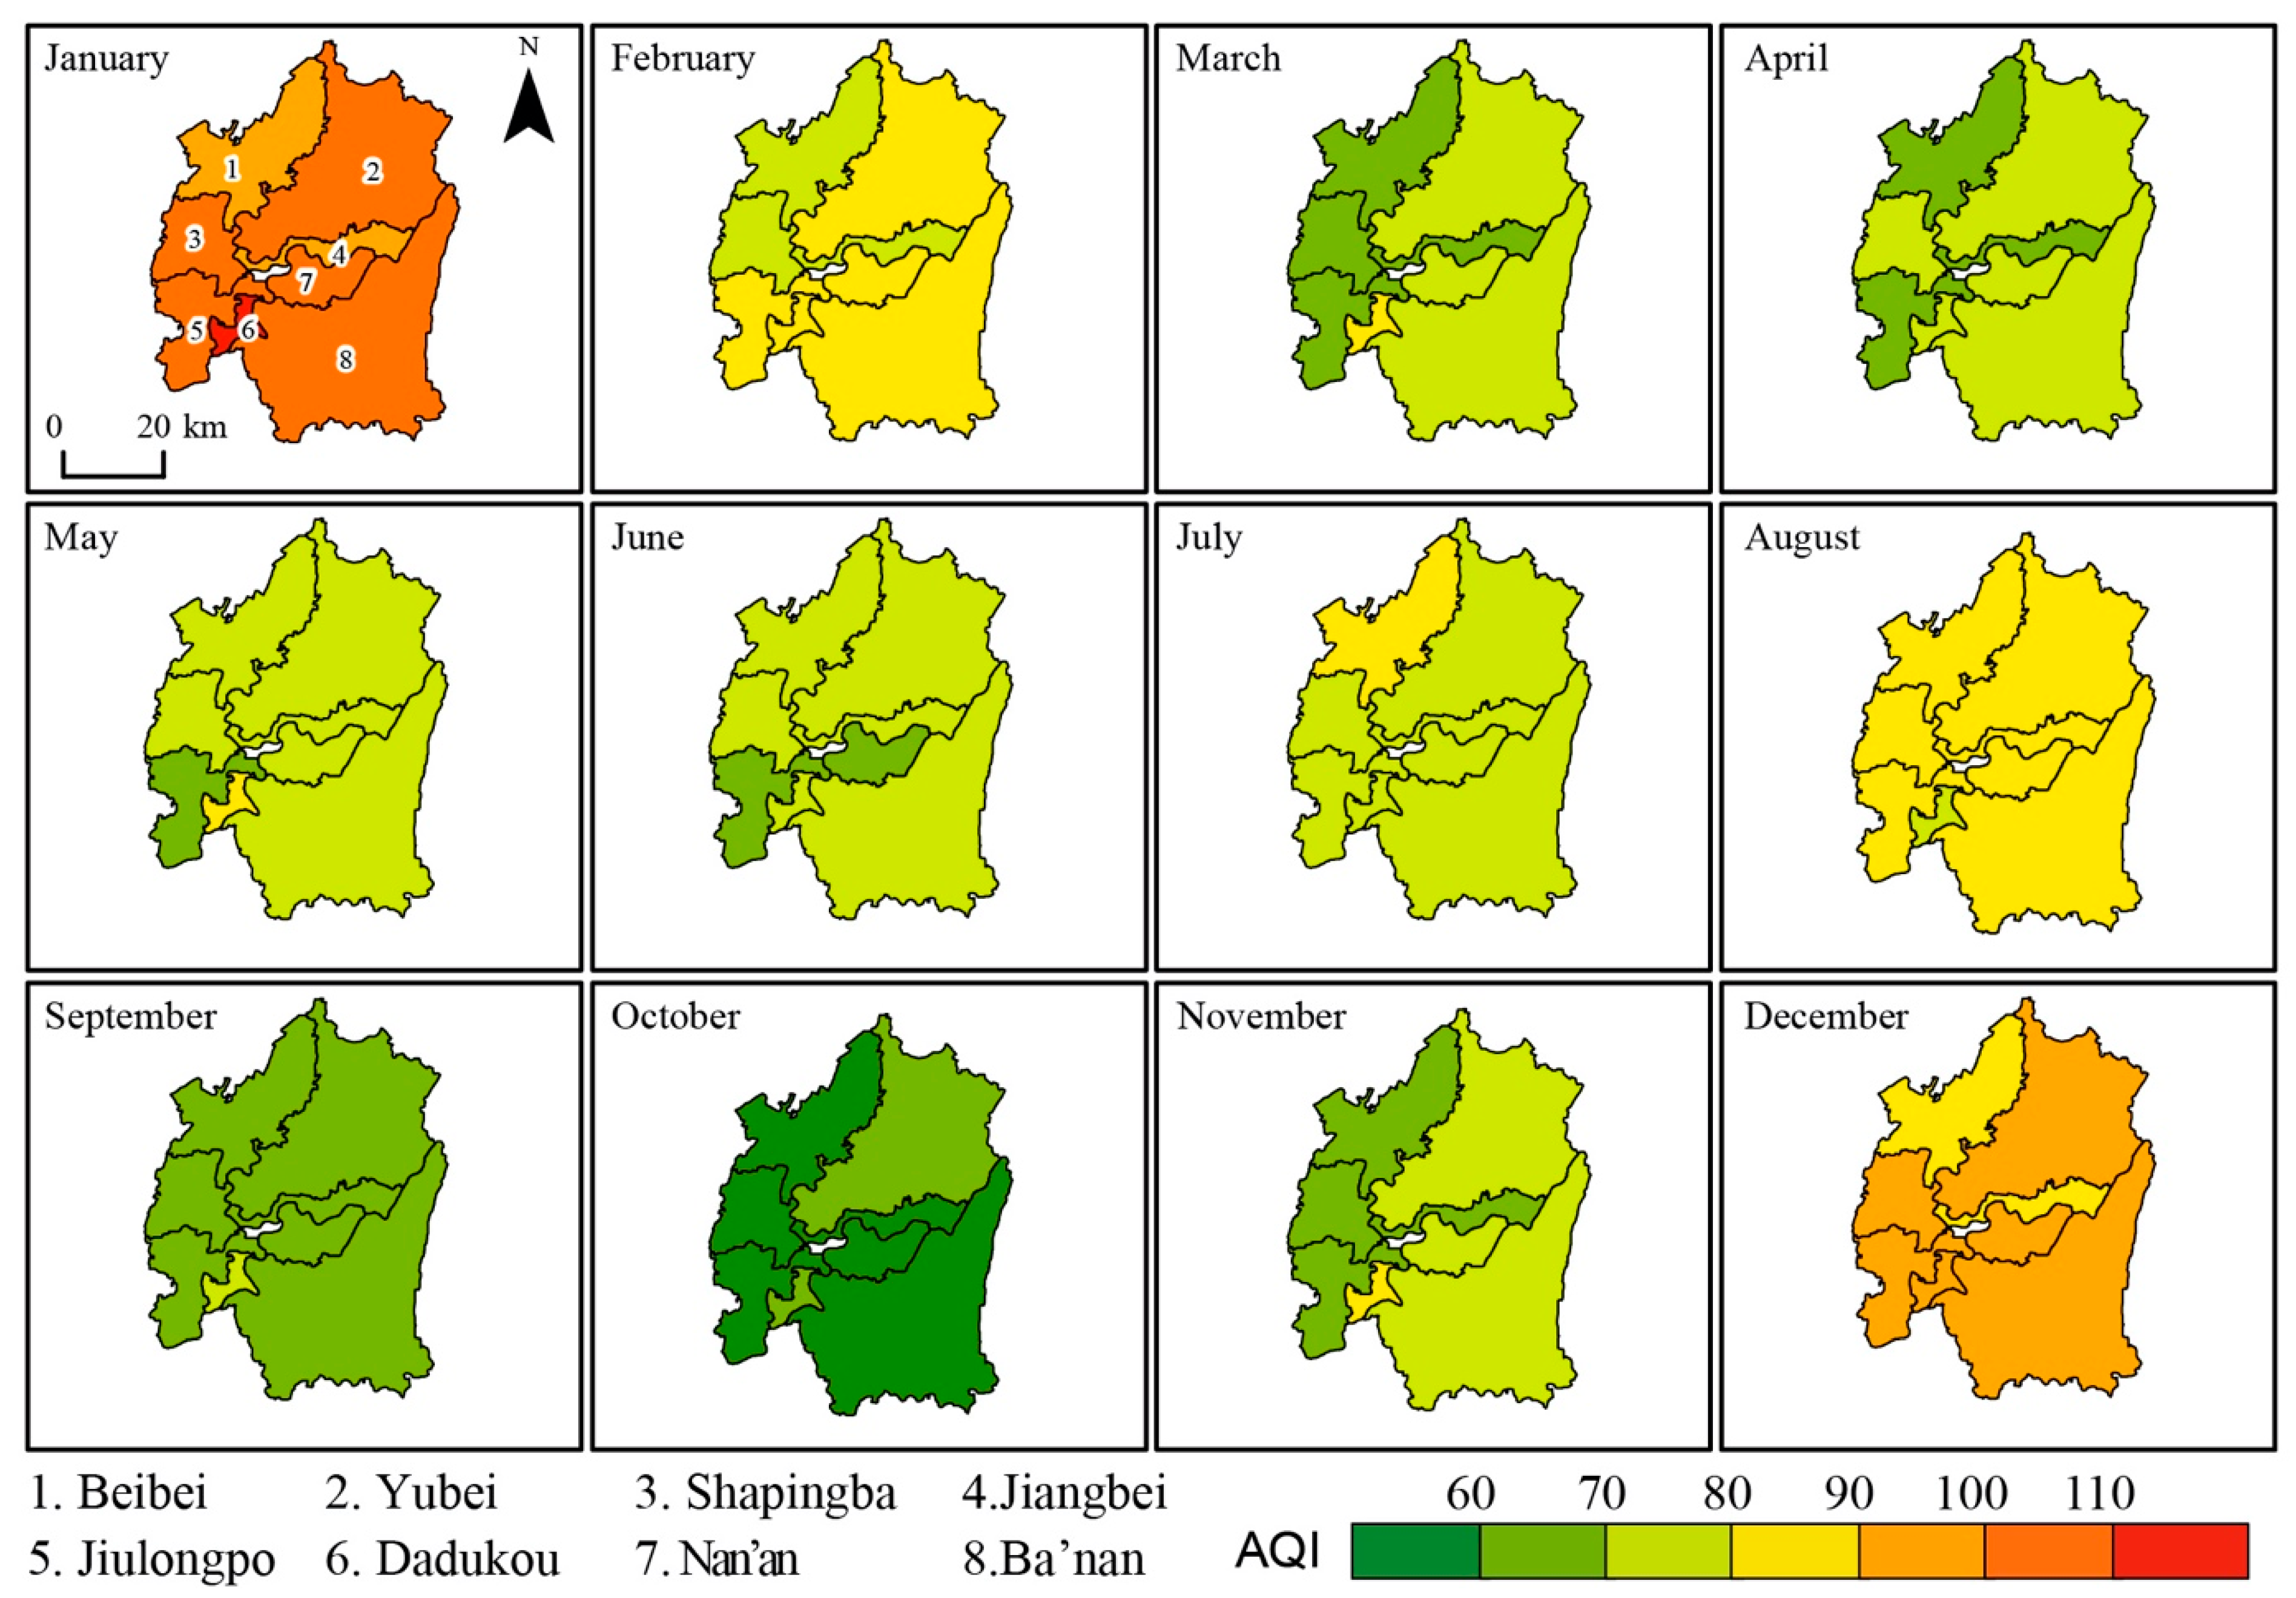
4.3.1. Monthly Spatial Variation
4.3.2. Seasonal Spatial Variation
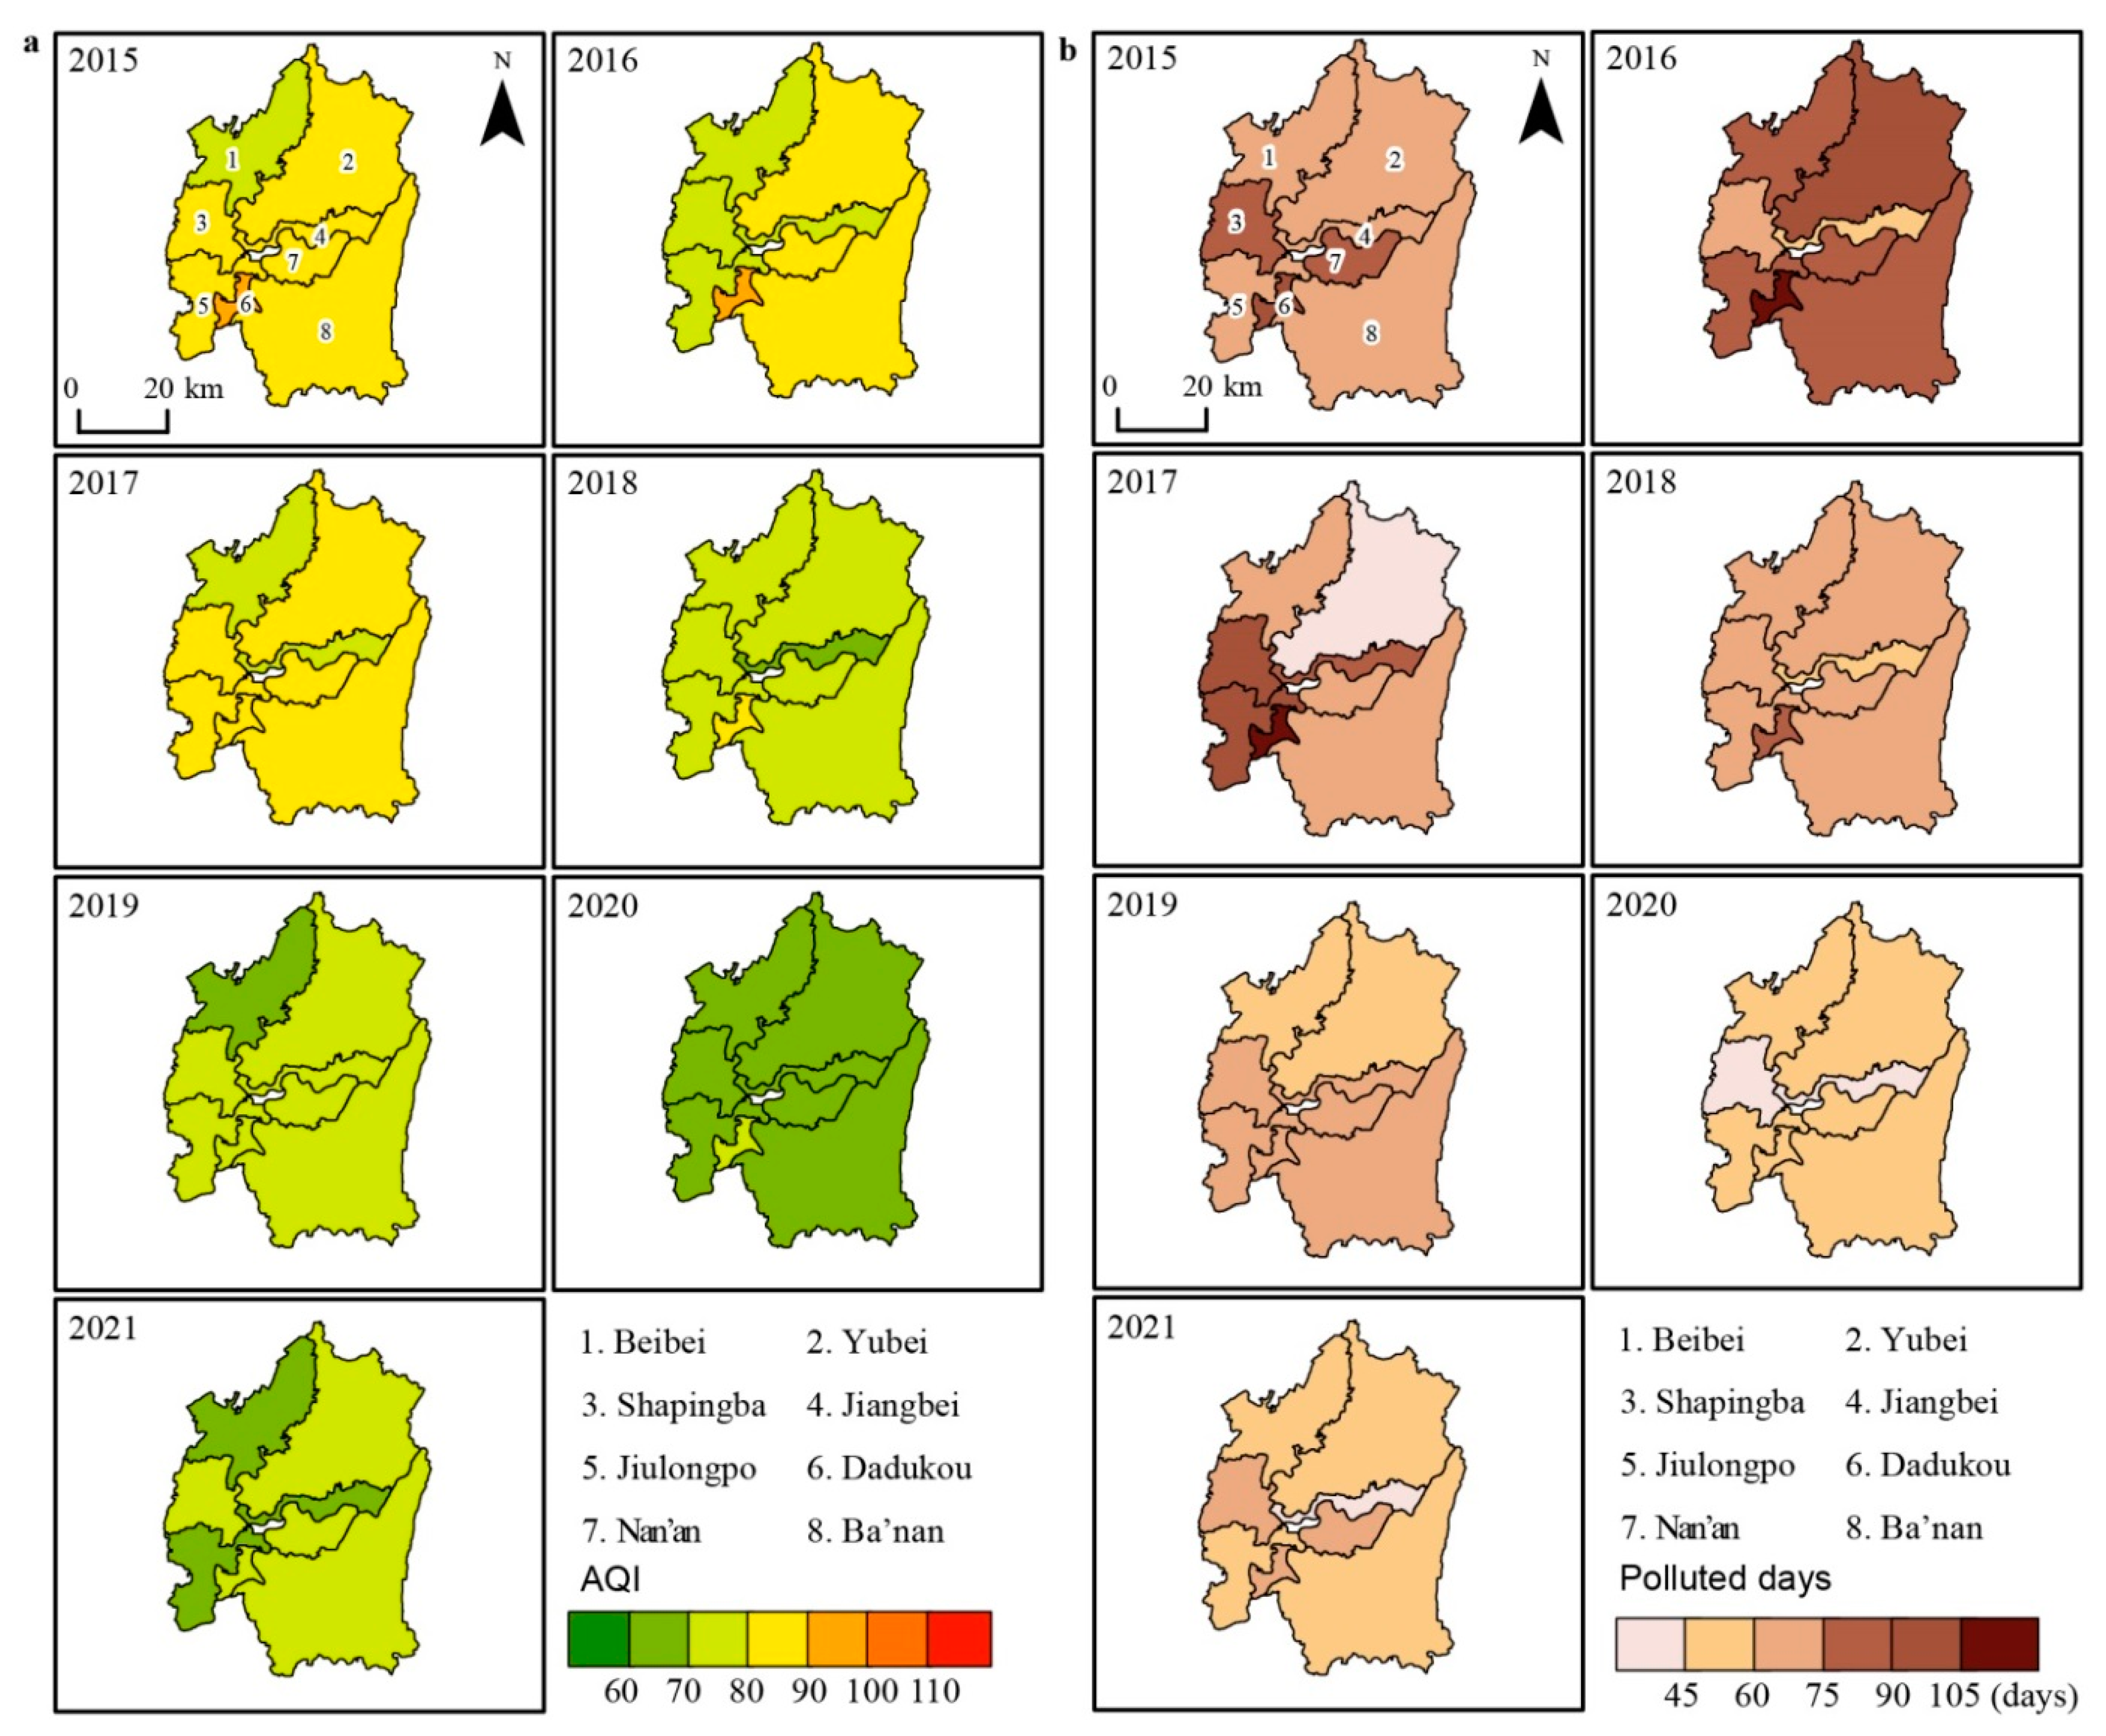
4.3.3. Annual Spatial Variation
4.3.4. Contributors of Spatial Changes of AQI
5. Discussion
5.1. Driving Factors for AQI Change in Chongqing during 2015–2021
5.2. Causes for the Spatial Heterogeneity of AQI
5.3. Novelty and Limitation
6. Conclusions
Supplementary Materials
Author Contributions
Funding
Institutional Review Board Statement
Informed Consent Statement
Data Availability Statement
Conflicts of Interest
References
- Sarkodie, S.A.; Owusu, P.A. Global Effect of City-to-City Air Pollution, Health Conditions, Climatic & Socio-Economic Factors on COVID-19 Pandemic. Sci. Total Environ. 2021, 778, 146394. [Google Scholar] [CrossRef] [PubMed]
- Pan, R.; Wang, X.; Yi, W.; Wei, Q.; Gao, J.; Xu, Z.; Duan, J.; He, Y.; Tang, C.; Liu, X.; et al. Interactions between Climate Factors and Air Quality Index for Improved Childhood Asthma Self-Management. Sci. Total Environ. 2020, 723, 137804. [Google Scholar] [CrossRef] [PubMed]
- Gorai, A.K.; Tchounwou, P.B.; Biswal, S.; Tuluri, F. Spatio-Temporal Variation of Particulate Matter(PM2.5) Concentrations and Its Health Impacts in a Mega City, Delhi in India. Environ. Health Insights 2018, 12, 1178630218792861. [Google Scholar] [CrossRef]
- Liu, X.; Zhao, C.; Niu, J.; Su, F.; Yao, D.; Xu, F.; Yan, J.; Shen, X.; Jin, T. Spatiotemporal Patterns and Regional Transport of Ground-Level Ozone in Major Urban Agglomerations in China. Atmosphere 2022, 13, 301. [Google Scholar] [CrossRef]
- Benchrif, A.; Wheida, A.; Tahri, M.; Shubbar, R.M.; Biswas, B. Air Quality during Three Covid-19 Lockdown Phases: AQI, PM2.5 and NO2 Assessment in Cities with More than 1 Million Inhabitants. Sustain. Cities Soc. 2021, 74, 103170. [Google Scholar] [CrossRef] [PubMed]
- Chen, L.-W.A.; Chien, L.-C.; Li, Y.; Lin, G. Nonuniform Impacts of COVID-19 Lockdown on Air Quality over the United States. Sci. Total Environ. 2020, 745, 141105. [Google Scholar] [CrossRef]
- Xu, H.; Yan, C.; Fu, Q.; Xiao, K.; Yu, Y.; Han, D.; Wang, W.; Cheng, J. Possible Environmental Effects on the Spread of COVID-19 in China. Sci. Total Environ. 2020, 731, 139211. [Google Scholar] [CrossRef]
- Subhanullah, M.; Ullah, S.; Javed, M.F.; Ullah, R.; Akbar, T.A.; Ullah, W.; Baig, S.A.; Aziz, M.; Mohamed, A.; Sajjad, R.U. Assessment and Impacts of Air Pollution from Brick Kilns on Public Health in Northern Pakistan. Atmosphere 2022, 13, 1231. [Google Scholar] [CrossRef]
- Ministry of Ecology and Environment of the People’s Republic of China. Report on the State of the Ecology and Environment in China 2021; Ministry of Ecology and Environment of the People’s Republic of China: Beijing, China, 2022.
- World Health Organization. WHO Global Air Quality Guidelines: Particulate Matter (PM2.5 and PM10), Ozone, Nitrogen Dioxide, Sulfur Dioxide and Carbon Monoxide; World Health Organization: Geneva, Switzerland, 2021; ISBN 978-92-4-003422-8.
- García, S.; Ramírez-Gallego, S.; Luengo, J.; Benítez, J.M.; Herrera, F. Big Data Preprocessing: Methods and Prospects. Big Data Anal. 2016, 1, 9. [Google Scholar] [CrossRef]
- Noor, M.N.; Yahaya, A.S.; Ramli, N.A.; Al Bakri, A.M.M. Mean Imputation Techniques for Filling the Missing Observations in Air Pollution Dataset. Key Eng. Mater. 2013, 594–595, 902–908. [Google Scholar]
- Chang, G.; Zhang, Y.; Yao, D. Missing Data Imputation for Traffic Flow Based on Improved Local Least Squares. Tsinghua Sci. Technol. 2012, 17, 304–309. [Google Scholar] [CrossRef]
- Park, S.-H.; Bang, S.-W.; Jhun, M.-S. On the Use of Sequential Adaptive Nearest Neighbors for Missing Value Imputation. Korean J. Appl. Stat. 2011, 24, 1249–1257. [Google Scholar] [CrossRef]
- Luengo, J.; García, S.; Herrera, F. On the Choice of the Best Imputation Methods for Missing Values Considering Three Groups of Classification Methods. Knowl. Inf. Syst. 2012, 32, 77–108. [Google Scholar] [CrossRef]
- Gao, K.; Mei, G.; Cuomo, S.; Piccialli, F.; Xu, N. Adaptive RBF Interpolation for Estimating Missing Values in Geographical Data. In Proceedings of the International Conference on Numerical Computations, Crotone, Italy, 15–21 June 2019; Volume 11973, pp. 122–130. [Google Scholar]
- Song, W.; Gao, C.; Zhao, Y.; Zhao, Y. A Time Series Data Filling Method Based on LSTM—Taking the Stem Moisture as an Example. Sensors 2020, 20, 5045. [Google Scholar] [CrossRef] [PubMed]
- Zhang, X.; Gui, K.; Liao, T.; Li, Y.; Wang, X.; Zhang, X.; Ning, H.; Liu, W.; Xu, J. Three-Dimensional Spatiotemporal Evolution of Wildfire-Induced Smoke Aerosols: A Case Study from Liangshan, Southwest China. Sci. Total Environ. 2021, 762, 144586. [Google Scholar] [CrossRef] [PubMed]
- Song, Q.; Ge, H.; Caverlee, J.; Hu, X. Tensor Completion Algorithms in Big Data Analytics. ACM Trans. Knowl. Discov. Data 2019, 13, 6:1–6:48. [Google Scholar] [CrossRef]
- Chu, D.; Shen, H.; Guan, X.; Chen, J.M.; Li, X.; Li, J.; Zhang, L. Long Time-Series NDVI Reconstruction in Cloud-Prone Regions via Spatio-Temporal Tensor Completion. Remote Sens. Environ. 2021, 264, 112632. [Google Scholar] [CrossRef]
- Cao, F.; Cai, M.; Tan, Y. Image Interpolation via Low-Rank Matrix Completion and Recovery. IEEE Trans. Circuits Syst. Video Technol. 2015, 25, 1261–1270. [Google Scholar] [CrossRef]
- Liu, X.; Wang, X.; Zou, L.; Xia, J.; Pang, W. Spatial Imputation for Air Pollutants Data Sets via Low Rank Matrix Completion Algorithm. Environ. Int. 2020, 139, 105713. [Google Scholar] [CrossRef]
- Gao, H.; Yang, W.; Wang, J.; Zheng, X. Analysis of the Effectiveness of Air Pollution Control Policies Based on Historical Evaluation and Deep Learning Forecast: A Case Study of Chengdu-Chongqing Region in China. Sustainability 2021, 13, 206. [Google Scholar] [CrossRef]
- Chen, Y.; Xie, S.; Luo, B.; Zhai, C. Particulate Pollution in Urban Chongqing of Southwest China: Historical Trends of Variation, Chemical Characteristics and Source Apportionment. Sci. Total Environ. 2017, 584–585, 523–534. [Google Scholar] [CrossRef]
- Liu, Y.; Yue, W.; Fan, P.; Zhang, Z.; Huang, J. Assessing the Urban Environmental Quality of Mountainous Cities: A Case Study in Chongqing, China. Ecol. Indic. 2017, 81, 132–145. [Google Scholar] [CrossRef]
- Bureau of Ecology and Environment of Chongqing. 14th Five-Year Plan for Ecological Environmental Protection in Chongqing (2021–2025). Available online: http://sthjj.cq.gov.cn/zwgk_249/zfxxgkzl/fdzdgknr/ghjh/202202/t20220216_10400261_wap.html (accessed on 11 July 2022).
- Zhan, Z.-Z.; Liu, H.-B.; Li, H.-M.; Wu, W.; Zhong, B. The Relationship between NDVI and Terrain Factors—A Case Study of Chongqing. Procedia Environ. Sci. 2012, 12, 765–771. [Google Scholar] [CrossRef]
- Li, W.; Wang, Y.; Xie, S.; Cheng, X. Coupling Coordination Analysis and Spatiotemporal Heterogeneity between Urbanization and Ecosystem Health in Chongqing Municipality, China. Sci. Total Environ. 2021, 791, 148311. [Google Scholar] [CrossRef]
- Bureau of Statistics of Chongqing. Chongqing Statistical Yearbook 2021. Available online: http://tjj.cq.gov.cn/zwgk_233/tjnj/tjnj.html?url=http://tjj.cq.gov.cn/zwgk_233/tjnj/2021/indexch.htm (accessed on 12 July 2022).
- Ministry of Ecology and Environment of the People’s Republic of China. Technical Regulation on Ambient Air Quality Index (AQI) (on Trial)::HJ 633-2012[S] 2012; Ministry of Ecology and Environment of the People’s Republic of China: Beijing, China, 2012.
- Chen, X.; Yang, J.; Sun, L. A Nonconvex Low-Rank Tensor Completion Model for Spatiotemporal Traffic Data Imputation. Transp. Res. Part C Emerg. Technol. 2020, 117, 102673. [Google Scholar] [CrossRef]
- Zhang, D.; Hu, Y.; Ye, J.; Li, X.; He, X. Matrix Completion by Truncated Nuclear Norm Regularization. In Proceedings of the 2012 IEEE Conference on Computer Vision and Pattern Recognition, Providence, RI, USA, 16–21 June 2012; pp. 2192–2199. [Google Scholar]
- Liu, J.; Musialski, P.; Wonka, P.; Ye, J. Tensor Completion for Estimating Missing Values in Visual Data. IEEE Trans. Pattern Anal. Mach. Intell. 2013, 35, 208–220. [Google Scholar] [CrossRef]
- Kolda, T.G.; Bader, B.W. Tensor Decompositions and Applications. SIAM Rev. 2009, 51, 455–500. [Google Scholar] [CrossRef]
- Hu, Y.; Zhang, D.; Ye, J.; Li, X.; He, X. Fast and Accurate Matrix Completion via Truncated Nuclear Norm Regularization. IEEE Trans. Pattern Anal. Mach. Intell. 2013, 35, 2117–2130. [Google Scholar] [CrossRef]
- Zhao, C.; Sun, Y.; Zhong, Y.; Xu, S.; Liang, Y.; Liu, S.; He, X.; Zhu, J.; Shibamoto, T.; He, M. Spatio-Temporal Analysis of Urban Air Pollutants throughout China during 2014–2019. Air Qual. Atmos. Health 2021, 14, 1619–1632. [Google Scholar] [CrossRef]
- Fan, H.; Zhao, C.; Yang, Y. A Comprehensive Analysis of the Spatio-Temporal Variation of Urban Air Pollution in China during 2014–2018. Atmos. Environ. 2020, 220, 117066. [Google Scholar] [CrossRef]
- Chongqing Development and Reform Commission. 14th Five-Year Plan for Energy Development of Chongqing (2021–2025). Available online: http://www.cq.gov.cn/zwgk/zfxxgkml/szfwj/qtgw/202206/t20220615_10818266.html (accessed on 10 March 2022).
- Ministry of Ecology and Environment of the People’s Republic of China. Limits and Measurement Methods for Emissions from Light-Duty Vehicles (CHINA 6) 2016; Ministry of Ecology and Environment of the People’s Republic of China: Beijing, China, 2016.
- Bureau of Ecology and Environment of Chongqing. 2020 Chongqing Environmental Statistics Annual Report. Available online: http://sthjj.cq.gov.cn/zwgk_249/zfxxgkzl/fdzdgknr/hjtj/202201/t20220124_10332823.html (accessed on 17 June 2022).
- Bureau of Statistics of Chongqing. Chongqing National Economic and Social Development Statistical Bulletin 2017. Available online: http://tjj.cq.gov.cn/zwgk_233/fdzdgknr/tjxx/sjzl_55471/tjgb_55472/202002/t20200219_5274429.html (accessed on 18 July 2022).
- Wong, Y.J.; Shiu, H.-Y.; Chang, J.H.-H.; Ooi, M.C.G.; Li, H.-H.; Homma, R.; Shimizu, Y.; Chiueh, P.-T.; Maneechot, L.; Nik Sulaiman, N.M. Spatiotemporal Impact of COVID-19 on Taiwan Air Quality in the Absence of a Lockdown: Influence of Urban Public Transportation Use and Meteorological Conditions. J. Clean. Prod. 2022, 365, 132893. [Google Scholar] [CrossRef] [PubMed]
- Su, Y.; Liu, X.; Li, X. Research on Traffic Congestion Based on System Dynamics: The Case of Chongqing, China. Complexity 2020, 2020, e6123896. [Google Scholar] [CrossRef]
- Chongqing Commission of Housing and Urban-Rural Development. The 14th Five-Year Plan for Urban Rail Transit Construction in Chongqing (2021–2025) 2022; Chongqing Commission of Housing and Urban-Rural Development: Chongqing, China, 2022.
- Tan, R.; Tang, D.; Lin, B. Policy Impact of New Energy Vehicles Promotion on Air Quality in Chinese Cities. Energy Policy 2018, 118, 33–40. [Google Scholar] [CrossRef]
- Chongqing Energy Bureau; Chongqing Development and Reform Commission. “14th Five-Year” Development Plan for Charging Infrastructure in Chongqing (2021–2025) 2022; Chongqing Commission of Housing and Urban-Rural Development: Chongqing, China, 2022.
- Li, L.; Li, Z.-L.; Zhang, D.; Fang, W.-K.; Xu, Q.; Duan, L.-F.; Lu, P.-L.; Wang, F.-W.; Zhang, W.-D.; Zhai, C.-Z. Pollution Characteristics and Source Apportionment of Atmospheric VOCs During Ozone Pollution Period in the Main Urban Area of Chongqing. Huan Jing Ke Xue Huanjing Kexue 2021, 42, 3595–3603. [Google Scholar] [CrossRef]
- Tian, J.; Fang, C.; Qiu, J.; Wang, J. Analysis of Ozone Pollution Characteristics and Influencing Factors in Northeast Economic Cooperation Region, China. Atmosphere 2021, 12, 843. [Google Scholar] [CrossRef]
- Liu, Y.; Zhou, Y.; Lu, J. Exploring the Relationship between Air Pollution and Meteorological Conditions in China under Environmental Governance. Sci. Rep. 2020, 10, 14518. [Google Scholar] [CrossRef]
- Chen, Y.; Zhang, S.; Peng, C.; Shi, G.; Tian, M.; Huang, R.-J.; Guo, D.; Wang, H.; Yao, X.; Yang, F. Impact of the COVID-19 Pandemic and Control Measures on Air Quality and Aerosol Light Absorption in Southwestern China. Sci. Total Environ. 2020, 749, 141419. [Google Scholar] [CrossRef]
- Borck, R.; Schrauth, P. Population Density and Urban Air Quality. Reg. Sci. Urban Econ. 2021, 86, 103596. [Google Scholar] [CrossRef]
- Lin, B.; Zhu, J. Changes in Urban Air Quality during Urbanization in China. J. Clean. Prod. 2018, 188, 312–321. [Google Scholar] [CrossRef]
- Bureau of Quality and Technical Supervision of Hubei. Specification Requirements of Construction and Acceptance for Hubei Province Ambient Air Quality Automatic Monitoring System 2011; Bureau of Quality and Technical Supervision of Hubei: Wuhan, China, 2011.
- Yao, Q.; Kwok, J.T.; Wang, T.; Liu, T.-Y. Large-Scale Low-Rank Matrix Learning with Nonconvex Regularizers. IEEE Trans. Pattern Anal. Mach. Intell. 2019, 41, 2628–2643. [Google Scholar] [CrossRef]
- Candes, E.J.; Tao, T. The Power of Convex Relaxation: Near-Optimal Matrix Completion. IEEE Trans. Inf. Theory 2010, 56, 2053–2080. [Google Scholar] [CrossRef] [Green Version]
- Tan, S.; Wang, Y.; Yuan, Q.; Zheng, L.; Li, T.; Shen, H.; Zhang, L. Reconstructing Global PM2.5 Monitoring Dataset from OpenAQ Using a Two-Step Spatio-Temporal Model Based on SES-IDW and LSTM. Environ. Res. Lett. 2022, 17, 034014. [Google Scholar] [CrossRef]
- Noor, M.N.; Yahaya, A.S.; Ramli, N.A.; Al Bakri Abdullah, M.M. Filling the Missing Data of Air Pollutant Concentration Using Single Imputation Methods. Appl. Mech. Mater. 2015, 754–755, 923–932. [Google Scholar]
- Chen, L.; Jiang, X.; Liu, X.; Zhou, Z. Logarithmic Norm Regularized Low-Rank Factorization for Matrix and Tensor Completion. IEEE Trans. Image Process. 2021, 30, 3434–3449. [Google Scholar] [CrossRef]


Publisher’s Note: MDPI stays neutral with regard to jurisdictional claims in published maps and institutional affiliations. |
© 2022 by the authors. Licensee MDPI, Basel, Switzerland. This article is an open access article distributed under the terms and conditions of the Creative Commons Attribution (CC BY) license (https://creativecommons.org/licenses/by/4.0/).
Share and Cite
Zhang, H.; Nie, Y.; Deng, Q.; Liu, Y.; Lyu, Q.; Zhang, B. Spatio-Temporal Changes in Air Quality of the Urban Area of Chongqing from 2015 to 2021 Based on a Missing-Data-Filled Dataset. Atmosphere 2022, 13, 1473. https://doi.org/10.3390/atmos13091473
Zhang H, Nie Y, Deng Q, Liu Y, Lyu Q, Zhang B. Spatio-Temporal Changes in Air Quality of the Urban Area of Chongqing from 2015 to 2021 Based on a Missing-Data-Filled Dataset. Atmosphere. 2022; 13(9):1473. https://doi.org/10.3390/atmos13091473
Chicago/Turabian StyleZhang, Huayu, Yong Nie, Qian Deng, Yaqin Liu, Qiyuan Lyu, and Bo Zhang. 2022. "Spatio-Temporal Changes in Air Quality of the Urban Area of Chongqing from 2015 to 2021 Based on a Missing-Data-Filled Dataset" Atmosphere 13, no. 9: 1473. https://doi.org/10.3390/atmos13091473
APA StyleZhang, H., Nie, Y., Deng, Q., Liu, Y., Lyu, Q., & Zhang, B. (2022). Spatio-Temporal Changes in Air Quality of the Urban Area of Chongqing from 2015 to 2021 Based on a Missing-Data-Filled Dataset. Atmosphere, 13(9), 1473. https://doi.org/10.3390/atmos13091473