
Are Atmospheric Situations Now More Favourable for Heavy Rainfall in the Spanish Mediterranean? Analysis of Episodes in the Alicante Province (1981–2020)
 , ,
, ,  and
and
Abstract
:1. Introduction
2. Data and Methods
3. Results
4. Discussion and Conclusions
Author Contributions
Funding
Institutional Review Board Statement
Informed Consent Statement
Data Availability Statement
Acknowledgments
Conflicts of Interest
Appendix A

| Observatory | Date | mm/day | Synoptic Situation Martín Vide (1984) | Synoptic Situation Olcina Cantos (1994) | Synoptic Situation J&C (1977) | WeMOi | Other Synoptic Features | Nº Obs. Recorded the Event |
|---|---|---|---|---|---|---|---|---|
| PEGO CONVENTO | 21/04/81 | 108.2 | Advection from the E with DANA | cP (Retrograde trough) | CNE | −2.00 | Retrograde trough. DANA over IP, B in North Africa | 4 |
| LA ROMANA ALGESAR | 29/05/82 | 110.0 | Advection from the E with DANA | mP centred | CSE | −0.61 | British Isles-Central Europe A. DANA over Portugal. B in North Africa | 3 |
| ALICANTE-ELCHE/AEROPUERTO | 19/10/82 | 235.0 | Advection from the E with DANA | mP centred | NE | −1.13 | Azores A. B in Algeria, DANA in the S of the IP and N of the Morocco | 9 |
| ALMUDAINA | 31/10/82 | 124.2 | Advection from the E with DANA | cP (Retrograde trough) | A | −1.15 | Retrograde trough, Central Europe A, DANA over Algeria | 7 |
| ALMUDAINA | 01/11/82 | 130.5 | Advection from the E with DANA | mP to the south | A | −1.26 | Retrograde trough, Central Europe A, DANA over Algeria | 5 |
| BANYERES DE MARIOLA | 10/11/84 | 129.0 | Dynamic or Cold- core Low | mP to the south | C | −2.55 | Algeria low, Scandinavian A | 8 |
| ROJALES EL MOLINO | 21/02/85 | 133.0 | Deep Trough | mP centred | SE | 0.99 | Azores A with bridge with British Isles-Scandinavian-Russian A. B in North Africa | 4 |
| CALLOSA D’EN SARRIA EL ALGAR | 28/10/85 | 195.0 | Advection from the NE with DANA | cP (Retrograde trough) | CNE | −1.59 | A Islas Británicas, B in North Africa, DANA over Balearic Isles | 6 |
| PEGO CONVENTO | 15/11/85 | 249.0 | Deep Trough | mP centred | E | −2.12 | Azores A with bridge with Scandinavian A. Trough over Portugal | 15 |
| GATA DE GORGOS | 16/11/85 | 200.0 | Advection from the NE with DANA | mP to the south | CNE | −1.76 | Azores A with bridge with Scandinavian A. DANA over Morocco | 2 |
| GATA DE GORGOS | 17/11/85 | 115.0 | Advection from the NE with DANA | cP (Retrograde trough) | NE | −1.12 | Azores A with bridge with Scandinavian A. DANA over Morocco | 1 |
| ALMUDAINA | 29/12/85 | 105.0 | Deep Trough | mP centred | C | −1.41 | Low in the Strait of Gibraltar | 2 |
| TARBENA CH JUCAR POBLE DE DALT | 29/09/86 | 241.1 | Advection from the E with DANA | cP (Retrograde trough) | E | −1.56 | British Isles A. DANA over Ibiza | 9 |
| TARBENA CH JUCAR POBLE DE DALT | 30/09/86 | 218.2 | Advection from the E with DANA | mP to the south | E | −2.04 | British Isles A | 3 |
| ALMUDAINA | 16/11/86 | 128.0 | Advection from the E with DANA | mP to the south | NE | −1.16 | A to the W of the IP, low over Algeria | 3 |
| CALLOSA D’EN SARRIA EL ALGAR | 17/11/86 | 160.0 | Advection from the NE with DANA | mP to the south | NE | −0.70 | Azores A. DANA over Algeria | 5 |
| PEGO CONVENTO | 03/11/87 | 371.5 | Dynamic or Cold- core Low | mP to the south | CSE | −2.97 | British Isles A, rhombus pattern. B to the Cape of San Vicente | 6 |
| ORIHUELA ‘LOS DESAMPARADOS’ | 04/11/87 | 316.00 | Advection from the E | mP to the south | SE | −2.84 | British Isles A | 7 |
| GATA DE GORGOS | 30/09/88 | 206.0 | Deep Trough | mP centred | CE | −1.29 | British Isles A, Trough to the N of the IP | 4 |
| LA ROMANA ALGESAR | 14/10/88 | 118.0 | Advection from the E with DANA | mP centred | CS | −2.77 | Azores A with bridge with Central Europe A. B over Galicia | 2 |
| VALL DE LAGUARD FONTILLES | 04/11/88 | 110.0 | Advection from the E | mP to the south | SE | −3.20 | Central Europe A | 1 |
| GATA DE GORGOS | 17/03/89 | 187.0 | Deep Trough | mP centred | C | −0.72 | Azores A. Trough to the E of the IP | 4 |
| TARBENA CH JUCAR POBLE DE DALT | 18/03/89 | 143.6 | Advection from the E with DANA | mP centred | NE | −1.00 | Azores A, B over Algeria. DANA to the S of the IP and Morocco | 4 |
| TARBENA CH JUCAR POBLE DE DALT | 04/09/89 | 255.6 | Deep Trough | mP centred | E | −0.69 | Azores A, B in North Africa | 3 |
| GATA DE GORGOS | 05/09/89 | 201.0 | Deep Trough | mP centred | E | −1.53 | A Azores, retrograde trough, B in North Africa | 5 |
| TIBI TALECA | 07/09/89 | 113.6 | Advection from the E with DANA | mP centred | CE | −2.10 | North-Atlantic A. B to the Gulf of Cadiz | 8 |
| TARBENA CH JUCAR POBLE DE DALT | 30/11/89 | 120.9 | Advection from the E | mP/cT | SE | −1.92 | Central Europe powerful A | 3 |
| ALICANTE | 01/12/89 | 119.8 | Advection from the E with DANA | cP (Retrograde trough) | SE | −1.82 | Central Europe A | 6 |
| CALLOSA D’EN SARRIA EL ALGAR | 01/05/90 | 126.0 | Weak trough with gentle flow from the E | cP (Retrograde trough) | E | −1.23 | Central Europe A | 1 |
| VALL DE LAGUARD FONTILLES | 19/12/90 | 128.0 | Advection from the E with DANA | cP (Retrograde trough) | E | −2.07 | Retrograde trough, Azores A. B in the Morocco coast | 6 |
| TARBENA CH JUCAR POBLE DE DALT | 23/03/91 | 108.1 | Deep Trough | mA (Trough) | C | - | Azores A, Algeria low | 1 |
| TARBENA CH JUCAR POBLE DE DALT | 23/10/91 | 143.5 | Advection from the E with DANA | mP centred | E | - | Retrograde trough, British Isles A. DANA to the E of the IP | 7 |
| PEGO CONVENTO | 24/10/91 | 128.9 | Advection from the E with DANA | mP centred | E | - | Retrograde trough, British Isles A. DANA in front of Portugal | 7 |
| CALLOSA D’EN SARRIA TOSSAL DE SALOMÓ | 19/02/92 | 124.3 | Deep Trough | cP (Retrograde trough) | CSE | −2.88 | British Isles A, retrograde trough. B in the Gulf of Cadiz | 6 |
| CALLOSA D’EN SARRIA EL ALGAR | 20/02/92 | 145.0 | Advection from the E with DANA | cP (Retrograde trough) | E | −2.19 | Retrograde trough, Azores A | 6 |
| TARBENA CH JUCAR POBLE DE DALT | 02/03/92 | 122.9 | Advection from the E with DANA | mP to the south | SE | −1.47 | Retrograde trough | 4 |
| TARBENA CH JUCAR POBLE DE DALT | 02/05/92 | 176.5 | Deep Trough | mP centred | NE | −0.87 | Azores A, B in North Africa, DANA over Sicilia | 2 |
| CALLOSA D’EN SARRIA EL ALGAR | 03/05/92 | 201.0 | Advection from the NE with DANA | mP to the south | NE | −0.66 | Azores A- British Isles A, B in North Africa, DANA over Oran | 5 |
| GATA DE GORGOS | 13/06/92 | 105.0 | Advection from the E with DANA | cP (Retrograde trough) | CE | −0.89 | Azores A | 10 |
| PEGO CONVENTO | 08/10/92 | 123.0 | Advection from the E with DANA | mP to the south | CE | −1.67 | British Isles A | 4 |
| ALMUDAINA | 01/02/93 | 240.5 | Advection from the E with DANA | mP to the south | SE | −2.78 | Central Europe A | 5 |
| ALMUDAINA | 02/02/93 | 102.6 | Advection from the E with DANA | mP to the south | E | −1.84 | Central Europe A | 2 |
| PEGO CONVENTO | 25/10/93 | 117.0 | Deep Trough | cP (Retrograde trough) | E | −1.28 | British Isles A, Trough to the E of the PI | 3 |
| PEGO CONVENTO | 26/10/93 | 118.5 | Advection from the E with DANA | cP (Retrograde trough) | E | −1.99 | British Isles A | 2 |
| PEGO CONVENTO | 08/11/93 | 118.7 | DANA to the SW | mP to the south | C | −0.09 | Azores A. DANA S Portugal, B in North Africa. | 1 |
| TARBENA CH JUCAR POBLE DE DALT | 24/11/93 | 141.7 | Advection from the E with DANA | mP to the south | E | −2.07 | Azores A with bridge with Russian A | 6 |
| TARBENA CH JUCAR POBLE DE DALT | 25/11/93 | 162.4 | Advection from the E with DANA | cP (Retrograde trough) | NE | −1.29 | Russian - Central Europe A | 5 |
| GATA DE GORGOS | 15/04/94 | 125.0 | Deep Trough | mA (Trough) | NE | −1.52 | British Isles A, Algeria Low | 4 |
| GATA DE GORGOS | 15/04/95 | 100.0 | Advection from the NE | cP (Retrograde trough) | ANE | −0.61 | A to the W British Isles. B in North Africa. DANA in Italy and central Europe | 1 |
| PEGO CONVENTO | 10/09/96 | 186.0 | Advection from the E with DANA | mP to the south | E | −1.88 | A to the W British Isles | 5 |
| PEGO CONVENTO | 11/09/96 | 160.1 | Advection from the E with DANA | mP centred | CE | −1.71 | A to the W British Isles | 1 |
| CALLOSA D’EN SARRIA EL ALGAR | 08/04/97 | 230.0 | Advection from the E with DANA | mP to the south | SE | −2.68 | Azores A with bridge with central Europe- Scandinavian- Arctic A | 5 |
| VILLENA (LA VEREDA) | 18/06/97 | 192.0 | Weak trough with gentle flow from the E | mP centred | NE | −1.33 | Azores A. Trough to the E of IP | 2 |
| ALICANTE | 30/09/97 | 270.2 | Advection from the E with DANA | mP to the south | E | −1.07 | - | 3 |
| TARBENA CH JUCAR POBLE DE DALT | 28/10/97 | 162.3 | Deep Trough | mP | C | −1.58 | Central Europe powerful A | 2 |
| VALL DE LAGUARD FONTILLES | 04/12/97 | 400.0 | Deep Trough | cP (Retrograde trough) | CE | −1.68 | British Isles A, B in the Strait | 3 |
| TARBENA CH JUCAR POBLE DE DALT | 05/12/97 | 180.3 | Dynamic or Cold- core Low | mP to the south | NE | −1.84 | France A. B over Algeria. DANA to the E in the IP- Balearic Isles- North Africa. | 7 |
| PEGO CONVENTO | 11/11/99 | 237.7 | Advection from the E with DANA | cP (Retrograde trough) | CE | −2.41 | Omega blocking, retrograde trough, British Isles A | 1 |
| VALL DE LAGUARD FONTILLES | 13/03/00 | 180.0 | Advection from the E with DANA | cP (Retrograde trough) | CNE | −0.18 | Surface low to the SE of the IP | 4 |
| VALL DE LAGUARD FONTILLES | 23/10/00 | 226.0 | Advection from the E with DANA | mP to the south | SE | −2.41 | Azores A with bridge with Central Europe A | 2 |
| VALL DE LAGUARD FONTILLES | 24/10/00 | 110.0 | Advection from the E with DANA | mP to the south | SE | −1.94 | Azores A | 2 |
| VALL DE LAGUARD FONTILLES | 14/02/01 | 100.0 | Advection from the E with DANA | cP (Retrograde trough) | C | −0.79 | Omega blocking, retrograde trough, British Isles A | 1 |
| TARBENA CH JUCAR POBLE DE DALT | 19/09/01 | 110.0 | Weak trough with gentle flow from the E | mP centred | ASE | −0.91 | Russian A, Netherlands-Azores B, B in North Africa | 1 |
| GATA DE GORGOS | 28/03/02 | 140.0 | Advection from the E with DANA | cP (Retrograde trough) | SE | −3.35 | Central Europe A | 1 |
| GATA DE GORGOS | 02/04/02 | 113.0 | Deep Trough | mP centred | C | −1.29 | Algeria low | 2 |
| PEGO CONVENTO | 06/05/02 | 295.1 | Advection from the E with DANA | mP centred | E | −2.10 | Azores A with bridge with Scandinavian A | 2 |
| PEGO CONVENTO | 07/05/02 | 180.0 | Advection from the E with DANA | mP to the south | CNE | −2.47 | A to the W of British Isles with bridge with Scandinavian A | 1 |
| BOLULLA | 10/01/03 | 123.5 | Deep Trough | mA (Trough) | NE | 0.05 | Azores - British Isles – Scandinavian A, B in Algeria. | 1 |
| TARBENA CH JUCAR POBLE DE DALT | 15/02/03 | 144.3 | Deep Trough | cP (Retrograde trough) | NE | −0.90 | Scandinavian A | 1 |
| VALL DE LAGUARD FONTILLES | 15/04/03 | 202.5 | Advection from the E with DANA | mP centred | CE | −2.51 | Russian - Scandinavian A | 3 |
| ALMUDAINA | 17/11/03 | 114.3 | Advection from the E with DANA | mP to the south | NE | −1.20 | Azores A, Algeria low | 2 |
| PEGO CONVENTO | 28/03/04 | 115.7 | Advection from the E with DANA | mP centred | CE | −3.36 | Azores A, Retrograde trough | 2 |
| ROJALES EL MOLINO | 15/04/04 | 130.2 | Weak trough with gentle flow from the E | mP centred | SE | −3.06 | Azores A with bridge with Central Europe A, Morocco low | 1 |
| TARBENA CH JUCAR POBLE DE DALT | 11/05/04 | 116.1 | Advection from the E with DANA | mP to the south | C | −1.21 | Azores A | 1 |
| ALMUDAINA | 05/11/04 | 185.2 | Advection from the NE with DANA | mP to the south | E | −1.02 | British Isles A. DANA in the Gulf of Cadiz | 1 |
| TARBENA CH JUCAR POBLE DE DALT | 12/11/04 | 108.5 | Advection from the NE with DANA | mP to the south | NE | −1.09 | Azores A to the W of British Isles. B in North Africa. DANA to the S of IP and to the N of Morocco | 1 |
| ALMUDAINA | 04/12/04 | 181.6 | Advection from the NE with DANA | mP to the south | CNE | −1.56 | Retrograde trough. DANA to the SW of IP | 2 |
| ALMUDAINA | 05/12/04 | 142.9 | Advection from the NE with DANA | mP to the south | NE | −1.01 | Central Europe A. DANA in the N of Morocco | 2 |
| TARBENA CH JUCAR POBLE DE DALT | 07/12/04 | 133.6 | Advection from the NE with DANA | mP to the south | NE | −1.16 | Central Europe A. DANA to the SE of IP- N of Morocco and Balearic Isles | 2 |
| TARBENA CH JUCAR POBLE DE DALT | 30/01/06 | 154.2 | Advection from the NE with DANA | mP to the south | CNE | −1.92 | British Isles - Central Europe A. Western Mediterranean B. DANA to the S of IP, Morocco and Algeria | 2 |
| TARBENA CH JUCAR POBLE DE DALT | 20/12/06 | 140.0 | Advection from the NE with DANA | cP (Retrograde trough) | NE | −0.72 | British Isles A. DANA to the E of IP | 4 |
| TARBENA CH JUCAR POBLE DE DALT | 29/03/07 | 126.0 | Advection from the NE with DANA | mA (Trough) | N | −0.13 | Azores A. B in North Africa, DANA on the coast of Algeria | 1 |
| ALMUDAINA | 22/09/07 | 114.9 | Weak trough with gentle flow from the E | mP centred | U | −0.68 | Azores A | 1 |
| VALL DE LAGUARD FONTILLES | 11/10/07 | 371.2 | Advection from the E with DANA | cP (Retrograde trough) | NE | −1.59 | A over European mid-latitudes | 1 |
| GATA DE GORGOS | 12/10/07 | 258.9 | Advection from the E with DANA | cP (Retrograde trough) | NE | −0.98 | British Isles A, rhombus pattern | 1 |
| TARBENA CH JUCAR POBLE DE DALT | 17/10/07 | 104.0 | Weak trough with gentle flow from the E | mP centred | E | −1.19 | Europe A | 1 |
| PEGO CONVENTO | 18/10/07 | 100.4 | Advection from the NE | cP (Retrograde trough) | NE | −0.70 | British Isles A | 1 |
| TARBENA CH JUCAR POBLE DE DALT | 22/10/07 | 190.0 | Advection from the N | mT | AN | 0.70 | Russian- Scandinavian - British Isles A. DANA in Italy. B in the Adriatic | 3 |
| TARBENA CH JUCAR POBLE DE DALT | 23/10/07 | 133.0 | Advection from the N | cT/mP | N | 0.42 | Russian- Scandinavian - British Isles A. DANA to the S of Italy and Balkans | 2 |
| ALMUDAINA | 09/10/08 | 133.3 | Advection from the E with DANA | mP to the south | NE | −1.45 | A over European mid-latitudes | 1 |
| PEGO CONVENTO | 22/10/08 | 131.0 | Advection from the NE with DANA | mP centred | CNE | −1.36 | Azores A. DANA over Portugal | 2 |
| GATA DE GORGOS | 15/09/09 | 110.4 | Advection from the E with DANA | mP centred | C | −1.29 | A over European mid-latitudes | 3 |
| VALL DE LAGUARD FONTILLES | 22/09/09 | 109.0 | Advection from the E with DANA | cP (Retrograde trough) | NE | −0.81 | A over European mid-latitudes | 3 |
| GATA DE GORGOS | 27/09/09 | 111.0 | Advection from the E with DANA | cP (Retrograde trough) | E | −1.24 | A over European mid-latitudes | 1 |
| ROJALES EL MOLINO | 28/09/09 | 192.0 | Advection from the E with DANA | mP centred | E | −1.20 | A over European mid-latitudes | 1 |
| LA MARINA DE ELCHE | 29/09/09 | 119.3 | Weak trough with gentle flow from the E | mP to the south | E | −0.93 | Azores low, British Isles A | 1 |
| GATA DE GORGOS | 13/12/09 | 190.0 | Deep Trough | cP (Retrograde trough) | CNE | −0.36 | Algeria low, British Isles A | 1 |
| TARBENA CH JUCAR POBLE DE DALT | 14/12/09 | 188.0 | Deep Trough | cP (Retrograde trough) | CNE | −1.02 | Omega blocking, retrograde trough, Iceland A. Western Mediterranean B | 2 |
| TARBENA CH JUCAR POBLE DE DALT | 25/01/10 | 236.0 | Advection from the E with DANA | mA (Trough) | NE | −1.80 | A over European mid-latitudes | 1 |
| GATA DE GORGOS | 13/08/10 | 139.7 | Weak trough with gentle flow from the E | mP centred | CE | −0.97 | Atlantic A, North Sea low | 1 |
| ALMUDAINA | 12/10/10 | 132.1 | Dynamic or Cold- core Low | mP centred | C | −2.04 | DANA over IP, Balearic Isles B | 6 |
| TIBI TALECA | 11/03/11 | 102.5 | DANA to the SW | mP to the south | SE | −2.66 | Atlantic A - Mediterranean A. B in the N of Canary Isles | 1 |
| VALL DE LAGUARD FONTILLES | 28/10/11 | 189.0 | Advection from the E with DANA | mP/cT | CNE | −1.46 | Azores A with bridge with Central Europe A, Algeria low | 1 |
| ALMUDAINA | 29/10/11 | 100.5 | Advection from the E with DANA | mP to the south | NE | −1.16 | Central Europe A | 1 |
| PEGO CONVENTO | 21/11/11 | 121.7 | Dynamic or Cold- core Low | mP to the south | C | −2.00 | Azores A, Central Europe A. Algeria low | 4 |
| VALL DE LAGUARD FONTILLES | 22/11/11 | 107.0 | Dynamic or Cold- core Low | mP centred | C | −0.96 | Azores A with bridge with Central Europe – Scandinavian A. B in the Mediterranean, DANA over Portugal. | 1 |
| GATA DE GORGOS | 20/03/12 | 117.0 | Advection from the E with DANA | mP centred | E | −1.31 | A over European mid-latitudes | 1 |
| VALL DE LAGUARD FONTILLES | 11/11/12 | 230.0 | Advection from the NE with DANA | mP centred | C | −0.57 | Azores A- Russian A. Western Mediterranean B. DANA over IP | 3 |
| PEGO CONVENTO | 13/11/12 | 187.5 | Advection from the E with DANA | mP to the south | NE | −1.60 | Central Europe A, Algeria low | 1 |
| VALL DE LAGUARD FONTILLES | 24/04/13 | 105.0 | Advection from the E with DANA | mP to the south | E | −1.76 | Central Europe A | 2 |
| ALMUDAINA | 25/04/13 | 127.1 | Advection from the E with DANA | mP to the south | CE | −1.90 | Algeria low | 1 |
| BOLULLA | 30/11/13 | 103.0 | Deep Trough | mA (Trough) | N | −0.06 | A to the W British Isles | 2 |
| TIBI TALECA | 16/12/16 | 105.1 | Advection from the E with DANA | mP centred | C | −2.55 | Azores A with bridge with Central Europe A | 1 |
| TIBI TALECA | 17/12/16 | 102.6 | Advection from the E with DANA | mP to the south | E | −2.38 | A over European mid-latitudes | 1 |
| ALMUDAINA | 18/12/16 | 255.0 | Advection from the E with DANA | cP (Retrograde trough) | E | −2.31 | British Isles-France-Central Europe A | 2 |
| VALL DE LAGUARD FONTILLES | 19/12/16 | 213.0 | Dynamic or Cold- core Low | mP centred | C | −2.50 | Azores A with bridge with Central Europe A, DANA over France | 6 |
| TARBENA CH JUCAR POBLE DE DALT | 18/01/17 | 100.0 | Deep Trough | cP (Retrograde trough) | NE | −1.64 | Central Europe A. B to the S of Italy and Sicily | 1 |
| ALMUDAINA | 19/01/17 | 101.4 | Advection from the E with DANA | cP (Retrograde trough) | E | −2.44 | Central Europe A | 1 |
| TARBENA CH JUCAR POBLE DE DALT | 21/01/17 | 338.0 | Dynamic or Cold- core Low | mP to the south | CNE | −2.04 | Azores A with bridge with Central Europe A, DANA to the W of France, Balearic Isles low | 2 |
| TARBENA CH JUCAR POBLE DE DALT | 22/01/17 | 114.0 | Dynamic or Cold- core Low | mP centred | CNE | −1.50 | Central Europe A. Balearic Isles low | 2 |
| AGOST ESCUELA NACIONAL | 13/03/17 | 167.0 | Advection from the E with DANA | cP (Retrograde trough) | NE | −0.82 | Azores A | 1 |
| ELCHE CH SEGURA | 19/04/19 | 100.0 | Advection from the E with DANA | mP to the south | CE | −2.47 | Scandinavian A | 1 |
| GATA DE GORGOS | 21/04/19 | 226.0 | Dynamic or Cold- core Low | mP to the south | CNE | −1.62 | Azores A with bridge with Central Europe A. Algeria low. DANA over Oran | 2 |
| PEGO CONVENTO | 20/08/19 | 141.0 | Weak trough with gentle flow from the E | mP/cT | E | −0.76 | A in the North Azores. Maritime flow | 1 |
| VALL DE LAGUARD FONTILLES | 11/09/19 | 215.0 | Advection from the E with DANA | mP to the south | NE | −1.53 | Azores A with bridge with Scandinavian A | 1 |
| ORIHUELA ‘LOS DESAMPARADOS’ | 12/09/19 | 230.8 | Advection from the E with DANA | mP to the south | E | −1.44 | A over European mid-latitudes | 1 |
| TARBENA CH JUCAR POBLE DE DALT | 03/12/19 | 143.0 | Dynamic or Cold- core Low | mP to the south | E | −2.75 | Azores A with bridge with Central Europe A. Orán low | 1 |
| TARBENA CH JUCAR POBLE DE DALT | 19/01/20 | 277.0 | Dynamic or Cold- core Low | cP (Retrograde trough) | CNE | −1.20 | British Isles A. DANA to the SE of IP | 2 |
| ALMUDAINA | 20/01/20 | 192.4 | Advection from the E with DANA | cP (Retrograde trough) | E | −3.93 | Central Europe powerful A | 1 |
References
- Lopez-Bustins, J.A.; Lemus-Canovas, M. The influence of the Western Mediterranean Oscillation upon the spatio-temporal variability of precipitation over Catalonia (northeastern of the Iberian Peninsula). Atmos. Res. 2020, 236, 104819. [Google Scholar] [CrossRef]
- Martín Vide, J.; Olcina Cantos, J. Climas y Tiempos de España; Alianza Editorial: Madrid, Spain, 2001. [Google Scholar]
- Martín-Vide, J. Spatial distribution of a daily precipitation concentration index in peninsular Spain. Int. J. Climatol. 2004, 24, 959–971. [Google Scholar] [CrossRef]
- Estrela, M.J.; Peñarrocha, D.; Pastor, F.; Millán, M. Torrential rain events on the Spanish Mediterranean coast: Relationship between spatial precipitation patterns and synoptic conditions. In Mediterranean Storms; Editoriale Bios: Cosenza, Italy, 2000; pp. 97–110. [Google Scholar]
- Lopez-Bustins, J.A.; Arbiol-Roca, L.; Martin-Vide, J.; Barrera-Escoda, A.; Prohom, M. Intra-annual variability of the Western Mediterranean Oscillation (WeMO) and occurrence of extreme torrential precipitation in Catalonia (NE Iberia). Nat. Hazards Earth Syst. Sci. 2020, 20, 2483–2501. [Google Scholar] [CrossRef]
- Peñarrocha, D.; Estrela, M.J.; Millán, M. Classification of daily rainfall patterns in a Mediterranean area with extreme intensity levels: The Valencia region. Int. J. Climatol. 2002, 22, 677–695. [Google Scholar] [CrossRef]
- Gil-Guirado, S.; Pérez-Morales, A.; López-Martínez, F. SMC-Flood database: A high-resolution press database on flood cases for the Spanish Mediterranean coast (1960–2015). Nat. Hazards Earth Syst. Sci. 2019, 19, 1955–1971. [Google Scholar] [CrossRef]
- Olcina Cantos, J. Incremento de episodios de inundación por lluvias de intensidad horaria en el sector central del litoral mediterráneo español: Análisis de tendencias en Alicante. Sémata Cienc. Sociais E Humanid. 2017, 29, 143–163. [Google Scholar] [CrossRef]
- Ribas Palom, A.M.; Olcina Cantos, J.; Sauri Pujol, D. More exposed but also more vulnerable? Climate change, high intensity precipitation events and flooding in Mediterranean Spain. Disaster Prev. Manag. Int. J. 2020, 29, 229–248. [Google Scholar] [CrossRef]
- Tapiador, F.J.; Marcos, C.; Sancho, J.M.; Santos, C.; Núñez, J.Á.; Navarro, A.; Kummerow, C.; Adler, R.F. The September 2019 floods in Spain: An example of the utility of satellite data for the analysis of extreme hydrometeorological events. Atmos. Res. 2021, 257, 105588. [Google Scholar] [CrossRef]
- Lemus-Canovas, M.; Lopez-Bustins, J.A.; Martín-Vide, J.; Halifa-Marin, A.; Insua-Costa, D.; Martinez-Artigas, J.; Trapero, L.; Serrano-Notivoli, R.; Cuadrat, J.M. Characterisation of extreme precipitation events in the Pyrenees: From the local to the synoptic scale. Atmosphere 2021, 12, 665. [Google Scholar] [CrossRef]
- Llasat, M.C. An objective classification of rainfall events on the basis of their convective features: Application to rainfall intensity in the Northeast of Spain. Int. J. Climatol. 2001, 21, 1385–1400. [Google Scholar] [CrossRef]
- Martin-Vide, J.; Sanchez-Lorenzo, A.; Lopez-Bustins, J.A.; Cordobilla, M.J.; Garcia-Manuel, A.; Raso, J.M. Torrential rainfall in northeast of the Iberian Peninsula: Synoptic patterns and WeMO influence. Adv. Sci. Res. 2008, 2, 99–105. [Google Scholar] [CrossRef]
- Olcina Cantos, J. Métodos de clasificación sinóptica en España. Revisión y propuesta. Estud. Geogr. 1994, 55, 357–387. [Google Scholar] [CrossRef]
- Linés Escardó, A. Perturbaciones Típicas que Descienden a la Península Ibérica y Precipitaciones Asociadas; Ministerio de Transportes, Turismo y Comunicaciones, Instituto Nacional de Meteorología, Sección de Publicaciones: Madrid, Spain, 1981. [Google Scholar]
- Font Tullot, I. Climatología de España y Portugal; Instituto Nacional de Meteorología, Sección de publicaciones: Madrid, Spain, 1983. [Google Scholar]
- Jansá Guardiola, J.M. La masa de aire mediterránea. Rev. Geofís. 1959, 18, 35–50. [Google Scholar]
- Jansá Guardiola, J.M. El frente mediterráneo. Rev. Geofís. 1962, 21, 249–259. [Google Scholar]
- Florit Ameller, J.; Jansa Clar, A. Situaciones de presión en el Mediterráneo Occidental repercusiones sobre el tiempo en Menorca y en el resto de España. Treb. De Geogr. 1978, 35, 57–84. [Google Scholar]
- Martín Vide, J. Interpretación de los Mapas del Tiempo; Ketres Editorial: Barcelona, Spain, 1984. [Google Scholar]
- Martín-Vide, J.; Moreno-García, M.C.; López-Bustins, J.A. Synoptic causes of torrential rainfall in south-eastern spain (1941–2017). Geogr. Res. Lett. 2021, 47, 143–162. [Google Scholar] [CrossRef]
- Grimalt-Gelabert, M.; Alomar-Garau, G.; Martin-Vide, J. Synoptic Causes of Torrential Rainfall in the Balearic Islands (1941–2010). Atmosphere 2021, 12, 1035. [Google Scholar] [CrossRef]
- Jenkinson, A.F.; Collison, P. An Initial Climatology of GalesWales over the North Sea. Synoptic Climatology Branch Memorandum; Meteorological Office, Braknell: London, UK, 1977. [Google Scholar]
- Miró, J.R.; Pepin, N.; Peña, J.C.; Martin-Vide, J. Daily atmospheric circulation patterns for Catalonia (northeast Iberian Peninsula) using a modified version of Jenkinson and Collison method. Atmos. Res. 2020, 231, 104674. [Google Scholar] [CrossRef]
- Gil Olcina, A.; Olcina Cantos, J. Tratado de Climatología; Servicio de Publicaciones, Universidad de Alicante: Sant Vicent del Raspeig, Spain, 2021. [Google Scholar]
- Romero, R.; Sumner, G.; Ramis, C.; Genovés, A. A classification of the atmospheric circulation patterns producing significant daily rainfall in the Spanish Mediterranean area. Int. J. Climatol. 1999, 19, 765–785. [Google Scholar] [CrossRef]
- Capel Molina, J.J. El Clima de la Península Ibérica; Ariel Geografía: Barcelona, Spain, 2000. [Google Scholar]
- Spellman, G. The application of an objective weather-typing system to the Iberian peninsula. Weather 2000, 55, 375–385. [Google Scholar] [CrossRef]
- Martín Vide, J. Aplicación de la clasificación sinóptica automática de Jenkinson y Collison a días de precipitación torrencial en el este de España. In La Información Climática Como Herramienta de Gestión Ambiental; Cuadrat, J.M., Vicente, S., Saz, M.A., Eds.; Grupo de Climatología Asociación Española de Climatología: Albarracín, Spain, 2002; pp. 123–127. [Google Scholar]
- Grimalt, M.; Tomàs, M.; Alomar, G.; Martin-Vide, J.; Moreno-García, M.C. Determination of the Jenkinson and Collison’s weather types for the western Mediterranean basin over the 1948–2009 period. Temporal analysis. Atmósfera 2013, 26, 75–94. [Google Scholar] [CrossRef]
- Llop Garau, J.; Alomar Garau, G. Clasificación sinóptica automática de Jenkinson y Collison para los días de precipitación mayor o igual a 100 mm en la franja litoral catalana e Islas Baleares. In Cambio Climático. Extremos e Impactos; Rodríguez, C., Ceballos, A., González, N., Morán, E., Hernández, A., Eds.; Asociación Española de Climatología: Salamanca, Spain, 2012; pp. 449–458. [Google Scholar]
- Llop Garau, J.; Alomar Garau, G. Clasificación sinóptica automática de Jenkinson y Collison para los días de precipitación mayor o igual a 200 mm en la isla de Mallorca. Territoris 2012, 8, 143–152. Available online: https://raco.cat/index.php/Territoris/article/view/259933 (accessed on 4 July 2022).
- Gilabert, J.; Llasat, M.C. Circulation weather types associated with extreme flood events in Northwestern Mediterranean. Int. J. Climatol. 2018, 38, 1864–1876. [Google Scholar] [CrossRef]
- Azorin-Molina, C.; Chen, D.; Tijm, S.; Baldi, M. A multi-year study of sea breezes in a Mediterranean coastal site: Alicante (Spain). Int. J. Climatol. 2011, 31, 468–486. [Google Scholar] [CrossRef]
- Huth, R.; Beck, C.; Philipp, A.; Demuzere, M.; Ustrnul, Z.; Cahynová, M.; Kyselý, J.; Tveito, O.E. Classifications of Atmospheric Circulation Patterns. Ann. N. Y. Acad. Sci. 2008, 1146, 105–152. [Google Scholar] [CrossRef] [PubMed]
- Drobinski, P.; Ducrocq, V.; Alpert, P.; Anagnostou, E.; Béranger, K.; Borga, M.; Braud, I.; Chanzy, A.; Davolio, S.; Delrieu, G.; et al. HyMeX: A 10-Year Multidisciplinary Program on the Mediterranean Water Cycle. Bull. Am. Meteorol. Soc. 2014, 95, 1063–1082. [Google Scholar] [CrossRef]
- Llasat, M.C.; Llasat-Botija, M.; Petrucci, O.; Pasqua, A.A.; Rosselló, J.; Vinet, F.; Boissier, L. Towards a database on societal impact of Mediterranean floods within the framework of the HYMEX project. Nat. Hazards Earth Syst. Sci. 2013, 13, 1337–1350. [Google Scholar] [CrossRef]
- Jansa, A.; Alpert, P.; Arbogast, P.; Buzzi, A.; Ivancan-Picek, B.; Kotroni, V.; Llasat, M.C.; Ramis, C.; Richard, E.; Romero, R.; et al. MEDEX: A general overview. Nat. Hazards Earth Syst. Sci. 2014, 14, 1965–1984. [Google Scholar] [CrossRef]
- Tveito, O.E.; Huth, R. Circulation-type classifications in Europe: Results of the COST 733 Action. Int. J. Climatol. 2016, 36, 2671–2672. [Google Scholar] [CrossRef]
- Cahynová, M.; Huth, R. Atmospheric circulation influence on climatic trends in Europe: An analysis of circulation type classifications from the COST733 catalogue. Int. J. Climatol. 2016, 36, 2743–2760. [Google Scholar] [CrossRef]
- Philipp, A.; Beck, C.; Huth, R.; Jacobeit, J. Development and comparison of circulation type classifications using the COST 733 dataset and software. Int. J. Climatol. 2016, 36, 2673–2691. [Google Scholar] [CrossRef]
- Casado, M.J.; Pastor, M.A.; Doblas-Reyes, F.J. Links between circulation types and precipitation over Spain. Phys. Chem. Earth 2010, 35, 437–447. [Google Scholar] [CrossRef]
- Casado, M.J.; Pastor, M.A. Circulation types and winter precipitation in Spain. Int. J. Climatol. 2016, 36, 2727–2742. [Google Scholar] [CrossRef]
- Cortesi, N.; Gonzalez-Hidalgo, J.C.; Trigo, R.M.; Ramos, A.M. Weather types and spatial variability of precipitation in the Iberian Peninsula. Int. J. Climatol. 2014, 34, 2661–2677. [Google Scholar] [CrossRef]
- Rasilla Álvarez, D.F.; García-Codrón, J.C. Regional and local scale atmospheric forcing upon sea level along the coast of SW Europe. Int. J. Climatol. 2016, 36, 2792–2809. [Google Scholar] [CrossRef]
- Khodayar, S.; Kalthoff, N.; Kottmeier, C. Atmospheric conditions associated with heavy precipitation events in comparison to seasonal means in the western mediterranean region. Clim. Dyn. 2018, 51, 951–967. [Google Scholar] [CrossRef]
- Fernández-Montes, S.; Seubert, S.; Rodrigo, F.S.; Rasilla Álvarez, D.F.; Hertig, E.; Esteban, P.; Philipp, A. Circulation types and extreme precipitation days in the Iberian Peninsula in the transition seasons: Spatial links and temporal changes. Atmos. Res. 2014, 138, 41–58. [Google Scholar] [CrossRef]
- Dayan, U.; Nissen, K.; Ulbrich, U. Review Article: Atmospheric conditions inducing extreme precipitation over the eastern and western Mediterranean. Nat. Hazards Earth Syst. Sci. 2015, 15, 2525–2544. [Google Scholar] [CrossRef]
- Alpert, P.; Osetinsky, I.; Ziv, B.; Shafir, H. Semi-objective classification for daily synoptic systems: Application to the eastern Mediterranean climate change. Int. J. Climatol. 2004, 24, 1001–1011. [Google Scholar] [CrossRef]
- Martín Vide, J. El Tiempo y el Clima; Rubens Editorial: Barcelona, Spain, 2003. [Google Scholar]
- Petrovic, P. Measurement Precision as a Cause of Inhomogeneity in Weather Data Time Series Measurement Precision as a cause of Inhomogeneity in Weather Data Time Series. In Proceedings of the 2nd Seminar on Homogenization of Surface Climatological Data, Budapest, Hungary, 9–13 November 1998. [Google Scholar]
- Rodríguez Ballesteros, C. Las Estaciones Termopluviométricas de la Red Climatológica de AEMET. Available online: www.divulgameteo.es (accessed on 25 March 2022).
- de Burriel Orueta, E.L.; Olcina Cantos, J. Un período fundamental para la climatología española: El “descubrimiento” de la circulación atmosférica en altitud, 1950–1980. Scr. Nova. Rev. Electrónica Geogr. Cienc. Soc. 2016, 20, 33. [Google Scholar] [CrossRef]
- García Fernández, J. El Clima en Castilla y León; Ámbito: Valladolid, Spain, 1986. [Google Scholar]
- Martín León, F. Las Gotas Frías/Danas: Ideas y Conceptos Básicos. 2003. Available online: https://www.aemet.es/documentos/es/conocermas/recursos_en_linea/publicaciones_y_estudios/estudios/dana_ext.pdf (accessed on 31 March 2022).
- Lemus-Canovas, M.; Lopez-Bustins, J.A.; Martin-Vide, J.; Royé, D. SynoptReg: An R package for computing a synoptic climate classification and a spatial regionalization of environmental data. Environ. Model. Softw. 2019, 118, 114–119. [Google Scholar] [CrossRef]
- Martín-Vide, J.; López-Bustins, J.A. The Western Mediterranean Oscillation and rainfall in the Iberian Peninsula. Int. J. Climatol. 2006, 26, 1455–1475. [Google Scholar] [CrossRef]
- Martín Vide, J. La Oscilación del Mediterráneo Occidental: Un patrón de teleconexión ad hoc para el este de la Península Ibérica. In Libro Jubilar en Homenaje al Profesor Antonio Gil Olcina; Olcina, J., Rico Amorós, A.M., Eds.; Publicaciones de la Universidad de Alicante, Servicio de Publicaciones: San Vicente del Raspeig, Spain, 2016; pp. 145–157. [Google Scholar] [CrossRef]
- Quereda Sala, J.; Montón Chiva, E. Los elementos del clima: Distribución territorial de temperaturas y precipitaciones. In Climas y Tiempos del País Valenciano; Olcina Cantos, J., Moltó Mantero, E., Eds.; Publicaciones de la Universitat d’Alacant: San Vicente del Raspeig, Spain, 2019; pp. 72–77. [Google Scholar]
- López Bustins, J.A. L’ Oscil·Lació de la Mediterrània Occidental i la Precipitació als Països Catalans; Universitat de Barcelona: Barcelona, Spain, 2007; Available online: http://hdl.handle.net/10803/1953 (accessed on 4 April 2022).
- Pino, D.; Ruiz-Bellet, J.L.; Balasch, J.C.; Romero-León, L.; Tuset, J.; Barriendos, M.; Mazon, J.; Castelltort, X. Meteorological and hydrological analysis of major floods in NE Iberian Peninsula. J. Hydrol. 2016, 541, 63–89. [Google Scholar] [CrossRef] [Green Version]
- Krichak, S.O.; Barkan, J.; Breitgand, J.S.; Gualdi, S.; Feldstein, S.B. The role of the export of tropical moisture into midlatitudes for extreme precipitation events in the Mediterranean region. Theor. Appl. Climatol. 2015, 121, 499–515. [Google Scholar] [CrossRef]
- Insua-Costa, D.; Lemus-Cánovas, M.; Miguez-Macho, G.; Llasat, M.C. Climatology and ranking of hazardous precipitation events in the western Mediterranean area. Atmos. Res. 2021, 255, 105521. [Google Scholar] [CrossRef]
- Ramos, A.M.; Cortesi, N.; Trigo, R.M.; Nieto, R.; Kumar Jaswal, A. Circulation weather types and spatial variability of daily precipitation in the Iberian Peninsula. Front. Earth Sci. 2014. [Google Scholar] [CrossRef]
- CEAM (Centro de Estudios Ambientales del Mediterráneo). Informe TSM Mediterráneo. Invierno 2022; CEAM: Valencia, Spain, 2022. [Google Scholar]
- Pastor, F.; Valiente, J.A.; Palau, J.L. Sea Surface Temperature in the Mediterranean: Trends and Spatial Patterns (1982–2016). Pure Appl. Geophys. 2018, 175, 4017–4029. [Google Scholar] [CrossRef]
- Ferreira, R.N. Cut-off lows and extreme precipitation in Eastern Spain: Current and future climate. Atmosphere 2021, 12, 835. [Google Scholar] [CrossRef]


| Step | Methodology | Specifications | |
|---|---|---|---|
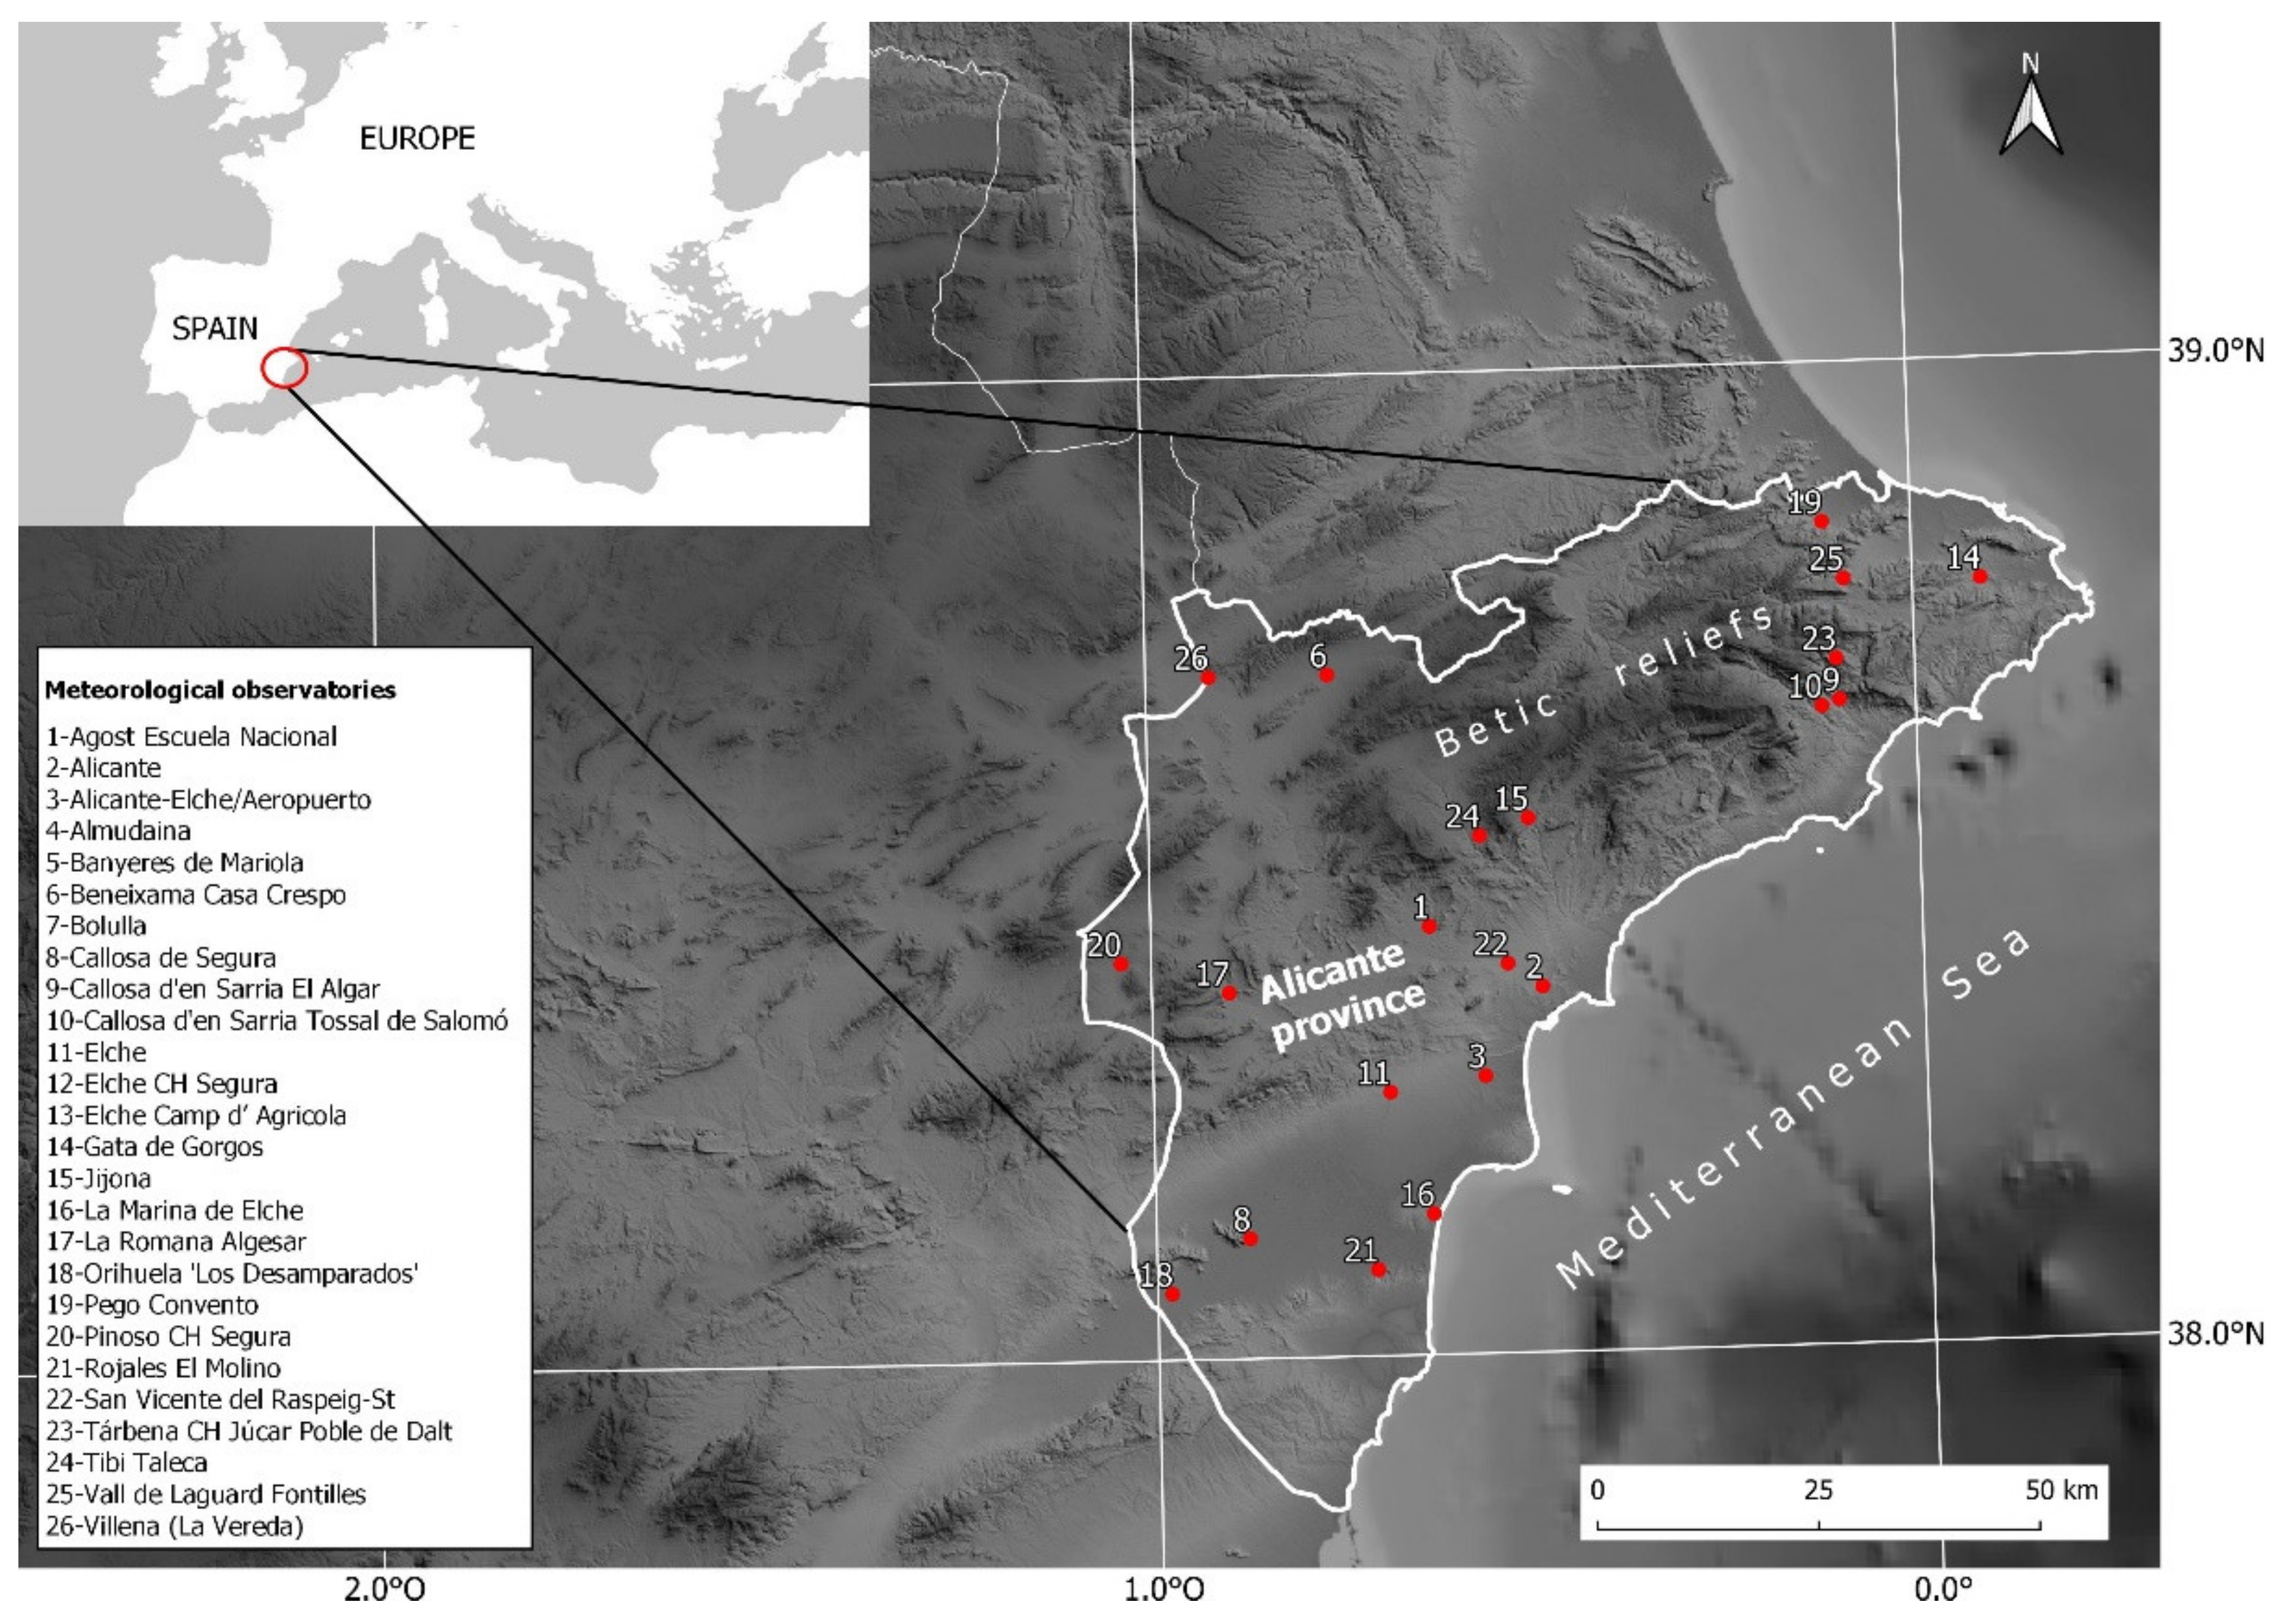
| 1 | Selection of the observatories (AEMET) containing a minimum of 95% of the complete series in the Alicante province. | 26 observatories | |
| 2 | Days with precipitation equal to or greater than 100 mm/day are filtered out. | 129 days | |
| 3 | It was established the synoptic classifications for each date, in accordance with the proposal for subjective and objective classification | Martín Vide [20] | This classification contains 16 types of synoptic classifications based upon the surface map and the topography map at 500 hPa |
| Olcina Cantos [14] | This classification is based upon the configurations that develop in the upper layers of the troposphere (300 and 500 hPa), displacement of the main air masses (mA, cP, mP, cT, mT) | ||
| J&C [23] | This classification contains 27 types, it was obtained by means of the “synoptReg” R Package | ||
| 4 | Obtaining of the daily values of the Western Mediterranean Oscillation (WeMOi) | Is the teleconnection pattern that best explains the occurrence of torrential rainfall | |
| Synoptic Situation or Weather Type | Absolute Frequencies | % |
|---|---|---|
| Advection from the E with DANA | 63 | 48.84 |
| Deep Trough | 21 | 16.28 |
| Advection from the NE with DANA | 15 | 11.63 |
| Cold-core low | 12 | 9.30 |
| Weak trough with gentle flow from the E | 9 | 6.98 |
| Advection from the E | 3 | 2.33 |
| Advection from the N | 2 | 1.55 |
| Advection from the NE | 2 | 1.55 |
| DANA to the SW | 2 | 1.55 |
| Air Mass | Synoptic Figure/Type | Nº Events | % |
|---|---|---|---|
| mA | Trough and DANA | 6 | 4.65 |
| mP | Trough and DANA with centred axis | 36 | 27.91 |
| Trough and DANA to the south of the Peninsula (Gulf of Cádiz-Alboran Sea) | 46 | 35.66 | |
| Zonal circulation | 1 | 0.78 | |
| cP | Retrograde trough | 35 | 27.13 |
| mP/cT | Mixed Trough/Crest situation | 3 | 2.33 |
| cT/mP | Mixed Trough/Crest situation | 1 | 0.78 |
| mT | Anti-cyclonal Dorsal (remaining instability in the atmosphere) | 1 | 0.78 |
| Total | 129 | 100 | |
| Weather Type | Absolute Frequency | Frequency (%) |
|---|---|---|
| E (easterly advection) | 31 | 24.03 |
| NE (north-easterly advection) | 29 | 22.48 |
| C (pure cyclonic) | 16 | 12.4 |
| CNE (north-easterly cyclonic advection) | 15 | 11.63 |
| SE (south-easterly advection) | 13 | 10.08 |
| CE (easterly cyclonic advection) | 12 | 9.3 |
| N (northerly advection) | 3 | 2.33 |
| CSE (south-easterly cyclonic advection) | 3 | 2.33 |
| A (pure anti-cyclonic) | 2 | 1.55 |
| (undetermined) | 1 | 0.78 |
| CS (southerly cyclonic advection) | 1 | 0.78 |
| ASE (south-easterly anticyclonic advection) | 1 | 0.78 |
| ANE (north-easterly anticyclonic advection) | 1 | 0.78 |
| AN (northerly anticyclonic advection) | 1 | 0.78 |
| Total | 129 | 100 |
| WT | Advection from the E with DANA | 3 | 4 | 7 | 6 | 4 | 1 | 12 | 14 | 7 | 5 | ||
| Deep trough | 2 | 2 | 2 | 2 | 1 | 3 | 2 | 2 | 4 | ||||
| Advection from the NE with DANA | 1 | 1 | 1 | 2 | 6 | 4 | |||||||
| Low | 3 | 1 | 1 | 4 | 3 | ||||||||
| Weak trough with a gentle flow from the E | 1 | 1 | 1 | 2 | 3 | 1 | |||||||
| Advection from the E | 3 | ||||||||||||
| Advection from the N | 2 | ||||||||||||
| Advection from the NE | 1 | 1 | |||||||||||
| DANA to the SW | 1 | 1 | |||||||||||
| 1 | 2 | 3 | 4 | 5 | 6 | 7 | 8 | 9 | 10 | 11 | 12 | ||
| Month | |||||||||||||
| WT | mA | 2 | 2 | 1 | 1 | ||||||||
| mP | 3 | 3 | 6 | 8 | 5 | 1 | 1 | 15 | 13 | 18 | 9 | ||
| cP | 4 | 4 | 3 | 2 | 1 | 1 | 3 | 7 | 3 | 7 | |||
| mP/cT | 1 | 1 | 1 | ||||||||||
| cT/mP | 1 | ||||||||||||
| mT | 1 | ||||||||||||
| 1 | 2 | 3 | 4 | 5 | 6 | 7 | 8 | 9 | 10 | 11 | 12 | ||
| Month | |||||||||||||
| WT | U | 1 | |||||||||||
| SE | 2 | 3 | 2 | 2 | 3 | 1 | |||||||
| NE | 3 | 1 | 2 | 1 | 2 | 1 | 2 | 6 | 7 | 4 | |||
| N | 1 | 1 | 1 | ||||||||||
| E | 2 | 2 | 1 | 1 | 2 | 1 | 10 | 5 | 3 | 4 | |||
| CSE | 1 | 1 | 1 | ||||||||||
| CS | 1 | ||||||||||||
| CNE | 4 | 1 | 2 | 1 | 3 | 1 | 3 | ||||||
| CE | 1 | 3 | 1 | 1 | 3 | 1 | 1 | 1 | |||||
| C | 1 | 2 | 1 | 1 | 1 | 2 | 5 | 3 | |||||
| ASE | 1 | ||||||||||||
| ANE | 1 | ||||||||||||
| AN | 1 | ||||||||||||
| A | 1 | 1 | |||||||||||
| 1 | 2 | 3 | 4 | 5 | 6 | 7 | 8 | 9 | 10 | 11 | 12 | ||
| Month | |||||||||||||
Publisher’s Note: MDPI stays neutral with regard to jurisdictional claims in published maps and institutional affiliations. |
© 2022 by the authors. Licensee MDPI, Basel, Switzerland. This article is an open access article distributed under the terms and conditions of the Creative Commons Attribution (CC BY) license (https://creativecommons.org/licenses/by/4.0/).
Share and Cite
Sánchez-Almodóvar, E.; Martin-Vide, J.; Olcina-Cantos, J.; Lemus-Canovas, M. Are Atmospheric Situations Now More Favourable for Heavy Rainfall in the Spanish Mediterranean? Analysis of Episodes in the Alicante Province (1981–2020). Atmosphere 2022, 13, 1410. https://doi.org/10.3390/atmos13091410
Sánchez-Almodóvar E, Martin-Vide J, Olcina-Cantos J, Lemus-Canovas M. Are Atmospheric Situations Now More Favourable for Heavy Rainfall in the Spanish Mediterranean? Analysis of Episodes in the Alicante Province (1981–2020). Atmosphere. 2022; 13(9):1410. https://doi.org/10.3390/atmos13091410
Chicago/Turabian StyleSánchez-Almodóvar, Esther, Javier Martin-Vide, Jorge Olcina-Cantos, and Marc Lemus-Canovas. 2022. "Are Atmospheric Situations Now More Favourable for Heavy Rainfall in the Spanish Mediterranean? Analysis of Episodes in the Alicante Province (1981–2020)" Atmosphere 13, no. 9: 1410. https://doi.org/10.3390/atmos13091410
APA StyleSánchez-Almodóvar, E., Martin-Vide, J., Olcina-Cantos, J., & Lemus-Canovas, M. (2022). Are Atmospheric Situations Now More Favourable for Heavy Rainfall in the Spanish Mediterranean? Analysis of Episodes in the Alicante Province (1981–2020). Atmosphere, 13(9), 1410. https://doi.org/10.3390/atmos13091410