Abstract
The way Norway is spearheading electrification in the transport sector is of global interest. In this study, we used the Norwegian Emissions from Road Vehicle Exhaust (NERVE) model, a bottom-up high-resolution traffic emission model, to calculate all emissions in Norway (2009–2020) and evaluate potential co-benefit and trade-offs of policies to target climate change mitigation, air quality and socioeconomic factors. Results for municipal data with regard to traffic growth, road network influences, vehicle composition, emissions and energy consumption are presented. Light vehicle CO emissions per kilometer have been reduced by 22% since 2009, mainly driven by an increasing bio-fuel mixing and battery electric vehicles (BEV) share. BEVs are mostly located in and around the main cities, areas with young vehicle fleets, and strong local incentives. Beneficiaries of BEVs incentives have been a subset of the population with strong economic indicators. The incentivized growth in the share of diesel-fuelled passenger vehicles has been turned, and together with Euro6 emission standards, light vehicle NOx emissions have been halved since peaking in 2014. BEVs represent an investment in emission reductions in years to come, and current sales set Norway up for an accelerated decline in all exhaust emissions despite the continual growth in traffic.
Keywords:
bottom-up emission modeling; CO2; NOx; on-road traffic; electrification; BEV; EV; bio-fuel; climate policy 1. Introduction
With increasing urgency, the need to abate climate gas emissions is finding its way into policy, with increasingly ambitious emission reduction targets to pursue [1]. The transport of passengers and goods on roads is one of the largest contributors to both air pollutants and greenhouse gases (GHG)’s emissions. In Europe, road transport contributes to 26% of total emissions. While total CO emissions have decreased by 23% since 1990, CO emissions from road transport have increased by 24% over the same period [2]. In 2019, light-duty vehicles accounted for more than half of these emissions [3]. This growth is due to increasing transport demand and the growing number of motorized vehicles with high fuel consumption, such as sport utility vehicles (SUVs) [4]. Globally, the ever-increasing need for road transport, especially in developing countries, entails an increase in emissions there in the years to come [5].
Exposure to air pollution is widely recognized as a significant health risk, is globally responsible for millions of deaths each year, and has long had regulations. In Europe, the increase in emissions of regulated pollutants (NOx, CO, PM, particle number concentration, and non-methane hydrocarbons) from road traffic have been less pronounced than for CO due to the technological improvements. Increasingly stringent emission standards have been placed on road vehicles as a result of the latest Euro 6/VI, and the new proposal for Euro 7/VII is being discussed. Therefore, despite traffic growth, several areas in Europe now see a reversal of trends [6], with air pollutant traffic emissions and concentrations going down due to technological improvements and fleet renewals [7]. Though climate and air pollutant reductions often are linked, for road traffic, past measures to reduce emissions have had few co-benefits [8]. In addition, the focus on emission mitigation from vehicles has led producers to aim for low-emission vehicles. While this has certainly reduced emissions, it has also led to a high degree of test optimization (and software cheating [9]), resulting in large discrepancies between manufacturer-given emissions and real-world observed emissions [10]. This growing difference is up to 70% for petrol-electric hybrid cars and, on average, ∼20% for a 2016 model car [11]. This leads to uncertainties in what emission reductions are actually achieved for fossil-fuelled vehicles and poses a challenge for emission calculations and evaluation of policy effectiveness.
After a slow reemergence from nearly 100 dormant years, sales of battery electric vehicles (BEV) are now rapidly taking a larger share of the global new car sales market. Indications are that 2022 could be the peak year of world internal combustion engine (ICE) road passenger transport [12]. This was recently accelerated by the new mandate by the European Union on a ban on sales of ICE cars and vans after 2035, which was signed in June 2022. BEVs emerged first as small short-range vehicles and, thereafter, have diversified into a wide range of vehicles available in the market. For the past decade, Norway has spearheaded this transition with the world’s highest BEV car park fraction. This has been achieved behind strong financial incentives [13,14] to promote both buying and using BEVs. It started in 1990, when trial periods for temporary exemption from registration tax took place. Currently, there are incentives at the national level, such as the exemption from 25% VAT on new vehicles, and others that may differ among municipalities such as the permanent use of transit lanes, reduction in company car taxes, exemption from paying car ferries fees, and exemptions or discounts for parking and toll systems [14]. Moreover, in 2007, a fiscal policy was introduced to benefit diesel cars through a registration tax differentiated Certificate of Conformity CO emissions [15]. As a consequence of such policies, Norway appeared on track to complete its stated aim of a full transition to 100% BEV sales by 2025. Similar aims are currently pursued globally by other countries and carmakers alike (e.g., [16,17]).
The current fuel transition in Norway has not come about by itself, but rather through enabling technologies and policy intervention [17]. The costs from loss of revenues from mitigation strategies to abate emissions remain a concern, and the numerous objections to BEV, mainly related to the production of the vehicle, battery and electricity [18], also add uncertainty to how beneficial such a fuel transition is for reducing total CO emissions. However, effective measures to reduce road transport emissions remain an essential task in reducing air pollution and achieving GHG reduction targets [19,20]. Norway has had a multi-pronged approach to reducing its on-road emissions through fuel efficiency, traffic reduction, bio-fuels and electrification [21]. Each of these policies has trade-offs and co-benefits that should be evaluated. However, there exists little documentation on the details of the implications of the different strategies pursued by Norwegian policymakers. Furthermore, local effects and potential trade-offs and co-benefits between both air quality and socioeconomic implications are poorly documented. In order to achieve this, proper methods need to be used, which, in addition, allow for integrated approaches to tackle both climate change and air pollution [22,23,24].
There exist a wide range of methods to estimate emissions, largely dependent on their purpose. Our use of detailed bottom-up emissions offer great opportunities. It allows identifying which measures have a stronger impact and establishing links between emissions and specific policies implemented at the local level or even to socioeconomic factors. Similar bottom-up methods have been used worldwide to investigate both air pollutants and GHGs from road traffic on a local scale (e.g., [25,26,27,28]). However, there are uncertainties in large-scale bottom-up inventories, as they are sensitive to the initial assumptions of emission factors and activity data. On the other hand, while offering little detail, national-scale inventories based on fuel sales provide a robust estimate to compare national numbers. Reports of national emissions are used for regulatory purposes as part of international agreements (e.g., the Paris Agreement on climate change) or directives (e.g., National Emission reduction Commitments, NEC-Directive). Sector-specific national emissions of both GHGs and air pollutants are reported separately to the United Nations Framework Convention on Climate Change (UNFCCC) and the Convention on Long-Range Transboundary Air Pollution (CLRTAP), respectively. Member states select input data and methods for each sector following existing guidelines and recommendations (e.g., [29,30]).
Beyond national scale resolution, emission maps are produced by several independent groups such as CAMS [31] and EDGAR [32]. Typically reliant on down-scaling by proxy national emissions, these give little insight into processes and thus are not able to answer questions on local policy interventions that include local scenarios and conditions. The estimation of emissions based on bottom-up approaches, as applied in this study, relies on combining activity data at high spatial resolution with emission factors in a way that represents the emission processes and has the advantage of keeping the resolution of the activity data [33]. Air quality has always been a local concern, and thus, high-resolution emissions have always been a requirement. Thus far, there has been limited demand for high-resolution CO emission inventories, but recently, local authorities have started to set targets for their CO emissions, and they need more details on their emissions [34]. Moreover, highly detailed information is needed to predict GHGs emissions and develop efficient mitigation policies, where the lack of detailed GHG data represents an important limitation of such studies [35].
The aim of our study is two-fold, (i) evaluate the changes in traffic emissions in relation to different policy measures implemented over time based on highly detailed data, and (ii) assess the results in relation to the main influencing factors and geographical distribution. In addition, the highly detailed traffic volumes, down to the smallest road links made available through this study, are the first of their kind to cover Norway. We present novel, highly detailed data and emissions from the Norwegian Emissions from Road Vehicle Exhaust (NERVE) bottom-up traffic emission model and show decomposed reasons for and geographical differences in on-road emission changes. We first present the NERVE bottom-up traffic emission model and the analysis of the used input data (Section 2). Thereafter, the results are included and discussed (Section 3) in relation to the most relevant factors affecting air pollutants and CO emissions from on-road transport and their trends and spatial heterogeneity in relation to policy interventions and transport electrification. Section 4 summarises the main conclusions from the study.
2. Model and Input Data
The NERVE model was originally designed to calculate climate gas emissions from road transport in Norwegian municipalities [36]. It is an open source model distributed under a general public license (GNU). More recent additions to the model include diversification to calculate air quality components, hourly output on road links, and an update of the Handbook Emission Factors for Road Transport (HBEFA) version 4.1 emission factors, which are presented here. NERVE is based on highly detailed input data on roads, vehicles and emission factors for Norway. The type of input data is, for the most part, readily available in other countries. Thus, the NERVE model has also been adapted to estimate traffic emissions for Abu Dhabi Emirates [37], urban areas abroad such as Dublin, Ireland [38], and currently also in Warsaw, Poland. It has also been used to investigate the effects of environmental speed limits on emissions [39], to relate tire wear particles and CO emissions [40] for global applications, and in numerous local air quality assessments [41,42,43]. This study is based on the Norwegian input data, which are described in Figure 1 and in the following sections.
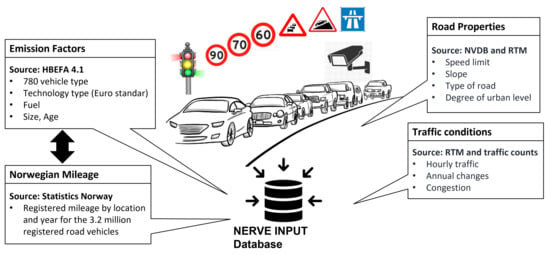
Figure 1.
Schematic description of the input data that goes into the NERVE model, their sources and level of detail.
2.1. Emission Factors
The emission factors (EF) used in the NERVE model are from HBEFA, which is a comprehensive EF database for different types of vehicles under different driving conditions. NERVE uses HBEFA version 4.1 [44]. EFs in HBEFA are produced for all relevant engine-related emissions based on collaboration with mainly north European states. Warm engine emissions are based on emission measurements under real-world driving cycles from the Passenger Car and Heavy Duty Emission Model (PHEM) model [45]. Cold emissions are in HBEFA available per start and added to warm engine emissions (see Section 3.1). Extracting HBEFA emission factors requires purchasing licensed software.
The emission factors in HBEFA version 4.1 covers all vehicle categories; passenger cars (PC), Light Commercial Vehicles (LCV), buses and Heavy Duty Vehicles (HDV). Each vehicle category consists of several vehicle segments, which classify vehicles based on their most relevant properties affecting emissions, i.e., weight, emission standard (Euro Class) and engine fuel(s) [44]. In our study, about 780 vehicle segments are considered. Emissions from each vehicle segment vary with driving conditions; thus, our HBEFA extraction consists of around 1440 EFs for each vehicle segment, which represent different driving conditions defined by signed speeds, inclination, congestion levels and road types (including separation between urban and rural roads).
Figure 2 shows the CO emission per kilometer of a Euro6 diesel PC for each of the driving conditions (free flow, heavy, saturated, stop and go, and stop and go2) under varying speeds and slopes. CO EFs of the vehicle in Figure 2 vary from about 80 to 450 g km. The highest emission factors are obtained for heavy congestion (St+Go2), where the driving cycle involves extensive acceleration and braking, which increase emissions from a baseline of about 80 g km to above 300 g km for all other variables. Road gradient, here given as a two-way slope (i.e., a kilometer with a slope of 2% first driven up, then down), is the second most influencing factor, along with signed speed and road type, which also have a significant influence on emissions. At the level of detail to which NERVE is built, it is crucial to have a well-defined road network so that the actual traffic conditions of the vehicles are well matched and accounted for. This level of detail is also necessary to capture geographical differences in emissions.
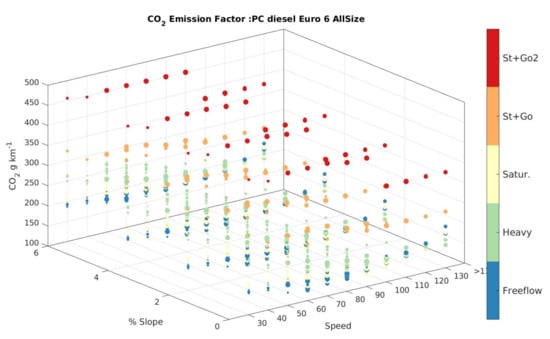
Figure 2.
Example of CO EFs for a diesel-fuelled passenger vehicle with Euro 6 emissions standards. The colors of the dots refer to different congestion levels. We identified 12 HBEFA road types ranging from access to motorways, which are separated by the size of each dot.
2.2. Road Properties and Traffic Conditions
While the Norwegian road network is available from a number of sources, the traffic on them is less available. Further details required for precise emission calculations such as declination and congestion are, to our knowledge, not available from any other source. Figure 3 shows the road network in Norway split into European roads, regional roads, and urban roads. The four biggest urban areas are also shown in a higher level of detail, where we have highlighted different road features that influence emissions. The road network data rely, for the most part, on the Norwegian road authorities database (NVDB), which contains virtually all significant roads in Norway. In NVDB, each road link is defined as a geolocated object with certain attributes and an ID tag. The relevant attributes for modeling traffic emissions are the curvature, inclination, speed limit, the type of road and number of lanes.
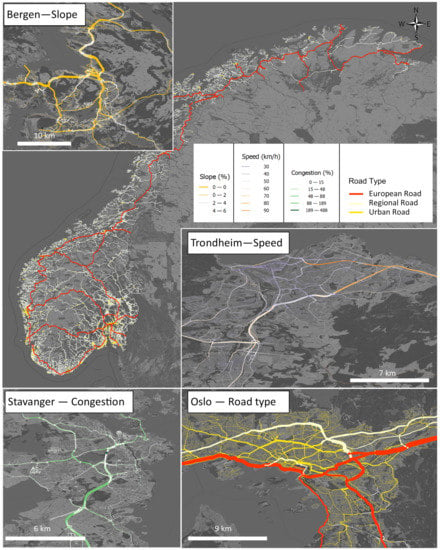
Figure 3.
Road network in Norway split into types of roads, including European, regional, and urban roads. The magnification of the cities indicates the road network where the width of each road link reflects the annual daily traffic (ADT), whereas the color indicates different variables that affect traffic emissions, e.g., the Bergen network is colored based on the slope, Trondheim on the speed limit, Stavanger according to the congestion level and Oslo based on the road type.
The traffic on the NVDB roads is built up of five regional traffic modeling results obtained with the Norwegian Regional Transport Model (RTM). The RTM model is a four-step transport model, as described in [46]. It is widely used by authorities, industry, and research (e.g., [47,48]). While the model for each region is unique, they are built on the same code and give similar results where they overlap. An extensive validation against traffic counting was performed and some local corrections were applied [36]. The resulting annual average daily traffic (ADT) is in Figure 3 represented by the width of each road. Transportation of goods and route buses are input independently [49].
A disadvantage of RTM is that it does not produce ADT for all the smallest roads. A portion of the traffic in each of the 14,000 small area districts across Norway are in RTM described on artificial connector roads. These connectors are straight roads from the geometric center to the nearest intersection. Thus, the driving distances on these roads are not properly represented, and there are no good alternative sources of data for traffic on these roads. In this set of traffic data, we have placed the traffic of the artificial roads back on the road network, giving each of the empty roads in the network the connector links ADT. The traffic on the smallest roads represents about 5% of the total ADT and 18% of the total driving distance for light vehicles (PC and LDV) when laid out on the road network by this method.
In each of the subplots of Figure 3, the thickness of the line of each road is proportional to the ADT. Each trafficked road segment from RTM is matched to a HBEFA corresponding road type based on speed, city (all Norway map) and type (details also in [36]). Road properties are important input as, for most vehicles, emissions can vary by a factor of four or more between different driving conditions. In Oslo, the roads are colored by main type (Figure 3), where the European and regional roads have about 20% of the total traffic whilst making up less than 1% of the total road network. The main roads in Bergen are relatively flat (Figure 3), and so while the road network and terrain have mostly steep slopes, a significant portion of the traffic is on flat roads. Inside Trondheim, the signed speed is highlighted by color, whereas in most cases, the largest roads have a high speed limit. The congestion in Stavanger is perhaps the most relevant feature for determining the HBEFA emission factor for these roads. Congestion varies, and even densely congested roads will also have a portion of uncongested traffic. For congestion, the travel time in the morning (7:00–9:00) and evening rush (15:00–17:00) is in NERVE compared to that on an uncongested travel time and presented as % delay. Based on a sample of roads with congestion, counting indicates that about 40% of the traffic is during rush hour. Based on the % congestion, NERVE places a fraction up to 40% in ‘stop+go’ situations. Only a limited amount of roads have rush hour congestion from RTM, mainly in and around the four largest cities. As a result, slightly less than 1% of vehicle kilometers driven in Norway are in a state of congestion.
2.3. Fleet Composition and Mileage
NERVE relies on the Norwegian vehicle registry to determine which vehicle technologies are present on each road. The vehicle registry is annually produced by Statistics Norway and contains the registered address of each vehicle along with the bi-annual periodic control readings of odometer driving distance. The driving distances in the interim years are filled in the model by a simplistic assumption, and for new vehicles, the model bases itself on the driving distances of newly bought vehicles in previous years. A fleet composition dataset at the municipal level and per year was purchased from Statistics Norway, which follows the HBEFA as closely as possible in terms of type, vehicle weight, Euro emission standard, and engine fuel(s). This provides an annual driving-distance-weighted fleet composition on the vehicle detail level for each municipality in Norway, which, in addition, closely resembles that of HBEFA. For all hybrid electric vehicles, a constant 20% of the driving is assumed as electric.
Figure 4 shows the Norwegian vehicle Euro emission standard mix from 2009 to 2020 in terms of the fraction of kilometers driven for each of the Euro categories. The Euro 6/VI standard (white in Figure 4) introduced in 2014 is quickly taking over. This process is fastest for heavy vehicles. Buses and HDV have the shortest average age of 4.5 and 4.6 years, respectively. Over the 13-year period, this represents nearly a halving of the average age of buses, and in just 6 years after being introduced, approximately 70% of vehicles are Euro VI in 2020.
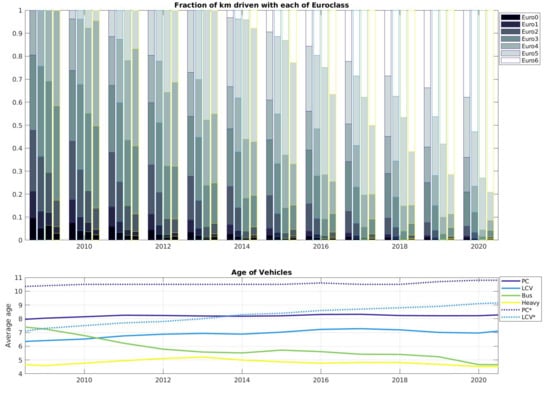
Figure 4.
(Top): The fraction of the total distance driven by each vehicle class with different emission standards (Euro class 0–6) in separate years. The edge of each bar is colored by the vehicle class. Colors correspond to the bottom plot. (Bottom): Each line is the average of each vehicle class over time, and the border colors of the bars in the upper panel correspond to the vehicle class.
On the other hand, Norway has a slightly aged PC and LCV vehicle fleet, with an average age of 8.3 and 7.2 years in 2021 and 2022, respectively (Figure 4). However, this number is, as for the buses and HDV, weighted by the driving distance. The average age is about 2.5 years older based on the number of registered vehicles (dotted lines in Figure 4). This shows that newer vehicles of this type are driven significantly more than older vehicles.
NERVE assumes that vehicles operate out of their registered municipality. Thus, to account for the mobility across municipalities and obtain a vehicle mix on each road, an RTM simulation was performed to separate out the trips by their origin and the driving distance in each municipality. Accordingly, it was possible to use a mix of vehicles from the municipalities where the trip originated. Then, for each municipality, the traffic volume on the roads is comprised of a weighted part of several municipalities. In the case of leased or company vehicles, this may not be the case, but in both instances, there is limited data to correct this assumption for, and as a general rule, these data will be sufficient to describe the municipality vehicle fleet. As road traffic volume is determined by RTM, an error in this assumption will only influence the vehicle composition, and thus, combining the two sets of data gives a more accurate result.
2.4. Traffic Scaling Factors
The five RTM models were run to produce an ADT on all roads for the year of 2016 (details in Section 2.2). For scaling annual traffic to hourly traffic, NERVE uses preset scales for week of the year, weekday and hour of the day, based on traffic counting and the Norwegian holiday calendar. For changes in traffic over the years, NERVE relies on changes in traffic counting. An increasing amount of traffic counters are placed along predominantly larger Norwegian roads.
Each traffic count requires a coverage of 80% in two consecutive years. A filtering is conducted if there is an increase of more than 50% or reduction below 80%. The latter was set low due to large reductions in airport and border areas during the pandemic. Short vehicle counts were used to scale light traffic, and long vehicles (>5.6 m) to scale heavy. Annual changes in ADT were made individually for each municipality if the criteria of at least seven traffic counts were met, otherwise, it was conducted on a regional scale. This is calculated by all the counting stations that are not used in another individual municipality within the county. The number of municipalities that have individual calculations varies with available counts. For 2020, 47 of 356 municipalities had an individual index. As these are generally the largest municipalities, they cover about 55% of the total traffic volume.
The year-to-year change in traffic as a whole is shown in Figure 5, as measured by different metrics. After the recovery from the global financial crisis in 2009, traffic volume has increased every year until 2020 by all available metrics. The traffic index is published by Norwegian Road Authorities and has, since 2003, been separated into short and long vehicles. The index is based on traffic counts, and the short index should, therefore, in theory, be similar to the national index of NERVE (green line), which is based on roughly the same traffic counts. The National index of NERVE resembles the total driving distance of the vehicle registry. The exact reason for this is unknown, as the method for the traffic index is poorly documented.
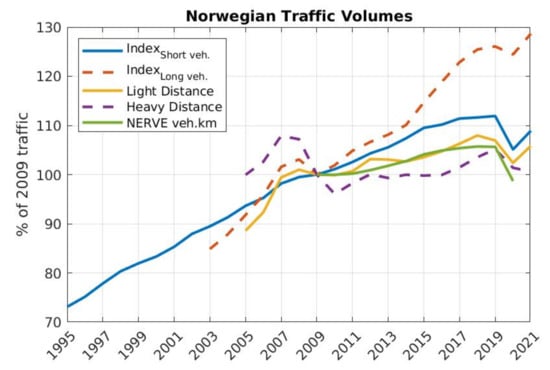
Figure 5.
Annual volume of traffic by different metrics normalized to 2009. The Norwegian road traffic index (Index) is based on traffic counts and is shown separated for vehicles longer than 5.6 m (dashed red line) and shorter vehicles (blue line). Light (yellow line) and heavy (dashed purple line). Distances are primarily based on odometer readings and are the total of all Norwegian registered vehicles. The green line shows the annual change in driving distance in the NERVE model (used for both light and heavy vehicles).
2.5. The NERVE Model
The core of the NERVE model is, as with any bottom-up emission model, to connect the activity data with the emission factors. Once the input data are in the corresponding formats, calculations are relatively straight-forward. The basic calculation unit is the road-link, but vehicle distribution is on the scale of the 356 municipalities in Norway. To obtain emissions, NERVE first collects all road-links and the total traffic within the boundaries of each municipality (k) calculated as:
where D is the length of each road-link (r) and the annual daily traffic (ADT) is the average traffic over a year. N is the averaging period. DD is then the total distance driven within the domain of municipality k. DD is calculated separately for each of the traffic classes “Light = L”, “Heavy = H” and “Buses = B”. Each traffic class is then separated into segments by the road vehicle driving distance data:
where N and Ntot are the amounts, and F and are the driving distances of the individual and total vehicles, respectively, in a given municipality. F is the fraction of vehicle km of a given segment on the road expressed as the fraction of its total traffic class for each municipality.
To obtain the traffic on the roads of a municipality F, the traffic exchange with other municipalities is used. This matrix describes the internal (I) and external (E) traffic based on the origin of the traffic:
With this traffic exchange, F is the weighted mix of vehicles on the roads of each municipality. If there is no exchange of traffic with the outside (I) and F = F.
NERVE uses an HBEFA dataset extraction that contains 1440 combinations of speed (V), road type (T), slope (S), urbanization (U), and finally, congestion level (C). For each combination of these properties, the emission factor for a specific mix of vehicles can be found on any scale from individual road link, municipality, county or national. For a municipality with a given set of roads, it is calculated as:
With the exception of congestion, the parameters determining the emission factor are static properties of the road. Congestion is from the RTM models and represented as the morning (07:00–09:00) and afternoon (15:00–17:00) rush hour delay (see Section 2.2 and Figure 4). The roads with a rush hour delay are assumed to have congestion. The volume of traffic that occurs during these times is assumed to be affected by congestion.
3. Emission Results and Discussion
The form of the input data used in this study has limited or restricted access to the public, and the statistical presentation and interpretation of these data are of interest. Holistic traffic data, relatively consistent with driving length, to our knowledge, has not previously been made available, and HBEFA and vehicle data need to be bought. In this section, we mainly describe the results of the emission model and discuss the implications from Norwegian policies and emission distributions. While NERVE produces emissions for all available compounds of HBEFA, we have chosen to focus the results on NOx, CO and . The latter is the only one for which there exists EFs for BEVs. However, it is just an average over all driving situations, with no resolution on speed or slope. According to the documentation from HBEFA, it is primarily used to calculate well-to-wheel emission factors.
3.1. Cold-Start Emissions
Cold start emissions are available in HBEFA as emissions per start to be added to hot emissions. Cold start emissions are a function of engine temperature at start, ambient temperature, and length of trip and represent a gradual emission decline over time as the engine reaches optimal working temperatures. To quantify cold start emissions, NERVE uses the HBEFA combination of trip lengths and parking times for Norway. This was coupled with the vehicle fleets of each municipality and daily temperatures from observations. Cold start emissions were calculated for each municipality for equal assumptions of trip length and parking time following the HBEFA data for Norway. Total emissions in a municipality were calculated and added to road link annual emissions as a % increase in each municipality. HBEFA only has cold start emission factors and assumptions for light vehicles, and so only this is considered.
A sensitivity study was carried out varying one of the input parameters at the time (Figure 6), the results of which can be summarized as:
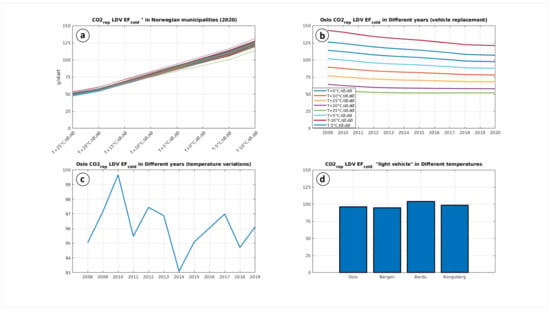
Figure 6.
(a) Cold start emissions in different municipalities at different temperatures. (b) The 2009–2020 cold start emissions in different years. (c) Cold start emissions for temperatures in different years. (d) Cold start emissions in different regions of Norway.
- At all temperatures, the inter-municipal differences in cold start emissions are about 10% (Figure 6a), as a result of vehicle differences.
- There is about a 15% decline in emissions from cold start between 2009 and 2020 due to renewed vehicles (Figure 6b).
- The difference in emissions between the coldest and the warmest year in Oslo is about 20% (Figure 6c).
- The same-year difference in emissions for the same vehicle mix in different regions of Norway is less than 10% (Figure 6d).
There are thus some geographic variances in the cold start emissions. The differences are from the region of Norway, temperature, fleet composition and potentially also between average trip length and parking time. Overall, the spatial variations are only important if emissions from cold starts constitute a large part of emissions. The share of total emissions that stems from cold starts varies significantly between compounds (Table 1)—from more than 90% for hydrocarbons to about 5% for NOx and CO. However, there is increasing evidence that NOx emissions increase with lower temperature, which is accounted for in HBEFA [50]. The evidence is especially strong for Euro 6/VI emission standard vehicles (see Figure 7 in [44]). This increase in emissions is the result of suboptimal functioning of cleaning systems for these vehicles during cold temperatures.

Table 1.
Total Norwegian light vehicle emissions from cold and warm engines from the NERVE model.
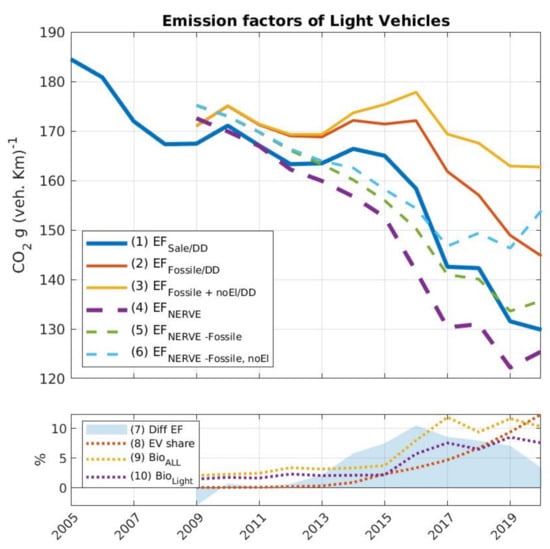
Figure 7.
(Top): Evolution of emission factors of light vehicles based on different metrics. (1) Official reported emissions based on fuel sales and actual driving distances. (2) Same as (1) but including non-fossil CO emissions from bio-fuels. (3) Same as (2) but only using non-electric driving distance (DD). (4–6) Same as 1–3 but based on NERVE data. (Bottom): (7) The % difference between official reported emissions (1) and NERVE (4). (8) The % of energy originated from BEVs. (9–10) The % of energy in combustion, originating from bio-fuels.
3.2. Benchmarking NERVE Emissions
Emissions estimated at the road link are hard to validate at the individual level. However, several NO and pollution level simulations have been performed for Norwegian cities where the NERVE model was used to produce traffic emissions as input data. The comparison between model results for NO, for which the main source in Norwegian cities is traffic, and observations have showed an hourly correlation of 0.5 to 0.8 without a clear bias [41,42].
At the national level, it is possible to compare NERVE CO emissions to fuel-sales-derived emissions, which are used for the official reporting of emissions to the United Nations Framework Convention on Climate Change (UNFCCC). The almost direct relation between CO and fuel sales makes it a robust estimate on a national level. Whilst there should be relatively low uncertainty in the amount of fuel sold at the national level, there are some uncertainties regarding the engine where the fuel is combusted. Both diesel and petrol are multipurpose fuels used in a wide range of engines, which also are not on-road vehicles. Among these are motorcycles, boats and yachts, snowmobiles, lawnmowers, chainsaws and other small and industrial machines. Moreover, part of the fuel sold in Norway can be combusted in neighboring countries and vice versa. In sum, these factors make the CO emissions from road traffic derived from fuel sales an indirect estimate, which, with the above uncertainties, offer a very robust estimate of emissions at the national level.
Emissions and derived EFs obtained with the NERVE model are compared to fuel-sales-based estimates. In Figure 7, the solid lines (1–3) represent EFs derived from fuel sales emissions produced by dividing total emissions from light vehicles by the driving distance of such vehicles (see Figure 4), whereas the dashed lines (4–6) represent the estimated EFs from the NERVE model. Both EFs decrease from around 170 g km in 2009 to about 130 g km in 2020. In the period between 2009 and 2012, the difference between the two sets of EFs is minimal before increasing to about 10% in 2016 (Figure 7 bottom). Figure 7 also includes two series of EFs, which are obtained by adjusting for the effect of bio-fuels (2 and 5), and the combined effect of bio-fuels and electric vehicles (3 and 6). The difference between the adjusted EFs and the total vehicle fleet EFs indicates the main cause of the reduction in emission factors.
Both the NERVE and fuel-sales-derived EFs have the same share of electric vehicles in their fleet but somewhat different bio-fuel mix for light vehicles (Figure 7 bottom). The reason is that there is a difference between the % of bio-fuel mixed in petrol and diesel. NERVE has a somewhat higher share of emissions coming from petrol, where the bio-mix is significantly lower. In the time period investigated here, the decrease in emissions per kilometer can be due to; (1) more fuel-efficient vehicles; (2) bio-fuels mix; (3) increase in electric vehicle shares. Relative to 2009, 2020 is the first year where electric vehicles are the main cause of lowering EFs in Norway, with a decrease slightly above 12%, whereas bio-fuels represent an 8–10% decrease, and more fuel-efficient vehicles contributed to 5% lower EFs.
Emissions from traffic have steadily grown since 1990 (Figure 8), and the main driver is the annual increase in traffic volume up to 2020. As a result, a near doubling of vehicle kilometers has occurred on Norwegian roads over the last 30-year period (Figure 5). Since 2009, CO emissions have stabilized or been slightly reduced, mainly due to the increase in bio-fuels and electric vehicle shares. Emissions in NERVE respond differently to all variables, such as driving conditions and the changes in the fleet composition. Emissions from the combustion of bio-fuels, such as bio-diesel, bio-ethanol or the different blends in diesel and gasoline, largely vary with the percentage of added bio-fuel, fuel type, and the type of vehicle [51]. HBEFA does not include EFs for bio-fuel nor for their blends, and to our knowledge, no other comprehensive EF database exists that covers all the variables included in the NERVE model. Therefore, whilst the bio-fuel mix is applied at the national scale, only CO emissions are considered to be influenced by the blend of bio-fuels in gasoline and diesel, and all other emission compounds are considered to be unaffected. This may add some uncertainties, especially regarding the production of aldehydes from the combustion of alcohol fuels blended in gasoline [52] or in relation to lower CO and higher NOx emissions from bio-diesel than from conventional diesel [51].
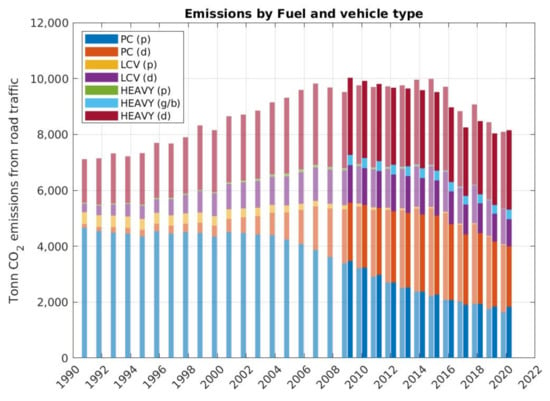
Figure 8.
Bars: Emission by type of vehicle. Light shaded bars are based on reported fuel-sales-derived estimates. Solid bars (right shifted) are from the NERVE model. p: petrol, d: diesel, g: gas, b: buses. In this representation, NERVE does not separate LCV fuel but separates buses where gas is separated for heavy vehicles in official statistics.
In 2020, the COVID19 pandemic broke out, and severe travel restrictions were put on the population in the spring of 2020. The impact on local traffic was initially similar across Norway, and at the end of the year, there was a 6% drop in light traffic (Figure 5). Locally, the changes in traffic played out very differently for municipalities. With a summer dominated by domestic tourism, July saw an increase in overall traffic, whereas most of the rest of the year was below 2019 levels [53]. However, in several municipalities on the border with Sweden and in the one where Norway’s main airport is located, the drop in traffic was above 40% in 2020. The small increase in EF in the model for 2020 is a result of the fact that the driving distance for PC was reduced more than that of LCV, and given that the latter has a higher emission factor, the resulting EF is higher.
3.3. Influencing Factors of Emissions
While it is not directly possible to disentangle each component that determines road emissions based on NERVE, Figure 9 shows scenarios where we changed a single component of road or vehicles at the same time. This serves to illustrate the relative influence of each factor on CO and NOx emissions, along with fuel consumption. This enables an evaluation of the sensitivity to change and the relative importance of each factor. The vehicle changes are also a good indicator of how emissions may change in going forward.
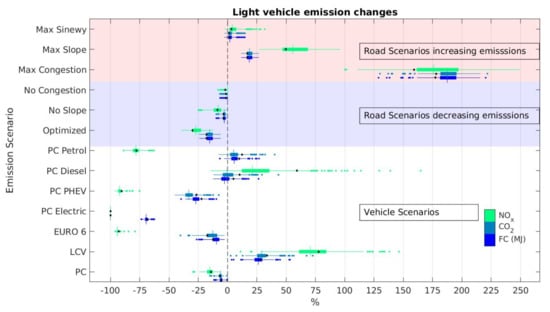
Figure 9.
Changes from 2020 emissions, under different scenarios, for CO, NOx and energy consumption (MJ). Each data point represents a municipality, and the black dot, the mean weighted by municipal driving distance. Scenarios: “Max Sinewy”, we changed all roads in Norway to the smallest type of road the sign speed would allow and chose sinewy roads where HBEFA had its own category for those. “Max Slope” we changed all roads into ±6% declination roads. “Max Congestion” we placed all traffic in category “Stop+Go2”. “No Congestion” we removed all congestion. “No Slope” we made all roads flat. “Optimized” assumes to be a rural motorway with a speed limit of 60 km/h, for which most vehicles have their lowest emission factors in HBEFA. “PC Petrol”: all light traffic is petrol PCs, retaining the age/size distribution. “PC Diesel”: all light traffic is diesel PCs, retaining the age/size distribution. “PC Electric”: all light traffic is BEVs. “Euro6”: all light traffic is Euro6, retaining fuel. “LCV”: all light traffic is LCVs, retaining fuel and age. “PC”: all light traffic is PCs, retaining fuel and age.
In the scenarios marked with red and blue background in Figure 9, we made changes to the driving conditions while retaining the distribution of the vehicle fleet composition. Numbers for national average emission change are listed in Table 2. Emissions directly increase with road curvature, increase in slopes and notably with congestion levels (red background scenarios). The “optimized” scenario produces the lowest emissions, and if all traffic in Norway were driven under these driving conditions, CO and NOx emissions would be 18% and 29% lower than those calculated for 2020, respectively. Of the scenarios, the potentially strongest influence on emission factor from HBEFA comes from driving on congested roads (“max congested”). However, in reality, the slope of the road has more influence in most Norwegian municipalities than congestion. In HBEFA, the lowest emission factors are generally for rural roads, and there is a trade-off between larger road types (lowers emissions) and speed that has a u-shaped emission factor curve bottoming around 60 km h (see Figure 2 for details). Thus, to lower emissions, there is potential in making better roads, but as most of the emission increases from road conditions come from speed and road size properties not related to congestion and slope, the feasibility of any major changes is doubtful.

Table 2.
Total emission change for Norway. From Figure 9.
At the bottom in Figure 9, the emission changes are induced by introducing changes in the vehicle fleet composition while retaining the actual driving conditions. For NOx, most vehicle scenarios would reduce emissions to below 75%. The exceptions are changing all vehicles to LCV (94% diesel) and all PC running on diesel. Upgrading to Euro6 filtering systems would efficiently reduce all NOx emissions to less than a quarter of 2020 levels. Plug-in Hybrid Electric vehicles (PHEV) are also almost exclusively petrol-electric in Norway and, therefore, have limited NOx emissions (−90%). All of these indicate that any renewal of the vehicle fleet, independent of fuel, would make emissions in the years to come significantly lower.
PC Petrol vehicles have, on average, 12% higher emissions of CO than the average light vehicle, whereas PC diesel have slightly lower emissions (−10%). The average vehicle registered as LCV has significantly higher emissions (33%). In NERVE, PHEV are driven 20% of the time on an electric engine but outperform that in CO emissions, emitting 26% less than the average light vehicle. The EURO 6 scenario can be seen as renewing all vehicles in Norway, retaining the fuel composition, and the emissions reduction for CO would be 17%.
Energy consumption and CO emissions are very similar across all scenarios (Figure 9), with one important exception, i.e., all BEV scenarios. As in this study, only direct emissions are taken into account, CO goes to zero, but total energy consumption drops by 68%. The reason for this is mainly ICE heat loss in combustion engines (e.g., [54,55]). This is one largely overlooked aspect of BEVs that are marketed predominantly as climate-friendly. They are very energy efficient and cost-efficient, at least for most of Europe at least.
3.4. Changes in NOx Emissions Per Municipality
The for light vehicles in all Norwegian municipalities for a given year is shown in Figure 10 for 2009, 2014 and 2020. As each municipality has a local vehicle fleet consisting of an exchange of traffic with surrounding municipalities, it is representative of the traffic inside the municipality rather than the traffic of the vehicles registered there. The properties of the road network and congestion levels have important influences.
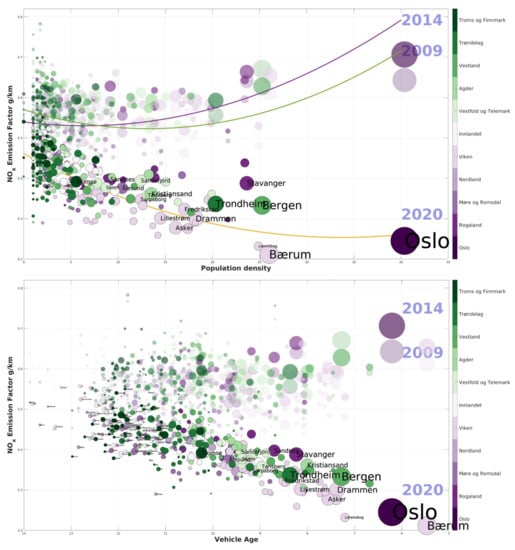
Figure 10.
Each municipality is represented by a circle, the size of which corresponds to the number of vehicles registered, and the color represents the 11 regions of Norway. Some selected municipality names are also rendered. (Top): NOx Emission factors in each municipality vs. the corresponding population density in 2020. The bubble size is proportional to the number of vehicles registered in each municipality and colored by region. Data shown for 3 years with increasing opacity 2009, 2014, and 2020 along with fitted second-order polynomial lines. (Bottom): NOx Emission factors in each municipality vs. the average vehicle age in 2020.
In 2007, a fiscal policy was introduced to benefit diesel cars. The new policy had a Certificate of Conformity registration tax for differentiated CO emissions [15]. Authorities also made announcements appealing to the public to use diesel versus petrol vehicles. Thus, the following years saw a fast shift in new car sales and, thereafter, in the share of diesel vehicles on the road. Similar policies were introduced around the same time across Europe [8]. As a consequence, diesel vehicle share growth escalated to a peak in 2015, with no apparent effect on the emission factors, and CO emissions from PC kept increasing (lines 1 and 4 in Figure 7 and Figure 8).
The largest and most densely populated urban center is Oslo. Several of the larger surrounding municipalities follow in population density along with the other main cities in Norway. In 2009, there was a positive relation between population density and the NOx emission factor (fitted green line in Figure 10). The main reason for this is that these areas have congestion, for which NOx emissions are more sensitive than other compounds (see Figure 9). Following sales, an increased diesel share increases NOx emissions in the most densely populated areas. In 2014, NOx emission factors were lower than those in 2009 in low population density areas, presumably as a result of new vehicles being introduced predominantly near the urban centers and used PCs (predominantly petrol vehicles) being sold as second-hand vehicles outside metropolitan areas. The effect of the policy thus led to increased NOx emission in urban areas, resulting in continued exceedance of the NO limit value in areas where many people live. Conversely, in 2020, high populated areas exhibited the lowest NOx EF in Norway, whereas the highest were observed in low-populated areas (fitted yellow line in Figure 10). This is because all new vehicles sold today have lower NOx emissions than any old vehicles.
3.5. Implications of the Electrification
The transition from an electric PC share below 1% in 2014 to above 20% in 2020 has not come by itself. In a similar way to the diesel financial incentives implemented in 2007, a fiscal policy to promote the purchase and use of BEVs has been developed in recent last years. It started in 1990 with trial periods for a temporary exemption from registration tax, and currently, the incentives include exemption from 25% VAT on new vehicles, permanent use of transit lanes, reduction in company car taxes, exemption from paying car ferry fees, and exemption or discounts from parking and toll systems [14]. Several years of incentives have resulted in reaching a 84% share of BEVs sales in Norway in January 2022.
In addition to reducing local direct CO and air pollutant emissions, the electrical engine is highly efficient and able to utilize virtually all available energy for propulsion. This is unlike combustion engines, where around 65–72% of the energy is lost due to heat losses, friction and pumping losses [54]. The energy consumption per kilometer derived by the NERVE model reflects this aspect. BEVs use about a third of the energy on the road as combustion vehicles. By a full transition to BEV, the 32 TWh that was used in road traffic in Norway could be reduced to about 12 TWh. For comparison, the total residential energy consumption in Norway was 50.6 TWh in 2020 [56]. Without being directly transferable, an energy saving of 20 TWh is thus significant.
Even though the use of BEVs entails several advantages, there have been controversies regarding their overall sustainability. Environmental equity concerns have been pointed out in light of BEV’s accessibility by higher socioeconomic consumers [57]. Based on the data in NERVE, it is not possible to directly link economic data to car ownership on an individual vehicle basis. However, on a municipality level, there are several economic indicators that can be coupled with the data from NERVE. One example is the household income decile, while others include household income, Gini coefficient and other private wealth parameters [56]. Figure 11 shows the share of the population with income in the top two income deciles and the BEV share of the same municipality. Figure 11 and the data for 2020 in Figure 10 share several features.
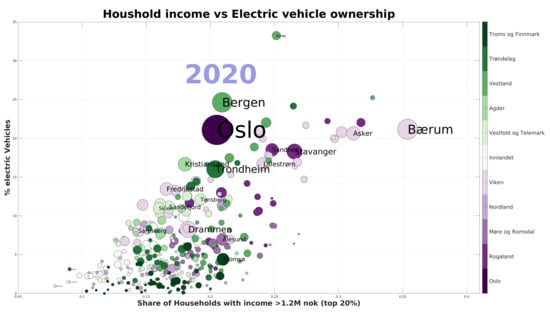
Figure 11.
Share of km driven by electric light-duty vehicles in Norwegian municipalities vs. the share of the population with income above the 20% national percentile in 2020. Colors and sizes as in Figure 10.
Municipalities are distributed along the x-axis in a similar way for all three parameters: higher income, newer vehicles and higher population density. Financial benefits from the use of BEV vehicles are most prominent in cities, where parking, congestion and toll station fee reductions have the highest impact and also more available charging infrastructure relative to local travel patterns. The most plausible argument is that these local incentives are the reason for the high share of BEV and that without these, the transition would be significantly slower. However, the beneficiaries of local BEV policy can entail the shift of older vehicle technology from the urban to the rural areas, contributing to energy injustices and exacerbating rural vulnerabilities. Alternative policies have been suggested to avoid or minimize energy inequalities from electric mobility policies [57].
The life cycle environmental impact of BEVs has been extensively addressed in the literature, and concerns have been raised with regards to the high environmental cost of production [58]. The environmental impact of BEVs has been reported to be higher than that of conventional vehicles due to battery manufacturing. However, their use phase represents an improvement compared with conventional vehicles, although it largely depends on the share of clean energy generation [59]. Different aspects during the use phase of BEV are still under debate, for instance, non-exhaust emissions from BEV in comparison with conventional vehicles [60]. There are two characteristics of BEVs that contribute to their relevance to non-exhaust emissions; (i) BEVs combine regenerative braking and friction braking systems, whereas internal combustion vehicles rely on friction braking; (ii) BEVs are currently heavier compared to their ICE equivalent. The regenerative braking systems contribute to reduced brake wear emissions, although their higher weight will potentially increase stronger brake wear and higher resuspension [61,62,63]. Therefore, the contribution of the ware processes to emissions means that the transition from internal combustion vehicles to BEVs will slightly reduce the threat to human health [64].
4. Conclusions
The need for high-resolution emission inventories has long been part of the demand for air quality assessments and management. With emerging abatement strategies to mitigate climate change, bottom-up high detailed climate gas emission inventories are also needed to evaluate the most cost-effective strategies and monitor the status regarding set targets.
The NERVE model incorporates both climate gases and air quality traffic emissions. A benefit of having a combined source of both is that they can be cross-validated. Previous studies have shown NERVE-derived NO/NOx concentration to be relatively unbiased in several places. Moreover, NERVE CO emissions compare well with national estimates for fuel-sales-derived emissions. The high-resolution emissions can be used to detail influencing factors and causes of regional changes. Therefore, a bottom-up model is a valuable tool for exploring the causes of changes in emissions that are not available from other sources. The results presented here, thus, have valuable details in them that can help understand recent and future changes in road traffic emissions in Norway.
We find that while improving road properties can potentially increase emissions, congestion, slopes and road curvature, in actuality, it increases NERVE traffic emissions relatively little. With current roads, there is only a marginal gain looking at road properties, with the possible exception of speed. To achieve significant emission reductions, the vehicle composition needs to be improved. For NOx, the model results indicate that emissions have plummeted in the last few years and are set to continue that decline with any renewal of the vehicle fleet. Cold start emissions are important for some components but only make up about 5% of emissions for CO and NOx.
Our results imply that the reason for the CO emission increases between 2010 and 2015 is that traffic was outgrowing fuel efficiency improvements. Since then, there has been a steady decline, first as an effect of increased bio-fuel share in ICEs. The year 2020 marked the first time that the BEV share was the most important cause of emissions reductions. With an accelerated growth in vehicle sales shares, followed by an increase in road vehicle shares of BEVs, emissions will continue to rapidly decrease. This will be most prominent for light vehicles, which will see their share of all tailpipe emissions drop.
The restructured tax policy initially incentivized diesel ICE light vehicles, a policy that failed to significantly reduce CO emissions and entailed an overall increase in NOx emissions, especially in densely populated areas. Today’s BEV policy has co-benefits in targeting NOx, CO and fuel energy efficiency, all declining rapidly. While there are production concerns about BEVs, their introduction on roads is already impacting transport emissions, and the impact is set to grow as most newer vehicles on Norwegian roads are now BEVs. Furthermore, the heterogeneous distribution of BEVs across Norway shows that the financial incentives to buy electric vehicles foremost benefited a limited segment of the population and has had success primarily in areas with strong local incentives and where people can afford new vehicles. The economic benefit of incentives predominantly falls to people in areas with strong socioeconomic indicators, which can be problematic both for equality and the broader popularity of incentives.
There remain several open questions concerning the overall sustainability of BEVs, but the peak of ICE vehicles has clearly been reached in Norway. The geographical heterogeneity of electrification in the transport sector in Norway mirrors the international situation and the disparities between countries. While emission reductions will be achieved fast in markets with a young vehicle fleet, changes in emissions will be slower for other regions, and here especially, NOx can also increase in the short term.
Author Contributions
This paper was conceptualized by H.G. and S.L.-A. H.G. developed the NERVE model, performed the simulations, and carried out the data analysis. H.H. ran the RTM traffic simulations and analyzed the traffic data, developed annual scaling factors, and revised the manuscript. T.W. analyzed the traffic data and developed annual scaling factors. S.L.-A. and H.G. prepared the visualizations and the original draft. All authors have read and reviewed the manuscript and agreed to the published version of this manuscript.
Funding
The development of the NERVE model was financed by the Norwegian Environment Agency (NERVE project; o117112 and o119085). The study is additionally financed by the SIS EMISYS project (B120011) (Emission system for climate gases, air pollutants and other environmental contaminants). Support for the analysis and writing of the manuscript was given by NILUs internal support (G106057).
Institutional Review Board Statement
Not applicable.
Informed Consent Statement
Not applicable.
Data Availability Statement
The code for the NERVE model is available at https://git.nilu.no/emissionmodels/NERVE. NERVE model outputs are available from several sources; through https://utslippskartlegging.nilu.no. Municipal emission data are published on https://www.miljodirektoratet.no/tjenester/klimagassutslipp-kommuner (climate gases) and can be retrieved in gridded format at https://www.miljodirektoratet.no/tjenester/luftforurensning-utslippssystem-og-database/. All links accessed on 22 June 2022. Simulation scenarios specific to this study can be shared by contacting heg@nilu.no.
Acknowledgments
We would like to thank the personnel at the Norwegian Environmental Agency, particularly Tomas Seim and Nina Holmengen for supplying bio-fuel data.
Conflicts of Interest
The authors declare no conflict of interest.
References
- Skjærseth, J. Towards a European Green Deal: The evolution of EU climate and energy policy mixes. Int. Environ. Agreem. 2021, 21, 25–41. [Google Scholar] [CrossRef]
- EU Commission. EU Climate Action Progress Report 2019. Available online: https://ec.europa.eu/clima/system/files/2021-05/com_2019_559_en.pdf (accessed on 22 June 2022).
- Puricelli, S.; Cardellini, G.; Casadei, S.; Faedo, D.; van den Oever, A.; Grosso, M. A review on biofuels for light-duty vehicles in Europe. Renew. Sustain. Energy Rev. 2021, 137, 110398. [Google Scholar] [CrossRef]
- Graichen, J.; Gores, S.; Schmid, C.; Nicole, M. Trends and Projections under the Effort Sharing Legislation. Overview on Developments and Drivers; European Topic Centre on Climate Change Mitigation and Energy: Copenhagen, Denmark, 2021; ETC/CME 8/2020. [Google Scholar]
- Wright, L.; Fulton, L. Climate change mitigation and transport in developing nations. Transp. Rev. 2005, 25, 691–717. [Google Scholar] [CrossRef]
- Georgoulias, A.K.; van der A, R.J.; Stammes, P.; Boersma, K.F.; Eskes, H.J. Trends and trend reversal detection in 2 decades of tropospheric NO2 satellite observations. Atmos. Chem. Phys. 2019, 19, 6269–6294. [Google Scholar] [CrossRef]
- Lumbreras, J.; Valdés, M.; Borge, R.; Rodríguez, M. Assessment of vehicle emissions projections in Madrid (Spain) from 2004 to 2012 considering several control strategies. Transp. Res. Part Policy Pract. 2008, 42, 646–658. [Google Scholar]
- Hooftman, N.; Messagie, M.; Van Mierlo, J.; Coosemans, T. A review of the European passenger car regulations—Real driving emissions vs. local air quality. Renew. Sustain. Energy Rev. 2018, 86, 1–21. [Google Scholar] [CrossRef]
- Zachariadis, T. After ‘dieselgate’: Regulations or economic incentives for a successful environmental policy? Atmos. Environ. 2016, 138, 1–3. [Google Scholar] [CrossRef]
- Fontaras, G.; Zacharof, N.G.; Ciuffo, B. Fuel consumption and CO2 emissions from passenger cars in Europe–Laboratory versus real-world emissions. Prog. Energy Combust. Sci. 2017, 60, 97–131. [Google Scholar] [CrossRef]
- Kühlwein, J. The Impact of Official versus Real-World Loads on CO2; ICCT White Paper Communications: Berlin, Germany, 2016; Available online: https://theicct.org/sites/default/files/publications/ICCT_Coastdowns-EU_201605.pdf (accessed on 22 June 2022).
- Bloomberg, N. Electric Vehicle Outlook 2022. Available online: https://bnef.turtl.co/story/evo-2022/page/1 (accessed on 11 June 2022).
- Elbilforening, N. Norwegian EV Policy. Available online: elbil.no/english/norwegian-ev-policy (accessed on 22 May 2022).
- Aasness, M.A.; Odeck, J. The increase of electric vehicle usage in Norway—Incentives and adverse effects. Eur. Transp. Res. Rev. 2015, 7, 34. [Google Scholar] [CrossRef]
- Yan, S.; Eskeland, G.S. Greening the Vehicle Fleet: Evidence from Norway’s CO2 Differentiated Registration Tax; NHH Department of Business and Management Science Discussion Paper: Bergen, Norway, 2016. [Google Scholar]
- Bibra, E.M.; Connelly, E.; Gorner, M.; Lowans, C.; Paoli, L.; Tattini, J.; Teter, J. Global EV Outlook 2021: Accelerating Ambitions Despite the Pandemic; IEA: Paris, France, 2021. [Google Scholar]
- Nilsson, M.; Nykvist, B. Governing the electric vehicle transition—Near term interventions to support a green energy economy. Appl. Energy 2016, 179, 1360–1371. [Google Scholar] [CrossRef]
- Kawamoto, R.; Mochizuki, H.; Moriguchi, Y.; Nakano, T.; Motohashi, M.; Sakai, Y.; Inaba, A. Estimation of CO2 Emissions of Internal Combustion Engine Vehicle and Battery Electric Vehicle Using LCA. Sustainability 2019, 11, 2690. [Google Scholar] [CrossRef]
- Change, I.C. Mitigation of climate change. Working Group III Contribution to the Fifth Assessment Report of the Intergovernmental Panel on Climate Change. 2014, Volume 1454, p. 147. Available online: https://www.ipcc.ch/report/ar5/wg3/ (accessed on 22 June 2022).
- Singh, A.P.; Dhar, A.; Agarwal, A.K. Evolving energy scenario: Role and scope for alternative fuels in transport sector. In Prospects of Alternative Transportation Fuels; Springer: Berlin/Heidelberg, Germany, 2018; pp. 7–19. [Google Scholar] [CrossRef]
- Miljødirektoratet, E.; Vegevesen, S.; Kystverket, L. NVE, 2020: Klimakur 2030: Tiltak og Virkemidler Mot 2030 (Climate Cure 2030: Measures and Instruments towards 2030). Rep. M-1625. 657p. Available online: https://www.miljodirektoratet.no/globalassets/publikasjoner/m1625/m1625.pdf (accessed on 22 June 2022).
- Sokhi, R.S.; Moussiopoulos, N.; Baklanov, A.; Bartzis, J.; Coll, I.; Finardi, S.; Friedrich, R.; Geels, C.; Grönholm, T.; Halenka, T.; et al. Advances in air quality research–current and emerging challenges. Atmos. Chem. Phys. 2022, 22, 4615–4703. [Google Scholar] [CrossRef]
- Broin, E.Ó.; Kelly, J.A.; Santos, G.S.; Grythe, H.; Svendby, T.; Solberg, S.; Kelleher, L.; Clinch, J.P. Hitting the hotspots–Targeted deployment of air source heat pump technology to deliver clean air communities and climate progress: A case study of Ireland. Atmos. Environ. X 2022, 13, 100155. [Google Scholar] [CrossRef]
- Peduzzi, E.; Baldi, M.G.; Pisoni, E.; Kona, A.; Bertoldi, P.; Monforti-Ferrario, F. Impacts of a climate change initiative on air pollutant emissions: Insights from the Covenant of Mayors. Environ. Int. 2020, 145, 106029. [Google Scholar]
- Osses, M.; Rojas, N.; Ibarra, C.; Valdebenito, V.; Laengle, I.; Pantoja, N.; Osses, D.; Basoa, K.; Tolvett, S.; Huneeus, N.; et al. High-resolution spatial-distribution maps of road transport exhaust emissions in Chile, 1990–2020. Earth Syst. Sci. Data 2022, 14, 1359–1376. [Google Scholar] [CrossRef]
- Matthias, V.; Bieser, J.; Mocanu, T.; Pregger, T.; Quante, M.; Ramacher, M.O.; Seum, S.; Winkler, C. Modelling road transport emissions in Germany–Current day situation and scenarios for 2040. Transp. Res. Part Transp. Environ. 2020, 87, 102536. [Google Scholar]
- Guevara, M.; Tena, C.; Porquet, M.; Jorba, O.; Pérez García-Pando, C. HERMESv3, a stand-alone multi-scale atmospheric emission modelling framework–Part 2: The bottom–up module. Geosci. Model Dev. 2020, 13, 873–903. [Google Scholar] [CrossRef]
- Wang, H.; Fu, L.; Lin, X.; Zhou, Y.; Chen, J. A bottom-up methodology to estimate vehicle emissions for the Beijing urban area. Sci. Total. Environ. 2009, 407, 1947–1953. [Google Scholar] [CrossRef]
- Eggleston, H.; Buendia, L.; Miwa, K.; Ngara, T.; Tanabe, K. 2006 IPCC Guidelines for National Greenhouse Gas Inventories. 2006. Available online: https://www.ipcc.ch/report/2006-ipcc-guidelines-for-national-greenhouse-gas-inventories/ (accessed on 22 June 2022).
- Agency, E.E. EMEP/EEA Air Pollutant Emission Inventory Guidebook; EEA Report, N13/2019; EEA: Copenhagen, Denmark, 2019. [Google Scholar]
- Kuenen, J.; Dellaert, S.; Visschedijk, A.; Jalkanen, J.P.; Super, I.; Denier van der Gon, H. CAMS-REG-v4: A state-of-the-art high-resolution European emission inventory for air quality modelling. Earth Syst. Sci. Data 2022, 14, 491–515. [Google Scholar] [CrossRef]
- Crippa, M.; Guizzardi, D.; Muntean, M.; Schaaf, E.; Dentener, F.; Van Aardenne, J.A.; Monni, S.; Doering, U.; Olivier, J.G.; Pagliari, V.; et al. Gridded emissions of air pollutants for the period 1970–2012 within EDGAR v4. 3.2. Earth Syst. Sci. Data 2018, 10, 1987–2013. [Google Scholar] [CrossRef]
- López-Aparicio, S.; Guevara, M.; Thunis, P.; Cuvelier, K.; Tarrasón, L. Assessment of discrepancies between bottom-up and regional emission inventories in Norwegian urban areas. Atmos. Environ. 2017, 154, 285–296. [Google Scholar] [CrossRef]
- Grote, M.; Williams, I.; Preston, J.; Kemp, S. Including congestion effects in urban road traffic CO2 emissions modelling: Do Local Government Authorities have the right options? Transp. Res. Part Transp. Environ. 2016, 43, 95–106. [Google Scholar] [CrossRef]
- Kazancoglu, Y.; Ozbiltekin-Pala, M.; Ozkan-Ozen, Y.D. Prediction and evaluation of greenhouse gas emissions for sustainable road transport within Europe. Sustain. Cities Soc. 2021, 70, 102924. [Google Scholar] [CrossRef]
- Weydahl, T.; Grythe, H.; Haug, T.W.; Høyem, H. NERVE—Utslipsmodell for Veitrafikk. Dokumentasjon av Beregningsmodell for Klimagassutslipp i Norske Kommuner; NILU Rapport; NILU: Kjeller, Norway, 2018. [Google Scholar]
- López-Aparicio, S.; Thorne, R.J.; Bartonova, A.; Teixido, O.; Mohamed, R. Abu Dhabi Air Emissions Inventory; NILU Rapport; NILU: Kjeller, Norway, 2018; p. 8. [Google Scholar]
- Broin, E.Ó.; Kelly, A.; Santos, G.S.; Grythe, H.; Kelleher, L. CON+ AIR: Addressing Conflicts of Climate and Air Pollution. 2019. Available online: https://www.epa.ie/publications/research/climate-change/research-286-conair-addressing-conflicts-of-climate-and-air-pollution.php (accessed on 22 June 2022).
- Lopez-Aparicio, S.; Grythe, H.; Thorne, R.J.; Vogt, M. Costs and benefits of implementing an Environmental Speed Limit in a Nordic city. Sci. Total. Environ. 2020, 720, 137577. [Google Scholar] [CrossRef] [PubMed]
- Evangeliou, N.; Grythe, H.; Klimont, Z.; Heyes, C.; Eckhardt, S.; Lopez-Aparicio, S.; Stohl, A. Atmospheric transport is a major pathway of microplastics to remote regions. Nat. Commun. 2020, 11, 3381. [Google Scholar] [CrossRef]
- Weydahl, T.; Walker, S.E.; Johnsrud, M.; Vo, D.T.; Ranheim, P. Tiltaksutredning for Lokal Luftkvalitet i Tromsø; NILU Rapport; NILU: Kjeller, Norway, 2019; p. 26. [Google Scholar]
- Weydahl, T.; Grythe, H.; Høiskar, B.A.K.; Svorstøl, E.T.; Haug, T.W. Tiltaksutredning og Handlingsplan for Lokal Luftkvalitet i Sarpsborg og Fredrikstad; NILU Rapport; NILU: Kjeller, Norway, 2018; p. 26. [Google Scholar]
- Weydahl, T.; Høiskar, B.A.K.; Johnsrud, M.; Ranheim, P. Revidert Tiltaksutredning for Lokal Luftkvalitet i Stavanger; NILU Rapport; NILU: Kjeller, Norway, 2020; p. 17. [Google Scholar]
- Notter, B.; Keller, M.; Althaus, H.J.; Cox, B.; Knörr, W.; Heidt, C.; Biemann, K.; Räder, D.; Jamet, M. HBEFA 4.1. INFRAS 2019. Available online: https://www.hbefa.net/e/index.html (accessed on 22 June 2022).
- Hausberger, S.; Sams, T. Schadstoffbildung und Emissionsminimierung bei Kfz Teil I und II. Skriptum IVT TU Graz, Graz 2016. Available online: https://docplayer.org/122884847-Schadstoffbildung-und-emissionsminimierung-bei-kfz-teil-ii.html (accessed on 22 June 2022).
- De Dios Ortúzar, J.; Willumsen, L.G. Modelling Transport, 4th ed.; John Wiley & Sons: Hoboken, NJ, USA, 2011. [Google Scholar]
- Rekdal, J.; Larsen, O.; Hamre, T.; Malmin, O.; Hulleberg, N. Etablering av etterspørselsmodell for korte personreiser. In Teknisk Dokumentasjon fra Estimeringen; TØI: Oslo, Norway, 2021. [Google Scholar]
- Madslien, A.; Hulleberg, N.; Kwan Kwong, C. Transport in the Future. Projections for Passenger and Freight Transport 2018–2050; TØI Report; TØI: Oslo, Norway, 2019; p. 1718. [Google Scholar]
- Malmin, O.K. CUBE-Teknisk Dokumentasjon av Regional Persontransportmodell; SINTEF-Rapport A; SINTEF: Trondheim, Norway, 2013; p. 24718. [Google Scholar]
- Wærsted, E.G.; Sundvor, I.; Denby, B.R.; Mu, Q. Quantification of temperature dependence of NOx emissions from road traffic in Norway using air quality modelling and monitoring data. Atmos. Environ. X 2022, 13, 100160. [Google Scholar] [CrossRef]
- Gaffney, J.S.; Marley, N.A. The impacts of combustion emissions on air quality and climate—From coal to biofuels and beyond. Atmos. Environ. 2009, 43, 23–36. [Google Scholar] [CrossRef]
- Sundvor, I.; López-Aparicio, S. Impact of bioethanol fuel implementation in transport based on modelled acetaldehyde concentration in the urban environment. Sci. Total. Environ. 2014, 496, 100–106. [Google Scholar] [CrossRef]
- Grythe, H.; Lopez-Aparicio, S. The who, why and where of Norway’s CO2 emissions from tourist travel. Environ. Adv. 2021, 5, 100104. [Google Scholar] [CrossRef]
- Thomas, J. Drive cycle powertrain efficiencies and trends derived from EPA vehicle dynamometer results. SAE Int. J. Passeng. Cars. Mech. Syst. 2014, 7, 1374–1384. [Google Scholar] [CrossRef]
- Pannone, G.; Betz, B.; Reale, M.; Thomas, J. Decomposing fuel economy and greenhouse gas regulatory standards in the energy conversion efficiency and tractive energy domain. SAE Int. J. Fuels Lubr. 2017, 10, 202–216. [Google Scholar] [CrossRef]
- SSB. Statistics Norway. 2021. Available online: https://www.ssb.no/en (accessed on 22 June 2022).
- Sovacool, B.K.; Kester, J.; Noel, L.; de Rubens, G.Z. Energy injustice and Nordic electric mobility: Inequality, elitism, and externalities in the electrification of vehicle-to-grid (V2G) transport. Ecol. Econ. 2019, 157, 205–217. [Google Scholar] [CrossRef]
- Hawkins, T.R.; Gausen, O.M.; Strømman, A.H. Environmental impacts of hybrid and electric vehicles—A review. Int. J. Life Cycle Assess. 2012, 17, 997–1014. [Google Scholar] [CrossRef]
- Xia, X.; Li, P. A review of the life cycle assessment of electric vehicles: Considering the influence of batteries. Sci. Total Environ. 2022, 814, 152870. [Google Scholar] [CrossRef]
- Vanherle, K.; Lopez-Aparicio, S.; Grythe, H.; Lükewille, A.; Unterstaller, A.; Mayeres, I. Transport Non-Exhaust PM-Emissions. An Overview of Emission Estimates, Relevance, Trends and Policies; European Topic Centre Air Pollution, Transport Noise and Industrial Pollution: Copenhagen, Denmark, 2021; ETC/ATNI 5/2020. [Google Scholar]
- Liu, Y.; Chen, H.; Li, Y.; Gao, J.; Dave, K.; Chen, J.; Li, T.; Tu, R. Exhaust and non-exhaust emissions from conventional and electric vehicles: A comparison of monetary impact values. J. Clean. Prod. 2022, 331, 129965. [Google Scholar] [CrossRef]
- Beddows, D.C.; Harrison, R.M. PM10 and PM2.5 emission factors for non-exhaust particles from road vehicles: Dependence upon vehicle mass and implications for battery electric vehicles. Atmos. Environ. 2021, 244, 117886. [Google Scholar] [CrossRef]
- Timmers, V.R.; Achten, P.A. Non-exhaust PM emissions from electric vehicles. Atmos. Environ. 2016, 134, 10–17. [Google Scholar] [CrossRef]
- Sisani, F.; Di Maria, F.; Cesari, D. Environmental and human health impact of different powertrain passenger cars in a life cycle perspective. A focus on health risk and oxidative potential of particulate matter components. Sci. Total Environ. 2022, 805, 150171. [Google Scholar] [CrossRef] [PubMed]
Publisher’s Note: MDPI stays neutral with regard to jurisdictional claims in published maps and institutional affiliations. |
© 2022 by the authors. Licensee MDPI, Basel, Switzerland. This article is an open access article distributed under the terms and conditions of the Creative Commons Attribution (CC BY) license (https://creativecommons.org/licenses/by/4.0/).