1. Introduction
Global warming, climate change, and extreme weather have attracted worldwide attention [
1,
2,
3,
4,
5]. There exists wide agreement in the scientific community that carbon emissions are a major driver of these unexpected events [
6,
7,
8,
9,
10]. Policymakers around the world are positively searching for a desired solution to abate carbon emissions in order to deal with them successfully. China, as the largest emitter of carbon dioxide, has launched the low-carbon city pilot project since 2010, whose aim is to lower carbon emissions, to slow global warming, and to achieve sustainable development [
11,
12].
Up to now, Chinese officials have launched three rounds of low-carbon city pilot projects [
13,
14,
15]. Although the literature is scant on whether low-carbon city pilot projects affected carbon emissions, they just adopted the information for the first two groups of cities that launched their low-carbon city pilot projects [
16]. In addition, these few studies did not investigate the dynamic impacts that low-carbon city pilot projects have on carbon emissions [
17].
In this paper, we addressed these challenges. Using a panel of cities from 2007 to 2019, we estimated the impact on carbon emissions of low-carbon city pilot projects across China that took place over the last 13 years. The evidence suggests that low-carbon city pilot projects do cause a reduction in carbon emissions, and its average impact is economically and statistically significant. Our estimates imply that cities with the status of not having launched a low-carbon city pilot project compared to those that had launched a low-carbon city pilot project achieve about 2 percentage points lower carbon emissions on average in the following years. In the long run, however, low-carbon city pilot projects do not appear to be of impact on carbon emissions abatement. In contrast with the short term, we observed that carbon emissions had a slightly upward trend in cities that have launched a low-carbon pilot project relative to cities without having launched the project.
To understand whether the impact of low-carbon city pilot projects on carbon emissions was evenly distributed across different regions, we then turned to evidence from heterogeneity analysis. We found that the low-carbon city pilot projects impact on carbon emissions was dependent on urban characteristics; that is, low-carbon city pilot projects would be more conducive to carbon emissions abatement in cities with less income per person, lower levels of industrialization, and a larger degree of urbanization.
There is a large amount of literature in environmental science that have investigated the impacts of low-carbon city pilot projects, but few focus on their direct impact on carbon emissions. For example, Wen et al. estimated a low-carbon pilot project’s impact on carbon emissions efficiency using a panel of 208 cities around China from 2003 to 2016 [
18]. They found that low-carbon city pilot projects had a positive impact on carbon emissions efficiency, with an average improvement of 7 percentage points. Shi and Xu evaluated the impact of low-carbon city pilot projects from an industrial carbon emissions efficiency perspective, based on the slacks-based-measure model and the difference-in-differences estimator [
19]. Their results showed that low-carbon city pilot projects brought into a sizeable and statistically significant growth in industrial carbon emissions efficiency by about 10 per cent, and that the improvement could be driven by urban technological innovation. Yu and Zhang developed a novel data-envelopment-analysis model, calculated the carbon emissions efficiency for 251 cities across the Chinese mainland at a year-by-city level from 2003 to 2018, and assessed the impact on carbon emissions efficiency of low-carbon city pilot projects by fitting a spatial difference-in-differences estimator [
20].
Beside the investigation of the direct and indirect impacts that low-carbon city pilot projects had on carbon emissions, existing research evaluated the social and economic impacts of low-carbon city pilot projects, though they are not the main focus of interest in our study. On low-carbon innovation, Zou et al. developed an innovation index, and using the index, along with a difference-in-differences estimator, they estimated the impact on innovation of low-carbon city pilot projects, finding that low-carbon city pilot projects significantly improved urban areas’ capability of technological innovation, particularly the number of green patents [
21]. Pan et al. proposed an entropy-balancing-based matching framework, combined with difference-in-differences estimators, to assess the impact of low-carbon city pilot projects on urban innovation, based on the first rounds of cities launching their low-carbon city pilot projects [
22]. Their results exhibited that low-carbon city pilot projects increased the number of low-carbon-related patents at the city level, indicating that low-carbon-oriented policies could improve urban creative powers. On urban development strategies related to low-carbon goals, Song et al. illustrated that the innovation of policy is beneficial to achieve the objective of carbon emissions reduction using China’s low-carbon city pilot policy [
23]. Zhang et al. conducted a simulation study of urban low-carbon transformation, taking the example of Wuhan [
24]. Their results provided some suggestions for the central and local governments on how officials can form an effective low-carbon development strategy according to the local socio-economic status.
Feng et al., too, used a propensity score matching technique, combined with difference-in-differences estimators, to explore the impact of low-carbon city pilot policy on carbon emissions, using 49 cities, between 2005 and 2018 [
25]. However, their interest is in changes in carbon intensity after the launch of low-carbon city pilot projects, and do not propose the inverse-probability-weighting difference-in-differences estimator we adopt here nor compare the estimates from these different estimators. The most related to ours is a recent study Hou et al., who also used a difference-in-differences estimator to explore the impact of low-carbon city pilot projects on carbon emissions [
26]. As we argued in the previous, however, they only focused on the first two rounds of low-carbon city pilot projects and did not develop a semi-parametric treatment effects estimator nor an instrumental variable estimator. Furthermore, they did little investigation of the dynamics in the impact of low-carbon city pilot projects on carbon emissions, though they did examine whether the parallel trends assumption is plausible using a line plot. Thus, our study provides more concrete evidence on the low-carbon city pilot projects’ impact on carbon emissions than the aforementioned research.
Taken together, several features of this study distinguish it from the aforementioned studies on assessing the impact of low-carbon city pilot projects on carbon emissions. Most significantly, it is the first to focus on the total three rounds of cities that have launched a low-carbon city pilot project. Although previous studies focused on the first and second rounds of cities launching the project, using the information of the total three rounds of cities to assess the impact on carbon emissions is particularly important because it provides a comprehensive assessment of the impact of low-carbon city pilot projects on carbon emissions, and boost our confidence that low-carbon city pilot projects reduced carbon emissions. Our study is also significant in that we provide the triangulation of evidence, from difference-in-differences estimators, semi-parametric treatment effect estimators, including propensity-score-matching difference-in-differences estimators and inverse-probability-weighting difference-in-differences estimators, and instrumental variables estimators, to illustrate that there exists a negative and significant impact of low-carbon city pilot projects on carbon emissions. Finally, our study is distinguished form previous studies by focusing on the instantaneous and dynamic impact of low-carbon pilot projects on carbon emissions. While previous studies focused on the average impact, the dynamics are particularly interesting, indicating whether low-carbon city pilot projects have a persistent impact on carbon emissions.
The rest of this paper is organized as follows. The following section describes the construction of the dataset and the implementation of the models, which would be used in later empirical analysis.
Section 3 presents the estimates from our three estimators, including the difference-in-differences estimators, treatment effects estimators, and instrumental variable estimators. In this section, we also examined whether the treated group and the control group were comparable, and reported the results from the heterogeneity analysis.
Section 4 concludes.
2. Methods
Data: In order to assess the impact of low-carbon city pilot projects on carbon emissions, we extracted data from several resources and constructed annual city-level panel data during the periods between 2007 and 2019.
Carbon emissions: The main indicator of an outcome is the carbon emissions, which is measured in one thousand kilograms. In our later analysis, we took the logarithm of carbon emissions as the indicator of an outcome, so that the coefficient of our key independent variable could be interpreted as percentage change. We obtained the data from the National Development and Reform Commission of China.
Low-carbon city pilot projects: The independent variable of our interest is the low-carbon city pilot project, which is a dummy variable indicating whether a city is launching the low-carbon city pilot project, with a value of 1 representing that it is launching the project whereas a value of 0 means that it is not doing so. We collected the information about the local government implementing low-carbon city pilot projects by city to fill in the values for our key independent variable. Based on the information, we found that low-carbon city pilot projects were implemented by different cities in different years. Up to now, low-carbon city pilot projects have been implemented by 121 cities across China in 2010, 2013, and 2017.
Urban characteristics: To remove the potential confounding factors, we included a series of time-varying urban characteristics, which were used as controls, in our models. These urban characteristics contain gross regional product per capita measured in year 2007, in Chinese Yuan; population, measured in persons; industrialization, measured by secondary industry as a percentage of the gross regional product; urbanization, measured by local urban population as a percentage of the local total population; and energy structure, measured by coal consumption as a percentage of the total energy consumption. In some exercises, we divided China into North China and South China, as well as Eastern China, Central China, Western China, and Northeastern China, according to the rule from the National Bureau of Statistics of China.
Models: We adopted three econometric techniques to assess the impact of low-carbon city pilot projects on carbon emissions. Our first approach uses a difference-in-differences estimator, controlling for a series of urban characteristics and a collection of unobserved fixed effects. The underlying econometric assumption here is that once controlling for the observed time-varying urban characteristics and unobserved city and year fixed effects, cities in the treated group do not have a different trend in carbon emissions in the absence of launching a low-carbon city pilot project, relative to cities in the control group. Our second approach builds on a framework of semi-parametric treatment effects, where the counterfactual of the treated group is formed, and produces doubly robust estimates of the impact of low-carbon city pilot projects on carbon emissions using a difference-in-differences estimator based on the treated group and its counterfactual. The econometric assumption in this case remains the same, in that conditional on the urban characteristics and a series of fixed effects, the trends in carbon emissions between cities with and without launching the low-carbon city project pilot project would be similar if their low-carbon city pilot projects were not launched. Our third approach exploits a source of exogenous variation to instrument our key independent variable of low-carbon city pilot projects, which removes all the unobserved confounding factors, approaching an unbiased and consistent estimate of the impact of low-carbon city pilot projects on carbon emissions. The instrumental variable estimators require two assumptions. The first is that the instrumental variable should have a strong association with the key independent variable of low-carbon city pilot projects. The second is that the instrumental variable does not have a direct impact on our key dependent variable of carbon emissions. In general, the former is called the instrumental correlation, which could be examined using the first-stage F-statistic, while the latter is called the exclusion restriction, which is not verified, and in the literature related to program evaluation. Although the exclusion restriction is unlikely to be examined, we could use a sensitivity analysis via the inclusion of different numbers of control variables to demonstrate whether the assumption is plausible. Next, we explained the three approaches and their implementation in details.
Difference-in-differences estimators: We used difference-in-differences estimates as our baseline results. The difference-in-differences estimate could be obtained by fitting the following model:
where
represents carbon emissions in city
in year
.
denotes whether city
is launching the low-carbon city pilot project in year
, with the value of one representing that city
is launching the low-carbon city pilot project in year
and the value of zero representing that city
is not launching the low-carbon city pilot project in year
.
is a series of control variables, namely, the urban characteristics, including gross regional product per capita, population, industrialization, urbanization, and energy structure.
indicates a collection of city fixed effects, and
indicates a collection of year fixed effects.
The city fixed effects, , are a full set of city-specific dummy variables, absorbing any time invariant confounding effect specific to each city. For example, urban location, local culture, and short-term socio-economic status could be controlled through introducing the fixed effects specific to cities. The year fixed effects, , are a full set of year dummy variables, accounting for common shocks to all the cities in a given year, such as public holidays, macro-economic performance, and the total trend in carbon emissions across cities in our sample.
Because both of city and year fixed effects are included in the above model, the coefficient of estimates the difference in carbon emissions between the treated group and the control group before and after an introduction of launch of the low-carbon city pilot project. The treated group contains cities with launching a low-carbon city pilot project, while the control group contains cities without a low-carbon city pilot project. We referred to the difference as the impact of low-carbon city pilot projects on carbon emissions. We expected to be negative because the aim of the low-carbon city pilot project is to reduce carbon emissions, with a negative value suggesting the effectiveness of the project.
Treatment effect estimators: In the previous part, we removed the observed confounding factors by controlling for a series of urban characteristics and a collection of fixed effects using a linear regression model, compared carbon emissions between cities with and without launching the low-carbon city pilot project before and after an introduction of the low-carbon city pilot project, and obtained an estimate of the impact of low-carbon city pilot projects on carbon emissions. Even though this approach is the most commonly used in the related literature on program evaluation, it relies on a linear assumption because in essence it is a linear regression. The linear assumption means that the impact of urban characteristics on carbon emissions is the same in the absolute value, which could restrict the dynamics of low-carbon city pilot projects on carbon emissions. Furthermore, this approach requires that these cities with and without launching the low-carbon city pilot project are comparable if the projects were not launched. Of course, we could use an event study to check the time path of the impact of low-carbon city pilot projects on carbon emissions in order to alleviate our concern. In fact, we still did it so that our estimates had a high credibility. On the other hand, we could introduce the frame of treatment effects, and directly created the counterfactual of the treated group so that urban characteristics had a nonlinear impact on carbon emissions and so that the trends in carbon emissions between cities with and without launching a carbon city pilot project would be more similar in the new sample than those in the raw sample.
Here, we propose alternative approaches. We refer to these alternative approaches as treatment effect estimators, as they build on a framework of treatment effects. Next, we first illustrated the procedure of creating the counterfactual of cities that have launched a low-carbon city pilot project. Then, we explained how the estimates of the impact of low-carbon city pilot projects on carbon emissions could be obtained. We pay attention to two common approaches in the frame of treatment effects, to form the counterfactual of the treated group. The first approach, which often is called the propensity score matching, first fits a logistical regression, using the urban characteristics as independent variables and using the indicator of whether a city is launching a low-carbon city pilot project as dependent variable, to generate the propensity score that represents the probability of whether a city would launch a low-carbon city pilot project. After obtaining these propensity scores, we could match an observation with another observation conditional on that they had a similar propensity score. We consider the matching sample as the new sample. Based on the new sample, we could estimate the impact of low-carbon city pilot projects on carbon emissions using the previously proposed difference-in-differences estimator. In order to distinguish the new proposed difference-differences estimator with the previously proposed difference-in-differences estimator, we refer to the former as a propensity-score-matching difference-in-differences estimator. Though the matching approach would be a good one to make the treated group and the control group comparable, it leads to a loss in observations, which cannot match with others, consequently amplifying the uncertainty of estimates due to a relatively small size in the new sample.
In order to make the two groups comparable, as well as to avoid a reduction in the sample size during the process of creating the counterfactual of the treated group, we now turn to another common approach, which follows a sampling technique called inverse probability weighting. Like the matching approach, this approach also relies on probabilities, but the difference between it and the matching approach lies in that this approach does not require implementing one-to-one matching and discard all the observations that could be matched, whereas it uses all the information on observations; that is, we would give a relatively large weight to an observation that could match with others, and give a relatively small weight to an observation that cannot match with others. Next, we explained how to create the weight, as well as how to estimate the impact of low-carbon city pilot projects on carbon emission. Following Hirano et al., we first estimated an exposure model using urban characteristics, then we produced weights using the propensity score, and finally we assessed the impact of low-carbon city pilot projects on carbon emissions using a difference-in-differences estimator with weights. Because the process of assigning weights is often called inverse probability weighting, we refer to this novel approach developed here to evaluate the impact of the project as an inverse-probability-weighting difference-in-differences estimator.
Before proceeding any further, one point that needs attention is that these two treatment effect estimators, namely, propensity-score-matching difference-in-differences estimators and inverse-probability-weighting difference-in-differences estimators, in fact are exactly doubly robust estimators that form the counterfactual of the treated group by the propensity score and estimate the impact of low-carbon city pilot projects on carbon emissions using a linear regression model. Intuitively, the estimator controls for a series of urban characteristics and a collection of fixed effects in the outcome model, and re-weighs the data via the propensity score to form a control group comparable to the treated group using an exposure model. A large number of studies report that the estimates from doubly robust estimators would be unbiased and consistent if either the outcome model or the exposure model is valid.
Instrumental variable estimators: So far, our estimators proposed in the previous part have controlled for a series of urban characteristics and a collection of fixed effects using some econometric techniques, such as a linear regression model and a propensity score adjustment. In this sub-section, we developed an instrumental variable estimator to deal with unobserved time-varying urban characteristics, which could simultaneously affect our dependent variable and independent variable of interest, consequently leading to a bias in our estimates of the impact that low-carbon city pilot projects have on carbon emissions. Our instrumental variable estimator also alleviates our concern about measurement errors in the measure of whether a city is launching a low-carbon pilot project. In addition, our instrumental variable estimator provides a possible solution to the problem of endogenous selection of launching a low-carbon city pilot project. Next, we first illustrated how we searched for an instrument to exploit the source of exogenous variation of whether a city would launch a low-carbon city pilot project, and then we presented the employed model to estimate the impact of low-carbon city pilot projects on carbon emissions.
We considered the number of cities launching a low-carbon city pilot project in the same province as an instrument of the likelihood of whether a city would launch a low-carbon city pilot project for these cities in that province. We think that whether a city would launch a low-carbon pilot project is associated with the number of cities that have launched a low-carbon pilot project; that is, as the number of cities that have launched a low-carbon city pilot project increases in a province, the willingness of cities that have not yet launched such a project in the same province to launch one also rises. We provided evidence on the correlation between a provincial wave of low-carbon city pilot projects and the likelihood of whether a city would launch a project, in the corresponding subsection reporting the instrumental variable estimates. On the other hand, there exists no reason that the number of cities that have launched a low-carbon city pilot project would directly affect carbon emissions. Thus, we think that it is fit to use the number of cities that have launched a low-carbon city pilot project as an instrument of our key independent variable of low-carbon city pilot project.
The corresponding two-stage least-squares model, which is employed to produce the instrumental variable estimate, is as follows:
where
represents carbon emissions in city
in year
.
denotes whether city
is launching the low-carbon city pilot project in year
, with a value of 1 representing that city
is launching the low-carbon city pilot project in year
and a value of 0 representing that city
is not launching the low-carbon city pilot project in year
.
indicates the number of cities that have launched a low-carbon city pilot project in a province where city
locates in year
.
is a series of control variables, namely the urban characteristics, including gross regional product per capita, population, industrialization, urbanization, and energy structure.
indicates a collection of city fixed effects, and
indicates a collection of year fixed effects in the second stage regression, while
indicates a collection of city fixed effects, and
indicates a collection of year fixed effects in the first stage regression.
This is identical to Equation (1), but we treat our key independent variable of low-carbon city pilot projects as an endogenous variable, and instrument it through the number of cities that have launched a low-carbon city pilot project.
Event study: As we said earlier, the econometric assumption of the difference-in-differences estimators is that cities with and without launching a low-carbon city pilot project would have common trends in carbon emissions in the absence of low-carbon city pilot projects. Even if the estimates exhibit that low-carbon city pilot projects reduce carbon emissions after an introduction of the project, the estimates might not be caused by the low-carbon city pilot project, but by a systematic difference between the treated group and the control group. For example, if cities with a low-carbon city pilot project have a downward trend in carbon emissions, this could lead to the results. This assumption is untested because we could not observe the counterfactual; that is, what would happen to the trend in carbon emissions in the treated group in the absence of launching a low-carbon city pilot project. Nevertheless, we could still examine the trends in carbon emissions for the two groups before an introduction of the low-carbon city pilot project, to investigate if they are comparable. To do so, we performed an event study by fitting the following model:
where
represents carbon emissions in city
in year
.
denotes a collection of dummy variables indicating the treated status during different periods. Here, we set a year as a period. The dummy for
is omitted in the above equation so that the dynamic impact of the low-carbon city pilot project on carbon emissions is relative to the period instantaneously before the launch of the project. The coefficient of
exactly estimates the impact of the project
years after it was launched. We included the leads of these dummy variables in Equation (4) to test whether the parallel trends assumption is reasonable. Intuitively, the coefficient of
estimates the difference in carbon emissions between cities with and without launching the low-carbon city pilot project. We expected that these coefficients are statistically insignificant when
, indicating that the trends in carbon emissions between the two group are similar, whereas we expected that these coefficients are statistically significant when
, which suggests that low-carbon city pilot projects have a persistent impact on the reduction in carbon emissions.
is a series of control variables, namely the urban characteristics, including gross regional product per capita, population, industrialization, urbanization, and energy structure.
indicates a collection of city fixed effects, and
indicates a collection of year fixed effects.
Heterogeneity analysis: The impact of low-carbon city pilot projects on carbon emissions might be different conditional on the urban characteristics. For example, the impacts could be dependent on gross regional product per capita, population, industrialization, urbanization, and energy structure. To explore the heterogeneity, we used the following equation based on different urban characteristics:
where
represents carbon emissions in city
in year
.
denotes whether city
is launching the low-carbon city pilot project in year
, with a value of 1 representing that city
is launching a low-carbon city pilot project in year
and a value of 0 representing that city
is not launching a low-carbon city pilot project in year
.
is a series of control variables, namely the urban characteristics, including gross regional product per capita, population, industrialization, urbanization, and energy structure.
indicates a collection of city fixed effects, and
indicates a collection of year fixed effects. We depicted the results from the heterogeneity analysis in the corresponding subsection using a forest plot.
3. Results and Discussion
Impacts of low-carbon city pilot projects on carbon emissions: Difference-in-differences estimates: We found that low-carbon city pilot projects did reduce carbon emissions; that is, in comparison with cities without launching a low-carbon city pilot project, carbon emissions substantially declined when including a series of urban characteristics and a collection of fixed effects. These estimates are not sensitive to the inclusion of urban characteristics, suggesting that the change in carbon emissions before and after the launch of the low-carbon city pilot project is not likely caused by urban characteristics. We also provided the results with two types of standard errors, which are robust against heteroskedasticity and serial correlation at the city level and at the province level, respectively, and found that the statistical significance of the estimates are very close to each other.
Table 1 reports the difference-in-differences estimates adjusted for different numbers of urban characteristics. This table is structured in two panels. In the top panel, we present the estimates of the impact of low-carbon city pilot projects on carbon emissions, along with their standard errors, which are robust against heteroskedasticity and serial correlation at the city level. In the bottom panel, we present the estimates of the impact of low-carbon city pilot projects on carbon emissions, along with their standard errors, which are robust against heteroskedasticity and serial correlation at the province level.
The first column of this table does not control for any urban characteristic. In a pattern similar to all of the estimates that we presented, we found that a statistically significant average impact on carbon emissions, with the coefficient of the low-carbon city pilot projects of 0.022.
Column 2, controlling for gross regional product per capita, shows that the estimate in the impact of low-carbon city pilot projects on carbon emissions is the same to that found in Column 1.
Column 3 adds gross regional product per capita and population, exhibiting that the average change in carbon emissions around the introduction of low-carbon city pilot projects is the same than that of Column 2.
Column 4 includes three control variables, namely, gross regional product per capita, population, and industrialization. The estimated coefficient on our variable of low-carbon city pilot projects, here, remains the same than those reported in the previous columns.
Columns 5 to 6 absorb four more controls of urban characteristics. We found that the results, obtained from the last two columns, were very close to those in the first four columns. The coefficient on the variable of our interest is now 0.023, indicating that low-carbon city pilot projects reduce annual carbon emissions by about 2 percentage points.
Overall, these results boost our confidence; that is, our results are not driven by chance, which is extremely robust by including different numbers of urban characteristics. Motivated by this, we pay attention to the specification in Column 6, controlling for five urban characteristics, regarding the results from the event study and heterogeneity analysis. We also referred to these estimates here as the baseline results.
Treatment effect estimates: In the previous subsection, we estimated the impact of low-carbon city pilot projects on carbon emissions using the relative change in carbon emissions in cities that launched the project relative to cities that did not by fitting a difference-in-differences estimator. This estimator allows us to remove a lot of confounding factors, which simultaneously affect the dependent and independent variables of our interest, such as a series of urban characteristics and a collection of fixed effects. Even though it is related to the most common approach in the literature on program evaluation, this estimator heavily relies on the assumption that cities in the treated group and cities in the control group are completely comparable. In the latter subsection, we carried out an event study analysis to investigate whether the trends in carbon emissions between the treated group and the control group are similar before the introduction of low-carbon city pilot projects. In this subsection, we propose two alternative estimators to estimate the impact of low-carbon city pilot projects on carbon emissions by modeling the propensity of whether a city would launch a low-carbon city pilot project. Next, we separately report the results, as obtained from the two alternative estimators.
The first builds on Heckman et al., Abadie, and Imai et al. [
27,
28,
29], using the propensity score estimated by a logistic regression of the probability that a city would launch a low-carbon city pilot project, to create a new sample where the counterfactual of cities in the treated group is formed using cities in the control group whose propensity score is similar to cities in the treated group. Combining the new sample and our difference-in-differences estimator referred to in the previous subsection, we could estimate the impact of low-carb city pilot projects on carbon emissions. This approach proposed here, and in the literature related to program evaluation, is also called the matching difference-in-differences estimator.
Table 2 reports the estimates obtained from this approach, adjusted for different numbers of urban characteristics. This table is structured in two panels. In the top panel, we presented the estimates of the impact of low-carbon city pilot projects on carbon emissions, along with their standard errors, which are robust against heteroskedasticity and serial correlation at the city level. In the bottom panel, we presented the estimates of the impact of low-carbon city pilot projects on carbon emissions, along with their standard errors, which are robust against heteroskedasticity and serial correlation at the province level. To compare these results in
Table 2 with those in
Table 1, we used the controls in one column of
Table 2 in just the same way as we did in the corresponding column of
Table 1; that is, each column of
Table 1 and
Table 2 have the same specification. In line with our expectation that these difference-in-differences estimators have at most one small bias, the estimates from our propensity-score-matching difference-indifferences estimators are very similar to those from the baseline models, although there is a small difference between them, with an estimated coefficient of low-carbon city pilot projects ranging from 0.023 to 0.024.
Our second estimator follows Chakladar et al., Bang and Robins, and Rosenbaum and Rubin [
30,
31,
32]. First, we estimated the propensity score using a logistic model conditional on urban characteristics, and then we assessed the impact of low-carbon city pilot projects on carbon emissions using the propensity score as the weights given to different observations. In the related literature on program evaluation, the above procedure of estimation is often named by researchers and analysts as an inverse-probability-weighting difference-in-differences estimator, which assigns greater weights to observations in cities that have launched a low-carbon city pilot project and exhibits similar urban characteristics to cities that have launched a low-carbon city pilot project preceding the introduction of the low-carbon city pilot project, thus forming a control group that is comparable to the treated group.
Table 3 reports the estimates obtained from this approach, adjusted for different numbers of urban characteristics. This table is structured in two panels. In the top panel, we present the estimates of the impact of low-carbon city pilot projects on carbon emissions, along with their standard errors, which are robust against heteroskedasticity and serial correlation at the city level. In the bottom panel, we presented the estimates of the impact of low-carbon city pilot projects on carbon emissions, along with their standard errors, which are robust against heteroskedasticity and serial correlation at the province level. To ensure that the results reported here could be compared with the baseline results, as well as with those in
Table 2, in Columns 1 to 6 of
Table 3, we adopted the specifications from the same six columns of
Table 1. We found that the results were similar across the three tables, with a reduction in carbon emissions by about 2 percentage points, indicating that the estimated results are extremely robust to the choice of econometric models. Of course, the results suggest that the control group is comparable to the treated group before an introduction of the low-carbon city pilot projects in the raw sample.
The two estimators proposed in this subsection, both combining an outcome model with an exposure model, estimating the probability of whether a city would launch a low-carbon city pilot project, are also doubly robust estimators [
33]; that is, if the outcome model is correctly specified and the exposure model is incorrectly specified, then the estimates from the doubly robust estimators would be unbiased and consistent. Or, if the outcome model is incorrectly specified and the exposure model is correctly specified, then the estimates from the doubly robust estimators are also unbiased and consistent. On the other hand, some studies pointed out that even if both of the two models are incorrectly specified, then the results from the wrong model are still better than those from one single model [
34]. Across the three tables, we see that these estimates of the impact of low-carbon city pilot projects on carbon emissions are extremely close to each other, boosting our confidence that our estimates might not be induced by chance, as well as that the specific parametrization of the urban characteristics probably is not playing an important part in our conclusion.
Instrumental variable estimates: So far, our estimators controlled for a series of urban characteristics and a collection of fixed effects, as well as carried out a logistic regression of the probability that a city would launch the low-carbon city pilot project to form a control group comparable to the treated group. There remains, however, some unobserved urban characteristics, which are time-varying variables, simultaneously affecting the likelihood of launching the low-carbon city pilot project and thus the carbon emissions.
An alternative approach, which removes all the time-varying confounding factors, is to use synthetic control methods. However, the synthetic control methods are only fitted into a small sample with one treated unit. Although some studies have tried to apply them to a larger sample with several units receiving the treatment, the procedure of inference for synthetic control methods is still not developed well. Therefore, in this subsection, we employed another econometric technique, namely, the instrumental variable estimator, to correct the bias in estimates caused by unobserved confounders, as well as by measurement errors in our measure of low-carbon city pilot projects.
Importantly, one point that needs particular attention is that the estimates in the impact of an event or policy, provided by the instrumental variable estimators, are a local average treatment effect, whose size is dependent on the choice of instrumental variables because the number of compliers is determined by the chosen instrumental variables. Some studies have reported that, in general, the instrumental variable estimates are larger than the corresponding ordinary least squares estimates, as well as that the magnitude of the former, on average, is nine times that of the latter [
35]. The statement from previous studies is consistent with our finding reported later.
We exploited the regional wave of the launch of the low-carbon city pilot project as a source of exogenous variation in low-carbon city pilot projects; that is, we instrumented our key independent variable of low-carbon city pilot projects using the number of cities launching the low-carbon city pilot project within one provincial administrative unit. Our reason why we used such an instrument variable is that the regional wave of low-carbon city pilot projects should be strongly related to the likelihood of launching a low-carbon city pilot project for cities in that province, but the former does not directly affect our key dependent variable of carbon emissions, although it is likely to have an indirectly impact on carbon emissions via our key independent variable of low-carbon city pilot projects.
We provided the results from the instrumental variable estimators in
Table 4, adjusted for different numbers of urban characteristics. This table is structured in two panels. In the top panel, we present the estimates of the impact of low-carbon city pilot projects on carbon emissions, along with their standard errors, which are robust against heteroskedasticity and serial correlation at the city level. In the bottom panel, we present the estimates of the impact of low-carbon city pilot projects on carbon emissions, along with their standard errors, which are robust against heteroskedasticity and serial correlation at the province level. In the bottom of the two panels, we reported the first-stage F-statistics. We found that all the F-statistics were higher than 10, which is a rule of thumb often used in an instrumental variable analysis, with a value higher than 10 indicating that the regional wave of low-carbon city pilot projects has a strong association with our key independent variable of low-carbon city pilot projects. This gives us confidence that our instrumental variable is not a weak one. To compare these results with the baseline ones, as well as with those from the treatment effect estimators, we made the specifications in each column of
Table 4 the same as those in the corresponding columns of
Table 1. Across all the specifications in
Table 4, we found a similar pattern, namely, that around the introduction of a low-carbon city pilot project, the average reduction in carbon emissions is about 8 percentage points, although Columns 5 and 6 reported a lower and higher reduction in carbon emissions, respectively. The magnitude of these estimates from the instrumental variable estimators is about 5 times that of those from the difference-in-differences estimator, as well as that from the treatment effects estimators. As we said earlier, it is not uncommon to see that the instrumental variable estimates have a higher magnitude than the corresponding ordinary least squares estimates in an empirical study. In addition, the difference in estimates between the instrumental variable estimator and the corresponding ordinary least squares estimator in our study is even smaller than the difference in estimates between an instrumental variable estimator and its corresponding ordinary least squares estimator found in the related literature on instrumental variables, with a ratio of estimates from the instrumental variable estimators to estimates from the corresponding ordinary least squares estimates about 5 for the former and about 9 for the latter.
Taken together, the instrumental variable estimates further boost our confidence that our results might not be caused by chance, and that low-carbon city pilot projects do have a positive impact on the reduction in carbon emissions. As we have seen, the instrumental variable estimators only change the magnitude of the estimates of the impact of low-carbon city pilot projects on carbon emissions, but do not change the direction of the estimates, relative to the estimates from baseline models. Thus, in the following heterogeneity analysis, we focused on the preferred specification in Column 6 of
Table 1, employing difference-in-differences estimators to do it. In other words, instrumental variable estimates reported in this subsection serve as a check of robustness.
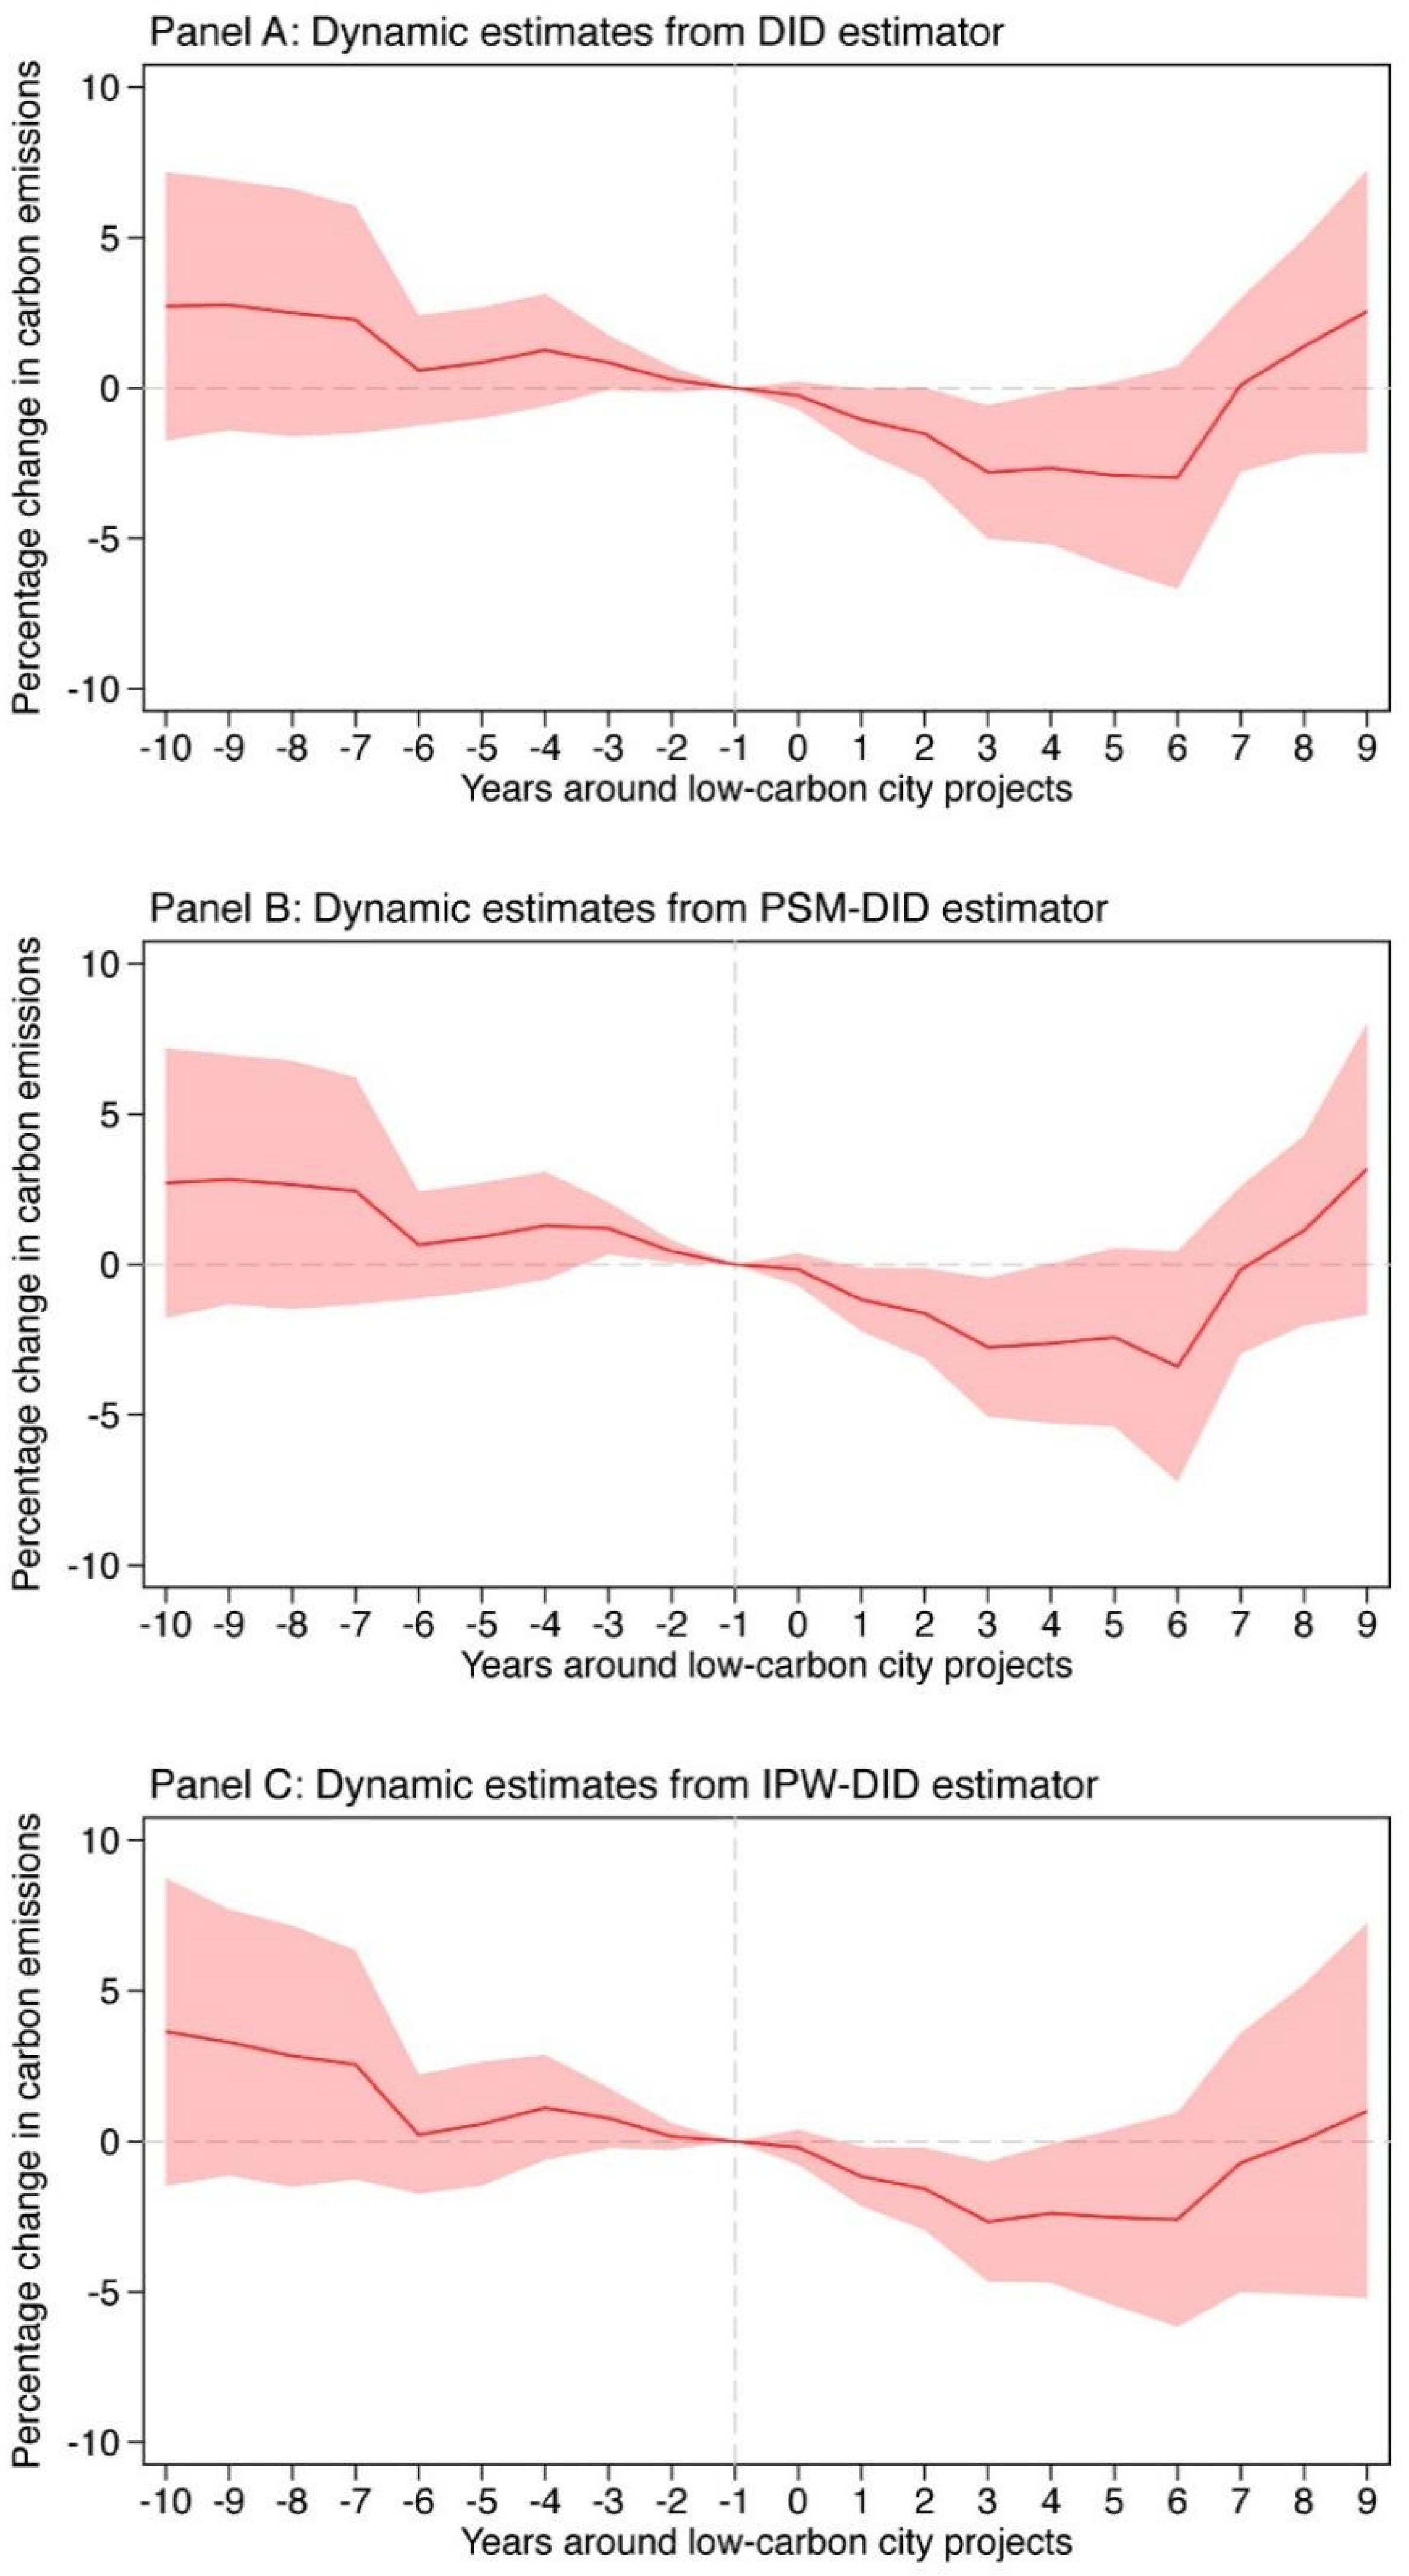
Tests for parallel trends assumption: We conducted event studies to investigate the evolution of the trends in carbon emissions in the treated group and the control group. This analysis allows us to check whether their trends are similar before an introduction of the low-carbon city pilot project. By the way, we explored the dynamic paths of carbon emissions after an introduction of the low-carbon city pilot project, which helps us check whether low-carbon city pilot projects have an instantaneous impact on carbon emissions, as well as whether it persistently affects carbon emissions.
Figure 1 plots our findings. This figure is structured in three panels. In the top panel, we depicted the estimates of the dynamic impacts of low-carbon city pilot projects on carbon emissions obtained from our preferred specification by fitting a difference-in-differences estimator, along with their 95% confidence intervals constructed using standard errors robust against heteroskedasticity and serial correlation at the province level. In the middle panel, we depicted the estimates of the dynamic impacts of low-carbon city pilot projects on carbon emissions obtained from our preferred specification by fitting a propensity-score-matching difference-in-differences estimator, along with their 95% confidence intervals, constructed using standard errors robust against heteroskedasticity and serial correlation at the province level. In the bottom panel, we depicted the estimates of the dynamic impacts of low-carbon city pilot projects on carbon emissions obtained from our preferred specification by fitting an inverse-probability-weighting difference-in-differences estimator, along with their 95% confidence intervals, constructed using standard errors robust against heteroskedasticity and serial correlation at the province level. In each panel, the red line represents the estimate in dynamic impacts of low-carbon city pilot projects on carbon emissions, while the red shadow represents their 95% confidence intervals, with the values of years equal to 0 corresponding to the year of launch of the low-carbon city pilot project.
Across the three figures, we found a similar pattern in the dynamics of carbon emissions; that is, before an introduction of the low-carbon city pilot project, although the difference in trends in carbon emissions between the treated group and the control group exhibits a slightly downward trend, all the coefficients are statistically insignificant, implying that the parallel trends assumption could be reasonable if the low-carbon city pilot project was not launched. However, we observed that after an introduction of the low-carbon city pilot project, carbon emissions in the treated group have a clear decrease during the first periods, while during the last periods those in the treated group have a remarkable increase, indicating that low-carbon city pilot projects might have an instantaneous negative impact on carbon emissions but do not persistently reduce carbon emissions. In contrast, carbon emissions in cities that have launched a low-carbon city pilot project possibly rebound in the long run. Future research is needed to investigate whether there exists such a rebound effect.
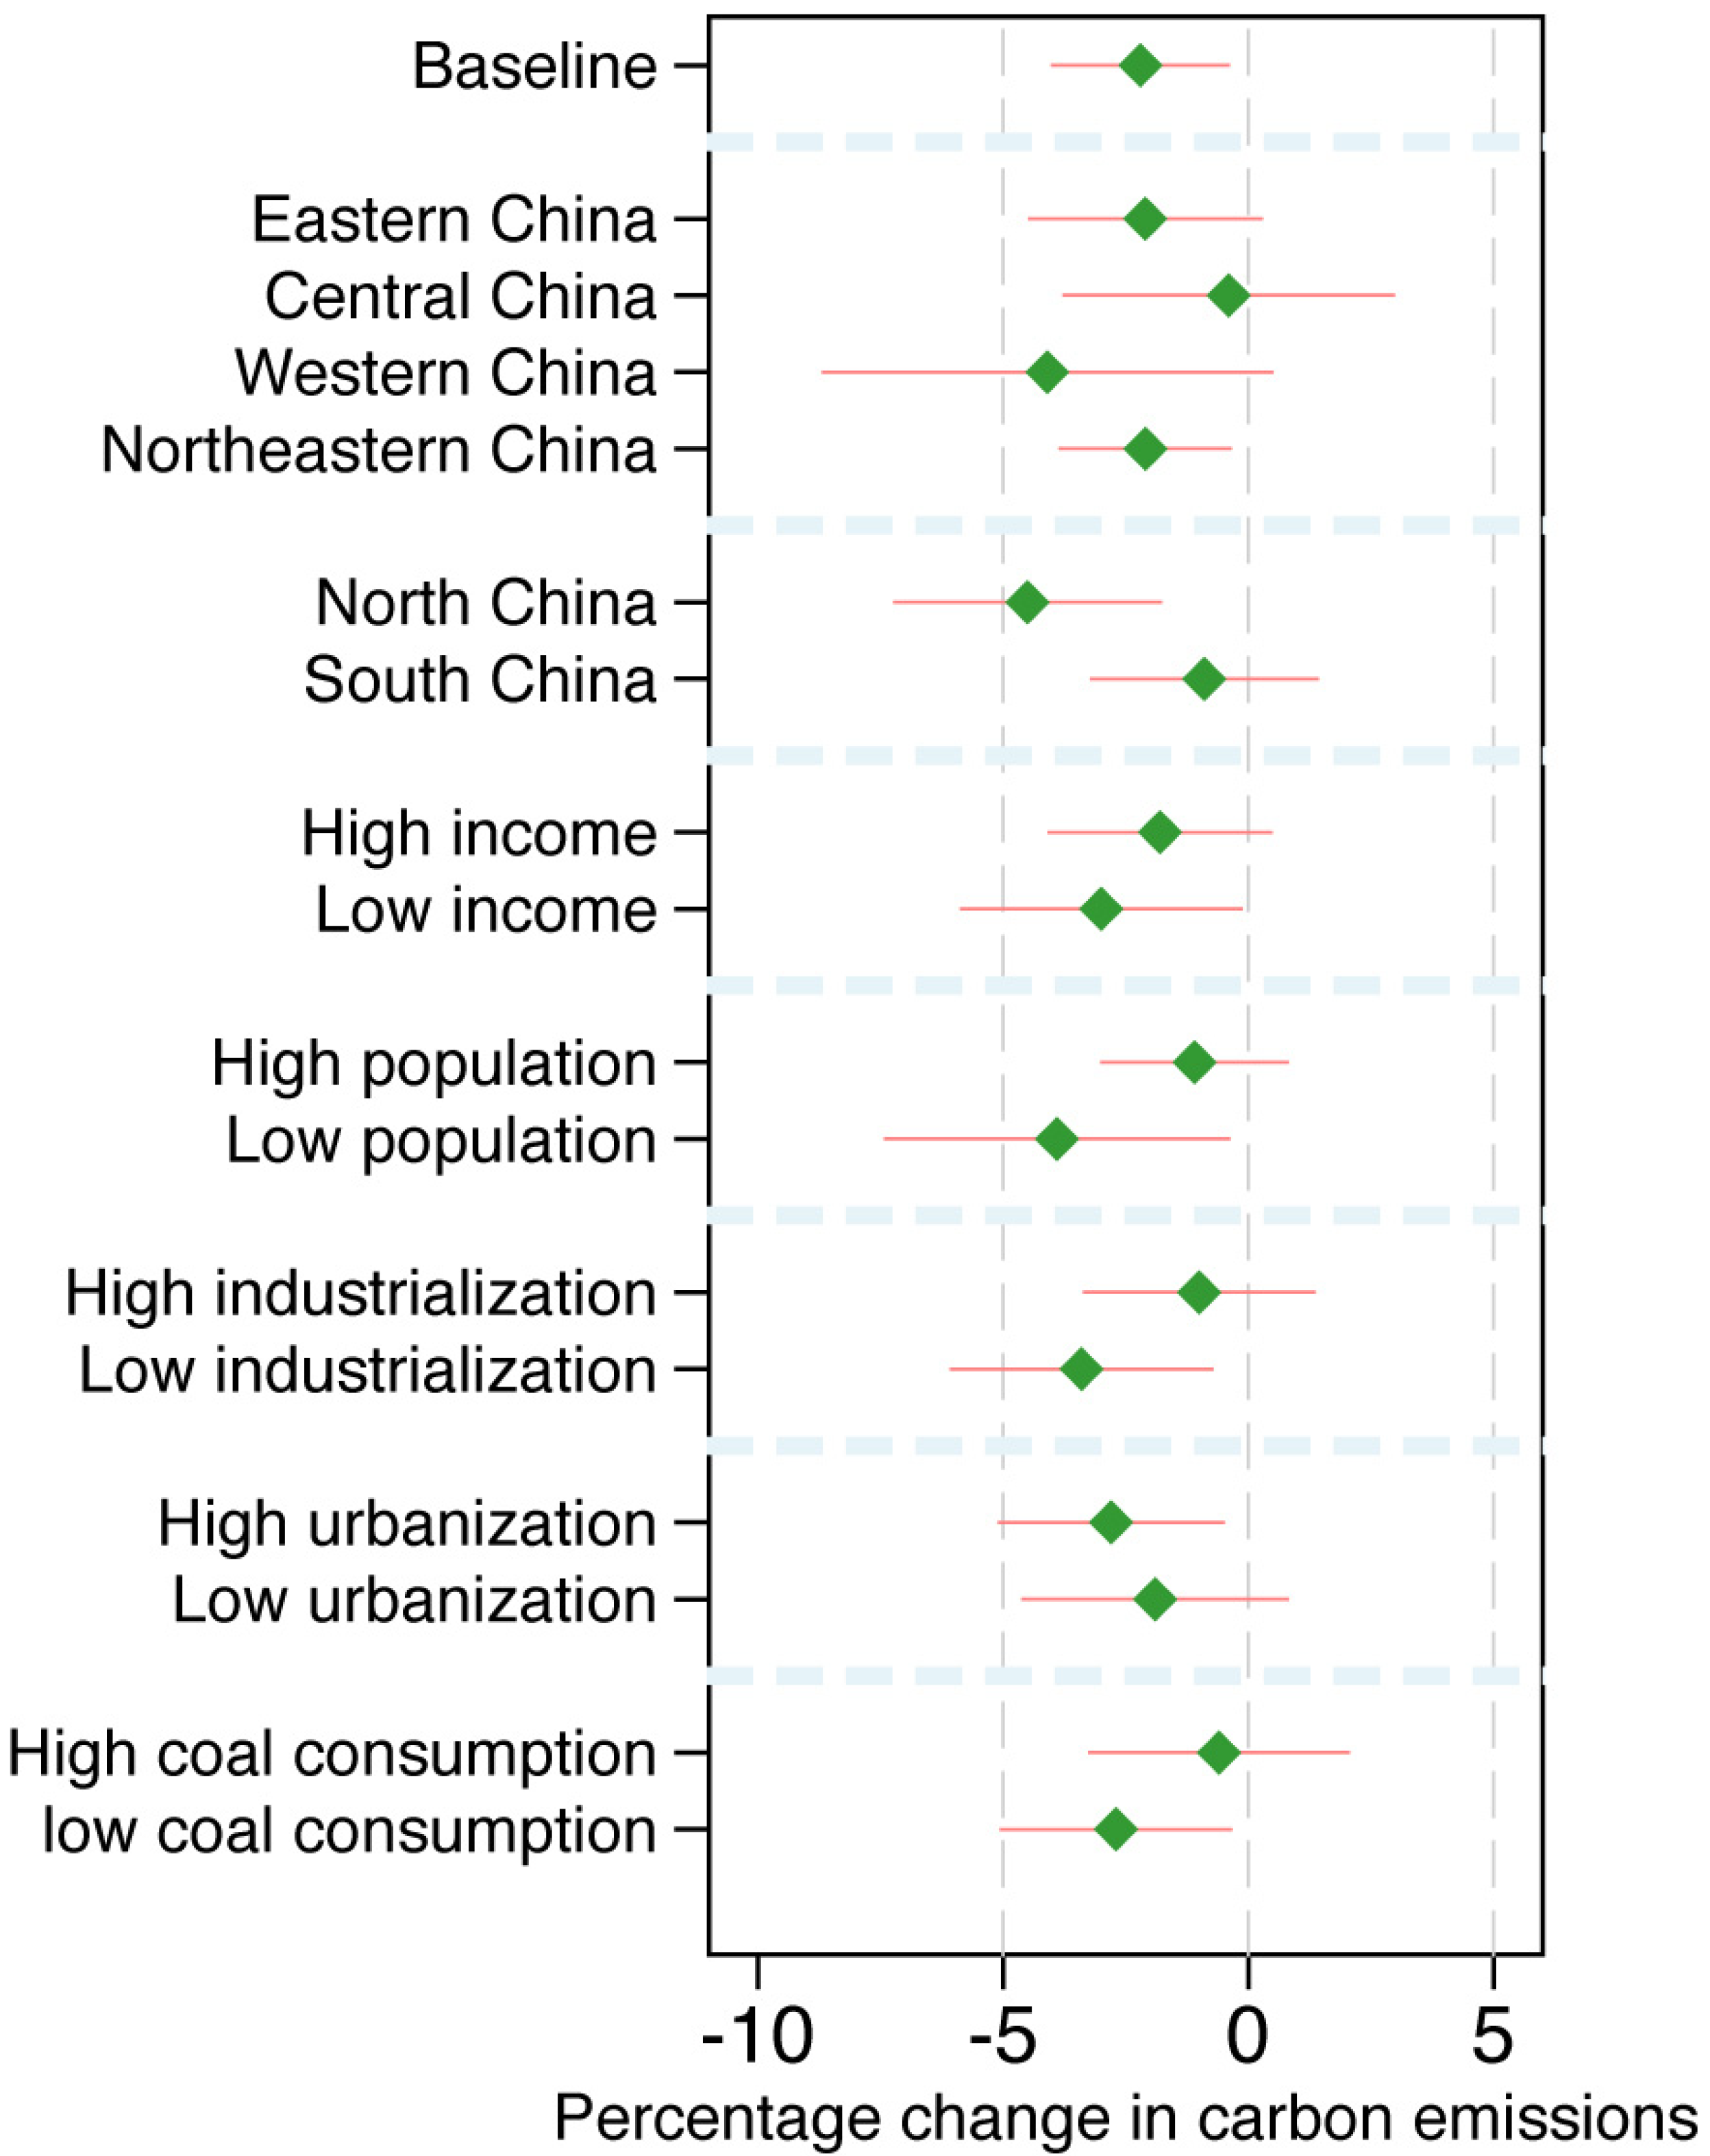
Heterogeneity analysis: In
Figure 2, we investigated whether the impact of low-carbon city pilot projects on carbon emissions varied across different urban characteristics. Note that the analysis of heterogenous impacts does not have a causal interpretation, but it is beneficial for us to understand the potential channels via which low-carbon city pilot projects had an impact on carbon emissions.
First, we grouped cities into four geographic regions according to the classification of the Nation Bureau of Statistics of China. These regions are Eastern China, Central China, Western China, and Northeastern China. We also use the Qinling-Mountain–Huai-River line, which is often used by Chinese geographers to distinguish between North China and South China, to divide the total cities in our sample into two geographic regions, the North and the South. The top section of
Figure 2 reports our findings. We observed that the impact was the largest in Western China, followed by Eastern China and Northeastern China, while it was the smallest in Central China. We also found that the low-carbon city pilot projects had a larger impact on carbon emissions in North China than in South China.
In the middle section of
Figure 2, we examined the impact of the heterogeneity corresponding to income per person and urban population. We found that the impact of low-carbon city pilot projects on carbon emissions was larger in cities with lower income per person and a smaller population size.
Finally, the bottom section of
Figure 2 shows that, in these cities that are more heavily dependent on industrial activities and have a higher level of urbanization, the impact of low-carbon city pilot projects on carbon emissions is more substantial.
In short, the results from the heterogeneity analysis suggest that the impact that low-carbon city pilot projects have on carbon emissions is not evenly distributed across different types of cities.


