Article

Reactivity and Loss Mechanisms of NO3 and N2O5 at a Rural Site on the North China Plain

1
Anhui Institute of Optics and Fine Mechanics, Key Laboratory of Environmental Optics and Technology, Chinese Academy of Sciences, Hefei 230031, China
2
School of Mathematics and Physics, Anhui University of Technology, Maanshan 243032, China
3
CAS Center for Excellence in Regional Atmospheric Environment, Institute of Urban Environment, Chinese Academy of Sciences, Xiamen 361000, China
4
School of Mechanical Engineering, Suzhou University of Science and Technology, Suzhou 215009, China
5
State Key Laboratory of Mining Response and Disaster Prevention and Control in Deep Coal Mines, Anhui University of Science and Technology, Huainan 232001, China
*
Authors to whom correspondence should be addressed.
Atmosphere 2022, 13(8), 1268; https://doi.org/10.3390/atmos13081268
Submission received: 30 June 2022 / Revised: 26 July 2022 / Accepted: 27 July 2022 / Published: 10 August 2022
(This article belongs to the Section Air Quality and Human Health)

Abstract

:
NO3, NO2, O3, and relevant parameters were measured at a rural site on the North China Plain during June 2014. During the campaign, the average concentrations of NO3 and N2O5 were 4.8 ± 3.3 pptv and 30.5 ± 35.4 pptv, respectively. The average NO3 production rate was 1.03 ± 0.48 ppbvh−1, and the steady-state lifetimes of NO3 and N2O5 were 26 s and 162 s, respectively, indicating that the NOx chemistry in the rural site during summer was active. The uptake coefficient range of N2O5 was 0.023 to 0.118, with an average value of 0.062 ± 0.035. Meanwhile, the fitting for kNO3 was 0.013 ± 0.016 s−1, corresponding to the shorter NO3 lifetime below 1 min. The results show that the indirect loss pathways caused by the heterogonous uptake of N2O5 contributed 64–90% of the overall NO3 loss, with an average of 81%, suggesting that the N2O5 heterogeneous reaction dominated the nocturnal NOx loss over this region.

1. Introduction

The nitrate radical (NO3) and dinitrogen pentoxide (N2O5) are important reactive nitrogen species with regard to their nighttime chemistry. They play an important role in the nocturnal atmospheric chemistry, which controls the oxidation and removal of various trace gases [1]. O3 reacts with NO2 to form NO3 (Equation (1)), and N2O5 is formed by the reaction of NO3 with NO2 (Equation (2)), which is in temperature-dependent equilibrium with NO3 (Equation (3)) [2].
NO2 + O3 → NO3 + O2
NO2 + NO3+ M → N2O5 + M
N2O5+ M → NO2 + NO3+ M
NO3 occurs during photolysis during the day and is accumulated only at night (up to several hundred pptv). The rapid reaction with NO is another important sink of NO3 besides photolysis [3]. NO3 can oxidize and remove certain volatile organic compounds (VOCs) and sulfides, and its oxidation ability even exceeds that of the daytime OH radical [4]. The terpenes released by natural plants react quickly with the NO3 radical to form organic nitrate esters, which contributes to the formation of secondary organic aerosol (SOA) [5].
The heterogeneous hydrolysis of N2O5 forms soluble nitrate (Equation (4)), and heterogeneously reacts with Cl to form ClNO2 and nitrate (NO3) (Equation (5)). The rate coefficient of the heterogeneous uptake of N2O5 is determined by Equation (6) [6]:
N2O5 + H2O(l) → 2HNO3
N2O5 + Cl(aq) → ClNO2 + NO3(aq)
kN2O5 = 0.25 cSaγN2O5
where kN2O5 is the rate coefficient of the heterogeneous uptake of N2O5 and c is the mean molecular velocity of N2O5. Here, Sa represents the particle surface area and γN2O5 is the N2O5 uptake coefficient.
High mixing ratios of NO3 and N2O5 have been observed in different environments, such as the Pearl River Delta [7], the North China Plain [8], and Hong Kong [9]. Studies have found that NO3 and N2O5 have the characteristics of strong seasonality and regionality [10,11,12]. The initial studies on NO3 mainly focused on its direct and indirect loss pathways [13,14]. Observations and model simulations have been used to study the heterogeneous N2O5 uptake, which is an important pathway of NOX loss [15]. The N2O5 uptake coefficients in different environmental conditions were obtained to evaluate NOX loss [16] and the contribution of nocturnal NO3 to the formation of secondary organic aerosol has been studied [17]. In recent years, to investigate the nocturnal chemical processes of NOx, some field observations have been carried out in China. However, comprehensive field studies of N2O5 and NO3 simultaneously have been relatively rare at rural sites on the North China Plain. On account of the importance of NO3 and N2O5 in nocturnal atmospheric chemistry, it is of great interest to investigate the nocturnal chemical processes of NOx in the North China Plain.
In this study, self-developed cavity ring down spectroscopy (CRDS) was applied for the 2014 CAREBEIJING-NCP field experimental observation in summer (Wangdu, China). We report on observations of NO3, N2O5, and relevant species. The factors influencing the production rate and lifetimes of NO3 and N2O5 were deeply analyzed. In addition, heterogeneous N2O5 uptake coefficient was estimated and the loss mechanisms of NO3 and N2O5 were further studied over this region during the summer time.

2. Method

2.1. Site Description

Cavity ring-down spectroscopy (CRDS) was applied for the Campaigns of Air Pollution Research in Megacity Beijing and North China Plain (CAREBEIJING-NCP) in Wangdu County, Hebei Province (38.665° N, 115.204° E) from 10 June to 6 July 2014, which was 170 km southwest of Beijing (Figure 1). The site was surrounded by crops, near the S032 and G4 expressways. The CRDS instrument was located on the fourth floor of the building, approximately 10 m above the ground (sample tubes of 1.1 m). As the measurement site was close to the national road, the NO3 radical measurement results were susceptible to interference from vehicle emissions. During the observation period, northeasterly winds and easterly winds (from the direction of the G4 national highway) prevailed and the wind speed was relatively high, with a maximum wind speed of 26.5 m/s and an average wind speed of about 4.2 m/s (Figure 2).

2.2. Instruments

The principles of the CRDS instrument have been described previously [18,19]. The same CRDS instrument was applied in Wangdu, Hebei Province. The light from the laser diode with a center wavelength of 661.85 nm was coupled to an optical cavity. The cavity was formed using a pair of high-reflectivity mirrors (R ≥ 99.9985%). The light transmitted through the back mirrors was detected by a photomultiplier tube and then the signals were digitized using an oscilloscope card controlled by the LabVIEW program. The 1500 decay profiles were co-added to achieve a higher signal/noise ratio. Then, the decay trace was fitted by the Levenberg–Marquardt algorithm to obtain the ring-down time. The CRDS instrument was located approximately 10 m above the ground. The sample tubes of the CRDS instrument equaled 1.1 m and the sampling flow was 5 standard liters per minute. The detection limit of the NO3 radical determined by Allan variance was approximately 1.6 pptv (1σ, 10 s). The uncertainty for NO3 was about ±8%.
The relevant trace gases were measured simultaneously during the field observations. N2O5 was observed using a chemical ionization mass spectrometer (THS Instruments, Atlanta), and the detection limit was 7 pptv (3σ, 1 min). NO and NO2 were obtained using a chemiluminescence analyzer (Thermo Fisher 42i, Waltham, MA, USA). O3 was observed using an ultraviolet (UV) absorption analyzer (0.5 ppbv, 1 min). The meteorological parameters, including the wind direction, wind speed, relative humidity (RH), and temperature, were observed using an ultrasonic anemometer and a weather station, which were located 10 m above the ground. The aerosol surface (Sa) was obtained using a scanning mobility particle sizer (SMPS) and aerodynamic particle sizer (TSI-type APS model 3321).

3. Results and Discussion

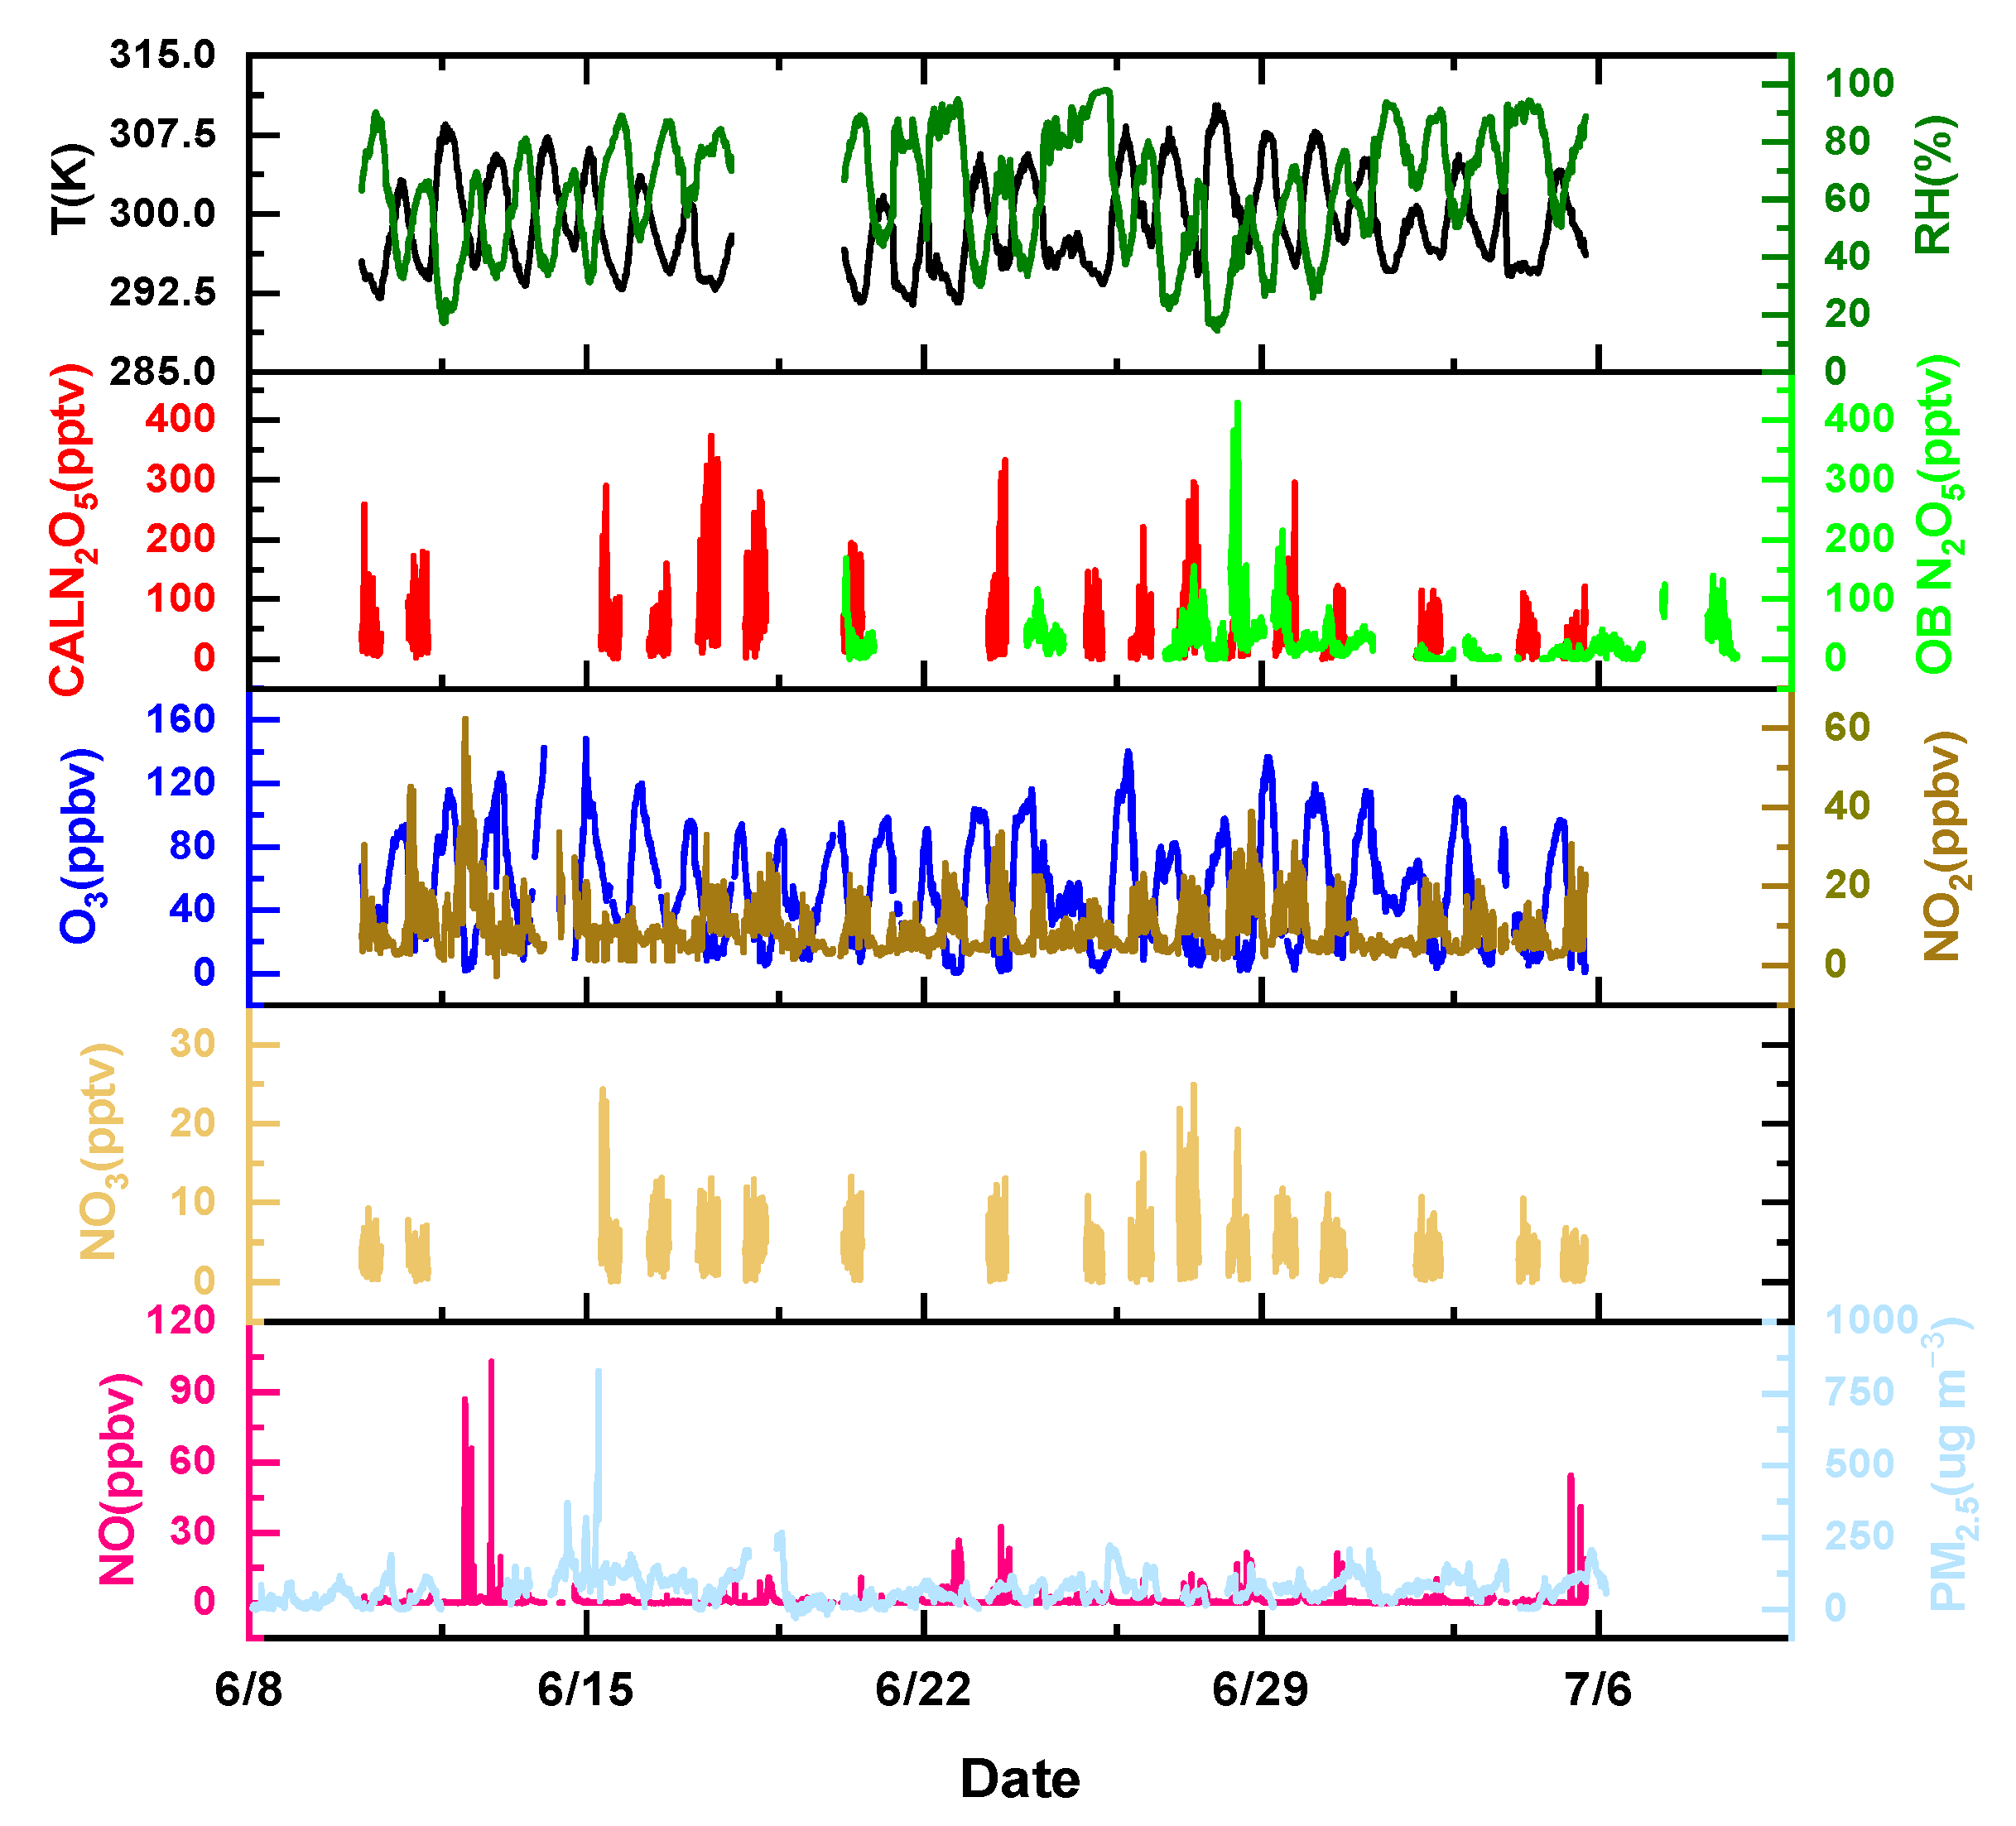
3.1. Overview of Measurements

During the measurement period, the temperature and RH showed an obvious diurnal variation trend, and the variation trend was obviously opposite. When the atmospheric temperature was low at night, the RH reached the maximum. During the day, the temperatures peak around noon. During the observation period, the RH levels varied from 14% to 98%, and the average humidity was 62.7%. At the same time, the temperatures were higher, with an average temperature of 299.2 K, indicating that the whole campaign was conducted in high-temperature and -humidity environments.
The time series of NO3 concentrations observed using the CRDS instrument and the relevant parameters is shown in Figure 3. During the observation period from June 10th to 6 July, the NO3 nocturnal concentration varied from 0 to 25 pptv, and the average nocturnal concentration was about 4.8 ± 3.3 pptv. The highest NO3 nocturnal concentration reached 25 pptv on 15 June and 27 June. There were prevailing northeasterly winds and easterly winds during the measurement period, and the measurement site was close to the national road and easily affected by local sources of vehicle emissions, which may have contributed to the relatively low NO3 concentrations. The O3 concentrations showed obvious periodicity, with peak concentration occurring around 16:00, with a maximum of 140 ppbv, which decreased to the detection limit after midnight. The O3 concentrations were relatively high during the whole observation period, with an average concentration of 54 ppbv, which implied intense photochemical reactions during the observations. The NO2 concentrations showed an inverse correlation with O3, with an average value of 9.6 ppbv. During the measurement period, due to the influence of automobile emission sources, The NO concentrations were relatively high and several instantaneous peaks appeared during the observation period.
Here, the mixing ratio of N2O5 can be calculated using Equation (7). During the whole nocturnal observation period from June 10th to July 6th, the calculated N2O5 concentrations were relatively high, with a maximum of 374 pptv, which mainly attributed to the high mixing ratio of NO3 and NO2. The mixing ratio of observed N2O5 was measured via CIMS, which showed a high concentration during the period of 27 June to 29 June, with a maximum concentration of 429 pptv. The average concentration of observed N2O5 was 30.5 ± 35.4 pptv.
[N2O5] = Kep [NO2][NO3]
P(NO3) = kNO2+O3 [NO2][O3]
where kNO2+O3 is the rate constant for the reaction of NO2 with O3 and Kep is the equilibrium constant dependent on the temperature.

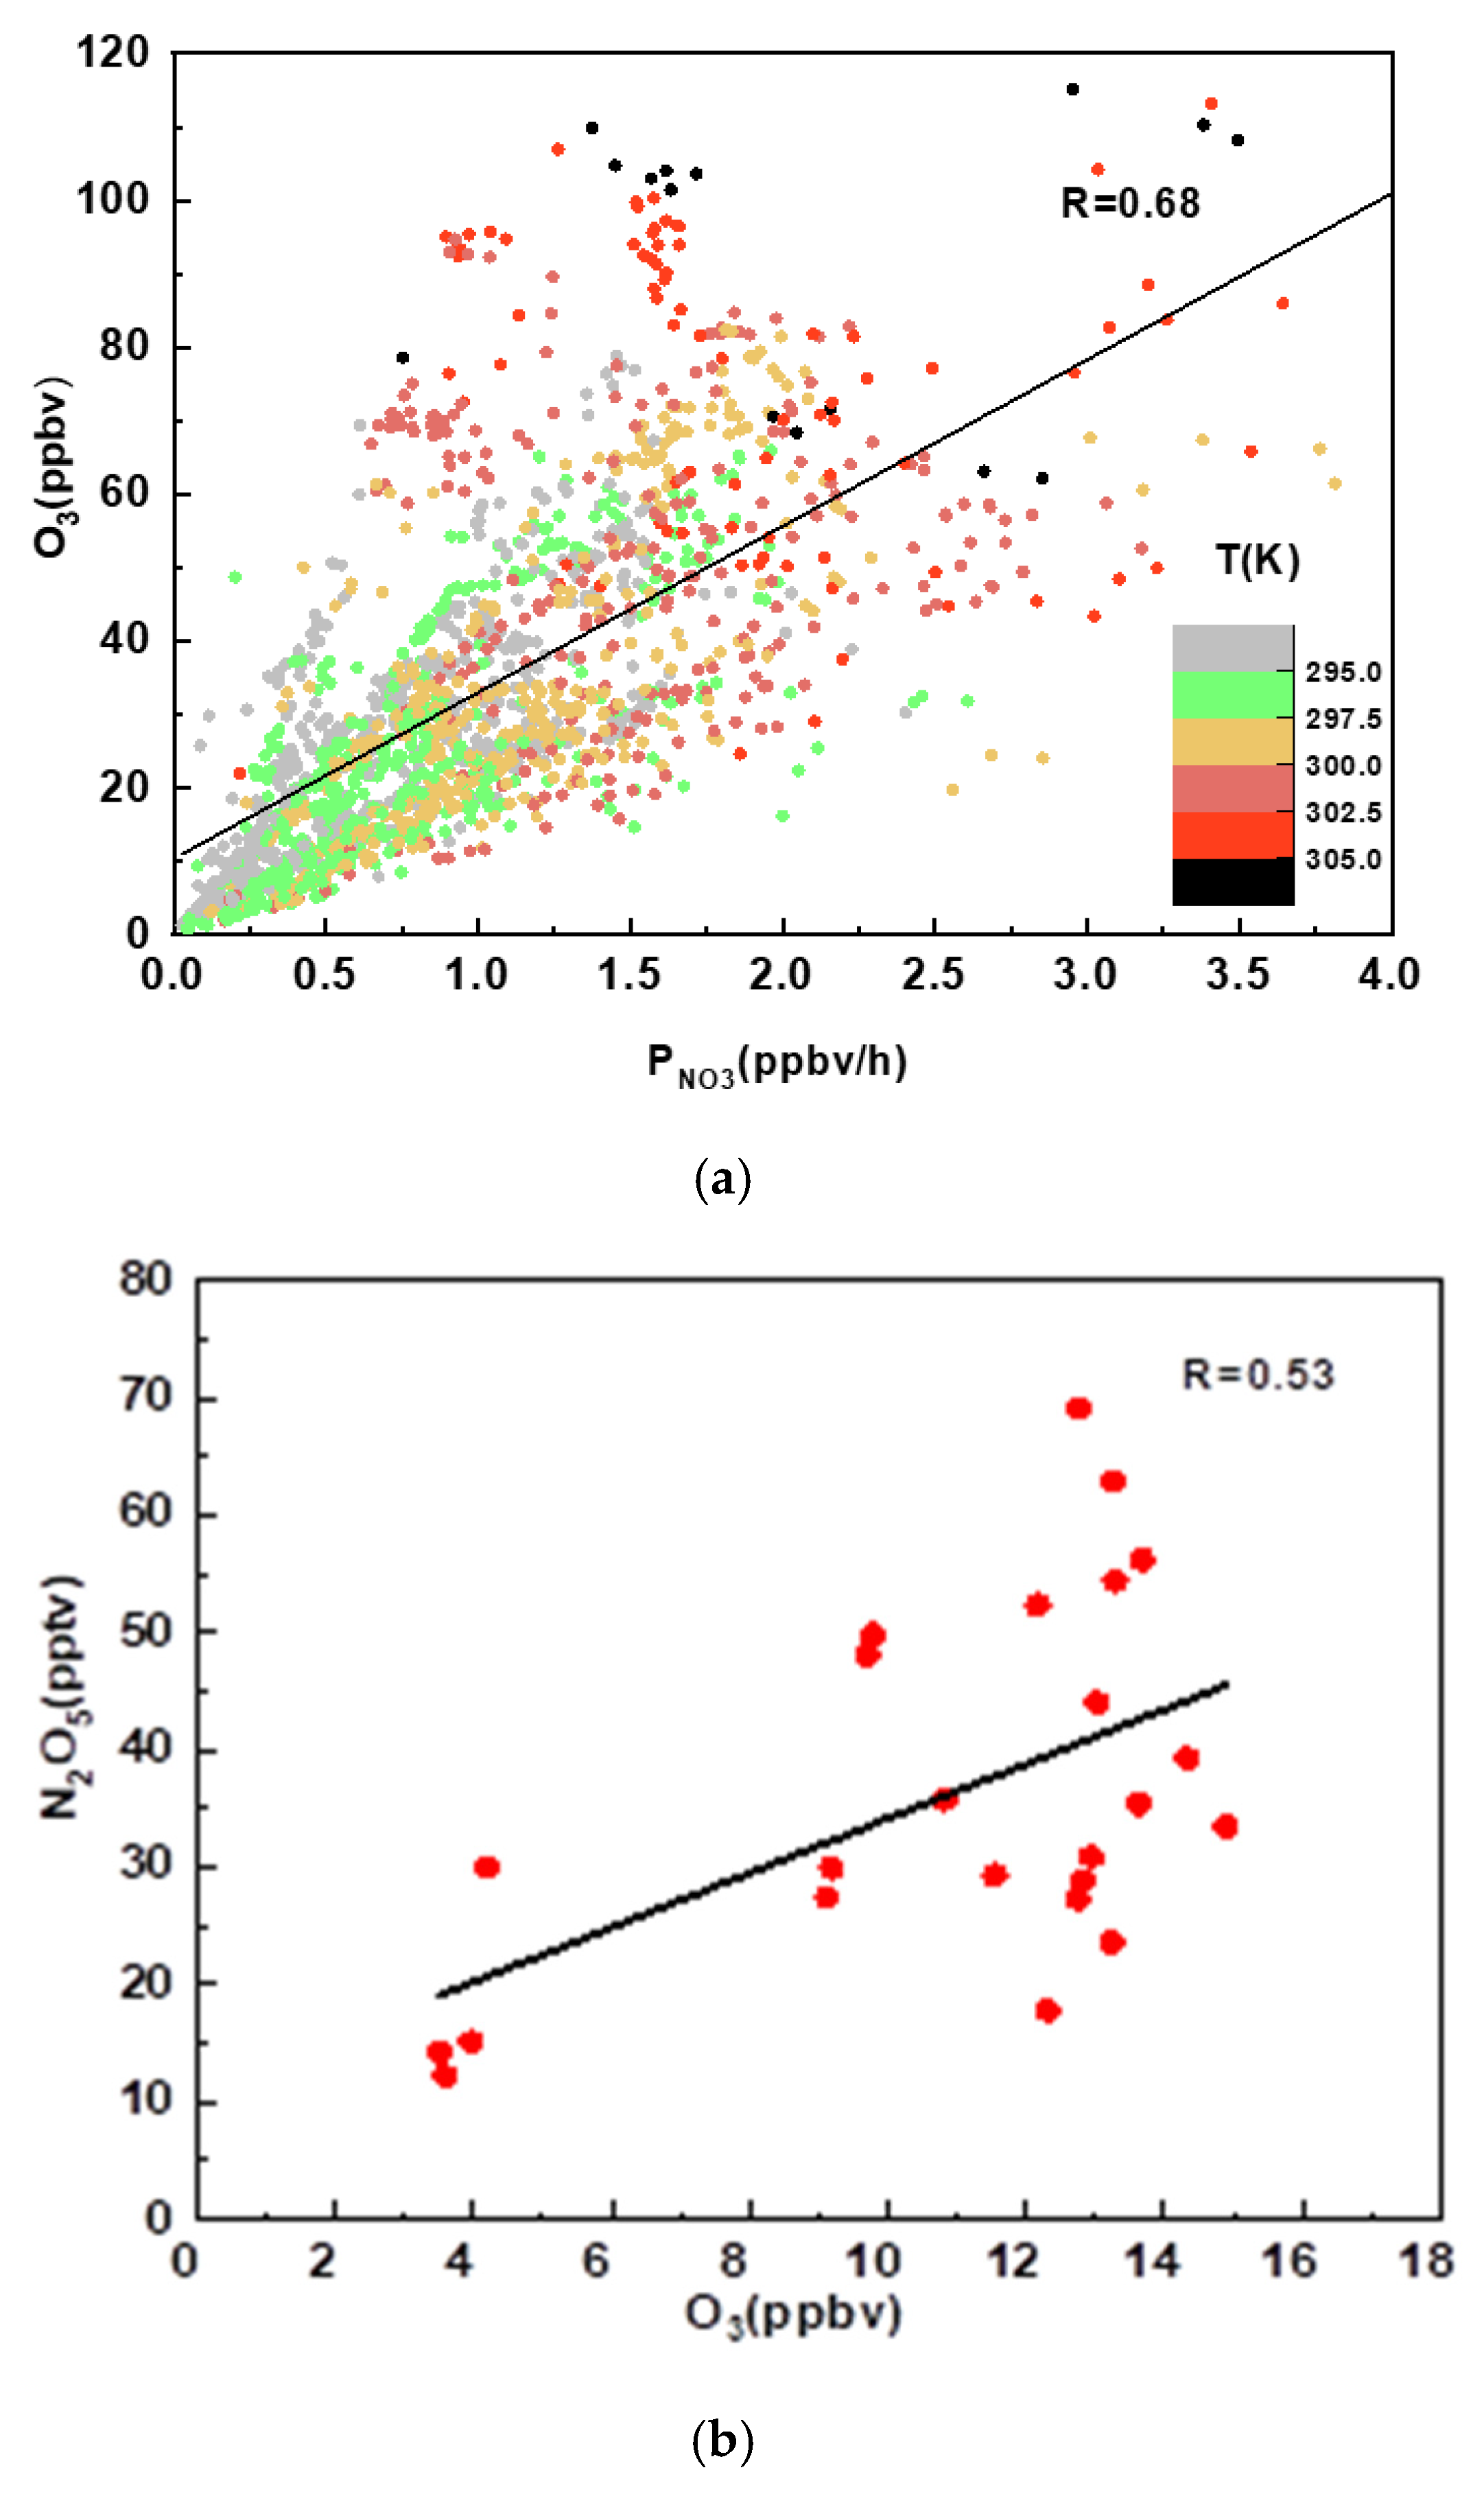
3.2. NO3 Production Rate and N2O5

Figure 4a shows the nocturnal profiles for the temperature, humidity, PM2.5, PM10, and Sa. During the nighttime period, the average temperature was 298 K and the maximum temperature appeared at 18:30. The nocturnal humidity increased gradually, with an average value of 68%. The PM2.5 concentration was lower, below 50 μgm−3. Sa also presented a steadily rising trend, with an average value of 1687 μm2cm−3.
The NO3 production rate (P(NO3)) was calculated using Equation (8) [20]. The mean nocturnal variations of NO2, O3, N2O5, and P(NO3) are shown in Figure 4b. During the nighttime period, the average concentrations of O3 and NO2 were 41.1 ± 24.1 ppbv and 10.9 ± 3.6 ppbv, respectively. The NO2 and O3 were highly inversely correlated. The O3 concentrations decreased after sunset, while the NO2 concentrations slightly increased. The P(NO3) showed a similar trend with O3, and was mainly affected by the O3 variation. The peak of P(NO3) appeared at 19:00–20:00 (an hour after the ozone peak), reaching 2.09 ppbvh−1. The value for P(NO3) was 1.03 ± 0.48 ppbvh−1, which was slightly lower than that observed on a tower in Seoul (1.3 ppbvh−1) [21] and in Beijing (1.2 ppbvh−1) [22]. The average nighttime P(NO3) value was slightly larger than that at a suburban site in Taizhou (1.01 ppbvh−1) [17]. The comparison showed the significant oxidation capacity of NO3 in Wangdu County.
The linear correlation coefficient between P(NO3) and O3 is plotted in Figure 5a. The average temperature was 297.7 K during the nighttime period, and the high temperature promoted NO3 formation. The higher the temperature, the higher the P(NO3), as shown in Figure 5a, which illustrated that the temperature was one of the main factors controlling the NO3 formation. The other two factors, NO2 and O3, also determined the P(NO3). The linear correlation coefficient between P(NO3) and O3 was 0.68, which was higher than for NO2 (R = 0.06). The N2O5 concentration also showed a clear positive dependence on O3 (Figure 5b). This result may imply that the P(NO3) and N2O5 concentrations mainly varied with the O3 concentrations, which could partly explain why O3 varied more rapidly than NO2 during the observation period.
During the measurement period, the mean nocturnal variations of the calculated N2O5 and observed N2O5 showed the same trend and their concentrations were basically consistent before midnight, with the large discrepancy shown after midnight. After midnight, the humidity was above 70 percent, which accelerated the heterogeneous hydrolysis of N2O5. The discrepancy between the calculated N2O5 and observed N2O5 was mainly ascribed to the heterogonous uptake of N2O5. The observed N2O5 concentration gradually increased after sunset, peaking near 22:30. After 00:00, P(NO3) and N2O5 decreased simultaneously, suggesting that the low concentration of N2O5 was partly attributed to the lack of NO3 formation.

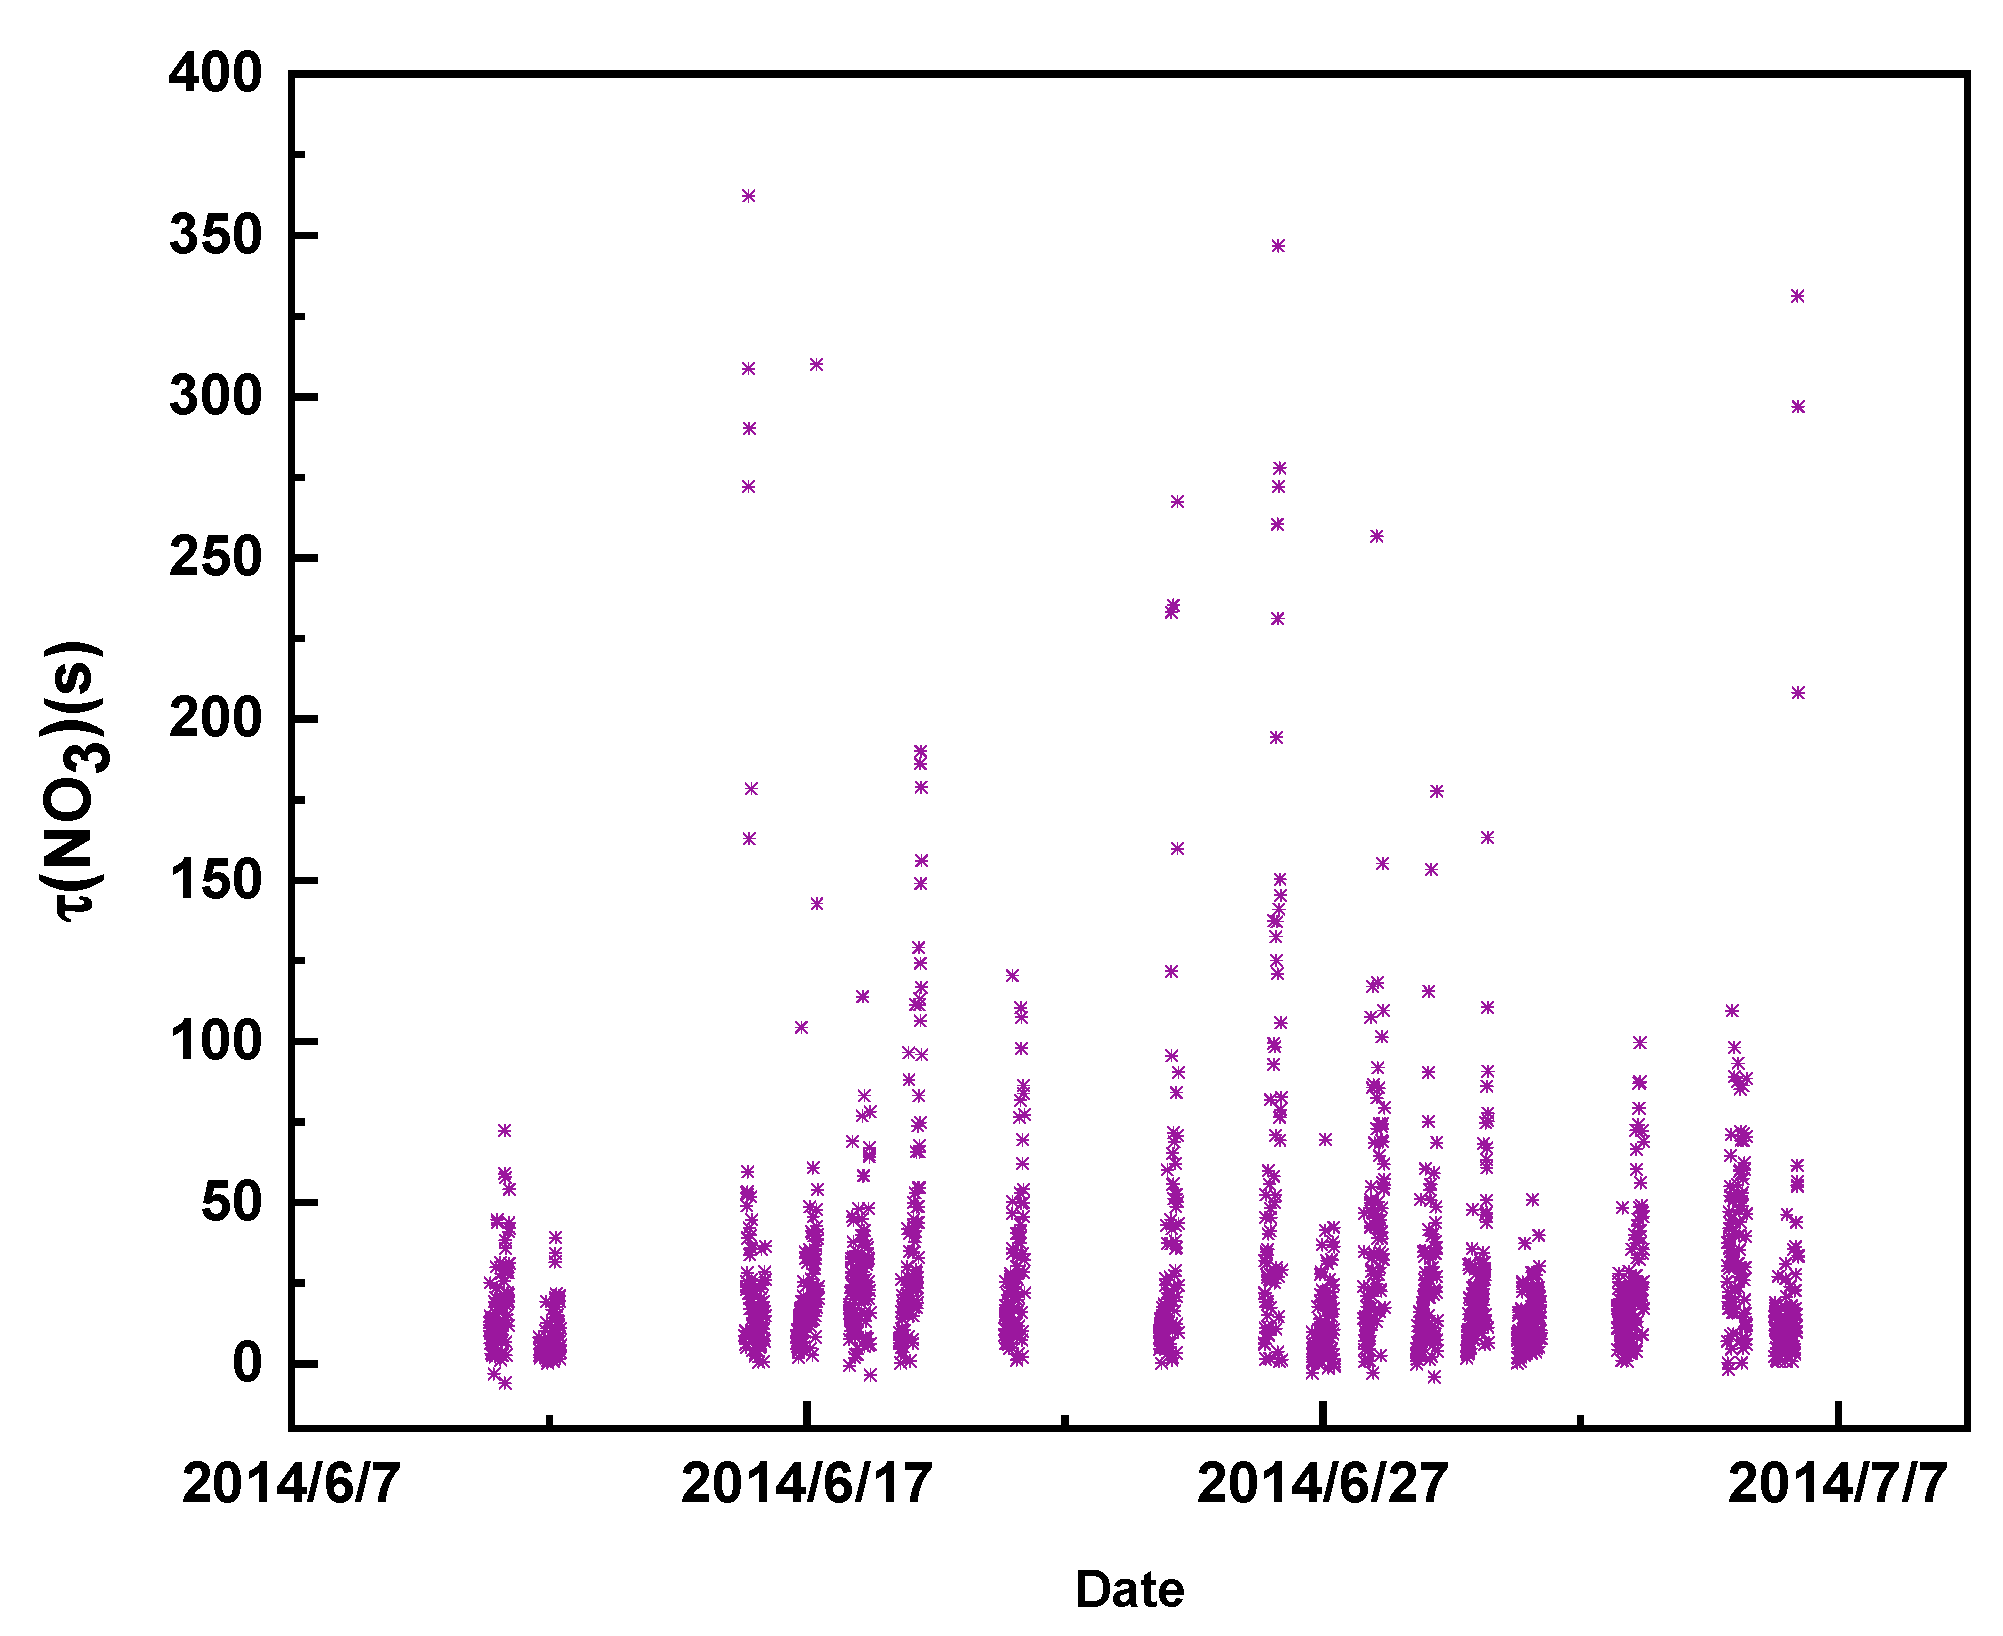
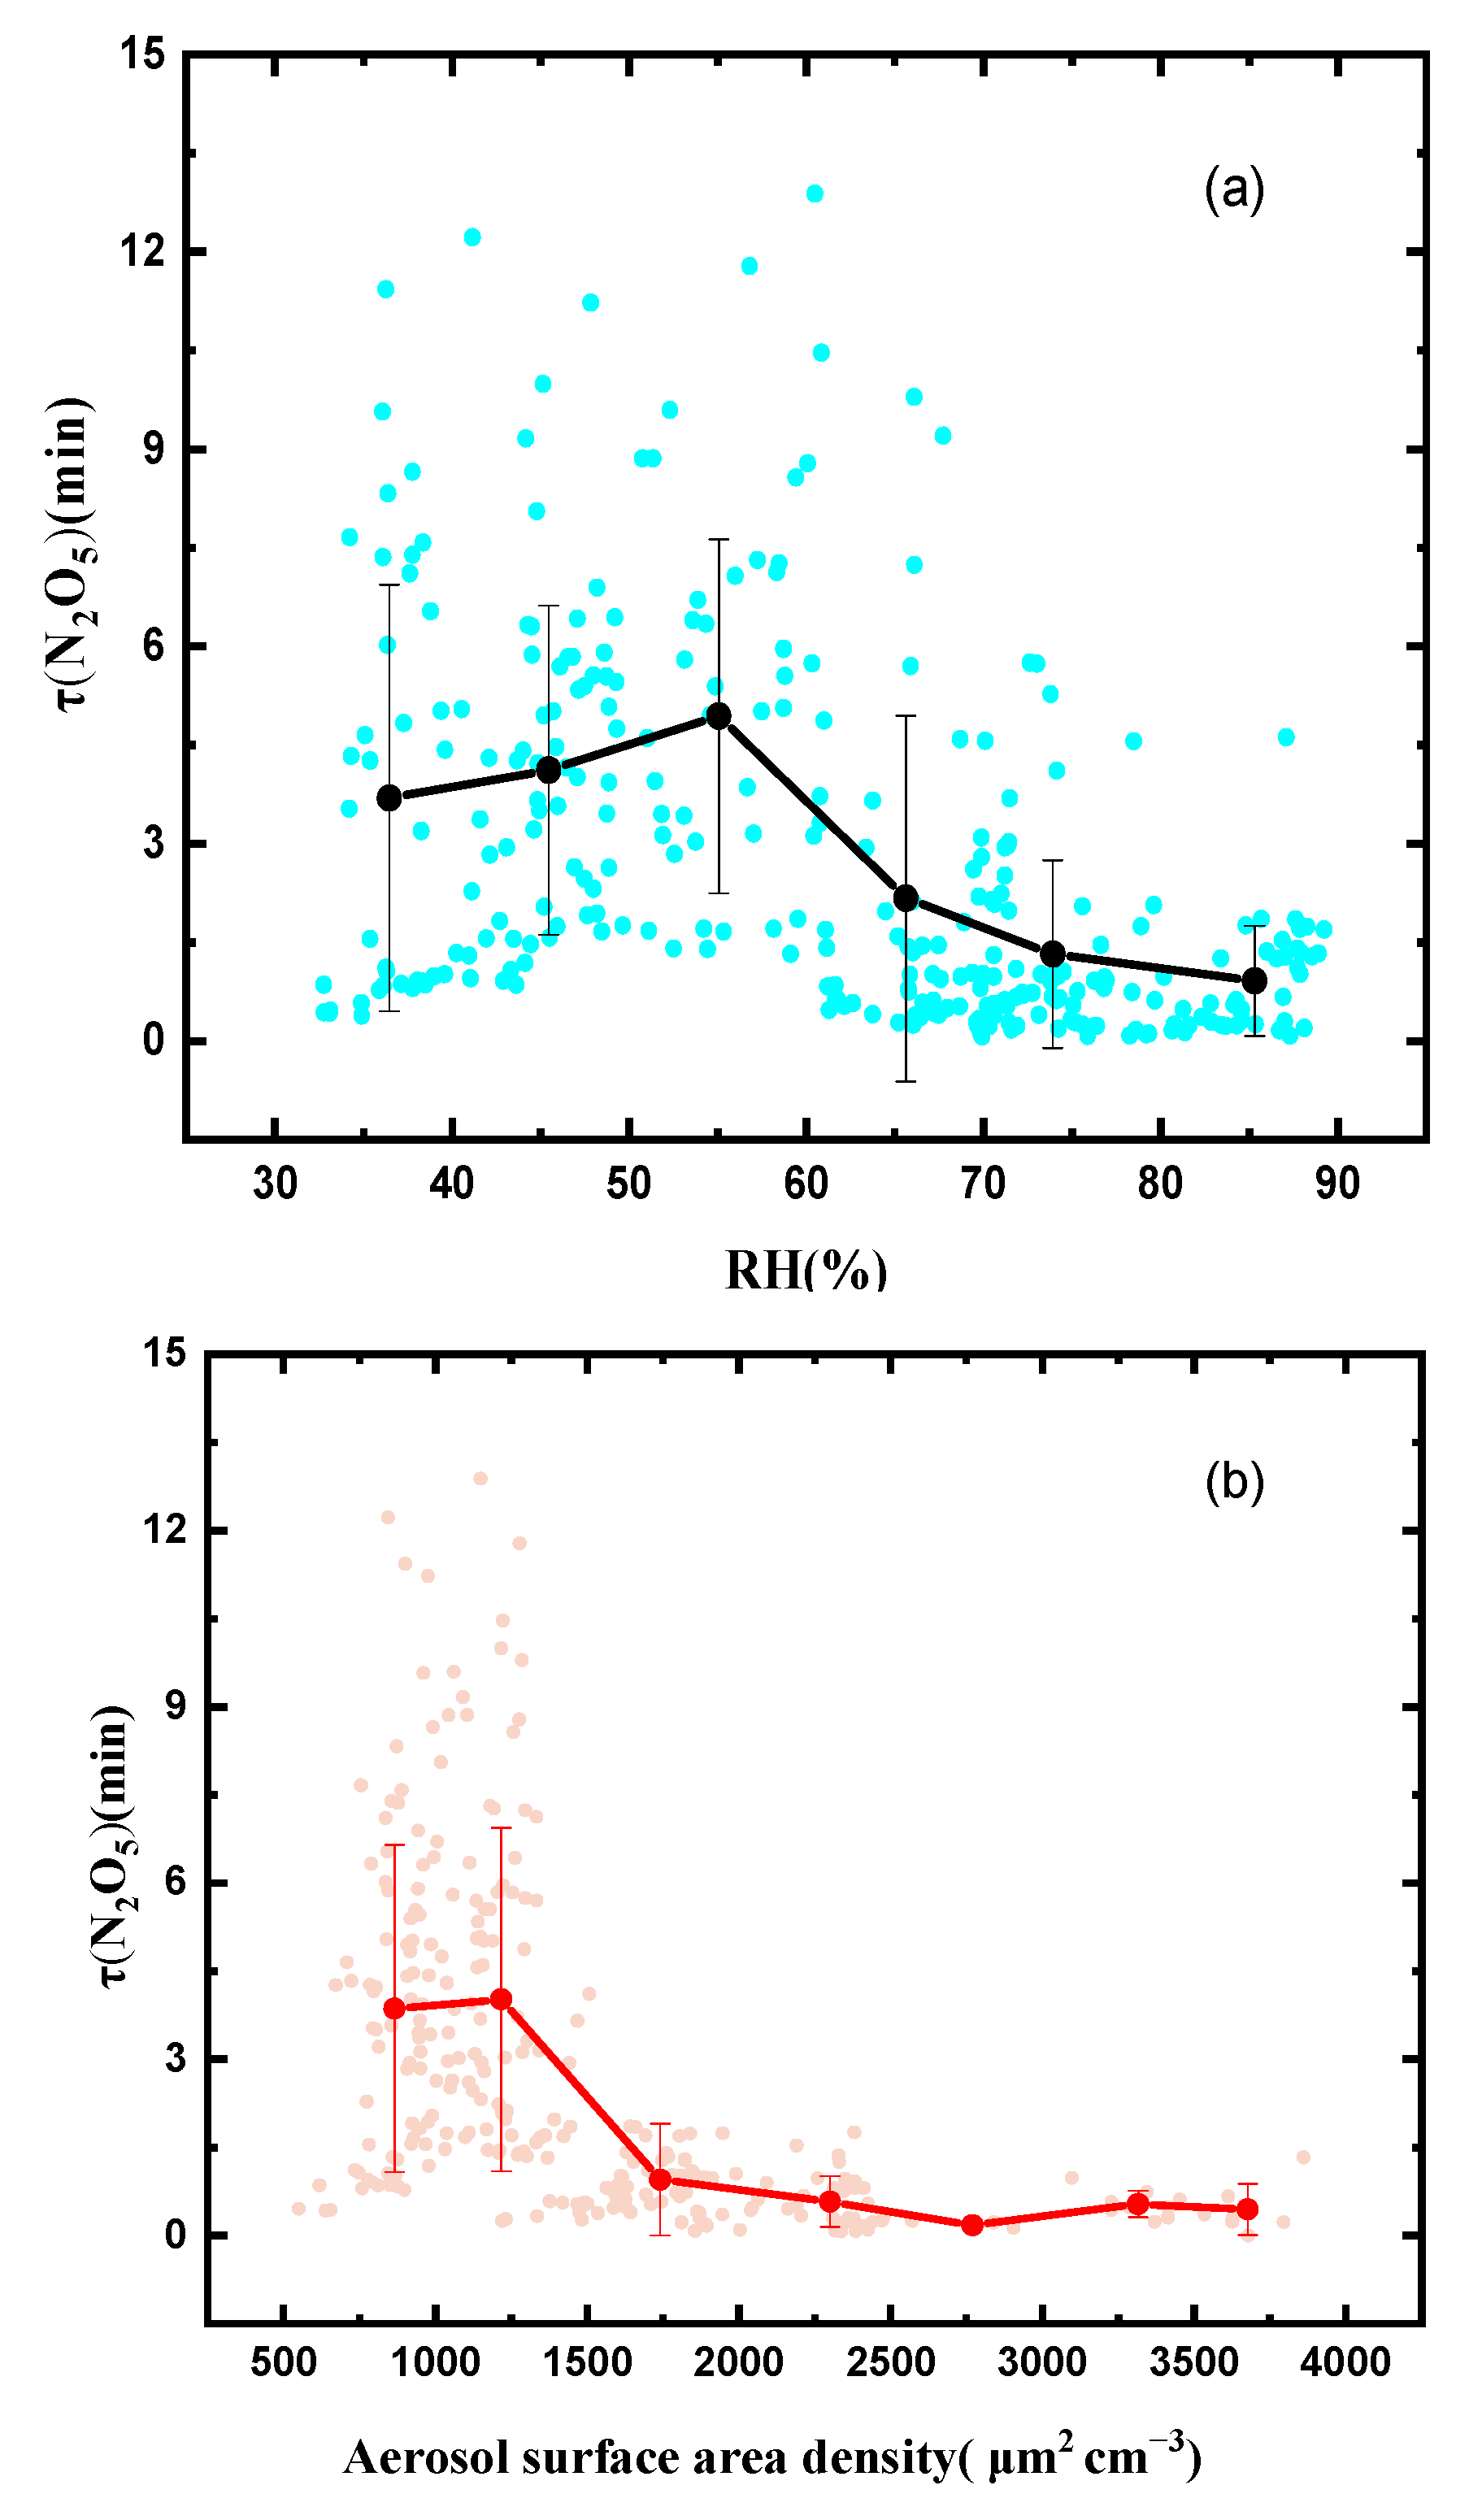
3.3. Steady-State Lifetimes of NO3 and N2O5

The steady-state lifetime was applied extensively when evaluating N2O5 and NO3, and can be represented as in Equations (9) and (10) [23]:
τ ( NO 3 ) = [ NO 3 ] k NO 2 + O 3 [ NO 2 ] [ O 3 ]
τ ( N 2 O 5 ) = [ N 2 O 5 ] k NO 2 + O 3 [ NO 2 ] [ O 3 ]
During the whole campaign, the nocturnal N2O5 lifetime varied from 4 s to 13 min, with an average value of 162 s, while the average NO3 lifetime was 26 s (Figure 6). Table 1 shows the observed N2O5 concentration and P(NO3) and τ ( N 2 O 5 ) values in Wangdu and other observation sites. The lifetime of N2O5 in this study was slightly lower than the obtained N2O5 lifetime in Beijing (310 s, average) [22], but was much shorter than that in Hong Kong (0.2–3 h) [9] and that in Seoul, Korea (0.5 h, average) [21]. The shorter lifetime in Wangdu indicated that N2O5 and NO3 were highly reactive and rapidly exhausted.
The influencing factors of the N2O5 lifetime were analyzed using the related parameters. When the RH exceeded 55%, the N2O5 lifetime showed a clear negative dependence on RH (Figure 7). The high RH effectively reduced the N2O5 lifetime, indicating that the heterogeneous N2O5 process played a large role as a sink. Figure 7b shows the correlation between the N2O5 lifetime and Sa. Here, the τ ( N 2 O 5 ) rapidly decreased from 4 min to 1 min as the Sa increased up to 1250 μm2 cm−3, but was approximately constant when the Sa increased from 1750 μm2 cm−3 to 3750 μm2 cm−3. The variation trend for the N2O5 lifetime with Sa indicated that the N2O5 uptake rates increased at higher Sa values. The N2O5 uptake was an important part of the N2O5 loss, which was promoted by the high RH and Sa.

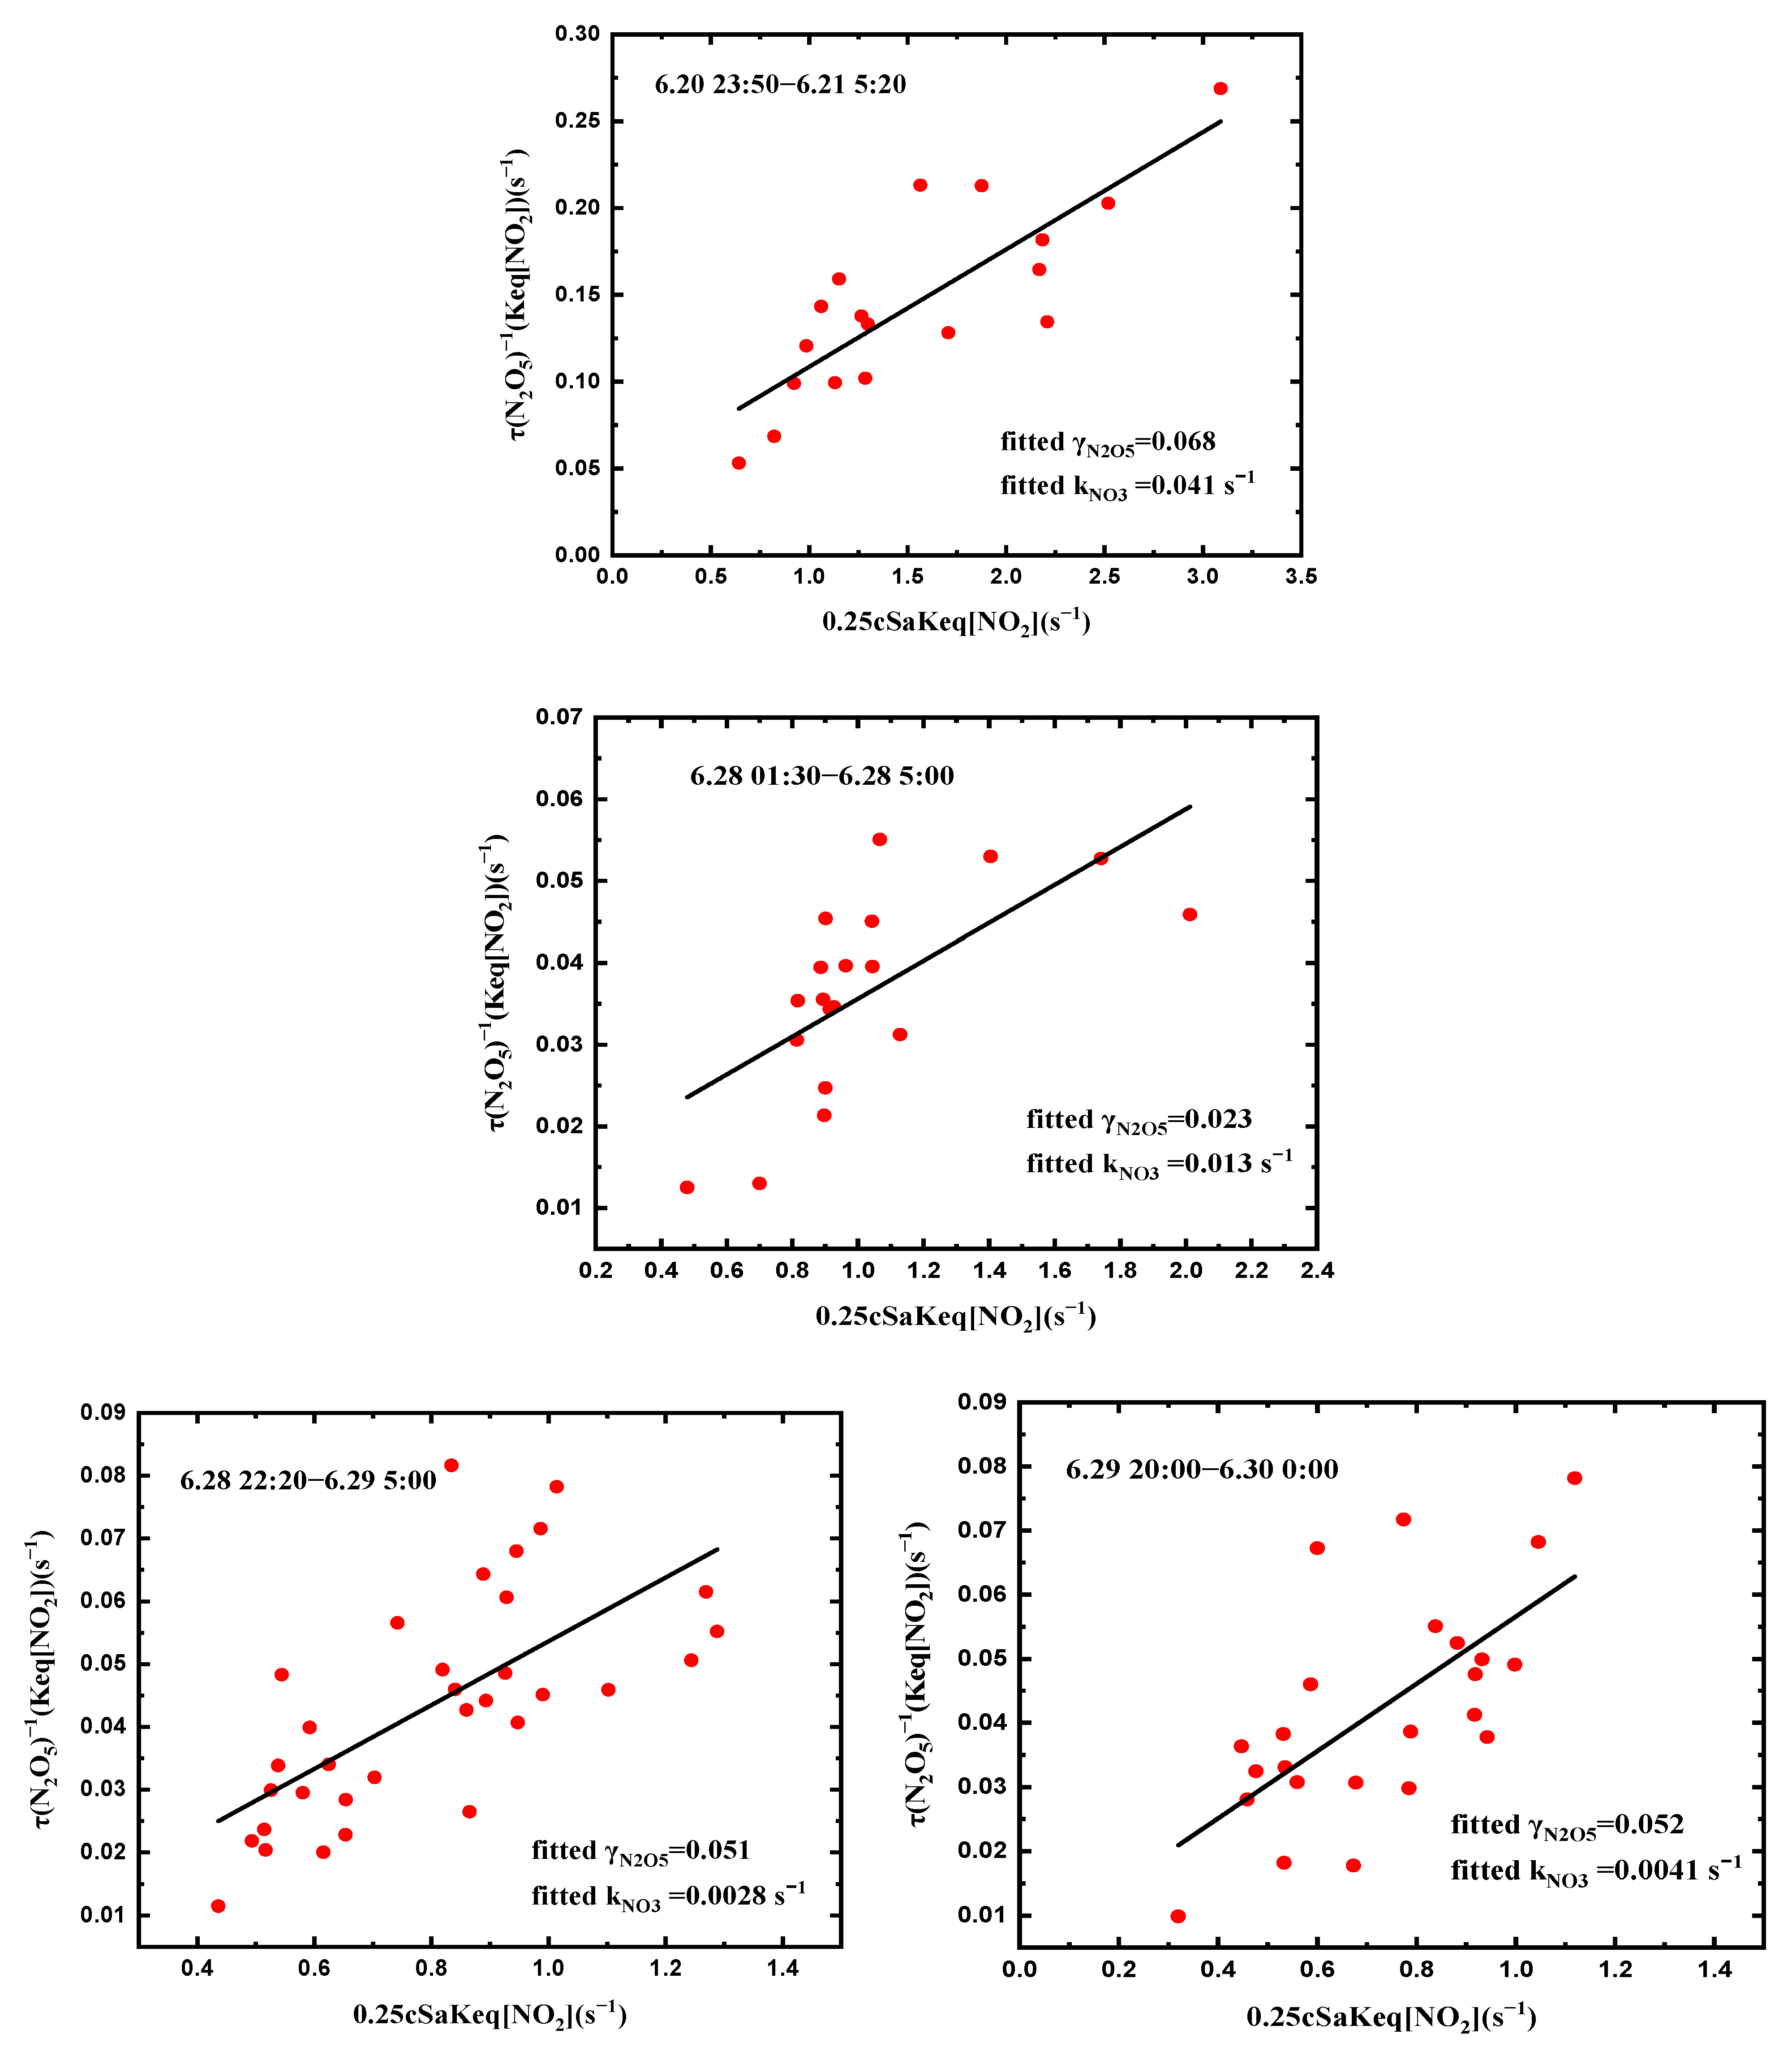
3.4. NO3 and N2O5 Loss Pathways

The loss of NO3 was generally divided into two kinds, direct loss pathways caused by the reaction with the VOCs and NO and indirect loss pathways caused by N2O5 heterogeneous hydrolysis. To delve into the loss rates, the N2O5 uptake coefficient was estimated using steady-state methods (Equation (13)) [6]. The linear fits showed the N2O5 uptake coefficient, γN2O5, as the slope and the first-order loss rate coefficient for NO3, kNO3, as the intercept.
τ ( N O 3 ) 1 = k N O 3 + K eq [ NO 2 ] k N 2 O 5
τ ( N 2 O 5 ) 1 = k N 2 O 5 + k NO 3 K eq [ NO 2 ]
τ ( N 2 O 5 ) 1 K eq [ NO 2 ] = 1 4 cS a γ N 2 O 5 K eq [ NO 2 ] + k NO 3
In this study, which lasted only five nights, we obtained valid fitting results. The uptake coefficient range of N2O5 was 0.023 to 0.118, and the average uptake coefficient was 0.062 ± 0.035 (Figure 8). The high γN2O5 was associated with the RH and Sa. Compared with the other fields, the obtained N2O5 uptake coefficient in this study was larger than those observed in Hong Kong (0.014 ± 0.007) [9], New England (0.001–0.017) [20], Calgary (0.02) [25], and London (0.01–0.03) [26]. However, the value of γN2O5 was similar to that in Taizhou (0.027–0.107) [24].
The kNO3 values varied from 0.0028 s−1 to 0.041 s−1, and the average was 0.013 ± 0.016 s−1, corresponding to the shorter NO3 lifetime below 1 min (Table 2). The high kNO3 indicated that the reactions of NO3 with NO and the VOCs represented important sinks. The NO3 removal process caused by the reactions with the VOCs and NO accounted for about 10–36% of the total during the five nighttime cases. The rate coefficient of the heterogeneous uptake of N2O5 (kN2O5) can be calculated using Equation (6). The values of kN2O5 varied from 0.0016 s−1 to 0.077 s−1, with an average value of 0.046 ± 0.029 s−1 during the five nighttime cases. The indirect loss pathways caused by the heterogonous uptake of N2O5 were estimated, which contributed 64–90% of the overall NO3 loss (average of 81%), suggesting the dominance of the heterogeneous reaction of N2O5 in nocturnal NO3 loss. Compared with the studies in South China, the loss of NOx was dominated by the VOCs followed by N2O5 uptake in Tai’Zhou in polluted Southern China [17].

4. Conclusions

During the measurement period, the maximum concentrations of nocturnal NO3 and N2O5 were 25 pptv and 429 pptv. The P(NO3) varied mainly with the ambient O3 concentrations. The observed N2O5 concentration gradually increased after sunset, mostly peaking near 22:30. The nocturnal average lifetimes of NO3 and N2O5 were 26 s and 162 s, which were 3-fold smaller than that reported in Beijing, The shorter lifetime in Wangdu indicated that the N2O5 and NO3 were highly reactive and rapidly exhausted over this region in the North China Plain. The estimated heterogeneous N2O5 uptake coefficient range was 0.023 to 0.118 during the five nighttime cases. The indirect loss by the heterogonous N2O5 uptake was estimated, which contributed 64–90% of the overall NO3 loss. The N2O5 lifetime had a clear negative dependence on the RH and Sa. The high RH and high Sa may have promoted the heterogonous N2O5 uptake during the campaign.
Without the quantification of the contribution of the VOCs to NOx loss during the campaign, the above analysis based on the N2O5 uptake coefficient may have some uncertainties. The results in this work demonstrate the importance of the heterogeneous chemistry in nocturnal NO3 and N2O5 removal in rural sites on the North China Plain. Meanwhile, it may be applicable to the N2O5 uptake processes in similar regions with high NOx, high RH, and high Sa.

Author Contributions

Supervision, R.H. and P.X.; Methodology and writing—original draft preparation, D.W.; investigation, Z.L., H.C. and H.J. All authors have read and agreed to the published version of the manuscript.

Funding

This research was funded by the National Natural Science Foundation of China (Grant No. 41905130), the Natural Science Foundation of Anhui Province of China (Grant Nos. 1908085QD159, 2008085QD182), the Major Project of Natural Science Research in Universities of Anhui Province (KJ2021ZD0052), and the China Postdoctoral Science Foundation (No. 2020M671383).

Institutional Review Board Statement

Not applicable.

Informed Consent Statement

Not applicable.

Data Availability Statement

Not applicable.

Acknowledgments

This work was supported by the National Natural Science Foundation of China (Grant No. 41905130), the Natural Science Foundation of Anhui Province of China (Grant Nos. 1908085QD159, 2008085QD182), the Major Project of Natural Science Research in Universities of Anhui Province (KJ2021ZD0052), and the China Postdoctoral Science Foundation (No. 2020M671383). We give special thanks to Yee Jun and Tao Wang of the Hong Kong Polytechnic University for their support of this study.

Conflicts of Interest

The authors declare no conflict of interest.

References

  1. Geyer, A.; Ackermann, R.; Dubois, R.; Lohrmann, B.; Muller, T.; Platt, U. Long-term observation of nitrate radicals in the continental boundary layer near Berlin. Atmos. Environ. 2001, 35, 3619–3631. [Google Scholar] [CrossRef]
  2. Benton, A.K.; Langridge, J.M.; Ball, S.M.; Bloss, W.J.; Dall’Osto, M.; Nemitz, E.; Harrison, R.M.; Jones, R.L. Night-time chemistry above London: Measurements of NO3 and N2O5 from the BT Tower. Atmos. Chem. Phys. 2010, 10, 9781–9795. [Google Scholar] [CrossRef] [Green Version]
  3. Volkamer, R.; Sheehy, P.; Molina, L.T.; Molina, M.J. Oxidative capacity of the Mexico city atmosphere—Part 1: A radical source perspective. Atmos. Chem. Phys. 2010, 10, 6969–6991. [Google Scholar] [CrossRef] [Green Version]
  4. Wayne, R.P.; Barnes, I.; Biggs, P.; Burrows, J.P.; Canosamas, C.E.; Hjorth, J.; Lebras, G.; Moortgat, G.K.; Perner, D.; Poulet, G.; et al. The nitrate radical—Physics, chemistry, and the atmosphere. Atmos. Environ. Part A Gen. Top. 1991, 25, 1–203. [Google Scholar] [CrossRef]
  5. Ng, N.L.; Brown, S.S.; Archibald, A.T.; Atlas, E.; Cohen, R.C.; Crowley, J.N.; Day, D.A.; Donahue, N.M.; Fry, J.L.; Fuchs, H.; et al. Nitrate radicals and biogenic volatile organic compounds: Oxidation, mechanisms, and organic aerosol. Atmos. Chem. Phys. 2017, 17, 2103–2162. [Google Scholar] [CrossRef] [PubMed] [Green Version]
  6. Chang, W.L.; Bhave, P.V.; Brown, S.S.; Riemer, N.; Stutz, J.; Dabdub, D. Heterogeneous atmospheric chemistry, ambient measurements, and model calculations of N2O5: A review. Aerosol Sci. Technol. 2011, 45, 665–695. [Google Scholar] [CrossRef]
  7. Yun, H.; Wang, W.; Wang, T.; Xia, M.; Yu, C.; Wang, Z.; Poon, S.C.N.; Yue, D.; Zhou, Y. Nitrate formation from heterogeneous uptake of dinitrogen pentoxide during a severe winter haze in southern China. Atmos. Chem. Phys. 2018, 18, 17515–17527. [Google Scholar] [CrossRef] [Green Version]
  8. Wang, X.; Wang, H.; Xue, L.; Wang, T.; Wang, L.; Gu, R.; Wang, W.; Tham, Y.J.; Wang, Z.; Yang, L.; et al. Observations of N2O5 and ClNO2 at a polluted urban surface site in North China: High N2O5 uptake coefficients and low ClNO2 product yields. Atmos. Environ. 2017, 156, 125–134. [Google Scholar] [CrossRef]
  9. Brown, S.S.; Dube, W.P.; Tham, Y.J.; Zha, Q.Z.; Xue, L.K.; Poon, S.; Wang, Z.; Blake, D.R.; Tsui, W.; Parrish, D.D.; et al. Night-time chemistry at a high altitude site above Hong Kong. J. Geophys. Res. Atmos. 2016, 121, 2457–2475. [Google Scholar] [CrossRef] [Green Version]
  10. Zhou, W.; Zhao, J.; Ouyang, B.; Mehra, A.; Xu, W.; Wang, Y.; Bannan, T.J.; Worrall, S.D.; Priestley, M.; Bacak, A.; et al. Production of N2O5 and ClNO2 in summer in urban Beijing, China. Atmos. Chem. Phys. 2018, 18, 11581–11597. [Google Scholar] [CrossRef] [Green Version]
  11. Li, Z.; Wang, D.; Xie, P.; Hu, R.; Chen, H.; Lin, C. Nighttime N2O5 chemistry in an urban site of Beijing in winter based on the measurements by cavity ring-down spectroscopy. Air Qual. Atmos. Health 2022, 15, 867–876. [Google Scholar] [CrossRef]
  12. Yun, H.; Wang, T.; Wang, W.; Tham, Y.J.; Li, Q.; Wang, Z.; Poon, S.C. Nighttime NOx loss and ClNO2 formation in the residual layer of a polluted region: Insights from field measurements and an iterative box model. Sci. Total Environ. 2018, 622, 727–734. [Google Scholar] [CrossRef] [PubMed]
  13. Li, S.; Liu, W.; Xie, P.; Qin, M.; Yang, Y. Observation of Nitrate Radical in the Nocturnal Boundary Layer During a Summer Field Campaign in Pearl River Delta, China. Terr. Atmos. Ocean. Sci. 2012, 23, 39–48. [Google Scholar] [CrossRef] [Green Version]
  14. Wang, D.; Hu, R.Z.; Xie, P.H.; Qin, M.; Xing, X.B. Nocturnal Atmospheric NO3 Radical Monitoring and Analysis in Beijing with Cavity Ring Down System. Spectrosc. Spect. Anal. 2016, 36, 3097–3102. [Google Scholar]
  15. Wang, H.; Lu, K.; Tan, Z.; Sun, K.; Li, X.; Hu, M.; Shao, M.; Zeng, L.; Zhu, T.; Zhang, Y. Model simulation of NO3, N2O5 and ClNO2 at a rural site in Beijing during CAREBeijing-2006. Atmos. Res. 2017, 196, 97–107. [Google Scholar] [CrossRef]
  16. Wang, Z.; Wang, W.; Tham, Y.J.; Li, Q.; Wang, H.; Wen, L.; Wang, X.; Wang, T. Fast heterogeneous N2O5 uptake and ClNO2 production in power plant and industrial plumes observed in the nocturnal residual layer over the North China Plain. Atmos. Chem. Phys. 2017, 17, 12361–12378. [Google Scholar] [CrossRef] [Green Version]
  17. Wang, H.; Chen, X.; Lu, K.; Hu, R.; Li, Z.; Wang, H.; Ma, X.; Yang, X.; Chen, S.; Dong, H.; et al. NO3 and N2O5 chemistry at a suburban site during the EXPLORE-YRD campaign in 2018. Atmos. Environ. 2020, 224, 117180. [Google Scholar] [CrossRef]
  18. Wang, D.; Hu, R.; Xie, P.; Liu, J.; Liu, W.; Qin, M.; Ling, L.; Zeng, Y.; Chen, H.; Xing, X.; et al. Diode laser cavity ring-down spectroscopy for in situ measurement of NO3 radical in ambient air. J. Quant. Spectrosc. Radiat. Transf. 2015, 166, 23–29. [Google Scholar] [CrossRef] [Green Version]
  19. Wang, D.; Hu, R.; Xie, P.; Li, Z. A novel calibration method for atmospheric NO3 radical via high reflectivity cavity. Meas. Sci. Technol. 2020, 31, 085801. [Google Scholar] [CrossRef]
  20. Brown, S.S.; Ryerson, T.B.; Wollny, A.G.; Brock, C.A.; Peltier, R.; Sullivan, A.P.; Weber, R.J.; Dubé, W.P.; Trainer, M.; Meagher, J.F.; et al. Variability in nocturnal nitrogen oxide processing and its role in regional air quality. Science 2006, 311, 67–70. [Google Scholar] [CrossRef]
  21. Brown, S.S.; An, H.; Lee, M.; Park, J.-H.; Lee, S.-D.; Fibiger, D.L.; McDuffie, E.E.; Dubé, W.P.; Wagner, N.L.; Min, K.-E. Cavity en-hanced spectroscopy for measurement of nitrogen oxides in the Anthropocene: Results from the Seoul tower during MAPS 2015. Faraday Discuss. 2017, 200, 529–557. [Google Scholar] [CrossRef] [PubMed]
  22. Wang, H.; Lu, K.; Guo, S.; Wu, Z.; Shang, D.; Tan, Z.; Wang, Y.; Le Breton, M.; Lou, S.; Tang, M.; et al. Efficient N2O5 uptake and NO3 oxidation in the outflow of urban Beijing. Atmos. Chem. Phys. 2018, 18, 9705–9721. [Google Scholar] [CrossRef] [Green Version]
  23. Platt, U.; Perner, D.; Winer, A.M.; Harris, G.W.; Pitts, J.N. Detection of NO3 in the polluted troposphere by differential optical-absorption. Geophys. Res. Lett. 1980, 7, 89–92. [Google Scholar] [CrossRef]
  24. Li, Z.; Xie, P.; Hu, R.; Wang, R.; Jin, H.; Chen, H.; Lin, C.; Liu, W. Observations of N2O5 and NO3 at a suburban environment in Yangtze river delta in China: Estimating heterogeneous N2O5 uptake coefficients. J. Environ. Sci. 2020, 95, 248–255. [Google Scholar] [CrossRef]
  25. Mielke, L.H.; Furgeson, A.; Osthoff, H.D. Observation of ClNO2 in a mid-continental urban environment. Environ. Sci. Technol. 2011, 45, 8889–8896. [Google Scholar] [CrossRef]
  26. Morgan, W.T.; Ouyang, B.; Allan, J.D.; Aruffo, E.; Di Carlo, P.; Kennedy, O.J.; Lowe, D.; Flynn, M.J.; Rosenberg, P.D.; Williams, P.I.; et al. In-fluence of aerosol chemical composition on N2O5 uptake: Air-borne regional measurements in northwestern Europe. Atmos. Chem. Phys. 2015, 15, 973–990. [Google Scholar] [CrossRef] [Green Version]
Figure 1. Field measurement site in Wangdu, Hebei Province.
Atmosphere 13 01268 g001
Figure 2. Wind speed and wind direction.
Atmosphere 13 01268 g002
Figure 3. Time series of N2O5, NO3, and related trace gases. OB N2O5 is the mixing ratio of N2O5 observed by CIMS, and CAL N2O5 is the mixing ratio of N2O5 calculated by NO3 and NO2.
Atmosphere 13 01268 g003
Figure 4. (a) Mean nocturnal profiles of temperature, humidity, PM2.5, PM10, and Sa in this campaign. (b) Mean nocturnal profiles of NO2, O3, N2O5, and P(NO3) during the measurement period; the error bar is the standard deviation. OB N2O5 is the mixing ratio of N2O5 observed by CIMS, and CAL N2O5 is the mixing ratio of N2O5 calculated by NO3 and NO2.
Atmosphere 13 01268 g004
Figure 5. (a) The dependence of P(NO3) on the O3 concentration. The black line shows linear fitting. (b) The dependence of N2O5 on the O3 concentration. The black line shows linear fitting.
Atmosphere 13 01268 g005
Figure 6. Time series for the NO3 lifetime in Wangdu County, Hebei Province, from 10 June to 6 July.
Atmosphere 13 01268 g006
Figure 7. Scatter plots of the N2O5 lifetime versus RH (a) and scatter plots of the N2O5 lifetime versus Sa (b).
Atmosphere 13 01268 g007
Figure 8. The N2O5 uptake coefficient is the slope of the linear fits of τ ( N 2 O 5 ) 1 K eq [ NO 2 ] versus 0.25 cS a K eq [ NO 2 ] ; kNO3 is the intercept of the linear fits.
Atmosphere 13 01268 g008aAtmosphere 13 01268 g008b
Table 1. The N2O5 concentration and P(NO3) and τ ( N 2   O 5 ) values in Wangdu and other observation sites.
LocationEnvironmentN2O5 (pptv)P(NO3) (ppbvh−1) τ ( N 2 O 5 ) Reference
Beijing, ChinaUrban<11001.2 ± 0.9310 ± 240 s[22]
Seoul, KoreaUrban, Tower<50001.30.5 h[21]
Hong Kong, ChinaRural mountaintop<80000.320.2–3 h[9]
Taizhou, ChinaSuburban<7001.2 ± 0.455 ± 68 s[24]
Wangdu, ChinaRural <5001.03 ± 0.48162 sThis study
Table 2. The N2O5 uptake coefficient, k(NO3), and kN2O5.
DateSa (μm2/cm3)γN2O5KN2O5 (s−1)KNO3 (s−1)
20–21 June18760.0680.00770.041
27–28 June11850.0230.00160.013
27–28 June9260.0510.00270.0028
29–30 June10900.0520.00340.0041
30 June–1 July10770.1180.00770.0055
Publisher’s Note: MDPI stays neutral with regard to jurisdictional claims in published maps and institutional affiliations.

