Abstract
The adversities of climate change represent a serious risk factor on both food production, rural territories and landscapes. In light of these irreversible trends, the process of adaptation of the rural territory is a necessary step, in order to increase its climate resilience. In this study, the vulnerability assessment was the tool used to evaluate the specific phenomenon of “flooding and backwatering” in the case study of Emilia Romagna region (Italy). The approach was based on the IPCC’s risk analysis methodology, populated by different layers regarding specifical proxies related to the adaptive capacity and the sensitivity of the territory to water stagnation, then we assessed with the normalization process of the different information levels. The aim of the research consisted in the realization of a regional map of the vulnerability to floods and backwaters, in order to rank the territory to this specific phenomenon. The final result could be useful both for the relationship with planning choices and for local-based actions in agricultural policies that in Italy are taken at regional level.
1. Introduction
Our societies are facing urgent and interdependent global crises due to climate change and biodiversity loss, which are causing and will increasingly cause negative impacts in the future [1,2]. Climate change and the consequent average increase in temperatures represent serious risk factors that will have significant impacts on both food production, thus food security [3], and rural lands and landscapes, which are identity elements, essential for local cultures and traditions [4].
According to predictions by the Intergovernmental Panel on Climate Change (IPCC), the threats facing the agricultural sector are especially related to the occurrence of peaks, both related to rising average temperatures and to the amount and frequency of rainfall, as well as to the increasing presence of extreme events [5,6]. In light of these irreversible trends, the process of adapting rural land and its practices is an inevitable and fundamental step that is useful in increasing its climate resilience [7,8,9]. In order to be able to implement appropriate climate change adaptation strategies, guiding planning adaptation choices, environmental policies and supporting policymakers, a careful assessment of the vulnerability of rural areas to climate change phenomena, which endangers their productive capacity and identity, becomes essential. Vulnerability assessment is one of the main tools used to represent the potential damage, which could occur within human and ecological systems in response to global climate change [10,11]. In this sense, the assessment process can contribute to a better understanding of community and environmental needs. This method is also useful in improving capacity building and/or in the identification of adaptation actions to reduce vulnerability, as has already happened in several case studies in urban areas related to various climate change issues [12,13]. However, conducting the assessment of rural land at a regional scale is a complex process, both because of the high degree of heterogeneity in spatial and temporal data and because of the association with physical, socioeconomic and cultural determinants of vulnerability.
In this paper, the Emilia Romagna Region case study will be presented. The territory of the Emilia Romagna Region is a heterogeneous context in terms of its agricultural production and related landscapes, as well as in being the first Italian and European region in terms of Protected Denomination of Origin (PDO) and Protect Geographical Indication (PGI) products [14], reflecting the high added value of its agriculture. The Emilia Romagna Region, over the years, among the various problems arising from climate change, has gradually experienced conditions of increase in the intensity of rainfall phenomena [15], with a greater contribution of high rainfall intensity days to the annual total of rainy days [16]. This trend is exposing the rural contexts to a different type of climate that causes both severe drought conditions and increased vulnerability to heavy rainfall events, which are two extremes of the same hydrological cycle [17]. Heavy rainfalls, in particular, represent a serious risk factor for rural territories because of the destructive damages they can produce [18], and their frequency and intensity are expected to increase in the coming years [19] because warmer temperatures in the world means an increasing of the moisture in the atmosphere [20].
The phenomenon of floods and water stagnation due to heavy rainfalls was investigated with the help of appropriate spatial information layers that, related to each other, allowed the identification of the most vulnerable areas. This investigation, related to water dynamics, is focused on the Emilia Romagna regional boundaries that, from a hydrological perspective, coincide with hydrographical basins, as presented in [21]. Floods and backwaters can be seen as a serious hazard in this type of geographical area [22] even for cultivation of products with a high need for water such as rice [23]. Several territorial studies confirm that the Emilia Romagna Region, like other territories in northern Italy, suffers from flooding during extreme rainfall events, confirming the importance of studies concerning the overall resilience of the regional territory and not only of river contexts [24,25,26].
Starting from this specific problem, the scientific result of this work is represented by the attempt to develop and apply a methodological process, which is valid for the estimation of hazards resulting from climate change in rural areas. In fact, there is a high gap in terms of analysis and studies about climate change impacts between rural and urban areas [27], and with this paper, we will try to start to close this gap.
Furthermore, an analysis capable of characterizing the territory according to different levels of vulnerability can be a useful tool both in relation to spatial planning choices and for actions arising from the Common Agricultural Policy (CAP).
Especially concerning the CAP, this type of analysis, also suitable for other hazards deriving from climate change, can be extremely important, giving decision-makers evidence for prioritizing actions of the Rural Development Programme (RDP) in their territory; this is a crucial theme, considering that CAP is increasingly oriented toward financial-result-based actions and in adapting measures to local conditions [28].
This paper is based on specific research financed by the Emilia Romagna Region on rural land, landscape and climate change. For this reason, the research and the analysis developed were built on data and information that already exist, highlighting as soon as possible Emilia Romagna Region’s informative layers and previous projects’ results.
2. Materials and Methods
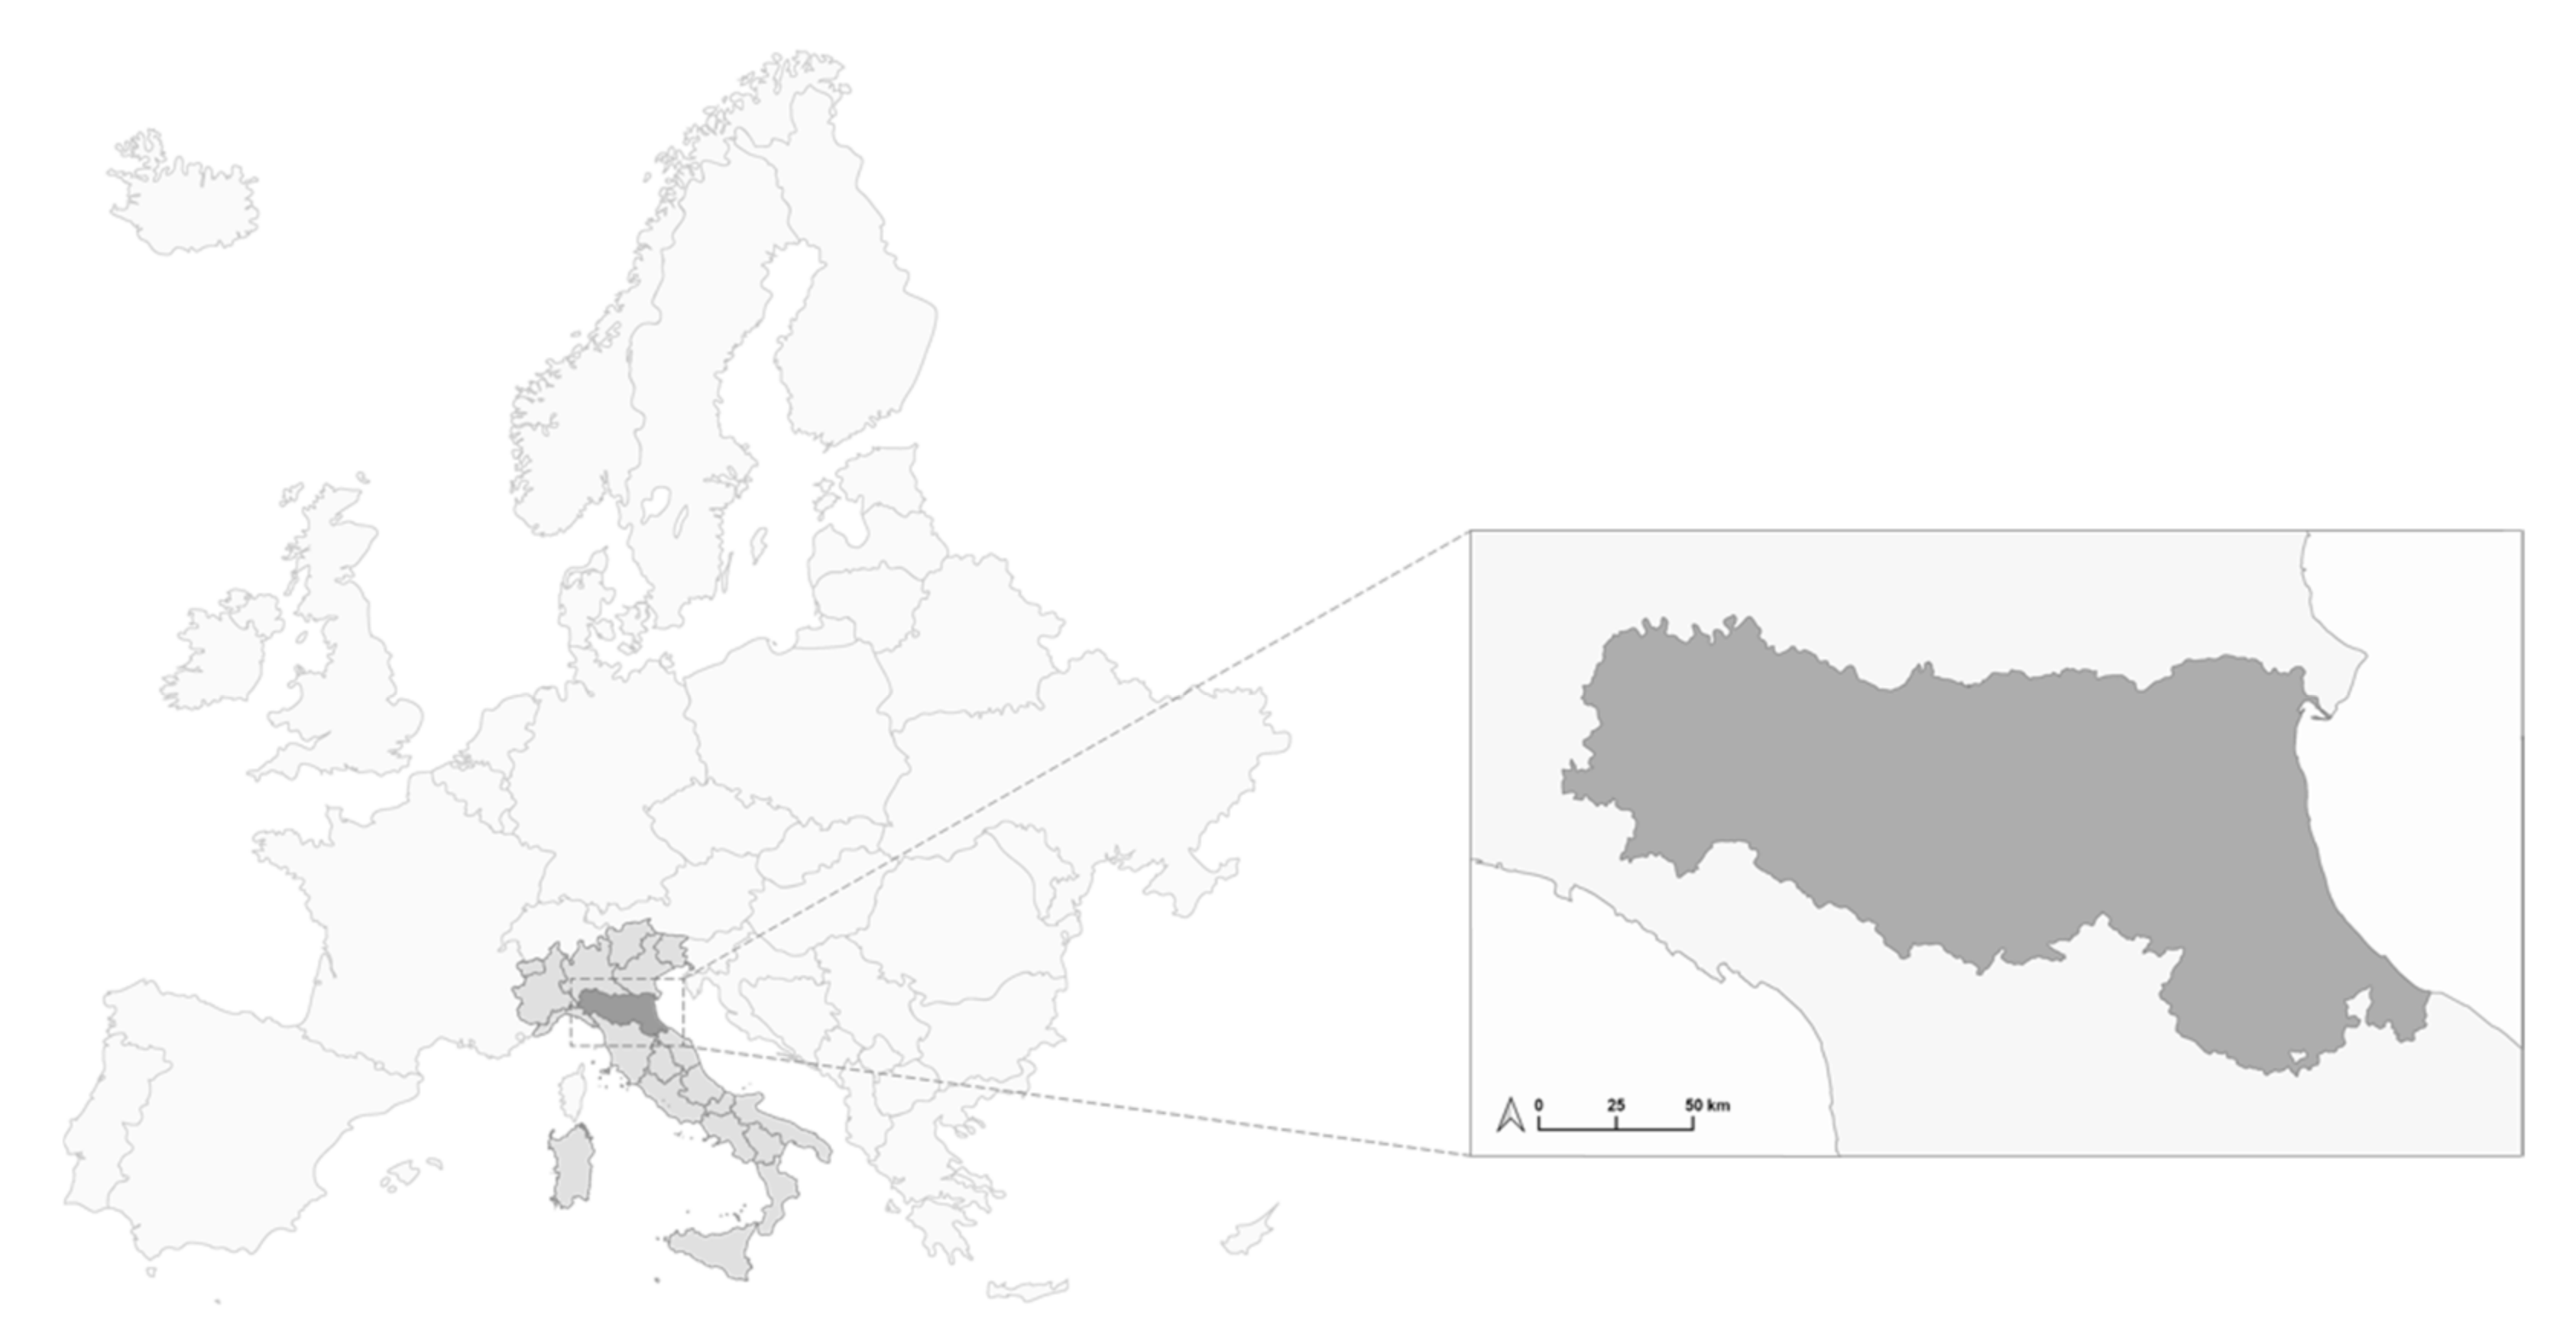
The case study selected is the Emilia Romagna Region, in the center–north of Italy, which covers an area of 22,510 km2 and has a population of 4459 million [29]. The climate is a sub-continental temperate type, with hot and humid summers and cold and frigid winters, tending to sublittoral only along the coastal strip [30]. According to the Corine land cover 2020 dataset elaborated by the Emilia Romagna Region with Copernicus data [31], the area is covered by 35.75% artificial surface, 30.05% agricultural areas, 0.91% forest and semi-natural areas, and 33.29% water bodies without considering the lagoon (Figure 1).

Figure 1.
Study area map.
During the last year, in the Italian context, it has undergone a severe urbanization process that has led the Emilia Romagna region to have undergone a large loss of potential agricultural land (8.93%) [32]. This process has also heavily involved the case area, leading to the degradation of natural ecosystems and rural landscapes and determining a progressive removal and lengthening of the adaptation process. Moreover, this dynamic has exacerbated the precipitation effect, which is between 450 and 2100 mm, (with the lowest values in the eastern plains and the highest in the Apennines) with major intensities.
This effect is seen primarily during the winter and a small effect during the spring [33]. The spatial analysis of the vulnerability is recognized as relevant by the local policymakers and also by the citizens and local producers, regarding the knowledge increase in local markets and other sustainable initiatives [34,35,36]. Furthermore, this characterization of the territory allows systematizing numerous data into useful information [37,38].
In this case study, rural spaces suitable to investigate the specific local behavior that are able to show intrinsic properties to counteract the flooding effect were considered. Moreover, the vulnerability of these areas to climate change was investigated [39]. In this sense, the methodology used on a territorial scale is useful to support administrations and stakeholders who intend to implement specific local policies in the rural area, to minimize the negative effects of climate change. It facilitates the processes of adaptation and sustainability, focusing on the preconditions that determine the vulnerability linked to flooding, taking into account the specific context in the study.
The main concern that arises in this kind of analysis is represented by the reduced availability of data sources on the dynamics under study [40,41,42]. This represents a barrier that prevents the direct use of information layers regarding the purpose of the analysis. To go beyond this limit, the methodology is based on the innovative use of available databases, used through the definition of multiple proxies that allow for the quantification of specific properties [43]. Each of them was discussed with the public administration and subsequently was investigated in the scientific literature. In this way, the spatial characterization of the rural context makes it possible to strengthen the adaptation process, highlighting the potential effects on the territory. A better knowledge of the changing dynamics makes it possible to better define “agricultural adaptation strategies” that are capable of increasing the resilience of the system [44].
Based on the approach shown in the IPCC 2014 “vulnerability assessment” report [45], the methodology aims to identify areas vulnerable to flooding in rural contexts, by innovative synergy [12]. The Equation (1) is based on the analysis of sensitivity, adaptive capacity and vulnerability as follows:
where:
V = Vulnerability
Sen = Sensitivity
AdC = Adaptive Capacity
2.1. Mapping Approach
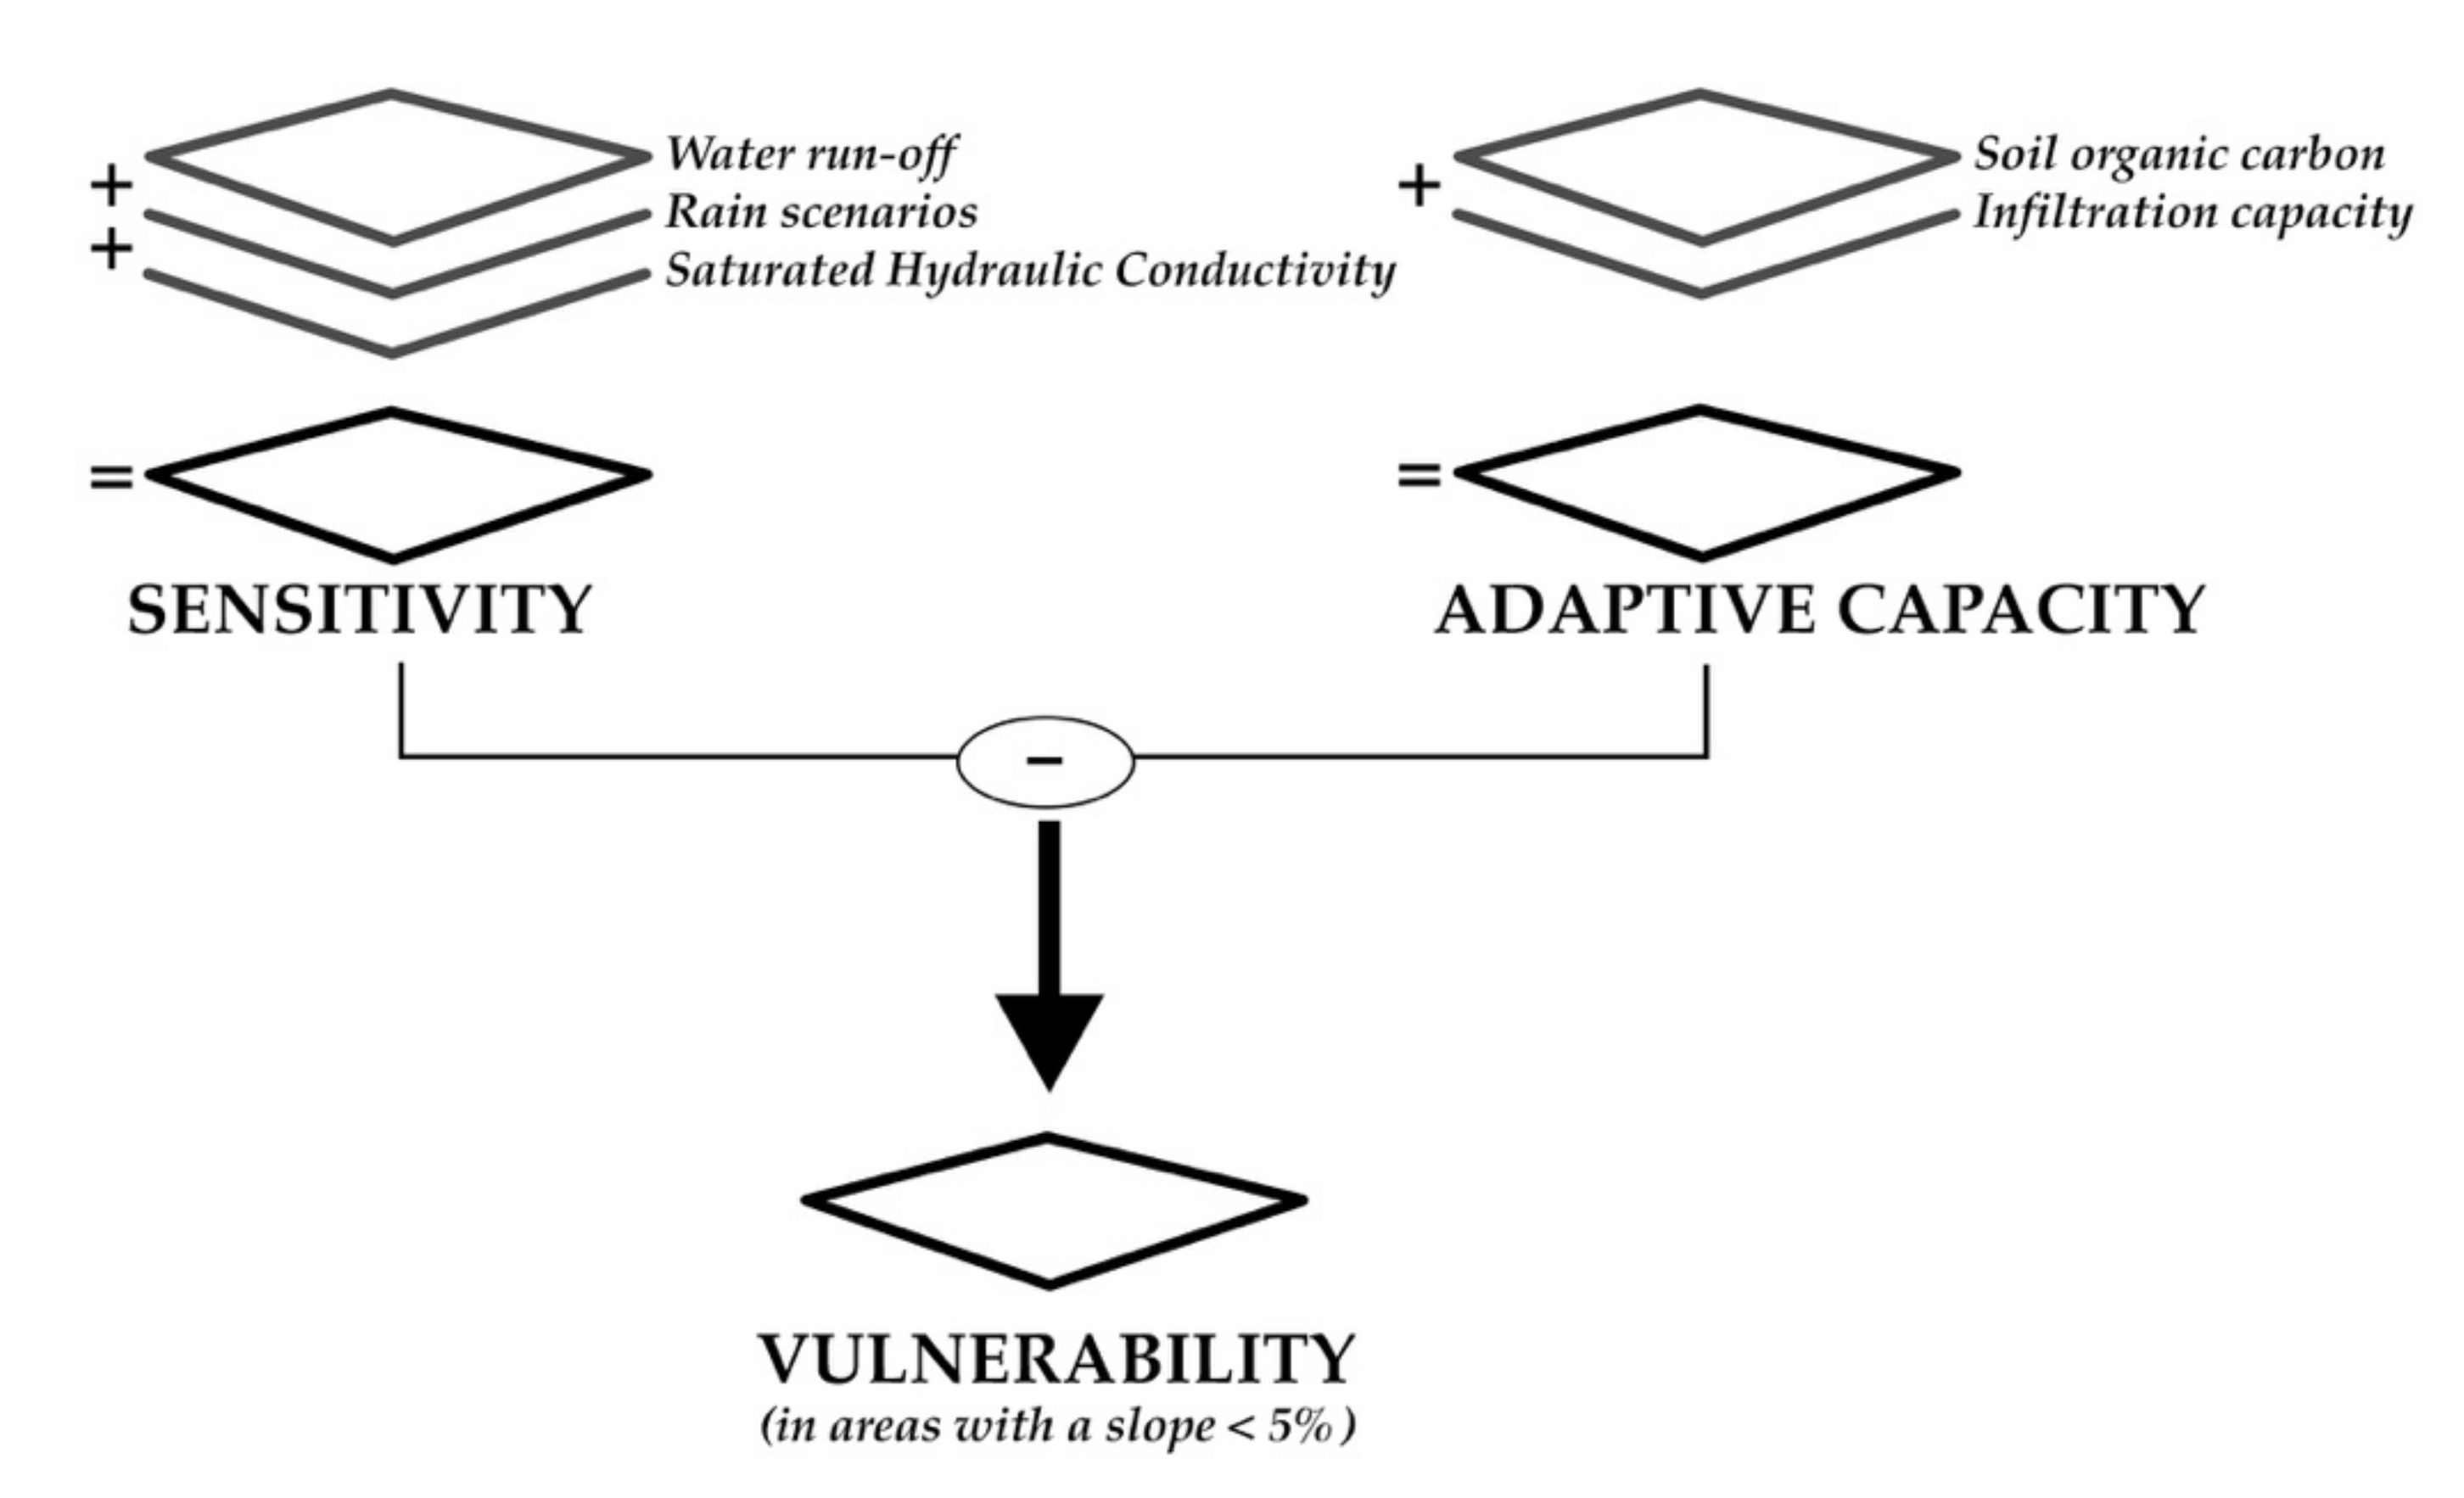
In this study, the spatial analysis was developed through a GIS-based approach as already experimented in [46,47,48]. The geospatial evaluation of the vulnerability of flooding areas was based on regional geodatabases from which some layers were selected to satisfy the paper’s objectives. Following the vulnerability Equation (1) [45], the selected layers were split into two main categories, as shown in Table 1: sensitivity and adaptive capacity. For the first category we have (i) Water run-off; (ii) Rain scenarios; (iii) Saturated Hydraulic Conductivity, and for the second one: (iv) Soil organic carbon and (v) Infiltration capacity. The mapping approach follows two steps, as shown in Figure 2. These steps were developed using a set of spatial criteria to quantify different properties.

Table 1.
Information layers and related elements identified.

Figure 2.
The two steps of the mapping approach.
2.2. Step 1: Sensitivity
The first step is based on the sensitivity investigated in terms of (i) Water runoff, (ii) Rain scenarios, and (iii) Saturated Hydraulic Conductivity. The analysis of the first element, (i) Water runoff, was carried out thanks to the methodology presented in [12] according to the information levels relating to the morphology of the territory (DTM) and land use (CLC). The digital terrain model with 5 × 5 m cells to which the elevation information is associated was derived from the Regional Technical Map at the 1:5000 scale and updated on the 2009 Lidar survey [49]. The second layer is the Corine Land Cover (CLC) integrated by the CPSG-CISIS Soil Use Working Group, with the reclassification relating to 2017, carried out in 2019/20, with a scale of 1:10,000. The methodology then provides for the use of runoff coefficients for each type of land use referred to the 3rd level of detail (Table 2) originating from the “Regulation containing provisions for the application of the principle of hydraulic invariance referred to in Article 14, paragraph 1, letter k of the regional law of 29 April 2015, n. of water use“ and the related technical document called Annex 1: ”Guidelines for the application of the principle of hydraulic invariance in the Friuli Venezia Giulia Region” [50]. The partial result is an information layer in which the regional territory is characterized by its propensity to drain the water to the ground.
Table 2.
Runoff coefficients for each type of land use referred to the 3rd level of detail.
For the study of (ii) Rain scenarios, and (iii) Saturated hydraulic conductivity it was possible to capitalize the data available at the regional scale, which was carried out thanks to specific studies [51]. Concerning (ii) Rain scenarios, available in “CSV” format and produced by the “Climatology and long-term forecasts” Unit—ARPAE, it contains forecast data based on the stabilization emission scenario (RCP) 4.5. For the processing in the GIS environment, it was decided to use the forecast data relating to the median (p. 50), thus placing itself in an average situation. Subsequently, thanks to the latitude and longitude information of the single points, it was possible to integrate the table file (.csv) into a shapefile (.shp), thus reaching the preconditions for carrying out spatial analysis. This analysis consists of a “spatial interpolation” of the point values which generates an equivalent level of information of an areal type, which was therefore useful for the study. The last useful layer identified in the sensitivity study is (iii) Saturated hydraulic conductivity, or the ability of a saturated soil to transmit water when subjected to a hydraulic gradient [52]. The saturated water conductivity is an index of the ease with which the soil allows water to pass through it and is based on: texture; the presence of organic matter; structure; the presence of canals formed by roots or biological activity; the size and continuity of the pores [51]. Due to the different spatial coverage, this information layer is available only for the pedo-hilly context, while the remainder is currently being drafted.
The availability of spatialized data coherent with the dynamics under study made it possible to identify the most-sensitive areas, thus testing the survey model. This is shown in detail in Table 3, with the values taken into consideration for the study. For each of the (3) individual information layers, a normalization of the values was followed, according to:
where:
Table 3.
Information layers and related elements identified.
X = value considered
Xmin = minimum value of the class of the specific layer
Xmax = maximum value of the class of the specific layer
Carrying out this operation in the GIS environment allowed us to obtain 3 layers, with the same scale of values expressed from 0–1 and therefore comparable. This made it possible to aggregate the aspects examined and obtain a general overview according to:
where:
Xi = water run-off
Xii = rain scenarios
Xiii = saturated hydraulic conductivity
The partial result of this operation was transformed from shapefile (polygon) to raster so that the data could then be migrated in GIS using the “zonal statistics” tool into a matrix-based grid with a mesh structure consisting of cells with a side of 1 km.
2.3. Step 2: Adaptive Capacity
The second step consists in studying the Adaptive capacity in terms of (iv) Soil organic carbon, and (v) Infiltration capacity.
The analysis of (iv) Soil organic carbon, as recognized in the literature, represents a characteristic of the soil that significantly increases the capacity for water sequestration (Lal, 2016). Thanks to specific studies, useful information layers have been used, which describe the average organic carbon content expressed in Mg*ha—1 in the profile of the first 100 cm of soil. This layer has a regular mesh structure with cells with a side of 1 km and is composed of two parts, respectively the plain and the Apennines. For each cell, the value is the result of a geostatistical analysis conducted by the Geographic Information Systems Service of the Emilia Romagna Region. Subsequently, we proceeded with the normalization according to the value which represents the organic carbon content in Mg*ha—1, following the Equation (2).
(v) Infiltration capacity, produced by the Geological Seismic and Soil Service (SGSS), quantifies the capacity of soils in the deep infiltration of water. It represents one of the ecosystem services investigated for lowland soils at a regional level, called “ES-WAR” [53]. For the analysis, the themes were taken into consideration even if with partial coverage, as the missing part by its nature suffers less from relapses due to the land morphologies. The systematization of the values is already usable in the study as the values are normalized with values in the range from 0 to 1 (Table 4).
Table 4.
Information layers and related elements identified.
The realization of this processing in a GIS environment resulted in two layers with the same scale of values that made it possible to aggregate the examined aspects and obtain a general behavior according to the Equation (4):
where:
Xvi = Soil organic carbon
Xv = Infiltration capacity
In this case, the partial result of step 2 consists of converting the obtained layer from Equation (4) from shapefile (polygon) to raster and implementation in GIS through the tool “zonal statistics” into a matrix-based grid in which the layers are processed according to a mesh structure consisting of cells with 1 km side converging.
2.4. Step 3: Vulnerability
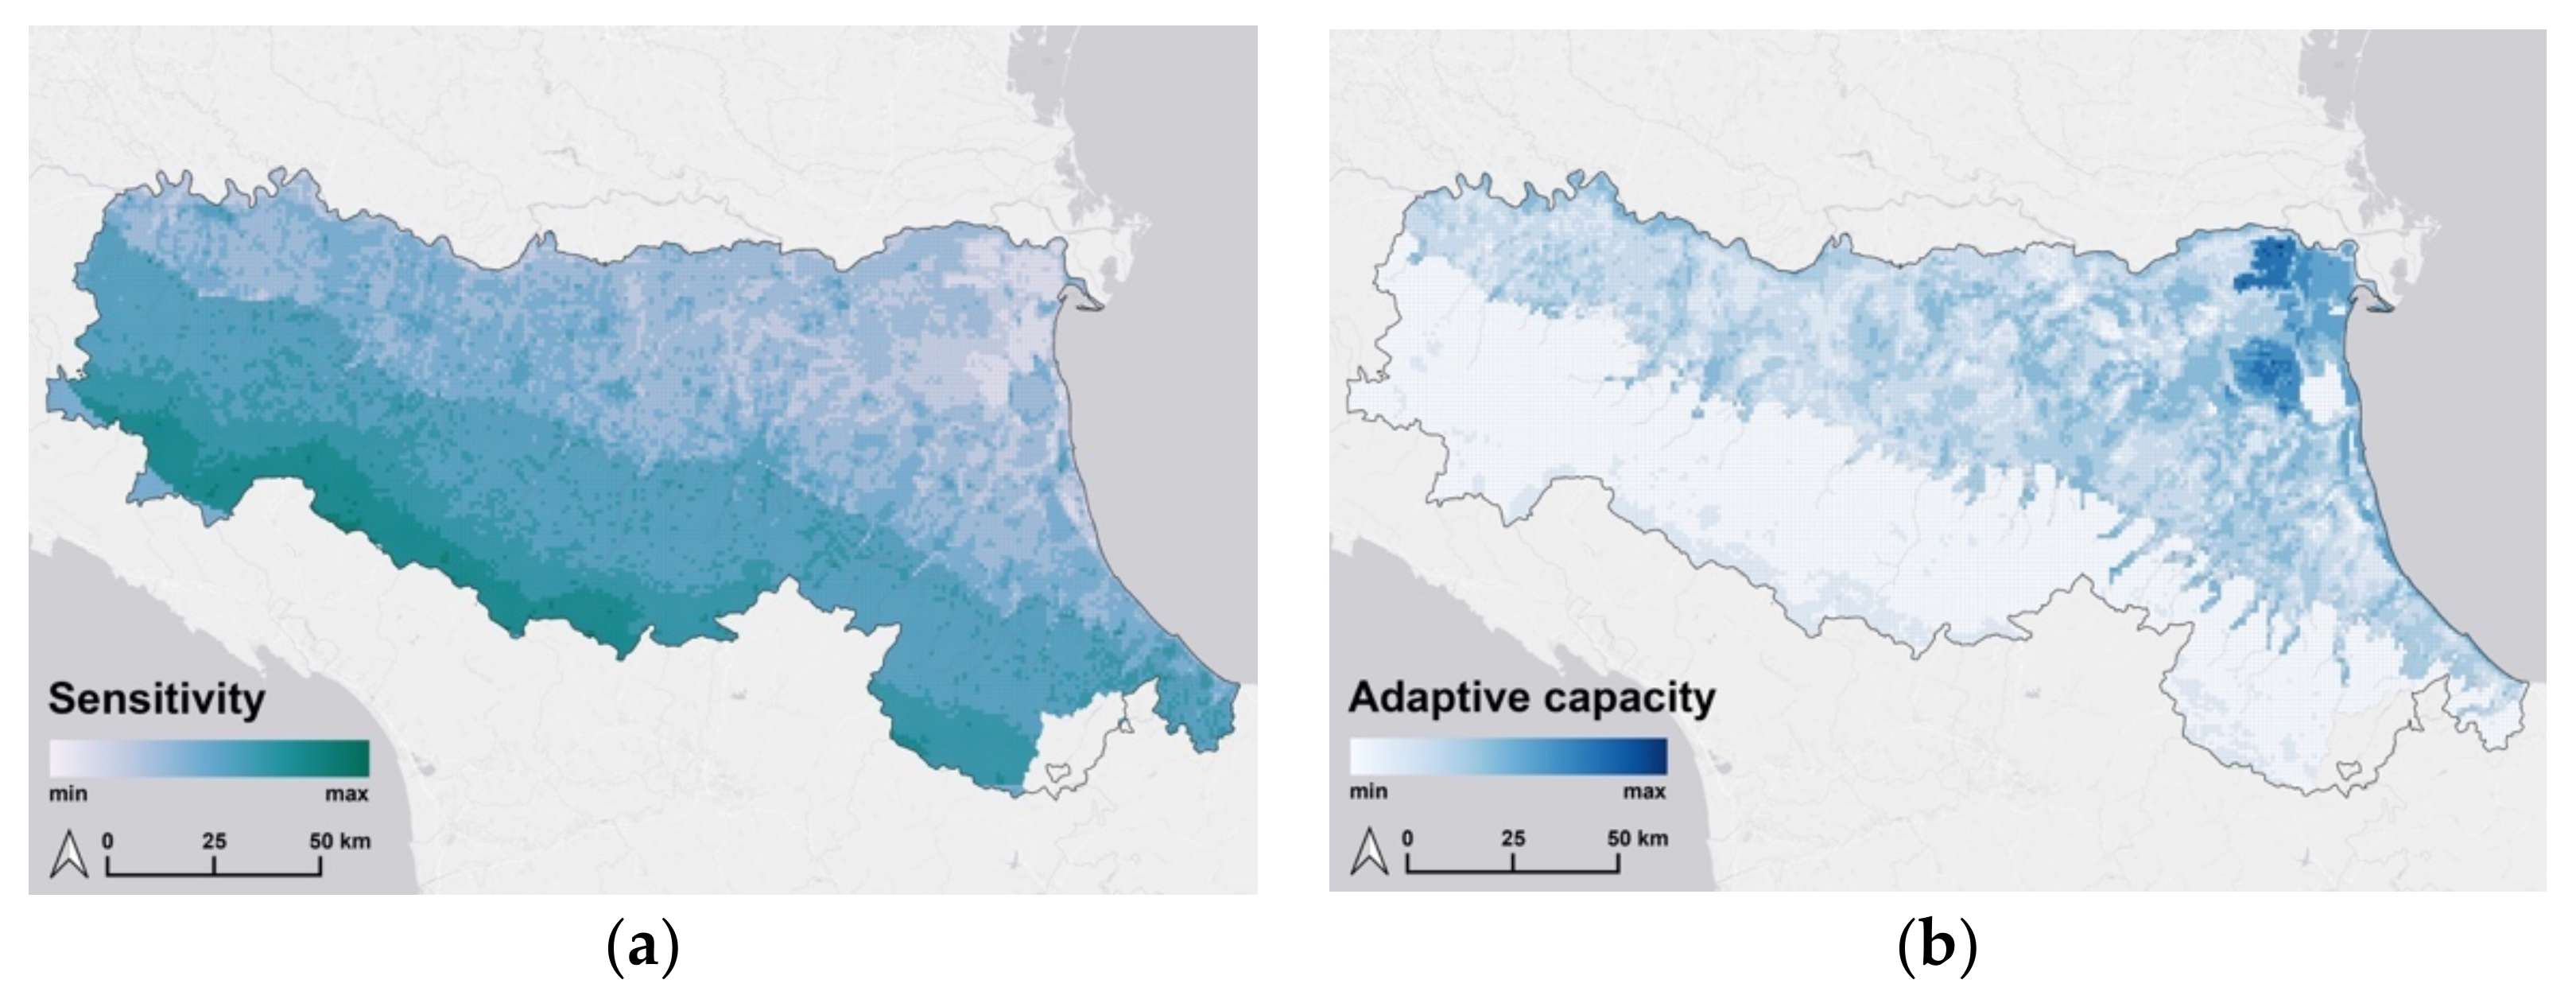
Based on the previous steps carried out in GIS, it is possible to evaluate the vulnerability according to the 5 variables used. To do this, the two partial results obtained in steps 1 and 2, respectively “sensitivity” (Figure 3a) and “adaptive capacity” (Figure 3b) can now be merged following Equation (1).

Figure 3.
“Sensitivity” (a) and “Adaptive Capacity” (b). Sensitivity is “the degree to which a system is affected, either adversely or beneficially, by climate-related stimuli. The effect may be direct (e.g., a change in crop yield in response to a change in the mean, range or variability of temperature) or indirect (e.g., damages caused by an increase in the frequency of coastal flooding due to sea level rise).” Adaptive capacity is “The ability of a system to adjust to climate change (including climate variability and extremes) to moderate potential damages, to take advantage of opportunities, or to cope with the consequences” [54]. In this figure, as the scale of blue increases, the areas that are more sensitive (a) and with more adaptive capacity (b) to the phenomenon analyzed are identified.
The IPCC Third Assessment Report (TAR) describes vulnerability as “The degree to which a system is susceptible to, or unable to cope with, adverse effects of climate change, including climate variability and extremes. Vulnerability is a function of the character, magnitude, and rate of climate variation to which a system is exposed, its sensitivity, and its adaptive capacity” [54].
In this figure, the areas depicted in blue represent “Low Vulnerability”, while those in red representing “High Vulnerability”. The areas in the administrative boundaries of the Emilia Romagna region shown in white have a slope >5%.
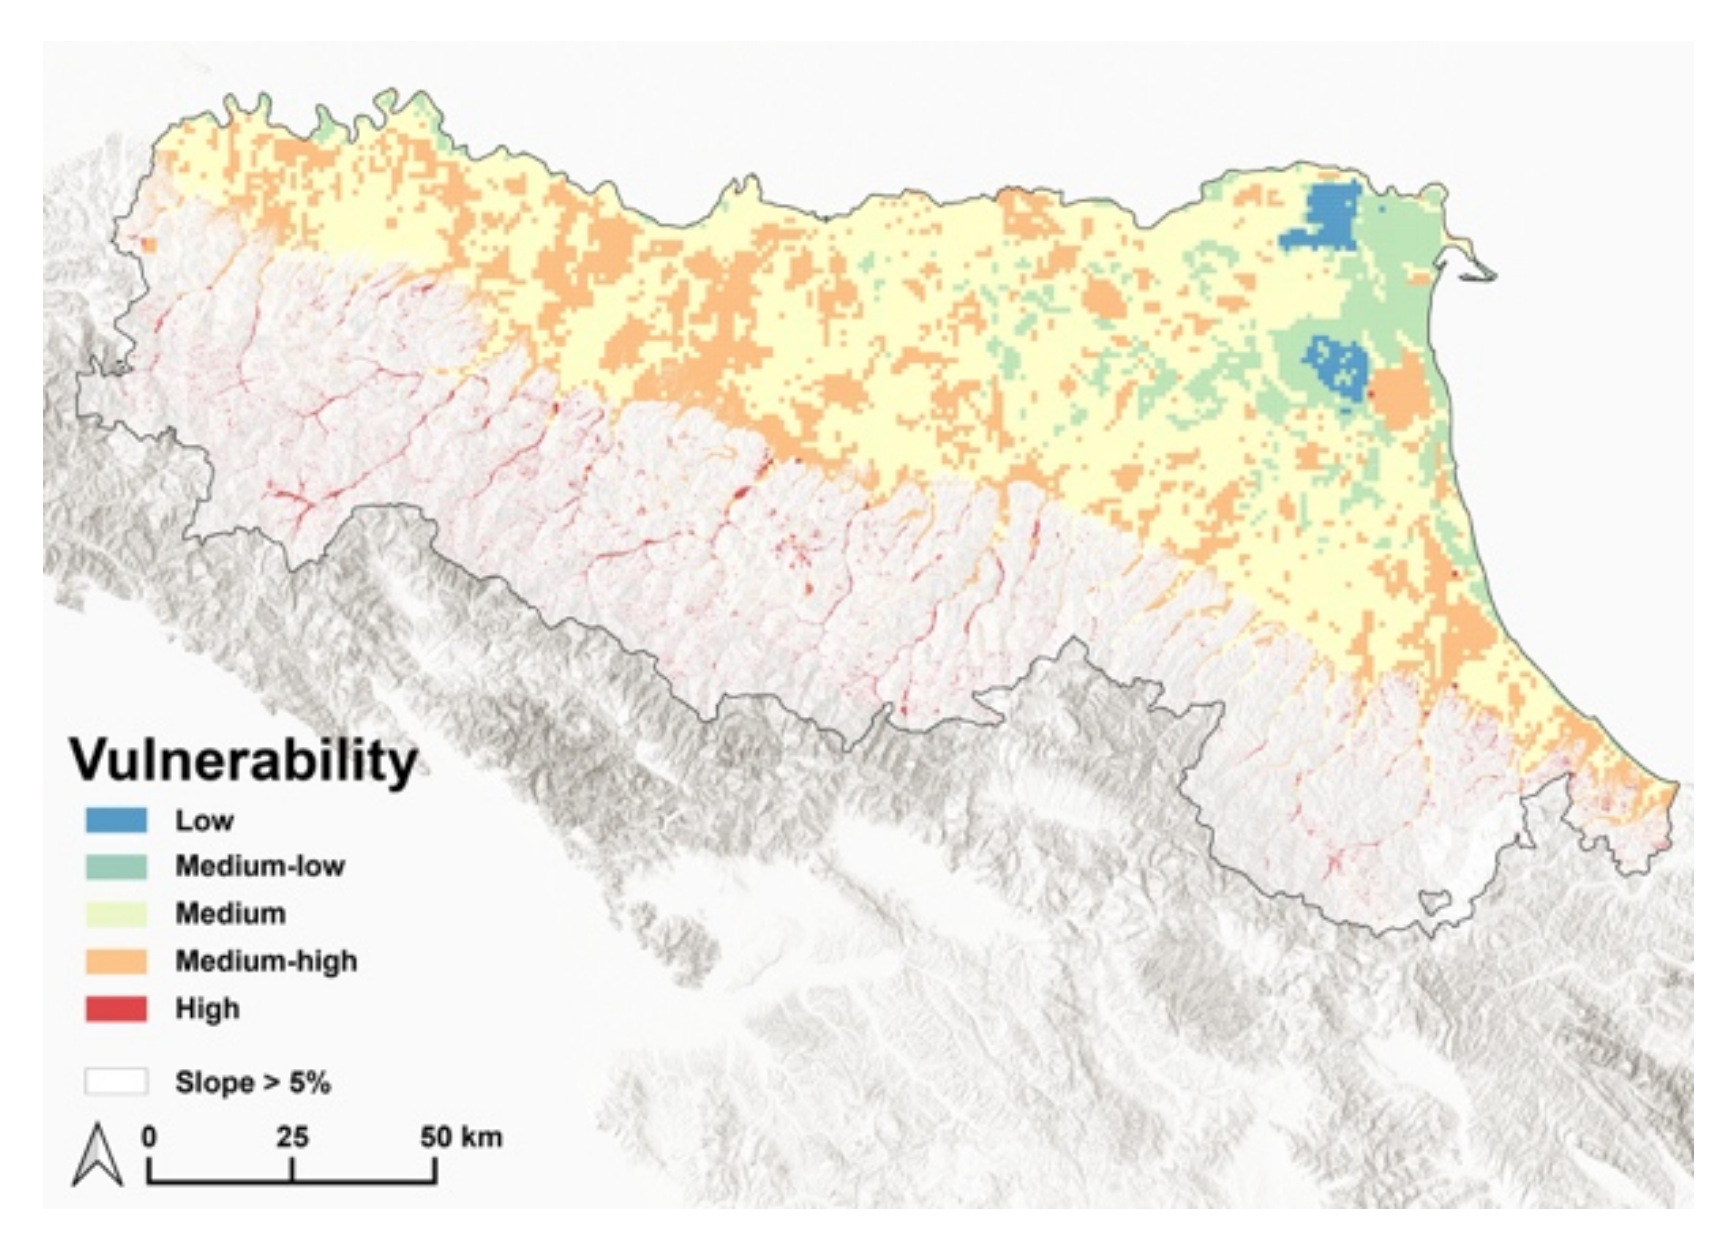
Operationally, after implementing the values resulting from step 1 and step 2 in the matrix, it was possible to carry out the aforementioned operation in GIS, thus obtaining the resulting information layer. The layer results were obtained thanks to the “raster calculator” tool. This layer was split into 5 vulnerability classes in equal intervals (Figure 4). Then, in the GIS environment, using the “field calculator” tool, a selection was made for all areas with a slope of less than 5%t, which are considered flat areas [55], and is a value that defines high-risk situations in terms of flood hazard [56].

Figure 4.
“Vulnerability”.
3. Results
The GIS-based approach results are displayed in Figure 3, where the two steps are developed. Then, in Figure 4, the main result about the spatial distribution of vulnerability to flooding is visualized. Figure 3a identifies the “sensitivity”, where the areas with high value are all mainly located in the hilly belt and artificial contexts. On the other hand, Figure 3b maps the “adaptive capacity” which shows a less homogeneous behavior, but with the highest values near the delta zone. Figure 4 shows how the vulnerable areas are distributed mostly at the foot of the morphological reliefs, where there are various urban contexts, or in any case, anthropized. In this sense, it is relevant to underline that the Emilia Romagna plain is characterized by an urban infrastructure along the via Emilia.
Approximately 1,068,678,386 ha of the potential area was mapped, of these vulnerability classes, “Low” and “Medium Low” represent about 11.44%, while the 30.31% fall into classes “High” and “Medium High”, as shown in Table 5. By this comparison, it is possible to note that the most vulnerable areas are more than double when compared to the less vulnerable areas. Another aspect is represented by the extreme High and Low classes, which similarly show a reduced presence of 1.31 and 2.23% respectively, while the intermediate class is the largest, reaching almost 60% of the total territory.
Table 5.
Detail of the surfaces of the vulnerability classes.
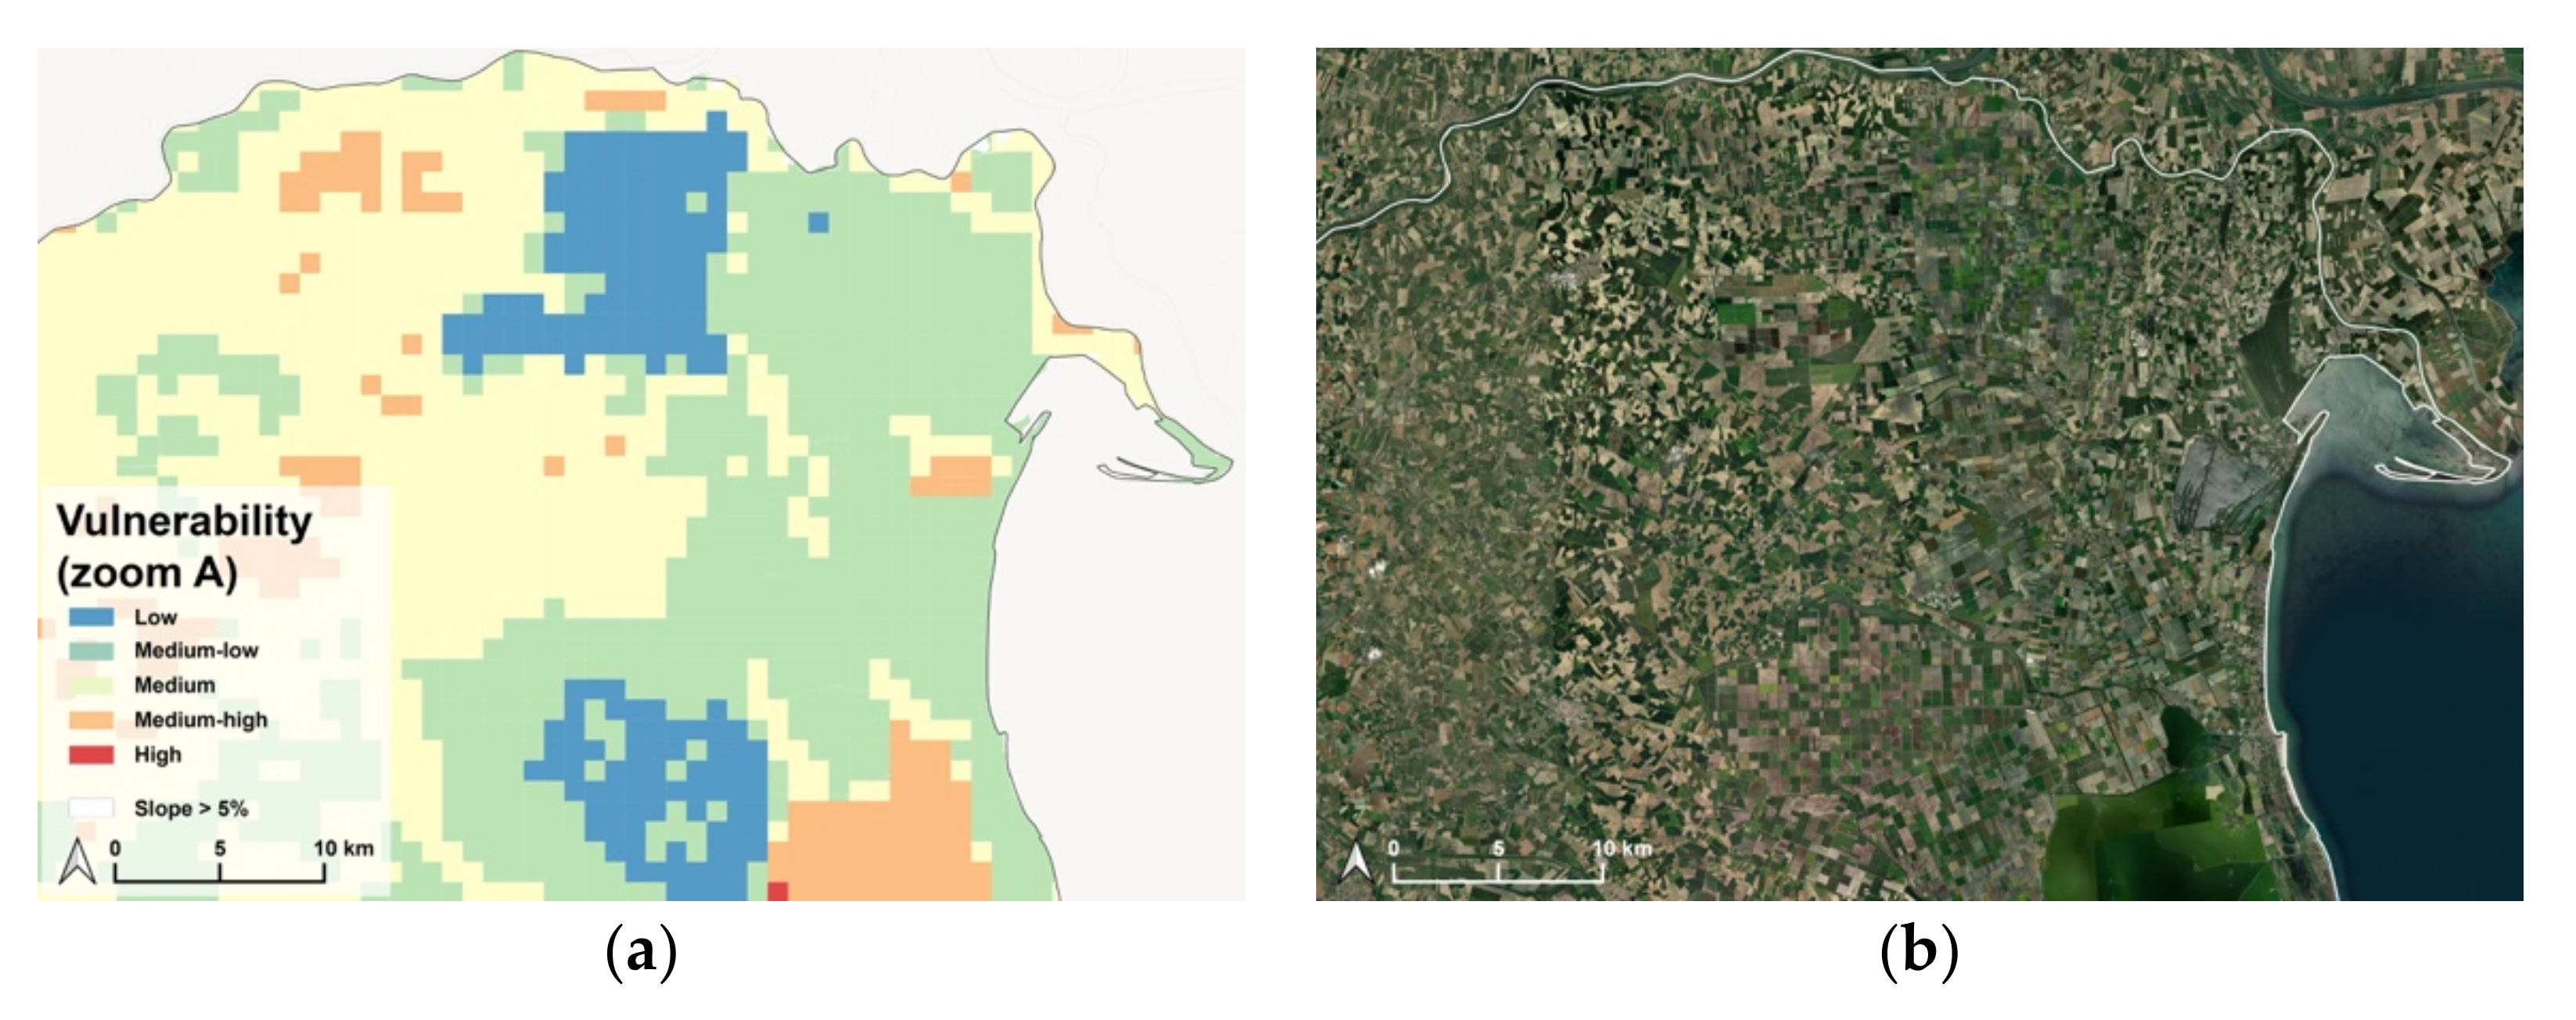
As shown previously, there are several factors contributing to the vulnerability rank of the territory; some characteristics of these areas are intelligible also from satellite images. In Figure 5 it is possible to note that two rural zones are assessed as “low vulnerable” areas (blue colour). In particular, the ability of the soil to transmit water when it is in high saturated condition (Ksat), a high organic carbon content in soils and a low occurrence of land uses with low runoff coefficients, and a favourable land conformation all play a role in determining the vulnerability level of these two areas. These areas correspond to the drainage land of the Ferrara region, recently formed territories, established precisely to counteract flooding phenomena. It is probable that land adaptation processes have contributed to making these areas less vulnerable, in dealing with this type of hazard.

Figure 5.
“Vulnerability”: zoom A (a) and satellite view (b). In this figure, the areas depicted in blue represent “Low Vulnerability”, while those in red represent “High Vulnerability” (a). Figure (b) is the satellite view of the area.
Within the five vulnerability classes it is possible to note how the presence of land uses are present in various ways (Table 6). The agricultural land-use class is the most extensive of all, reaching values ranging from 54.31 to 97.72%. It is also interesting to note that about 83.56% of the territory that falls under “Medium High” has agricultural use, leaving a marginal role to others. This suggests the importance of involving a sufficient number of local actors in a synergic and shared way, capable of taking appropriate decisions and measures [57].
Table 6.
Land cover detail of vulnerability class surfaces.
4. Discussion
This study investigated and describes a spatial analysis methodology of the vulnerability to flooding applied to the rural context of the Emilia Romagna region. This contributes to partially filling the gap in knowledge in the field since, unlike the widely treated urban context, the rural area is still poorly studied at the territorial scale regarding IPCC methodology for adaptation to climate change. The study shows step-by-step guide on how to develop a GIS-based approach for identifying the sensitivity and the adaptive capacity property, to identify the vulnerable areas. The mapping approach developed was able to support the investigation of the case study regarding flooding and climate change. Although using a more detailed database should make it possible to know the performance in greater detail, the proposed methodology simply allows for making a relevant estimation at the regional scale that is mostly relevant for policy definition and assessment, and territorial planning decision. Moreover, the advantage of this approach is the ease of replicating it in other spatial contexts, by the definition of local proxies. These have to be based on available information layers, usually held by the local government, or which can be obtained with satellite data.
In the study of the vulnerability to flooding, it was decided not to consider the entire territory, as the phenomenon occurs in contexts with low slopes. We believe that the methodology and the study developed can be transferred to other contexts for analyzing other rural contexts, suggesting policy orientations, and integrating adaptation considerations in urban planning. From an administrative point of view, it is important to avoid reducing the issue of vulnerability to extreme events only, also considering the tendential aspects.
The conducted analysis, also considering all the limits, represents a good starting point in assessing the degree of vulnerability, not just under a single view but considering different aspects. The limits that can be identified can be briefly summarized as follows:
- concerning the datasets used, a limited availability of uniform layers for the whole regional area (i.e., Saturated Hydraulic Conductivity that does not cover all the area) and a heterogeneity of the layers between different areas (i.e., Soil organic carbon, with a different definition between mountain and valley);
- lack of dynamism of some layers with respect to the real evolution of the territory (i.e., Corine Land Cover is made every 6 years);
- the inevitable approximation of reality, resulting from the use of a limited set of layers;
- absence of a socio-economic assessment of vulnerable elements within the methodology;
- consideration of water surfaces in the runoff model, such as rivers, as elements of vulnerability;
- an appropriate estimation of the weights of the individual layers considered for the assessment, appropriately declined according to the territorial context in which it is inserted, as [58].
Therefore, more exploration and practical implementation has to be developed to achieve important knowledge and fill the existing gap. This type of study can influence the success of strategies aimed at reducing vulnerabilities, both in terms of security and adaptation to climate change, therefore the institutional framework has to be defined appropriately, taking into account not only environmental frameworks. The study of spatial vulnerability to certain climate change hazards on a regional scale can be applied and adapted, in particular, in the definition of actions resulting from agricultural policy and landscape planning.
- As far as agricultural policy is concerned, a process that produces this kind of result could be a very useful tool to better choose the areas that need the most support. In order to do this, the method and the relative results need to be adapted to the zonal characterizations that are used by Rural Development Plans to have a concrete and easy application.
- In the same way, the methodology discussed in this paper can become a tool that can make important additions to landscape planning tools such as the Regional Landscape Plan, particularly with respect to the higher degree of susceptibility associated with certain areas and can therefore support choices for the maintenance of certain landscapes in particular.
5. Conclusions
This article highlights how the issue of the vulnerability of territories to a particular climate change phenomenon, such as heavy rainfall, can also be investigated on a large scale as the rural one. This method can be replicated for different hazards, that insists in parallel, and could allow a synoptic view of territories with respect to climate change.
Finally, it is clear that without a wide planning process promoted by the public administration and a local engagement, it is not easy for private citizens and farmers to work in a synergic way to minimize negative effects. Therefore, to successfully implement the spatial assessment of flooding, there is a need for institutional and governance direction.
Especially in a perspective of rural land adaptation, with a major driver such as CAP, giving priority in action to the most vulnerable territories is an important act of resource efficiency, in particular for the new period of reform, increasingly oriented toward financing result-based actions and in adapting measures to local conditions.
These aspects should be able also to define and implement local policies coherently with the other planning decisions, and adaptation implications should be mainstreamed in local planning. In this sense, local administrations and municipalities play a crucial role, also providing access to land through permissions (“top-down policymaking”).
Author Contributions
Conceptualization, G.D.G. and G.L.; Data curation, G.D.G. and K.F.; Formal analysis, M.R. and G.L.; Investigation, G.D.G. and A.B.; Methodology, G.D.G., K.F. and G.L.; Resources, G.D.G. and A.B.; Software, K.F.; Supervision, M.R. and G.L.; Validation, G.D.G., M.R. and G.L.; Visualization, K.F.; Writing—original draft, G.D.G. and A.B.; Writing—review & editing, G.D.G., A.B. and K.F. All authors have read and agreed to the published version of the manuscript.
Funding
This research was funded by Regione Emilia Romagna and Università Iuav di Venezia, grant number E78D20000880007 and The APC was funded by Università Iuav di Venezia.
Institutional Review Board Statement
Not applicable.
Informed Consent Statement
Not applicable.
Data Availability Statement
Publicly available datasets were analyzed in this study. This data can be found here: DTM: https://geoportale.regione.emilia-romagna.it/catalogo/dati-cartografici/altimetria/layer-2 (accessed on 20 February 2022); CLC: https://geoportale.regione.emilia-romagna.it/approfondimenti/database-uso-del-suolo (accessed on 16 June 2022); Rain scenarios (layer ii): https://www.arpae.it/it/temi-ambientali/clima/dati-e-indicatori/tabelle-climatiche/tabelle-climatologiche-1961-2020 (accessed on 20 February 2022); Saturated Hydraulic Conductivity (layer iii): https://geoportale.regione.emilia-romagna.it/catalogo/materiale-cartografico/pubblicazioni/cartografia-e-territorio/pedologia (accessed on 15 June 2022); Soil organic carbon (layer iv): https://ambiente.regione.emilia-romagna.it/it/geologia/suoli/proprieta-e-qualita-dei-suoli/carbonio-organico (accessed on 19 February 2022); Infiltration capacity (layer v): https://datacatalog.regione.emilia-romagna.it/catalogCTA/dataset/r_emiro_2020-12-18t103843 (accessed on 13 February 2022).
Acknowledgments
We are highly thankful for administrative and technical support (such as, the materials used for studies): Emilia-Romagna Region, in particular: Graziella Guaragno; Giovanni Pancaldi, Forestry Standards; Nicola Laruccia, Zoning and Crop Graphic Plans; Agriculture Service; Paola Tarocco, Soil Service; Patrizia Bianconi, Sustainable Development; Sofia Cei, Agritourism; Paola Siragusa, Agricultural Motor Users; Giampaolo Sarno, Effluents and Livestock Waste; Eng. Patrizia Ercoli, Plans and Programs Hydraulic Sector. ARPAE Emilia-Romagna, in particular: C. Cacciamani and R.Tomozeiu; Iuav University of Venice: Gianfranco Pozzer, Denis Maragno.
Conflicts of Interest
No conflict of interest is declared by the authors.
References
- Tripathi, A.; Tripathi, D.K.; Chauhan, D.K.; Kumar, N.; Singh, G.S. Paradigms of Climate Change Impacts on Some Major Food Sources of the World: A Review on Current Knowledge and Future Prospects. Agric. Ecosyst. Environ. 2016, 216, 356–373. [Google Scholar] [CrossRef]
- Hoegh-Guldberg, O.; Jacob, D.; Taylor, M.; Bindi, M.; Brown, S.; Camilloni, I.; Diedhiou, A.; Djalante, R.; Ebi, K.; Engelbrecht, F.; et al. Impacts of 1.5 °C Global Warming on Natural and Human Systems. In Global Warming of 1.5 °C. An IPCC Special Report on the Impacts of Global Warming of 1.5 °C above Pre-Industrial Levels and Related Global Greenhouse Gas Emission Pathways, in the Context of Strengthening the Global Response to the Threat of Climate Change, Sustainable Development, and Efforts to Eradicate Poverty; Masson-Delmotte, V., Zhai, P., Pörtner, H.O., Roberts, D., Skea, J., Shukla, P.R., Pirani, A., Moufouma-Okia, W., Péan, C., Pidcock, R., et al., Eds.; World Meteorological Organization Technical Document: Geneva, Switzerland, 2018; Volume 3, pp. 175–312. [Google Scholar] [CrossRef]
- Lucertini, G.; Di Giustino, G. Urban and Peri-Urban Agriculture as a Tool for Food Security and Climate Change Mitigation and Adaptation: The Case of Mestre. Sustainability 2021, 13, 5999. [Google Scholar] [CrossRef]
- Scazzosi, L. Rural Landscape as Heritage: Reasons for and Implications of Principles Concerning Rural Landscapes as Heritage ICOMOS-IFLA 2017. Built Herit. 2018, 2, 39–52. [Google Scholar] [CrossRef]
- Pachauri, R.K.; Allen, M.R.; Barros, V.R.; Broome, J.; Cramer, W.; Christ, R.; Church, J.A.; Clarke, L.; Dahe, Q.; Dasgupta, P.; et al. Contribution of Working Groups I, II and III to the Fifth Assessment Report of the Intergovernmental Panel on Climate Change. In Climate Change 2014: Synthesis Report; Pachauri, R., Meyer, L., Eds.; IPCC: Geneva, Switzerland, 2014; Volume 1, p. 53. ISBN 978-92-9169-143-2. [Google Scholar]
- Alexander, L.V. Global Observed Long-Term Changes in Temperature and Precipitation Extremes: A Review of Progress and Limitations in IPCC Assessments and Beyond. Weather. Clim. Extrem. 2016, 11, 4–16. [Google Scholar] [CrossRef] [Green Version]
- Nelson, D.R.; Adger, W.N.; Brown, K. Adaptation to Environmental Change: Contributions of a Resilience Framework. Annu. Rev. Environ. Resour. 2007, 32, 395–419. [Google Scholar] [CrossRef] [Green Version]
- Tompkins, E.L.; Adger, W.N. Does Adaptive Management of Natural Resources Enhance Resilience to Climate Change? Ecol. Soc. 2004, 9, 10–96. [Google Scholar] [CrossRef]
- Fischer, G.; Shah, M.; Tubiello, F.N.; van Velhuizen, H. Socio-Economic and Climate Change Impacts on Agriculture: An Integrated Assessment, 1990–2080. Philos. Trans. R. Soc. A 2005, 360, 2067–2083. [Google Scholar] [CrossRef]
- Cutter, S.L.; Mitchell, J.T.; Scott, M.S. Revealing the vulnerability of people and places: A case study of Georgetown County, South Carolina in Hazards Vulnerability and Environmental Justice, 1st ed.; Löfstedt, R.E., Ed.; Taylor & Francis: London, UK, 2006; pp. 111–142. ISBN 978-18-4977-154-2. [Google Scholar]
- Füssel, H.M.; Klein, R.J.T. Climate Change Vulnerability Assessments: An Evolution of Conceptual Thinking. Clim. Chang. 2006, 75, 301–329. [Google Scholar] [CrossRef]
- Maragno, D.; Dall’omo, C.F.; Pozzer, G.; Musco, F. Multi-Risk Climate Mapping for the Adaptation of the Venice Metro-politan Area. Sustainability 2021, 13, 1334. [Google Scholar] [CrossRef]
- Litt, G.; Ferraioli, E.; Magni, F.; Lucertini, G.; Musco, F. Inter-Municipal Methodology for Climate Transition Strategies: The First Case in Italy. Sustainability 2022, 14, 2529. [Google Scholar] [CrossRef]
- Manni, W. Travel Emilia Romagna: The Official Emilia Romagna’s Tourism Blog. Available online: https://www.travelemiliaromagna.it/en/tastes-emilia-romagna/ (accessed on 17 June 2022).
- Tomozeiu, R.; Lazzeri, M.; Cacciamani, C. Precipitation Fluctuations during the Winter Season from 1960 to 1995 over Emilia-Romagna, Italy. Theor. Appl. Climatol. 2002, 72, 221–229. [Google Scholar] [CrossRef]
- Brunetti, M.; Buffoni, L.; Maugeri, M.; Nanni, T. Precipitation intensity trends in northern Italy. Int. J. Climatol. 2000, 20, 1017–1031. [Google Scholar] [CrossRef]
- Ward, P.; de Ruiter, M.; Mård, J.; Schröter, K.; van Loon, A.; Veldkamp, T.I.E.; von Uexkull, N.; Wanders, N.; AghaKouchak, A.; Arnbjerg-Nielsen, K.; et al. The Need to Integrate Flood and Drought Disaster Risk Reduction Strategies. Water Secur. 2020, 11, 100070. [Google Scholar] [CrossRef]
- Alam, M.M.; bin Toriman, M.E.; Siwar, C.; Talib, B. Rainfall Variation and Changing Pattern of Agricultural Cycle. Am. J. Environ. Sci. 2011, 7, 82–89. [Google Scholar] [CrossRef]
- Bérubé, S.; Brissette, F.; Arsenault, R. Optymal hydrological model calibration strategy for climate change impact studies. J. Hydrol. Eng. 2022, 27, 3. [Google Scholar] [CrossRef]
- Witze, A. Why extreme rains are getting worse. Nature 2018, 563, 458–460. [Google Scholar] [CrossRef]
- Bortone, G.; Regione Emilia Romagna, Servizio Tutela E Risanamento Risorsa Acqua. La Gestione Sostenibile Delle Risorse Idriche in Emilia-Romagna. Available online: https://slideplayer.it/slide/537169/ (accessed on 13 July 2022).
- Aziz, O.; Hussain, S.; Rizwan, M.; Riaz, M.; Bashir, S.; Lin, L.; Mehmood, S.; Imran, M.; Yaseen, R.; Lu, G. Increasing Water Productivity, Nitrogen Economy, and Grain Yield of Rice by Water Saving Irrigation and Fertilizer-N Management. Environ. Sci. Pollut. Res. 2018, 25, 16601–16615. [Google Scholar] [CrossRef]
- Zhang, Y. Influence of Frequent Flood Disaster on Agricultural Productivity of Rice Planting and Structural Optimization Strategy. Microprocess. Microsyst. 2021, 82, 103863. [Google Scholar] [CrossRef]
- Domeneghetti, A.; Carisi, F.; Castellarin, A.; Brath, A. Evolution of flood risk over large areas: Quantitative assessment for the Po River. J. Hydrol. 2015, 527, 809–823. [Google Scholar] [CrossRef]
- Persiano, S.; Ferri, E.; Antolini, G.; Domeneghetti, A.; Pavan, V.; Castellarin, A. Changes in seasonality and magnitude of sub-daily rainfall extremes in Emilia-Romagna (Italy) and potential influence on regional rainfall frequency estimation. J. Hydrol. Reg. Stud. 2020, 32, 100751. [Google Scholar] [CrossRef]
- Brunetti, M.; Maugeri, M.; Nanni, T.; Navarra, A. Droughts and extreme events in regional daily Italian precipitation series. Int. J. Climatol. A J. Rouyal Metereological Soc. 2022, 22, 543–558. [Google Scholar] [CrossRef]
- Zeleňáková, M.; Purcz, P.; Hlavatá, H.; Engineering, P.B.-P. Climate Change in Urban versus Rural Areas. Procedia Eng. 2015, 119, 1171–1180. [Google Scholar] [CrossRef] [Green Version]
- European Commission Website. The New Common Agricultural Policy: 2023–2027. Available online: https://ec.europa.eu/info/food-farming-fisheries/key-policies/common-agricultural-policy/new-cap-2023-27_en (accessed on 21 June 2022).
- Regione Emilia-Romagna Statistica. Available online: https://statistica.regione.emilia-romagna.it/ (accessed on 16 April 2022).
- Centro Meteo. Il Clima Della Regione Emilia-Romagna. Available online: http://www.centrometeo.com/articoli-reportage-approfondimenti/climatologia/5423-clima-emiliaromagna#:~:text=dal%20mare%20adriatico%20all%27entroterra,solo%20lungo%20la%20fascia%20costiera (accessed on 11 January 2022).
- Regione Emilia-Romagna Geoportale. Coperture Vettoriali Uso Del Suolo Di Dettaglio–Edizione 2020. Available online: https://geoportale.regione.emilia-romagna.it/catalogo/dati-cartografici/pianificazione-e-catasto/uso-del-suolo/layer-9 (accessed on 16 June 2022).
- Sistema Nazionale Per La Protezione dell’Ambiente. Consumo Di Suolo, Dinamiche Territoriali E Servizi Ecosistemici. Edizione 2021. Available online: https://www.snpambiente.it/2021/07/14/consumo-di-suolo-dinamiche-territoriali-e-servizi-ecosistemici-edizione-2021/ (accessed on 20 February 2022).
- ARPAE Emilia-Romagna. Rapporti Idro-Meteo-Clima Annuali. Available online: https://www.arpae.it/it/temi-ambientali/meteo/report-meteo/rapporti-annuali (accessed on 20 February 2022).
- Below, T.B.; Schmid, J.; Sieber, S. Farmers’ Knowledge and Perception of Climatic Risks and Options for Climate Change Adaptation: A Case Study from Two Tanzanian Villages. Reg. Environ. Chang. 2014, 15, 1169–1180. [Google Scholar] [CrossRef]
- Kiem, A.S.; Austin, E.K. Drought and the Future of Rural Communities: Opportunities and Challenges for Climate Change Adaptation in Regional Victoria, Australia. Glob. Environ. Chang. 2013, 23, 1307–1316. [Google Scholar] [CrossRef] [Green Version]
- Savari, M.; Damaneh, H.E. Drought vulnerability assessment: Solution for risk alleviation and drought management among Iranian farmers. Int. J. Disaster Risk Reducti. 2022, 67, 102654. [Google Scholar] [CrossRef]
- Hazarika, N.; Barman, D.; Das, A.K.; Sarma, A.K.; Borah, S.B. Assessing and Mapping Flood Hazard, Vulnerability and Risk in the Upper Brahmaputra River Valley Using Stakeholders’ Knowledge and Multicriteria Evaluation (MCE). J. Flood Risk Manag. 2018, 11, S700–S716. [Google Scholar] [CrossRef]
- Rehman, A.; Song, J.; Haq, F.; Ahamad, M.I.; Sajid, M.; Zahid, Z. Geo-Physical Hazards Microzonation and Suitable Site Selection through Multicriteria Analysis Using Geographical Information System. Appl. Geogr. 2021, 135, 102550. [Google Scholar] [CrossRef]
- Wu, F.; Sun, Y.; Sun, Z.; Wu, S.; Zhang, Q. Assessing Agricultural System Vulnerability to Floods: A Hybrid Approach Using Emergy and a Landscape Fragmentation Index. Ecol. Indic. 2019, 105, 337–346. [Google Scholar] [CrossRef]
- Tate, E.; Rahman, M.A.; Emrich, C.T.; Sampson, C.C. Flood exposure and social vulnerability in the United States. Nat. Hazards 2021, 106, 435–457. [Google Scholar] [CrossRef]
- Ebert, A.; Kerle, N.; Stein, A. Urban Social Vulnerability Assessment with Physical Proxies and Spatial Metrics Derived from Air- and Spaceborne Imagery and GIS Data. Nat. Hazards 2009, 48, 275–294. [Google Scholar] [CrossRef]
- Alomar-Garau, G.; Grimalt-Gelabert, M. Air Photo Interpretation for Spatial Analysis of Heritage Agrarian Structures in Mediterranean Settings as Sea-Breezes Proxy-Data. Application to the Island of Mallorca. Remote Sens. 2021, 13, 4652. [Google Scholar] [CrossRef]
- Smith, C.G.; Jones, M.C.; Osterman, L.E.; Passeri, D.L. Using Multiple Environmental Proxies and Hydrodynamic Modelling to Investigate Late Holocene Climate and Coastal Change within a Large Gulf of Mexico Estuarine System (Mobile Bay, Alabama, USA). Mar. Geol. 2020, 427, 106218. [Google Scholar] [CrossRef]
- Fuhrer, J.; Gregory, P.J. Climate Change Impact and Adaptation in Agricultural Systems-Introduction. In Climate Change Impact and Adaptation in Agricultural Systems; Fuhrer, J., Gregory, P.J., Eds.; CABI Climate Change Series: Zurich, Switzerland, 2014; pp. 1–6. ISBN 9781780642895. [Google Scholar]
- Sharma, J.; Ravindranath, N.H. Applying IPCC 2014 Framework for Hazard-Specific Vulnerability Assessment under Climate Change. Environ. Res. Commun. 2019, 1, 51004. [Google Scholar] [CrossRef]
- Periyasamy, P.; Yagoub, M.M.; Sudalaimuthu, M. Flood Vulnerable Zones in the Rural Blocks of Thiruvallur District, South India. Geoenviron. Disasters 2018, 5, 21. [Google Scholar] [CrossRef]
- Munyai, R.B.; Chikoore, H.; Musyoki, A.; Chakwizira, J.; Muofhe, T.P.; Xulu, N.G.; Manyanya, T.C. Vulnerability and Adaptation to Flood Hazards in Rural Settlements of Limpopo Province, South Africa. Water 2021, 13, 3490. [Google Scholar] [CrossRef]
- Frischen, J.; Meza, I.; Rupp, D.; Wietler, K.; Hagenlocher, M. Drought Risk to Agricultural Systems in Zimbabwe: A Spatial Analysis of Hazard, Exposure, and Vulnerability. Sustainability 2020, 12, 752. [Google Scholar] [CrossRef] [Green Version]
- Regione Emilia-Romagna Geoportale. DTM 5x5. Available online: https://geoportale.regione.emilia-romagna.it/catalogo/dati-cartografici/altimetria/layer-2 (accessed on 20 February 2022).
- Regione Friuli Venezia Giulia. Regulation Containing Provisions for the Application of the Principle of Hydraulic In-Variance Referred to in Article 14, Paragraph 1, Letter k) of the Regional Law of Water Use. 29 April 2015. Available online: http://decreti.regione.fvg.it/Storage/2018_83/ALLEGATO1%20AL%20DPREG%20083-2018.PDF (accessed on 21 February 2022).
- Regione Emilia-Romagna Ambiente. Proprietà Fisico-Idrogeologiche Dei Suoli. Available online: https://ambiente.regione.emilia-romagna.it/it/geologia/suoli/proprieta-e-qualita-dei-suoli/proprieta-fisico-idrologiche-suoli (accessed on 10 February 2022).
- Tarocco, P.; Marchi, N.; Staffilani, F. Carta Della Conducibilità Idraulica Satura Dei Suoli Della Pianura Emiliano-Romagnola. Available online: http://mappegis.regione.emilia-romagna.it/gstatico/documenti/dati_pedol/ksat_pianura.pdf (accessed on 10 February 2022).
- Calzolari, C.; Ungaro, F.; Maienza, A.; Tarocco, P.; Marchi, N. SOS4LIFE, Linee Guida Per La Valutazione Dei Servizi Ecosistemici Dei Suoli In Ambito Urbano E Azioni Concrete Per La Loro Gestione. Available online: https://www.sos4life.it/wp-content/uploads/SOS4Life-Valutazione-servizi-ecosistemici-dei-suoli-in-ambito-urbano-e-azioni-per-la-loro-gestione_B.1.3-1.pdf (accessed on 10 February 2022).
- Ahmad, Q.K.; Anisimov, O.; Arnell, N.; Brown, S.; Burton, I.; Campos, M.; Canziani, O.; Carter, T.; Cohen, S.J.; Desanker, P.; et al. Summary for Policymakers. In Climate Change 2001: Impacts, Adaptation, and Vulnerability; McCarthy, J.J., Canziani, O.F., Leary, N.A., Dokken, D.J., White, K.S., Eds.; Cambridge University Press: Cambridge, UK, 2002; ISBN 0-521-80768-9. [Google Scholar] [CrossRef]
- EXEO edizioni, Caratteristiche Dei Terreni. Available online: https://www.exeo.it/faq/130/caratteristiche-terreni.aspx (accessed on 21 February 2022).
- Getahun, Y.S.; Gebre, S.L. Flood Hazard Assessment and Mapping of Flood Inundation Area of the Awash River Basin in Ethiopia Using GIS and HEC-GeoRAS/HEC-RAS Model. J. Civ. Environ. Eng. 2015, 5, 1. [Google Scholar] [CrossRef]
- Lucertini, G.; Di Giustino, G.; dall’Omo, C.F.; Musco, F. An innovative climate adaptation planning process: iDEAL project. J. Environ. Manag. 2022, 317, 115408. [Google Scholar] [CrossRef]
- Nguyen, B.; Minh, D.; Ahmad, A.; Nguyen, Q. The role of relative slope length in flood hazard mapping using AHP and GIS (case study: Lam River Basin, Vietnam). Geogr. Environ. Sustain. 2020, 13, 115–123. [Google Scholar] [CrossRef]
Publisher’s Note: MDPI stays neutral with regard to jurisdictional claims in published maps and institutional affiliations. |
© 2022 by the authors. Licensee MDPI, Basel, Switzerland. This article is an open access article distributed under the terms and conditions of the Creative Commons Attribution (CC BY) license (https://creativecommons.org/licenses/by/4.0/).