Abstract
The water footprint (WF), based on irrigation water quality, is important as a decision-making tool for crop selection based on the comparative advantage of water consumption and yield to maximize agricultural water productivity and sustainably improve water use efficiency. This paper presents a generic link between climate variability and water footprint. To support this link, a case study is presented for wheat and maize in different agro-climate zones in Egypt. In this study, the three agro-ecological zones, Nile Delta, Middle Egypt, and Upper Egypt, were selected to represent three different microclimates. The climate data were analyzed to estimate reference evapotranspiration (ETo) and calculate crop water use (CWU) for wheat and maize from 2015 through 2019. Cultivated area and yield data were analyzed during the study period. Water footprint (WF) was calculated for old land (clay soils) and new lands (sandy soils) in three climate regions based on blue and grey water. Green water was excluded due to negligible rainfall depths in Egypt. The results showed that the mean values of WF for maize were 1067, 1395, 1655 m3/ton in old land and 1395, 1634, 2232 m3/ton in new land under the three climate regions, respectively, while it was 923, 982, 1117 m3/ton in old land and 1180, 1258, 1452 m3/ton for wheat in new land for the three regions, respectively. The results show that the crop water use fluctuated over regions due to climate variability where the CWU values were 6211, 7335, 8007 m3/ha for maize and 4348, 4825, 5774 m3/ha for wheat in the three regions, respectively. The results show an 11% and 33% increase in maize and an 18% and 29% increase in wheat CWU in Middle and Upper Egypt regions comparing to what was observed in Nile Delta due to an increase in solar radiation, temperature, and wind speed. The Egypt mean value of wheat water footprint was 1152 m3/ton and mean value of maize water footprint was 1563 m3/ton. The data clearly show the effect of microclimate variability on WF and irrigation requirements between regions. The methodology and results from this study provide a pathway to help the policy makers to mitigate climate change impacts on crop yield and to enhance water resources management in major crop production regions by redistribution of the cropping patterns based on the comparative advantages of each crop within each region. The crop choices relative to the soil water retention characteristics could also contribute to the moderation of microclimate, which affects ETo and ETc and the water footprint.
1. Introduction
Rapid population growth, food demand, consumption behaviors, and climate change all increase the pressure on freshwater supply. The water consumption in agriculture has increased more than six times in the past century, where it has now reached almost more than 70% of the available freshwater (FAO, 2012) [1]. Furthermore, a significant demand on freshwater is projected to increase in the coming years. Therefore, improving agricultural water management is becoming more urgent than ever. We need to find ways and means to use the available water more efficiently to sustainably improve the food production (El-Fetyany et al., 2021) [2]. This improvement includes irrigation water saving and crop selection of water-efficient and climate-smart varieties.
Egypt lies in a dry region of the world, creating big challenges concerning available water resources for agriculture due to population increase and ambitious land reclamation plans needed to meet the increasing food demand. Therefore, the Egyptian sustainable agricultural development strategy 2030 emphasizes good on-farm irrigation management to maintain or improve the agricultural productivity using the inadequate quantities of water available for agriculture (Amal Mohamed et al., 2021) [3]. There is an urgent need to count on every drop of water consumed to conserve the already scarce resource for coming generations and achieve the sustainable agricultural development.
In order to achieve efficient agricultural water use with limited water supply and inadequate irrigation practices at a field level, an accurate assessment of the agricultural water consumption is crucial to improve on-farm water use efficiency and sustainably manage water resources (Yuping Han et al., 2018) [4]. In agricultural productivity, substantial benefits are achieved through increasing yields and reducing unnecessary water losses, which include non-beneficial water use at farm level and non-recoverable losses at system level. At the farm level, the objective is to decrease the field evaporation and deep percolation over the growing season to maximize the ratio of maximum units of yield (Y) to units of water. This ratio is the consumptive water footprint (CWFP) according to Hoekstra et al. (2011) and Hoekstra (2013) [5,6].
Crop selection is an important factor to identify crop characteristics for a certain climatic region based on the response of these crops to water use and their productivity. One of the criteria for identifying the crop characteristics is the accurate assessment water footprints. It provides a novel perspective for understanding the relationship between physical and virtual water use for agricultural production. The water footprint is used as a multidimensional indicator for water consumption from various sources. Green water footprint refers to the use of rainwater, blue water footprint refers to surface and ground freshwater uses, and grey water footprint refers to the water required to alleviate the pollution from freshwater (Hoekstra et al. (2011)) [5].
In many cases, agriculture consumes about 85% of surface and ground fresh water, however, Hoekstra and Chapagain (2006) [7] estimated that the virtual water represents about 16% of total global water consumed. The water footprint provides information on trade flows in terms of virtual water, especially from the countries rich in green water. In the current study, however, we consider that the water footprint in Egypt is mainly blue and grey water due to the negligible winter rainfall.
Water footprint is a function of crop evapotranspiration during the growing season and the yield produced from the volume of water used. Therefore, weather variability needs consideration when calculating the water footprint because it has microclimate effects on water consumption and, hence, water supply planning at both the farm and regional levels. Samia et al. (2018) [8] studied the evolution of water productivity over the last 30 years to explore the effect of climate change and weather variability on water productivity in order to estimate crop water productivity for spatially variable climatic conditions in Egypt. The result from their study enabled optimal production per unit of water usage through the redistribution the cropping pattern by climate zones based on water productivity.
Hoekstra and Chapagain (2008) [9] suggested the water footprint as an indicator for freshwater use in terms of quantity and quality that are consumed for production. Additionally, it identifies the level of pollutants in the production process. The water footprint for assessing crop production demonstrates whether the quality of utilized water during the crop growth is from green-water or blue-water, along with their quantities.
Agronomic practices that effect the grey water footprint (GWF) include the nitrogen (N) application rate, the form of N applied, the tillage level, pest and diseases treatments, and the irrigation practice (applied water quantity and quality). A low nitrogen application rate will reduce plant growth and consequently reduce the crop yield. This will reduce water pollution per hectare, but a large yield will occur. A high nitrogen application rate up to a certain limit will result in a high yield, but also a higher level of pollutants per hectare and per ton of yield produced (Raun et al. (2002)) [10].
Rafaela Flacha et al. (2021) [11] assessed water productivity and footprint for rainfed cotton, maize, soybeans, and wheat under different crop and water management scenarios in Brazil. They found that the crop water productivity under fertilizer-based intensification irrigation practice is higher than that obtained under irrigation-based intensification without fertilization. This is the trend to a certain limit—where adding more fertilizers would not result to a significant improvement of the yield while increasing the grey water footprint due to increased pollution level.
Chukalla et al. (2015) [12] conducted a comprehensive analysis of the potential to reduce the consumptive water footprint of few crops at the field level by changing management practice such as irrigation technique, irrigation strategy, and mulching practice. They found that the highest reduction in consumptive water footprint was 28% for drip irrigation. Unreasonable nutrient management mainly contributed to pollution of freshwater. Many previous studies have assumed that 10% of the nitrogen application rate was subject to leaching and runoff.
El-Gafy (2014) [13] assessed water footprint for wheat and virtual water nexus using a System Dynamic model, and he found that the water footprint of wheat production and consumption in Egypt changes according to the changes in the foreign trade, per capita consumption, population, and climate effects. The water footprint assessment tool is appropriately used to find remedial measures for water resource management problems. The blue and green water footprints help to identify the amount and type of freshwater consumed for crop production (Ercin et al., 2011) [14]. Mekonnen and Leenes (2020) [15] reported that the water footprint is expected to increase by up to 22% as a result of climatic change and change in land use by 2090. Therefore, action to improve water sustainability and protect the ecosystems is critically important.
In order to overcome the water shortage challenges, Egypt’s national water resources management strategy has included policies and action plans to manage water demand and supply, considering the protection of its water resources. The water resources management strategy is aligned with the agricultural development strategy 2030 to address the challenges of producing more food with the limited water resources available. Therefore, water footprint and virtual water assessment is crucial to enhance water use efficiency. Thus, the current study aims at assessing the water footprint of the main grain crops in Egypt (wheat and maize) in different agroecological zones to elaborate the effect of microclimate and climate variability on the water footprint and to help decision makers to identify the proper cropping patterns based on their comparative advantage under different conditions.
2. Methods and Data
2.1. Study Area
This study focuses on wheat and maize cultivated areas in Egypt, considering different agro-climatic zones based on the mean of climate parameter records. According to the updated Sustainable Agricultural Development Strategy 2030 (SADS, 2019) [16] and as shown in Figure 1, the main agro-climatic zones in Egypt represent the most agricultural production areas: (a) Nile Delta Region (30–31° N), represented by 12 governorates, namely Qaliobeya, Menoufeya, Gharbeya, Dakahleya, Kafr El-Sheikh, Dumyat, Beherah, Alexandria, Sharkeya, Port Said, Ismailia, and Suez. (b) Middle Egypt Region is located south of the Nile Delta (28–30° N), represented by four governorates (Giza, Fayoum, Beni Suif, and Menya). (c) Upper Egypt Region forms the Nile Valley (24–28° N), and is represented by six governorates (Asyut, Sohag, Qena, Luxor, Aswan, and the New Valley).
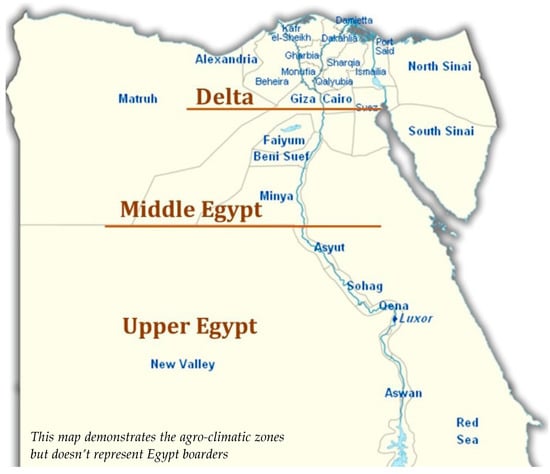
Figure 1.
The three different investigated agro-regions; Nile Delta, Middle, and Upper Egypt.
The Nile Delta presents about 50% of all agricultural lands of Egypt and it is home to about half of Egypt’s 105 million population (Samia et al., 2018) [8]. Middle and Upper Egypt represent the other 50% of food production areas. The agricultural practices and crop system are similar in the three climatic zones. The main difference between the three zones are the climate characteristics, which are demonstrated later in this section. In the current study, water footprints were calculated in these three different agroecological regions for two main grain crops, i.e., wheat in winter and maize in summer over a period of five years from 2015 to 2019.
2.2. Agronomic Characteristic of the Study Areas (Soil, Water, Crop)
In the study area of the three considered agro-climate zones, there were mainly two types of land, they are old land and new land described as follows:
Old Land: a clay soil which is the typical ancient Nile delta and Nile valley soil. The soil profile is well-developed and fertile. The fresh water from the Nile is the source for irrigation which allows the farmers to diversify their cropping pattern, as the soil and water both are good quality. The common irrigation system is flood irrigation, including improved surface irrigation method or traditional basin flood irrigation. The agricultural production and farming systems is characterized as an intensive and diversified survival system in which farmers maximize the farm revenue of small size holdings. The crops are mainly grain and fodder crops.
New Land: the newly reclaimed land in the expansion of the Nile Delta and Nile Valley with a farming period of around 20 to 30 years. The new land is mostly poor fertility sandy soil. The common crops in the new lands are orchards, wheat, and maize. The irrigation water sources are from the Nile and groundwater. The pressurized irrigation systems (drip, sprinkler, center pivot) are the common practices and flood irrigation is prohibited by law. The new land farming systems are characterized as large-scale commercial farming system.
The agricultural lands in the study area for both maize and wheat in the three agro-climate zones are fully irrigated by flooding the fields with a typical distribution uniformity DU = 0.60 in old land, while in the new lands, both crops irrigated by sprinkler irrigation for wheat with DU = 0.80 and drip irrigation for maize with DU = 0.90 (Samia et al. 2018 [8]. The old land areas in the three agro-climatic zones are served by an agricultural subsurface drainage system connected to open draining system, while the new lands are served by an open drain system. The open drains are used by farmers for supplemental irrigation in case they observe water shortage in the irrigation canals, especially at the tail-end. Most of the region is underlain by a water table at depths of 1.2 to 1.5 m, and there is ample year-round irrigation water application, so it is assumed that there is no water stress.
2.3. Investigated Crops
Wheat and maize are the main winter-summer crop rotation of grain crops in the Nile Delta and Valley in Egypt (Hamdy and Dawn, (2019) [17], with the annual mean cultivated area estimated at 1.43 and 1.13 million ha (MALR, 2021) [18]. Statistical data were obtained from the Ministry of Agriculture and Land Reclamation for the period 2015 through 2019, and the mean cultivated areas are shown in Table 1. The largest wheat cultivation area was in the Delta region followed by Middle Egypt, and the lowest wheat cultivation area was in Upper Egypt. The same trend was found for maize. The Delta region had the highest productively, i.e., 8.45 and 8.20 ton/ha for maize in the old and new land, respectively. The largest wheat productivity was 6.72 ton/ha in the old land in Upper Egypt. The new land wheat yield was 6.07 ton/ha in Nile Delta and Middle Egypt and 5.91 ton/ha in Upper Egypt.

Table 1.
The five years means of cultivated area and yield for wheat and maize in the three regions.
The applied nitrogen fertilizer (N) data are shown in Table 2 for old land (clay soil) and new land (poor sandy soil) for the three regions. The nitrogen applications were estimated based on the most common practice in the regions, as recommended by Agricultural Research Center of Egypt (ARC). The same nitrogen (N) applications are assumed for the three agro-climate regions. However, based on soil types, the nitrogen applications vary from old land to the new land within the same climatic zone.

Table 2.
Nitrogen fertilizer applications to the wheat and maize for old and new land in three agro-climate regions.
2.4. Climate Charactristics of the Study Area
The climate data were obtained from the Central Laboratory for Agricultural Climate (CLAC) of the Agricultural Research Center (ARC) of Egypt for the period from 2015 to 2019. The climate variables are collected by well-maintained weather stations located in the three agro-climate zones, and are used to estimate the ETo in order to calculate the actual evapotranspiration (ETc) using the crop coefficients from Allen et al. (1998) [19]. The ETc data is used to assess the water footprint in the old and new lands for both crops. Figure 2 shows the mean monthly maximum and minimum temperatures, relative humidity, wind speed, solar radiation, and total monthly rainfall used to estimate the ETo in the Nile Delta, Middle, and Upper Egypt.
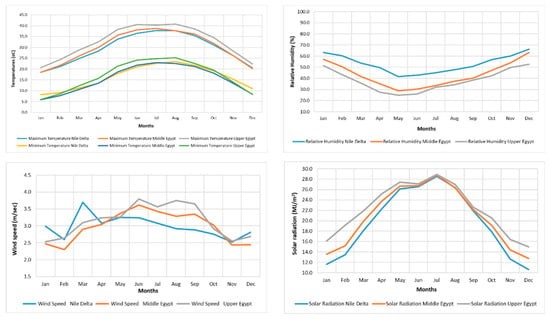
Figure 2.
Mean monthly maximum and minimum temperatures, relative humidity, wind speed, and solar radiation in the three study areas.
2.4.1. Nile Delta Region
The Nile Delta climate, where mean maximum temperatures rarely go beyond 37 °C in the summer and around 8 °C in the winter, is moderate compared to Middle Egypt and Upper Egypt. The rainfall is low with high fluctuations during winter, i.e., October through March. The maximum temperature peaks during July and August with a mean of 37 °C, where mean maximum temperatures rarely go beyond 37 °C in the summer and around 8 °C in the winter. The minimum temperature is in winter, with a mean of 8 °C mid-December to mid-February. The annual mean of maximum temperature is 29.3 °C and minimum temperature is 15.1 °C. The Nile Delta region is quite humid during the winter months with relative humidity of 44%, and less humid during summer with relative humidity of 66%. The annual mean wind speed is 3.1 m/s.
2.4.2. Middle Egypt Region
The Middle Egypt climate was similar for the Nile Delta and Upper Egypt regions, where maximum temperature is higher than 38 °C in summer with a cooler mean temperature of 5 °C in winter. As in the Nile Delta, Middle Egypt temperatures reach their peak in July and August with a mean maximum of 38.8 °C. Winter temperatures are near 5.8 °C during January. The mean maximum temperature during year is 30.1 °C and the minimum temperature is 16.2 °C. The Middle Egypt region is quite humid during the winter months, where relative humidity ranges from 28 to 63%. The wind speed is near 3.0 m/s over the year.
2.4.3. Upper Egypt Region
Upper Egypt climate has a dry, hot summer and dry, cold winter. The temperature is over 40 °C most of the time during summer and it is cold in winter, with a mean temperature of 6.0 °C. The mean maximum summer temperature in Upper Egypt is 41.0 °C and mean minimum winter temperatures is 5.9 °C. The annual mean maximum temperature during the year is 33.0 °C and the annual mean minimum temperature is 17.0 °C. The relative humidity ranges from 25% in summer to 52% in winter. The wind speed ranges from 2.3 to 3.8 m/s during the year.
2.5. Methods
2.5.1. Green Water Footprint (GWF)
The GWF of a crop is estimated as the ratio of the volume of green water consumed to produce the crop yield, CWUg (m3/ha), to the amount of crop yield, Y (ton/ha) according to the following equation proposed by Hoekstra et al. (2011) [5]:
The amount of green fresh water was calculated as the total monthly amount used (mm/month) over the crop growth period, considering that the crop irrigation requirements are fully met. The monthly water requirement is equal to the minimum difference between effective rainfall (Peff) and the crop evapotranspiration (ETc) according to Chapagain and Orr, 2009 [20]. The effective rainfall is that which is received during the growing period of a crop and is available to be fully depleted or to meet partially or fully the crop water requirements. It does not include surface run-off or deep percolation losses.
2.5.2. Blue Water Footprint (BWF)
The blue freshwater was considered to estimate the blue water footprint (WFblue, m3/ton) based on the crop water use and yield (CWUblue, m3/ha) divided by the crop (wheat and maize) yield (Y, ton/ha) as per the following equation (Hoekstra et al. (2011)) [5]:
Data of crop yield for summer maize and winter wheat in the three agro-climate zones were obtained from MALR for 2015–2019. The second parameter needed to calculate WFblue is crop water consumption (actual evapotranspiration ETa). The crop water use of blue water (CWUblue, m3/ha) was estimated using the accumulative daily actual evapotranspiration (ETa, mm/day) over the growing period as per the following equation (Hoekstra et al. (2011)) [5]:
where ETablue equals actual evapotranspiration based on irrigation applied water. The factor “10” was used to convert water depths in millimeters into water volumes per land area in m3/ha. The summation was calculated over the growing season from planting date to the harvest date as the mean during 2015–2019. The blue water evapotranspiration in mm/day was calculated under normal well-irrigated crop condition as a function of the crop coefficient (Kc) and the standardized reference evapotranspiration (ETo) according to Allen et al., 1998 [19]:
The ETo (mm/day) was calculated by FAO Penman Monteith method (Allen et al., 1998) [19] as described in the following equation:
where Rn is the net radiation over the crop (MJ m−2 day−1), G is the soil heat flux density (MJ m−2 day−1), T is the mean daily air temperature at 2 m height (°C), u2 is the wind speed at 2 m height (m s−1), es is the saturation vapor pressure (kPa) at T, ea is the actual vapor pressure (kPa), es − ea is the saturation vapor pressure deficit (kPa), Δ is the slope of the vapor pressure curve (kPa °C−1) at temperature T, and γ is the psychometric constant (kPa °C−1).
2.5.3. Grey Water Footprint (GWF)
Several studies such as Mekonnen and Hoekstra (2011) [21] estimated the grey water footprint by calculating the volume of water required to assimilate the nutrients that reach soil or surface water. Nutrients leached from the soil are the main source of pollution for surface and subsurface water-bodies. Several studies stated that the value of grey water footprint is very much correlated to the amount of nitrogen used. The GWF was estimated by multiplying the fraction (f) of nitrogen amount that leached from the applied nitrogen rate (LN) through the runoff, and dividing this by the difference between the maximum allowable concentration of Nitrate-nitrogen NO3-N (Cn,max) and the natural concentration of nitrogen (Cn,nat) received in water-body and multiplied by the actual crop yield (Y). In order to obtain an accurate estimation of the grey water footprint of a crop, an accurate estimate of the nitrogen fertilizer application rate and its losses by runoff should be granted. The following equation was proposed by Hoekstra et al. (2011) [5]:
Again, the grey water footprint estimates are closely related to the values of Cn,nat and Cn,max in the surface and subsurface water. Most published studies estimate the grey water footprint considering that Cn,nat is equal zero due to lack of data (Mekonnen and Hoekstra, 2020) [22]. For the maximum concentration of Cn,max, the recommended value of nitrate in surface and groundwater by the World Health Organization (WHO) (EU) is 50 mg nitrate (NO3) per liter, while the U.S. Environmental Protection Agency (US-EPA) recommends to use 10 mg/L of nitrate nitrogen (NO3-N). Thus, in most studies, the standard of 10 mg/L NO3-N is used [8], which is a reasonable assumption. The amount of N fertilizer used in wheat was 178 kg/ha for old land and 285 kg/ha for new land. The maize N fertilizer used was 285 kg/ha for old land and 357 kg/ha for new land. Therefore, in this study, a mean of 10% of the applied nitrogen fertilizer was considered lost through leaching and the natural nitrogen concentrations were set at zero.
2.5.4. Calculation of Total WF
An annual total WF was calculated for wheat and maize crops in the three climate regions (Delta, Middle, and Upper Egypt) in both new lands and old lands according to the following formula by Hoekstra et al. (2011) [5].
3. Results and Discussions
3.1. Reference Evapotranspiration (ETo) and Actual Evapotranspiration (ETa)
Data in Figure 3 illustrate the mean ETo values for different agro-ecological zones during 2015 through 2019. The crop evapotranspiration (ETc) depends on the climate parameters that determine the ETo and the crop coefficient (Kc).
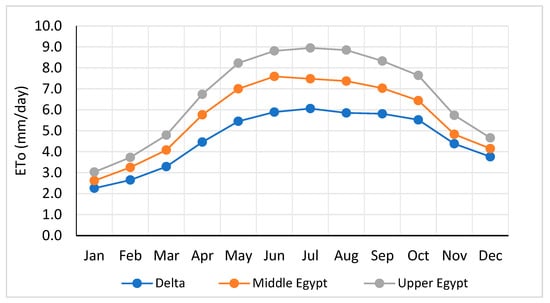
Figure 3.
Reference evapotranspiration for the agro-ecological zones as the mean of a five-year period from 2015 to 2019.
Additionally, the ETc is affected by agronomic practices and crop varietal. The investigated crops were under standard irrigation conditions with no water stress, assuming that the actual evapotranspiration (ETa) is equal to crop evapotranspiration (ETc). This assumption is supported by several field studies conducted in the same climate zones in Egypt (Samia et al., 2018) [8] to compare measured with estimated water consumption. Comparisons between potential and actual crop water consumption (ETc) and ETa estimated by modified Penman, Penman Monteith, and Doorenbos-Pruitt methods for wheat in Egypt were reported by El-Marsafawy et al. (1998 a) [23]. They found that the ratio between the ETc and ETa estimated by the three formulas were 1.05, 1.02, and 0.95, respectively. Mohamed et al. (2004) [24], El-Samanody et al. (2004) [25], El-Marsafawy et al. (1998 b) [26], and Rayan et al. (2000) [27] obtained similar results for other crops. Several studies indicate that the FAO-Penman Monteith method provided the closest match between ETc and ETa. Therefore, the calculated values of ETa were used in this research to represent ETc. Monthly ETo means were computed to allow calculation of seasonal water consumption for both wheat and maize.
The monthly ETo values in the Nile Delta region were lower than its value in Middle and Upper Egypt. The highest ETo in the Nile Delta region was observed in July (6.0 mm/day), while the lowest ETo was recorded in January (2.0 mm/day). The highest and lowest ETo value were recorded in Upper Egypt during July (9.0 mm/day) and January (3.0 mm/d), while in the Middle Egypt region they were 7.0 and 3.0 mm/day, respectively.
The actual evapotranspiration (ETa) is calculated for wheat and maize by using the reference evapotranspiration (ETo) and crop coefficient (Kc) for each crop, as shown in Figure 4 and Figure 5. The highest ETa value for wheat was recorded in January at Upper Egypt with value 6.0 mm/d and the lowest ETa was obtained in April at Nile Delta region with value 1.0 mm/d. The highest ETa value recorded for maize was 12.0 mm/day at Upper Egypt in August and lowest value was 4.0 mm/day at Nile Delta region in September.
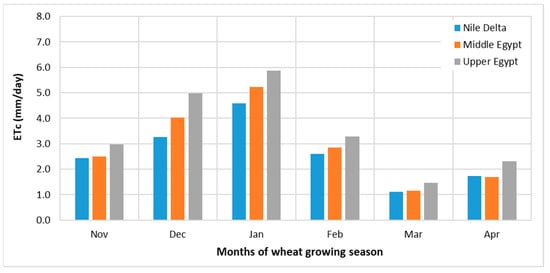
Figure 4.
Wheat crop evapotranspiration for the three agro-ecological zones as the mean of a five-year period from 2015 to 2019.
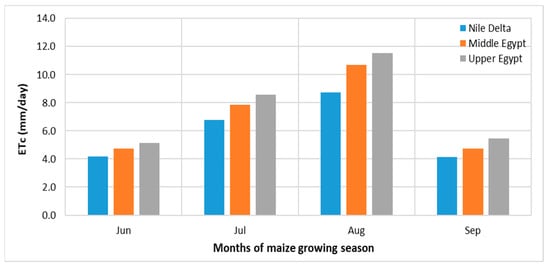
Figure 5.
Maize crop evapotranspiration for three agro-ecological zones as the mean of five-year period from 2015 to 2019.
3.2. Green Water Footprint
Figure 6 shows the total monthly rainfall for the three climate regions. The total monthly rainfall for different regions was low and the rain was not effective rainfall and cannot be used to calculate green water. Wheat in Egypt is a winter crop that depends mainly on irrigation water where rainfall amount is very small during the growing season while maize is fully irrigated where there is not any rain in summer in Egypt. Therefore, in the current study, the green water footprint value was estimated to equal zero because the amount of monthly rainfall was negligible. Additionally, this small amount of rain is often unreliable, as it is very infrequent within the year and between years. Therefore, the green water footprint was excluded from the total water footprint. Brouwer and Heibloem (1986) [28] supported the same trend when rainfall is ineffective.
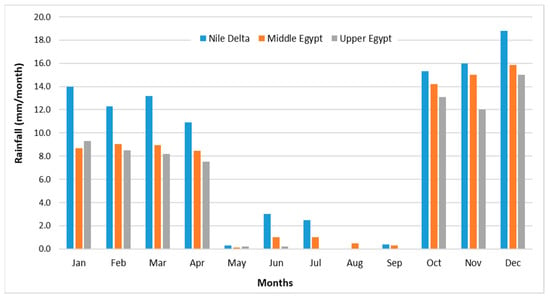
Figure 6.
Mean monthly rainfall (mm) in three regions over five years from 2015 to 2019.
3.3. Blue Water Footprint (BWF)
Blue water footprint (BWF), crop water use (CWU), and wheat yield values are presented in Table 3. Results revealed that the BWF for wheat was lower at Nile Delta region in old land which was 653 m3/ton, and the highest wheat BWF was 969 m3/ton obtained at Upper Egypt region in new land. The overall mean of wheat blue water footprint value was 740 and 822 m3/ton for old and new land, respectively. The BWF for old land was lower than new land due to the yield differences, i.e., 6.73 ton/ha in old land and 6.07 ton/ha in new land. Data in Table 4, for the CWU yield and blue water footprint for maize, show that the lowest value of BWF for maize was obtained in Nile Delta region in old land (729 m3/ton) and the highest value was recorded in Upper Egypt region in new land (1540 m3/ton). The blue water footprint for maize in the three agro-climate zones is much higher for maize than for wheat due to a higher crop water requirement for maize in the summer than wheat in the winter. Therefore, blue water footprint is most sensitive to ETo and Kc, followed by the crop planting date and crop productivity. This trend was also validated by Zhuo et al. (2014) [29]. The blue water footprint correlated strongly with the consumptive use, supported by Mekonnen and Hoekstra (2014) [30], who found that the BWF for irrigated wheat was 926 m3/ton, whereas for maize, the blue and green water footprints were 947, 81 total 1028 m3/ton, respectively.

Table 3.
Crop water use (CWU m3/ha), wheat yield (ton/ha) and blue water footprint for different climate regions in old and new lands.

Table 4.
Crop water use (CWU m3/ha), maize yield (ton/ha), and blue water footprint for different climate regions in old and new lands.
As the blue water footprint is a function of the consumptive water use and the produced yield, Mekonnen and Hoekstra (2020) [22] found that about 57% of the global blue WF of crop production is unsustainable because it goes beyond the available renewable water resources. This violates the environmental flow criterion and needs to be fully reduced in order to alleviate the blue water scarcity across the globe. This highlights the critical importance of improving irrigation efficiency through technical innovations that save water, e.g., improved farmer irrigation practices such as mechanized raised bed innovation package which leads to 25% water saving, increase yield up to 30%, and reduce farming cost by 25% (Atef Swelam et al. (2019)) [31]. Additionally, planting higher yielding and drought tolerant varieties and land leveling, which can save irrigation applied water up to 30% (El-Ramady et al., 2013) [32] and can minimize unrecoverable water losses.
3.4. Grey Water Footprint (GWF)
The GWF of wheat crop in three agro-climate zones presented in Table 5 and Table 6 show that the mean of GWF was 267 and 474 m3/ton for old and new land, respectively. The highest value was in Upper Egypt in new land 483 m3/ton and the lowest value in Upper Egypt in old land was 265 m3/ton. This relationship is clearly related to the climate parameter differences between the new land where it is hotter and dryer than the old land, which leads to a higher crop water requirement. In addition, the lower soil fertility leads to lower crop yield. The mean GWF for maize was 414 and 540 m3/ton for old and new land, respectively. The highest value is in Upper Egypt in the new land 691 m3/ton and the lowest value is in the Nile Delta region in the old land 270 m3/ton.

Table 5.
Wheat yield and grey water footprint for three climate regions in old and new land.

Table 6.
Maize yield and grey water footprint for three climate regions in old and new land.
High variation in crop yields was observed along the agro-climatic zones and land types due to the physiological capacity of the crop to adapt to climate variability and soil fertility. The GWF of wheat crop was lower than maize due to the lower application of nitrogen during its growing season. This result agrees with Luciana et al. (2021) [33], who reported that the dose of nitrogen applied is the main factor affecting the grey water footprint and that increasing nitrogen fertilizer dosage can increased grey water footprint values. The results also agree with Di Zhang et al., 2022 [34] who reported that the grey water footprint of maize increases linearly when the nitrogen rate applied to maize exceeds 60 kg/ha.
3.5. Total Water Footprint (TWF)
As demonstrated in Table 7 and Table 8, the overall mean water footprints for wheat were 1007 and 1297 m3/ton for old land and new land, respectively. The blue water footprint represents about 73.5% and 63.4% and grey water footprint represents about 26.5% and 36.6% from the water footprint for old and new lands, while the maize crop water footprint was 1372 and 1754 m3/ton in old and new land, respectively. The contribution in TWF from BWF and GWF were 71.6% and 28.4% in old land and 66.9% and 33.1% in new land, respectively.

Table 7.
Mean blue and grey water footprints and total water footprint for wheat for three climate regions and two soil types, i.e., old and new land.

Table 8.
Mean blue and grey water footprints and total water footprint for maize for three climate regions and two soil types, i.e., old and new land.
The results demonstrate that the total wheat water footprint in hotter Upper Egypt (1051 and 1231 m3/ton) are much higher than of the values in Middle Egypt (1120 and 1515 m3/ton) and Lower Egypt (1285 and 1944 m3/ton) for wheat and maize, respectively. This is attributed to water consumption, which is higher in Upper Egypt than the other two climate zones. The same trend was observed by Amal Mohamed (2021) [3], who conducted a water footprint assessment in other regions within Egypt. He found that the water footprint of wheat in new lands has a larger water footprint (about 3189 m3/ton). Upper Egypt has high water footprints (about 2076 m3/ton), Middle Egypt has midlevel water footprints (about 1708 m3/ton), and Lower Egypt has a low water footprint (1511 m3/ton). They also report that the water footprint of maize in new reclaimed areas has a large water footprint (about 3464 m3/ton), Upper Egypt has a high water footprint (about 2486 m3/ton), Middle Egypt has a midlevel water footprint (about 1822 m3/ton), and Lower Egypt has a low water footprint (about 1601.6 m3/ton)
As demonstrated in Figure 7 and Figure 8, the total water footprints decrease with increase of the climate parameters, especially solar radiation and temperature, which leads to higher water consumption and increases the blue water footprint. Thus, the total water footprint in Upper Egypt is higher than Middle Egypt and Nile Delta. The TWFP depends on the adoption of good agricultural practices that increase yield and reduce water use. This explains the combined response for higher WFP in Upper Egypt compared to Nile Delta region, as the adoption of the good agricultural practices is low in Upper Egypt. Several studies on a range of crops in various climate zones in Egypt have shown that using the good agricultural and irrigation practices increases crop productivity and lessens losses of non-recoverable water, which reduces the water footprint. Reducing the WF is likely due to better crop varieties and better agronomic and irrigation practices, including fertilizer management and laser leveling. For example, recent studies show that using raised beds rather than basin irrigation increases the yield of wheat by 25% and it reduced applied water by 30%, mainly due to reduction in soil evaporation (Karrou, et al., 2011) [35]. Alwang, j. et al., 2018 [36] stated that “raised bed system is most profitable due to saving labor, time, water, and energy costs”. Using raised bed system increased the farm yield by 30% while it reduced the production cost by 25%. According to Swelam et al., 2015 [37] and Swelam 2016 [38], raised bed is used in Egypt as an improved surface irrigation system for improved crop productivity.
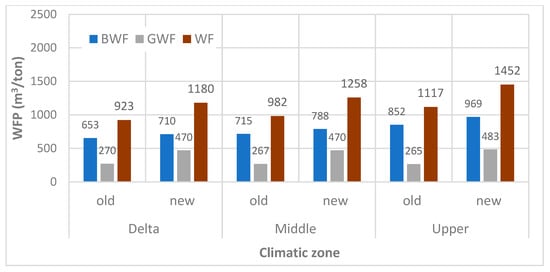
Figure 7.
Blue, grey, and total water footprints for wheat for three agro-ecological zones and two soil types, i.e., old and new land.
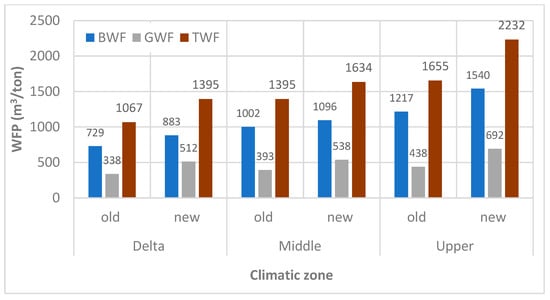
Figure 8.
Blue, grey, and total water footprints for maize for three agro-ecological zones and two soil types, i.e., old and new land.
Figure 9 shows the blue, grey, and total water footprint for wheat and maize in Egypt. The BWF and GWF for wheat were 781.0 and 370.5 m3/ton and for maize were 1078.0 and 485.5 m3/ton, respectively. The total water footprint for wheat was 1152 m3/ton and for maize it was 1563 m3/ton. This difference is due to land productivity, which was affected by soil fertility where new land has sandy poor fertility soils and by the difference in crop water requirements for both crops. The results disagreed with what was reported by Mekonnen and Hoekstra (2014) [30], who found that the mean water footprint for cereal crops is about 1644 m3/ton, but the footprint for wheat is slightly higher (1827 m3/ton), whereas it was lower (1222 m3/ton) for maize.
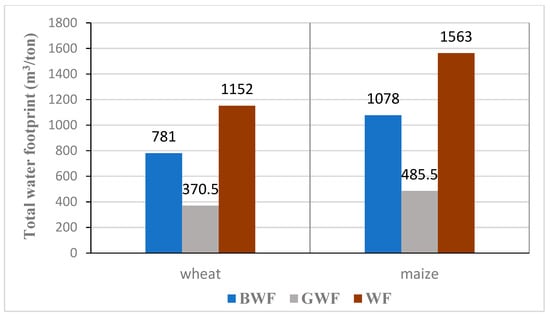
Figure 9.
Mean blue, grey, and total water footprints for wheat and maize in Egypt.
4. Conclusions
Egypt’s sustainable agricultural development strategy SADS-2030 emphasizes on-farm irrigation management to improve agricultural productivity. The current study is a step forward to support the SADS to identify crops with high and low water footprints under different agro-climate zones in Egypt. Wheat and maize were studied because they are the main grain crops grown in the studied agro-climate zones.
The results show that the microclimate variability and soil quality both have direct effects on a water footprint in different agro-ecological zones within Egypt. The grand Total Water Footprint (TWF) for maize in fertile old land was 1067, 1395, and 1655 m3/ton, whereas the grand TWF values in low fertility new land soils were 1395, 1934, and 2232 m3/ton for Nile Delta, Middle Egypt, and Upper Egypt regions, respectively. The mean TWF values for wheat cultivated in old land are 923, 982, and 1117 m3/ton, but they are 1180, 1258, and 1452 m3/ton in the new land. That means that the old land TWP is lower than the new land by about 23% for the Nile Delta, Middle Egypt, and Upper Egypt regions, respectively. The total mean water footprint for wheat is 1152 m3/ton and for maize it is 1563 m3/ton.
These results are an indication of the high relationship between the crop water footprint as a function of water consumptive use, yield, climatic condition, and soil type, which all affect both ETo and ETc. Higher ETc and ETo in Upper Egypt region compared to the Nile Delta region is clearly due to the climate characteristics. Weather in Upper Egypt is characterized by higher temperature and solar radiation than in the Nile Delta region. Based on the results, it is recommended to adopt the water footprint as an indicator for crop production and as a helpful decision-making tool for crop selection and cropping pattern choices specific to agro-climatic zone and soil type in irrigated ecosystems. The agronomic management practices, including irrigation water management for increasing water use efficiency for a range of soil types, could change water regimes and microclimates. Crop selection based on soil characteristics and their water retention characteristics could potentially contribute to moderation of microclimate and alter ETo and ETc, and thus the water footprint. The microclimatic characteristics and crop selection based on water availability could possibly moderate the impacts of climate variability and reduce crop yield variability.
As Egypt is a water-scarce country, the use of blue water for producing a crop in an expansion region should be restricted to locations with a lower water footprint. The methodology and results from this study provide a pathway to help policy makers to mitigate the impact of climate change on crop yield and to enhance water resources management in major crop production regions.
This paper presents a methodology as a guide for other crops and other regions of Egypt for decision makers and the extension system to identify the best cropping pattern and crop choices for better use of water resources and higher income. The choice of crops, however, also depends on markets and social and economic considerations, which are important and need consideration when using the guidelines in this paper. The output of this paper could be helpful in linking the crop production to the global market and economic considerations for global trade of water-consuming crops that can be alternatively provided by green water rich countries.
Author Contributions
Conceptualization, S.R., A.F., A.S. and A.G.; methodology, A.F. and A.S.; software, A.F.; validation, A.S., A.F., S.R. and A.G.; formal analysis, A.S. and A.F.; investigation, A.F.; resources, A.F. and A.S.; data curation, A.F.; writing—original draft preparation, Ahmad Farag and A.S.; writing—review and editing, A.S., A.F., S.R. and A.G.; visualization, S.R. and A.G.; supervision, S.R. All authors have read and agreed to the published version of the manuscript.
Funding
This research received no external funding.
Acknowledgments
The authors would like to than the Central Laboratory for Agricultural Climate (AEC-CLAC) of Egypt for providing the agro-climatic data. The authors are particularly grateful to Richard Snyder, Biometeorology Specialist Emeritus, Department of Land, Air and Water Resources, University of California, Davis, California, USA for his review and his valuable inputs to this paper.
Conflicts of Interest
The authors declare no conflict of interest.
References
- FAO. Coping with Water Scarcity: An Action Framework for Agriculture and Food Security; Food and Agriculture Organization of the United Nations (FAO): Rome, Italy, 2012. [Google Scholar]
- El-Fetyany, M.; Farag, H.; Abd El Ghany, S.H. Assessment of national water footprint versus water availability–Case study for Egypt. Alex. Eng. J. 2021, 60, 3577–3585. [Google Scholar] [CrossRef]
- Mohamed, A.; Abuaraba, M.E.; Mehawed, H.S.; Kasem, M.A. Water Footprint as a Tool of Water Resources Management—Review. Egypt. J. Chem. 2021, 64, 7331–7338. [Google Scholar] [CrossRef]
- Han, Y.; Jia, D.; Zhuo, L.; Sauvage, S.; Sánchez-Pérez, J.; Huang, H.; Wang, C. Assessing the Water Footprint of Wheat and Maize in Haihe River Basin, Northern China (1956–2015). Water 2018, 10, 867. [Google Scholar] [CrossRef] [Green Version]
- Hoekstra, A.Y.; Chapagain, A.K.; Aldaya, M.M.; Mekonnen, M.M. The Water Footprint Assessment Manual-Setting the Global Standard; Earthscan: London, UK; Washington, DC, USA, 2011. [Google Scholar]
- Hoekstra, A.Y. The Water Footprint of Modern Consumer Society; Routledge: London, UK, 2013. [Google Scholar]
- Hoekstra, A.Y.; Chapagain, A.K. Water Footprints of Nations: Water Use by People as a Function of Their Consumption Pattern. In Integrated Assessment of Water Resources and Global Change; Springer: Dordrecht, The Netherlands, 2006; pp. 35–48. [Google Scholar]
- El-Marsafawy, S.; Swelam, A.; Ghanem, A. Evolution of crop water productivity in the Nile Delta over three decades (1985–2015). Water 2018, 10, 1168. [Google Scholar] [CrossRef] [Green Version]
- Hoekstra, A.Y.; Chapagain, A. Globalization of Water: Sharing the Planets Freshwater Resources; Blackwell Publishing: Oxford, UK, 2008. [Google Scholar]
- Raun, W.R.; Solie, J.B.; Johnson, G.V.; Stone, M.L.; Mullen, R.W.; Freeman, K.W.; Thomason, W.E.; Lukina, E.V. Improving nitrogen use efficiency in cereal grain production with optical sensing and variable rate application. Agron. J. 2002, 94, 815–820. [Google Scholar] [CrossRef] [Green Version]
- Flach, R.; Skalský, R.; Folberth, C.; Balkovič, J.; Jantke, K.; Schneider, U.A. Water productivity and footprint of major Brazilian rainfed crops-A spatially explicit analysis of crop management scenarios. Agric. Water Manag. 2020, 233, 105996. [Google Scholar] [CrossRef]
- Chukalla, A.D.; Krol, M.S.; Hoekstra, A.Y. Green and blue water footprint reduction in irrigated agriculture: Effect of irrigation techniques, irrigation strategies and mulching. Hydrol. Earth Syst. Sci. 2015, 19, 4877–4891. [Google Scholar] [CrossRef] [Green Version]
- El-gafy, I.K. System dynamic model for crop production, water footprint, and virtual water nexus. Water Resour. Manag. 2014, 28, 4467–4490. [Google Scholar] [CrossRef]
- Ercin, A.E.; Aldaya, M.M.; Hoekstra, A.Y. Corporate water footprint accounting and impact assessment: The case of the water footprint of a sugar-containing carbonated beverage. Water Resour. Manag. 2011, 25, 721–741. [Google Scholar] [CrossRef]
- Mekonnen, M.M.; Gerbens-Leenes, W. The Water Footprint of Global Food Production. Water 2020, 12, 2696. [Google Scholar] [CrossRef]
- SADS. Sustainable Agricultural Development Strategy towards 2030; Ministry of Agriculture and Land Reclamation: Giza, Egypt, 2019.
- Abdelaal, H.S.A.; Thilmany, D. Grains Production Prospects and Long Run Food Security in Egypt. Sustainability 2019, 11, 4457. [Google Scholar] [CrossRef] [Green Version]
- MALR. Annual Report of Economic Statistics of Agricultural Sector; Ministry of Agriculture and Land Reclamation: Giza, Egypt, 2020.
- Allen, R.G.; Pereira, L.S.; Raes, D.; Smith, M. Crop Evapotranspiration—Guidelines for Computing Crop Water Requirements—FAO Irrigation and Drainage Paper 56; FAO: Rome, Italy, 1998; p. 300. [Google Scholar]
- Chapagain, A.K.; Orr, S. An improved water footprint methodology linking global consumption to local water resources: A case of Spanish tomatoes. J. Environ. Manag. 2009, 90, 1219–1228. [Google Scholar] [CrossRef] [PubMed]
- Mekonnen, M.M.; Hoekstra, A.Y. The green, blue and grey water footprint of crops and derived crop products. Hydrol. Earth Syst. Sci. 2011, 15, 1577–1600. [Google Scholar] [CrossRef] [Green Version]
- Mekonnen, M.M.; Hoekstra, A.Y. Sustainability of the Blue Water Footprint of Crops. Adv. Water Resour. 2020, 143, 103679. [Google Scholar] [CrossRef]
- El-Marsafawy, S.M.; Ali, M.A.; Salib, A.Y.; Eid, H.M. Effect of different sowing dates on some wheat varieties yield and their water relations. In Proceedings of the Third Conference of Meteorology & Sustainable Development, Cairo, Egypt, 15–17 February 1998. [Google Scholar]
- Mohamed, K.A.; El- Lithy, R.E.; El-Marsafawy, S.M. Effect of withholding irrigation at different growth stages on productivity of some soybean varieties. Ann. Agric. Sci. Moshtohor 2004, 42, 1441–1456. [Google Scholar]
- El-Samanody, M.K.M.; Awad, M.A.; El-Marsafawy, S.M. Scheduling irrigation of canola under nitrogen sources in Middle Egypt. Misr J. Agric. Eng. 2004, 21, 165–188. [Google Scholar]
- El-Marsafawy, S.M.; Salib, A.Y.; Ali, M.A.; Eid, H.M. Row width and nitrogen levels impacts on water relations, growth and yield of maize crop. In Proceedings of the Third Conference of Meteorology & Sustainable Development, Cairo, Egypt, 15–17 February 1998. [Google Scholar]
- Rayan, A.A.; Mohamed, K.A.; Khalil, F.A.; El- Marsafawy, S.M. Scheduling irrigation of cotton crop under different nitrogen fertilizer levels in Upper Egypt. In Proceedings of the 5th Conference Meteorology & Sustainable Development, Cairo, Egypt, 22–24 February 2000. [Google Scholar]
- Brouwer, C.; Heibloem, M. Irrigation Water Management. Part I—Principles of Irrigation Water Heeds, Chapter 3. The International Support Programme for Irrigation Water Management Land and Water Development Division FAO. 1986. Available online: http://www.fao.org/3/s2022e/s2022e00.htm#Contents (accessed on 12 July 2022).
- Zhuo, L.; Mekonnen, M.M.; Hoekstra, A.Y. Sensitivity and Uncertainty in Crop Water Footprint Accounting: A Case Study for the Yellow River Basin. Hydrol. Earth Syst. Sci. 2014, 18, 2219–2234. [Google Scholar] [CrossRef] [Green Version]
- Mekonnen, M.M.; Hoekstra, A.Y. Water footprint benchmarks for crop production: A first global assessment. Ecol. Indic. 2014, 46, 214–223. [Google Scholar] [CrossRef] [Green Version]
- Swelam, A.; El-Marsafawy, S.M. Impact of Climate Change and Agricultural Practices on Irrigation Water Requirements under Nile Delta Conditions. Misr J. Agric. Eng. 2019, 36, 87–104. [Google Scholar] [CrossRef]
- El-Ramady, H.R.; Amer, M.M.; Aiad, M.A. Sustainable Water and Nutrient Management: Use of Land Leveling, Cut off Irrigation and N- Fertilizer in Wheat Production. J. Appl. Sci. Res. 2013, 9, 2232–2243. [Google Scholar]
- Tozzini, L.; Pannunzio, A.; Soria, P.T. Water Footprint of Soybean, Maize and Wheat in Pergamino, Argentina. Agric. Sci. 2021, 12, 305–323. [Google Scholar] [CrossRef]
- Zhang, D.; Li, D.; Li, H.; Wang, H.; Liu, J.; Ju, H.; Batchelor, W.D.; Li, R.; Li, Y. Strategies to Reduce Crop Water Footprint in Intensive Wheat-Maize Rotations in North China Plain. Agronomy 2022, 12, 357. [Google Scholar] [CrossRef]
- Karrou, M.; Oweis, T.; Benli, B.; Swelam, A. Improving Water and Land Productivities Improving Water and Land Productivities in Irrigated Systems in Irrigated Systems, Report no. 10; International Center for Agricultural Research in the Dry Areas (ICARDA): Beirut, Lebanon, 2011; p. vi + 195. ISBN 92-9127-259-0. Available online: https://apps.icarda.org/wsInternet/wsInternet.asmx/DownloadFileToLocal?filePath=Water_management_series/WANA_benchmark_series/Improving_water_in_irrigated.pdf&fileName=Improving_water_in_irrigated.pdf (accessed on 10 July 2022).
- Alwang, J.; Sabry, S.; Shideed, K.; Swelam, A.; Halila, H. Economic and food security benefits associated with raised-bed wheat production in Egypt. Food Secur. 2018, 10, 589–601. [Google Scholar] [CrossRef] [Green Version]
- Swelam, A.A.; Hassan, M.A.; Osman, E.A.M. Effect of raised bed width and nitrogen fertilizer level on productivity and nutritional status of bread wheat. Egypt. J. Appl. Sci. 2015, 30, 223–234. [Google Scholar]
- Swelam, A. Science Impact: Raised-Bed Planting in Egypt: An Affordable Technology to Rationalize Water Use and Enhance Water Productivity; ICARDA: Beirut, Lebanon, 2016; Issue: 6-FEB 2016I; Available online: http://www.icarda.org/sites/default/files/u158/Science%20Impact%20Raised-Bed_final.pdf (accessed on 13 July 2022).
Publisher’s Note: MDPI stays neutral with regard to jurisdictional claims in published maps and institutional affiliations. |
© 2022 by the authors. Licensee MDPI, Basel, Switzerland. This article is an open access article distributed under the terms and conditions of the Creative Commons Attribution (CC BY) license (https://creativecommons.org/licenses/by/4.0/).