Abstract
Open biomass burning (BB) has contributed severely to the ambient levels of particulate matter of less than 2.5 μm diameter (PM2.5) in upper northern Thailand over the last decade. Some methods have been reported to identify the sources of burning using chemical compositions, i.e., ions, metals, polycyclic aromatic hydrocarbons, etc. However, recent advances in nuclear techniques have been limited in use due to their specific instrumentation. The aims of this study were to investigate the sources of ambient PM2.5 in Chiang Mai city using stable carbon (δ13C) and nitrogen isotopes (δ15N). The mean concentrations of total carbon (TC) and total nitrogen (TN) in PM2.5 were 12.2 ± 5.42 and 1.91 ± 1.07 μg/m3, respectively, whereas δ13C and δ15N PM2.5 were −26.1 ± 0.77‰ and 10.3 ± 2.86‰, respectively. This isotopic analysis confirmed that biomass burning was the source of PM2.5 and that C3 and C4 plants contributed about 74% and 26%, respectively. These study results confirm that the stable isotope is an important tool in identifying the sources of aerosols.
1. Introduction
Biomass burning (BB) aerosol plumes with combustion from forest fires or agriculture burns have caused severe air pollution [1,2,3,4,5,6]. BB is the second largest source of trace gases and the largest source of primary fine carbonaceous particles. BB can happen naturally or anthropogenically (e.g., forest fires, burning of crop residues). BB is a major source of several ambient particles and trace gases that influence the concentration of ozone at ground levels [7]. Previous studies of emissions from biomass burning have used several chemical compositions in aerosol as a tracer such as organic carbon, elemental carbon, stable carbon and nitrogen isotopes, ion species, etc. [7,8,9,10,11,12,13]. Chiang Mai city is one of most productive agricultural areas in northern Thailand. There have been few studies that have reported the chemical and isotopic compositions of biomass burning aerosols in this region, even though burning agricultural residues is a very common practice during the harvest in dry season from February to May [14,15,16,17,18,19] as shown by the Moderate Resolution Imaging Spectroradiometer (MODIS) fire count data. The stable carbon (δ13C) and nitrogen (δ15N) composition of bulk aerosols have been used as geochemical markers to identify aerosol sources in a variety of environments [8,9,10,20,21]. Likewise, the studies of δ13C and δ15N in bulk aerosols have provided more information on the multiple sources and atmospheric processing of organic aerosols, such as biomass and biofuel burning [12,22,23,24,25]. δ13C and δ15N in ambient particulate matter have been used to great effect in previous studies to distinguish the aerosols emitted from the burning of C3 and C4 plants and evaluate the total contribution of sources from biomass and biofuel combustion [10,11,12,13,26,27,28].
Biomass burning is responsible for more than 90% of organic carbon (OC) in the atmosphere [29]. Previous studies concluded that the dominant source of global black carbon (BC) was BB, and recent studies reported that BB was an important source of brown carbon [29]. Biomass burning particles could impact the climate as well as human health [30,31]. Previous laboratory studies [32] reported that the concentrations of organic aerosol from wood burning increased by a factor of 1.5 to 2.8 after several hours of exposure to UV light, indicating a large amount of secondary organic aerosol (SOA) generated from BB emission. Several tracers have been used in the BB research [13,27,28], such as anhydrosugars, resin acids [33,34], and water-soluble non-sea-salt potassium (nss-K+) [35,36,37].
Air pollution is a major environmental problem in Chiang Mai province. Open biomass burning in agricultural and forest areas causes significant smoke and haze from February to April, according to satellite hotspot data. During this period of time, the maximum concentrations of PM2.5 are 2–4 times higher than the standard and may pose a health risk to residents due to over-exposure to airborne particulates and their chemicals [38,39]. The Thailand-Myanmar northwest border, extending from Tak to Chiang Mai, and the Thailand-Laos border have a high density of hotspots. There is a high density of active fire hotspots near the Thailand-Myanmar border, especially in the southwest direction where Mae Hong Son province extends to Chiang Mai province [15,16,17,18]. Several previous methods, such as those involving ions, metals, and polycyclic aromatic hydrocarbons (PAHs), have been reported to identify the burning sources, although recent advances in nuclear techniques are still limited to report due to their specific instrumentation. The aims of this study were to investigate and identify the possible sources of ambient PM2.5 in Chiang Mai city using stable carbon and nitrogen isotopes.
2. Materials and Methods
2.1. Sampling Site
The study site was located at the Research Institute for Health Sciences (RIHES) on the main campus of Chiang Mai University (CMU; 18°47′ N, 98°57′ E), Chiang Mai city (Figure 1). The PM2.5 samples were collected from the rooftop of the four-story building, which was about 30 m above the ground. Daily samples were collected on quartz filters (Pall Life Sciences, Port Washington, NY, USA) using a medium air volume sampler (KC-6120, Qingdao Laoying Ltd., Qingdao, China) with a flow rate of 100 L/min. The PM2.5 samples were collected from January to May 2017. Before collecting the samples, the quartz filters were heated in the oven for 6 h at 450 °C to remove carbon contamination. The quartz filters were wrapped in aluminum foil and stored in desiccators filled with silica gel before and after the sampling. The condition of the filter before and after sampling was considered in a controlled room at a temperature of 25 °C ± 2 °C and a relative humidity of less than 40%. Before analysis, the filters were kept in the freezer (≤20 °C).
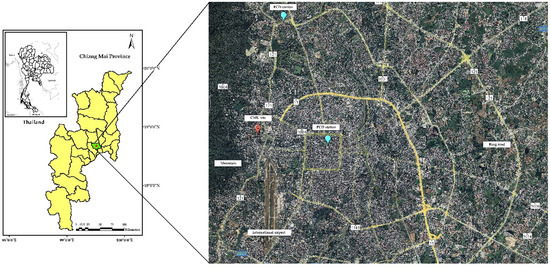
Figure 1.
The location of the sampling site in Chiang Mai city.
2.2. Measurement of Stable Isotopes
The stable carbon and nitrogen isotopes were measured by the elemental analyzer (EA, FLASH, 2000; Thermo Fisher Scientific, Waltham, MA, USA) coupled with an isotope ratio mass spectrometer (MAT253, Thermo Fisher Scientific, Waltham, MA, USA) at Yale-NUIST Center on Atmospheric Environment, NUIST, Nanjing, China. The detection limit of this method is 5 μg to 500 μg. The punched-out quartz filter (with a diameter of 17 mm) was folded and placed into a tin cup. After the tin cup was folded up, the quartz filter was tightly sealed in a relatively clean room. Then, the loaded tin cup was placed into a reaction tube combusted at 1000 °C by an autosampler, wherein conversion to CO2 and TN’s conversion to N2 occurred. Separated by a gas chromatographic column, N2 and CO2 were transferred for IRMS by Con-Flo. Ratios were reported in parts per thousand (‰) written in delta (δ) notation, related to the international standard Vienna Peedee belemnite (V-PDB) for atmospheric carbon and nitrogen, and defined as:
δ13C (‰) = [(13C/12C)sample/(13C/12C)standard − 1] × 1000
δ15N (‰) = [(15N/14N)sample/(15N/14N)standard − 1] × 1000
The program transformed the ion beam intensity (Mv) of sample gas into an isotope ratio by comparing it to reference gases with known isotope values (CO2: δ13C = −31.9‰; N2: δ15N = −1.17‰). This study’s analytical precision of measurement (reported as relative standard deviation) was 0.02‰ for δ13C and 0.14‰ for δ15N, which was acceptable [40]. Before each batch of testing, a leak test and three empty tests (baseline scan with no sample) were performed. Three on/off tests (continuous tests of reference gas in one scanning period) were performed to ensure the instrument’s stability. Three blank tests (tests with an empty tin cup) were used along with each batch of tests to correct for impurity interferences in the analysis. As external standards, three standards with known isotope ratios (acetanilide#1: δ13C = −29.5‰, δ15N = 1.18‰; acetanilide#2: δ13C = −29.5‰, δ15N = 19.6‰; sucrose: δ13C = −12.2‰) were employed.
2.3. Data Analysis
MODIS onboard NASA’s Aqua and Terra satellites calculated the number of hotspots during the intensive biomass burning season. All data collected from the experiment and analyzed using SPSS statistical program are expressed as mean and standard deviations (S.D.). Moreover, a correlation between PM2.5 concentrations and chemical compositions was also calculated using Pearson correlation analysis.
3. Results and Discussion
3.1. PM2.5 Mass Concentration
The daily PM2.5 samples were collected from 12 January to 30 May 2017 at the Research Institute for Health Sciences, Chiang Mai University, the Chiang Mai city site. PM2.5 concentrations were obtained from the gravimetric method and compared with the values of PM2.5 from the air quality monitoring station operated by the Pollution Control Department (PCD) in Chiang Mai city. The PM2.5 concentration trends were correlated to the active fire data (number of hotspots) detected by satellite remote sensing imaging from the Moderate Resolution Imaging Spectroradiometer (MODIS); the trends were collected and analyzed with statistical methods to confirm the significant reasons for the air pollution in Chiang Mai city in this study. From January to May 2017, there were 365 hotspots in Chiang Mai province, with a peak in March (250 hotspots) and a highest daily average PM2.5 concentration of 45.3 ± 6.17 µg/m3. In this study, the average PM2.5 concentrations ranged from 6.07 to 79.9 µg/m3, averaging 35.8 ± 16.3 µg/m3. The average values were lower than those collected at the Chiang Mai University campus in 2016 (64.3 ± 17.6 µg/m3), monitored during the same period [19], and lower than those at the CMU site in 2016, where the mean was 44.5 ± 32.1 µg/m3 [14]. We observed a peak in PM2.5 on 14 May 2017 (79.9 µg/m3) after the no-burning policy was implemented from 20 February to 20 April 2017. There was no observed number of hotspots during this period. Moreover, nine out of sixty-three days’ daily PM2.5 concentrations in 2017 exceeded the Pollution Control Department (PCD) standard (50 µg/m3). The monthly average PM2.5 concentrations from January to May were 19.9, 39.6, 44.5, 51.2, and 23.1 µg/m3, respectively. The monthly concentration of PM2.5 reached its maximum in May and then declined at the beginning of the rainy season.
3.2. Temporal Variation in Stable Carbon and Nitrogen Isotopes in PM2.5
The temporal variation in δ13C in PM2.5 at Chiang Mai city during the sampling period ranged from −27.4‰ to −24.3‰, with a mean value of −26.1‰, as reported in Table 1.

Table 1.
The concentrations of TC and TN (µgm−3), their isotope ratios (‰), and TC/TN in PM2.5 from Chiang Mai city.
The temporal variations in δ13C and δ15N, as well as the meteorological data, are shown in Figure 2. The meteorological data were obtained from the Chiang Mai meteorological station, located in Chiang Mai city, about 2 km away from the sampling site. Generally, the trend varied within a narrow range. The mean value of δ13C was comparable to the reported δ13C value (−25.8 ± 0.52‰) measured in Brazil, where C3 plant burning is predominant [12], and was similar to the values reported from Chiang Mai (Doi Ang Kang) during the biomass burning season in 2015 (mean value of δ13C: −26.0 ± 1.2‰) [10]. Kawichai et al. (2020) reported a mean δ13C value of −27.9 ± 0.67‰ (collected from February to August 2016), although the δ13C value of this study was −26.1 ± 0.77‰ (collected from January to May 2017). These two studies confirm that biomass burning is the major source of ambient PM2.5 in Chiang Mai city [14]. On the other hand, the δ13C values were greater than the values measured at Prague-Suchdol in winter 2016 (mean values of −27.2‰) [41]. Furthermore, Martinsson et al. (2017) observed a mean value of −26.3‰ for δ13C, attributable to biogenic emissions from terrestrial plants [42]. Previous investigations have indicated significant differences. The δ13C values in this study were lower than those recorded at residential, commercial, and industrial locations in Mexico (−25.1‰ [43]) and slightly lower than the mean value of the δ13C of TC in Taiyuan, China (−24.3 ± 1.0‰). The different emission sources could explain these findings. In this study, the isotope abundance (−24.2‰), which is a signature of biomass burning, and emissions from C3 plant combustion were compared and the values of δ13C varied from −34.0‰ to −23.0‰, with the highest δ13C values in PM2.5. Biomass burning has been observed to range from −22.0‰ to −8.0‰ [12,28,44,45].
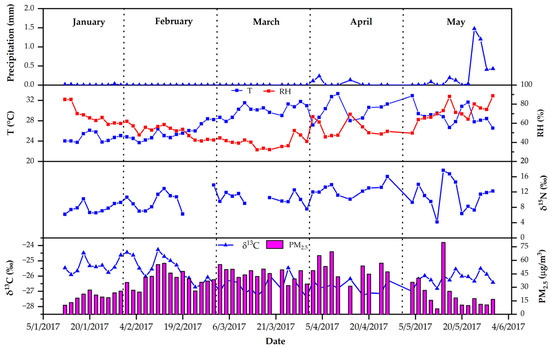
Figure 2.
Temporal variation in stable isotopic and meteorological parameters during the sampling period in Chiang Mai city.
It was found that the δ13C value was highest in January (−25.3 ± 0.45‰), followed by February (−25.5 ± 0.81‰), May (−26.2 ± 0.39‰), March, and April, as shown in Figure 3. The values of δ13C were more stable and showed very small differences in this study. The highest δ13C values were found in January and February, significantly higher than in the other months. This indicates C3 plant combustion to be the main contributor to fine aerosol [12]. In a previous study, high values of δ13C (−26.0‰ to −23.2‰, with an average of −25.2‰) were observed in wheat residue burning aerosols collected from Mt. Tai, China [22]. During the sampling period, it was confirmed that biomass burning from agriculture, such as wheat and corn residue on high land, is a dominant source in the region. According to observation, the highest value (−24.3‰) of δ13C was recorded on 11 February 2017. The mean value was −25.2‰ from 12 January 2017 (the start of sampling) to 20 April 2017 (the end of the no-burning policy). After the local government ceased burning (after 20 February 2017), the lowest value of δ13C was recorded on 31 March 2017, at −27.2‰. The average value of δ13C was lower than the previous period, which was −26.5‰. The change in δ13C in this study can be explained by emissions and a changing aerosol source, observed from meteorological reports.
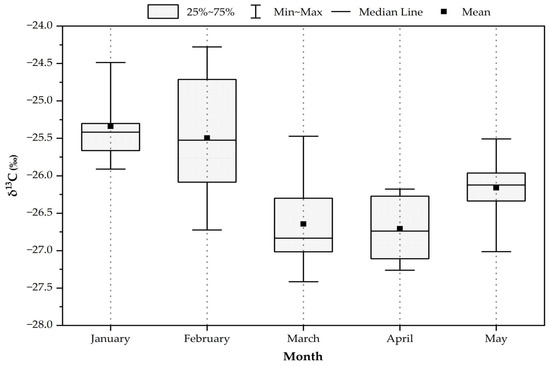
Figure 3.
The box plots of stable carbon isotopes during the sample period in Chiang Mai city.
In this study, the δ15N value ranged from 4.15‰ to 17.7‰ (mean: 10.3 ± 2.86‰), which was similar to that of aerosols collected from the Santarem region [15] (10.4 ± 1.86‰), an area with a high density of primary tropical rainforest. In January, February, March, April, and May, the mean ± S.D. δ15N values were 7.76 ± 1.32‰, 9.37 ± 2.24‰, 10.5 ± 1.71‰, 12.7 ± 1.61‰, and 11.0 ± 2.24‰, respectively. The highest δ15N values found in April are similar to those in Okinawa, Japan (12.2 ± 2.2‰) [46], which are slightly lower than those (15.1 ± 3.4‰) of Gosan aerosol [26]. This location is in the tropical rainforest, with a few pasture regions in the northeast of the Amazon basin, and biomass burning may have an impact. On the other hand, the δ15N values of TN from Cape Hedo, similar to the aerosol samples from Piracicaba, Brazil, were 10.6‰ [12], and the δ15N value in these studies was slightly higher than the δ15N value (4.6 ± 0.8‰) in TN reported by Widory (2007), implying that the aerosol was derived from diesel engine combustion, with diesel oil varying from 3.9‰ to 5.4‰ [25].
The linear regression between δ13C and temperature had a moderate correlation, with a correlation coefficient of −0.6747 (p = 0.000), whereas a low correlation was found between δ15N and temperature, with a correlation coefficient of 0.3284 (p = 0.0145) (shown in Figure 4). The results for δ13C were more scattered than those for δ15N, indicating that the isotopic composition of δ13C tended to be temperature-dependent [41,47]. The lowest temperatures in Chiang Mai city were 24.7 ± 0.86 and 25.4 ± 1.27 °C in January and February, respectively, whereas the highest δ13C values occurred during this period. This discovery indicated that the combustion of C4 plants was responsible for the highest δ13C values [12]. In contrast, over the same period, the δ15N values were lower than those from March to May, when the temperature was higher (26.5 to 33.2 °C), suggesting that the high temperature may have driven the δ15N increases.
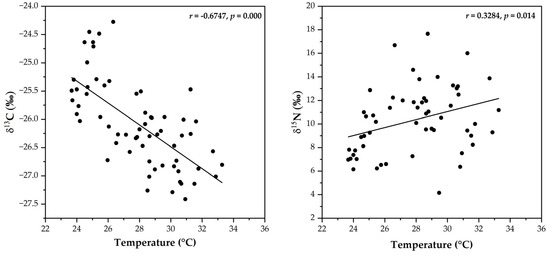
Figure 4.
Relationship between stable isotopes and temperature in Chiang Mai city.
Furthermore, the mean TC concentration in Chiang Mai was 12.6 ± 3.54 µg/m3 with a range from 5.42 µg/m3 to 22.9 µg/m3, which is equivalent to that reported for biomass burning by Boreddy et al. in DAK, Thailand, where biomass burning emissions varied from 1.5 µg/m3 to 80.3 µg/m3 [10]. In addition, on March 13, an extremely high concentration of TC was recorded, with a value of 25.1 µg/m3. There were 54 hotspots monitored on this day, implying that BB could be the potential source of TC throughout the sampling period. The correlation between PM2.5 concentrations and TC was 0.8153 (p < 0.001). There was no correlation found between δ13C and TC concentrations in these studies. Moreover, the concentrations of TN varied from 0.64 to 6.32 µg/m3 (mean: 1.91 ± 1.07 µg/m3). These results show that the higher contributions in this study are lower than those of Varanasi and Kolkata, India (range: 14.9 ± 10.8 µg/m3). The correlation between PM2.5 concentrations and TN was moderate (r = 0.6984, p < 0.001). The results suggest that the sources of PM2.5 were emissions from biomass burning. This result was supported by the moderate correlation between TC and TN (r = 0.6109, p < 0.001), as shown in Figure 5. The ratio of TC/TN in PM2.5 ranged from 1.88 to 19.9, with a mean of 6.75. The higher TC/TN ratios in East Africa implied a higher organic aerosol contribution from biomass/biofuel combustion [20].
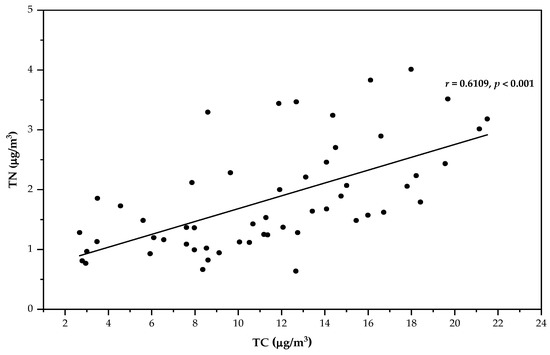
Figure 5.
Correlation plot between TC and TN during the sample period from January to May in Chiang Mai city.
3.3. Contribution to PM2.5 from Burning C3 and C4 Plants
Many atmospheric studies use the value of δ13C to distinguish between C3 and C4 plants. According to Martinelli et al. [12], a δ13C value ranging from −26.9‰ to −24.9‰ suggests the domination of C3 plants. In South Africa, Mkoma et al. (2013) found that the δ13C value of biomass burning was dominated by C4 plants and ranged from −24.4‰ to −22.4‰ [13]. The C3 plants are isotopically (δ13C) different from C4 plants, as reported by Bender, 1971 [48] and Smith and Epstient, 1971 [49]. The δ13C values of C3 plants are generally lower than those of C4 plants due to different photosynthetic pathways [12]. The region’s TC concentrations were linked to open burning emissions using MODIS fire spots in Chiang Mai city, supporting the emission sources identified in the current study. We estimated relative contributions from the burning of C3 and C4 plants to TC using the isotopic mass balance equation as follows:
C4 plants = [1 − C3 plants]
The TC of aerosol was determined using the above equations, where δ13C aerosol has a stable carbon isotope composition in total carbon (δ13CTC) in the equation above and where δ13Caerosol is a stable carbon isotope composition of aerosol particles. The δ13CC3plant and δ13CC4plant are isotope ratios of C3 and C4 plants, respectively, whose end-members are defined to be 30.5‰ and 13.5‰ based on the average δ13C values determined for leaves of C3 and C4 vegetation. A fraction of TC from C3 and C4 plants is referred to as δ13CC3plant and δ13CC4plant, respectively. Based on the mean values of δ13C found in the leaves of C3 and C4 vegetation in the Amazon basin [12], the values of δ13CC3plant and δ13CC4plant were assumed be −31.5‰ and −13.5‰, respectively. The mean contribution of C3 and C4 plants in this study was 74% (ranging from 63.4% to 81.9%) and 26% (ranging from 18.1% to 36.6%), respectively. Boreddy et al. (2018) reported the contribution of C3 (74%) and C4 (26%) plants to TC in DAK, Fang district, Chiang Mai province, which is about 170 km north of our study site in Chiang Mai city [10].
Further reports have indicated that δ13C values from the open burning of C3 plants are lower than those of C4 plants [15,20,29]. The highest δ13C values (from January to February) were associated with C4 plants, suggesting that the primary combustion source might be related to maize residue burning at our sampling site. The burning of C3 plants accounted for most of the reduction in δ13C in aerosol; however, a similar decline in δ13C was reported. Indonesia’s forest fire contributed the most C3 to the aerosol sample [50]. The association between δ13C and δ15N values was consistent with that reported in prior investigations, as illustrated in Figure 6. The carbon and nitrogen isotopes in the current study indicated no significant correlation, implying that there are various aerosol C and N sources in Chiang Mai city. The δ13C values in TC ranged from −27.4‰ to −24.3‰ in this study, whereas the δ15N values in TN ranged from 4.15‰ to 17.7‰. The overlapping data over the sampling period, as shown in Figure 6, indicate that emissions were the primary source of TC. In addition, our region (northern Thailand) was dominated by the combustion of C3 plants. However, this burning could provide a major source of nitrogen species during our sampling period. On the other hand, an important source, fossil fuel combustion, lowers the δ15N levels in the ambient atmosphere [51]. The mean δ15N values are lower in particulates from fossil fuel combustion, such as coal (~5.3‰), diesel oil (3.9‰ to 5.4‰), and unleaded gasoline (4.6‰) [25,52]. C3 plant burning, however, reported average δ15N values of 13.2 ± 4.2‰ [12,53].
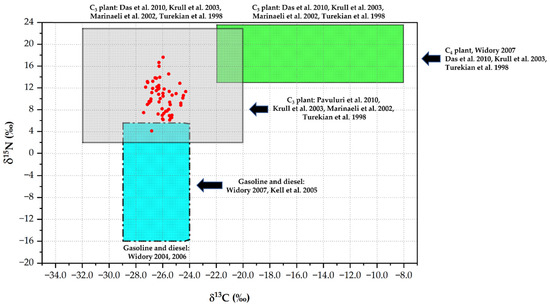
Figure 6.
Relationship between δ13C and δ15N with sign level of potential sources in PM2.5 [12,24,25,28,44,45,51].
4. Conclusions
This study collected PM2.5 samples from Chiang Mai city from January to May 2017 to investigate the PM2.5 sources using stable carbon (δ13C) and nitrogen isotopes (δ15N). The mean value of δ13C ranged from −27.4‰ to −24.3‰, with a mean of −26.1‰, whereas the δ15N values ranged from 2.67‰ to 5.71‰, with a mean of 10.3‰, indicating that biomass burning was the primary source of PM2.5, whereas fuel combustion was a minor source. Finally, the δ13C data, reporting emissions from C3 plant burning, confirmed that forest fires and agricultural waste were the primary sources of PM2.5. C4 plants, such as maize residue, were found to have been burned.
Author Contributions
Conceptualization and design of this study: T.P. and Y.Z.; funding acquisition T.P. and Y.Z.; analysis and interpretation of data: S.K., F.C. and W.S.; original draft preparation, S.K., T.P. and Y.Z.; review and editing, S.K., T.P., Y.Z., F.C. and W.S. All authors have read and agreed to the published version of the manuscript.
Funding
The present study was part of a cooperative research project between the Research Institute for Health Sciences, Chiang Mai University, Chiang Mai, Thailand (TP) and the Yale-NUIST Center on Atmospheric Environment, Nanjing University of Information Science and Technology (NUIST), Nanjing, China (YLZ) with funding from Thailand Science Research and Innovation (TSRI, formerly the Thailand Research Fund, TRF) (RDG6030019) and the National Natural Science Foundation of China (NSFC), grant number 41761144056.
Institutional Review Board Statement
Not applicable.
Informed Consent Statement
Not applicable.
Data Availability Statement
The data that support the findings of this study are available from the corresponding authors, [T.P., Y.Z.], upon reasonable request.
Acknowledgments
This study was financially supported by the Research Institute for Health Sciences, Chiang Mai University, Chiang Mai, Thailand. It was conducted in collaboration with Yale-NUIST Center on Atmospheric Environment, Nanjing University of Information Science and Technology, Nanjing, China. The authors acknowledge the technical support provided by our group members.
Conflicts of Interest
The authors declare no conflict of interest.
References
- Andreae, M.O. Emission of trace gases and aerosols from biomass burning—An updated assessment. Atmos. Chem. Phys. Discuss. 2019, 19, 1–27. [Google Scholar] [CrossRef] [Green Version]
- Bond, T.C.; Doherty, S.J.; Fahey, D.W.; Forster, P.M.; Berntsen, T.; DeAngelo, B.J.; Flanner, M.G.; Ghan, S.; Kärcher, B.; Koch, D. Bounding the role of black carbon in the climate system: A scientific assessment. J. Geophys. Res. Atmos. 2013, 118, 5380–5552. [Google Scholar] [CrossRef]
- Mueller, W.; Loh, M.; Vardoulakis, S.; Johnston, H.J.; Steinle, S.; Precha, N.; Kliengchuay, W.; Tantrakarnapa, K.; Cherrie, J.W. Ambient particulate matter and biomass burning: An ecological time series study of respiratory and cardiovascular hospital visits in northern Thailand. Environ. Health 2020, 19, 77. [Google Scholar] [CrossRef] [PubMed]
- Petetin, H.; Sauvage, B.; Parrington, M.; Clark, H.; Fontaine, A.; Athier, G.; Blot, R.; Boulanger, D.; Cousin, J.M.; Nédélec, P.; et al. The role of biomass burning as derived from the tropospheric CO vertical profiles measured by IAGOS aircraft in 2002–2017. Atmos. Chem. Phys. 2018, 18, 17277–17306. [Google Scholar] [CrossRef] [Green Version]
- Yadav, I.; Devi, N.; Li, J.; Syed, J.H.; Zhang, G.; Watanabe, H. Biomass Burning in Indo-China Peninsula and its impacts on regional air quality and global climate change—A review. Environ. Pollut. 2017, 227, 414–427. [Google Scholar] [CrossRef] [PubMed]
- Zhao, H.; Zhang, X.; Zhang, S.; Chen, W.; Tong, D.Q.; Xiu, A. Effects of agricultural biomass burning on regional haze in China: A Review. Atmosphere 2017, 8, 88. [Google Scholar] [CrossRef] [Green Version]
- Simoneit, B.R.T. Biomass burning—A review of organic tracers for smoke from incomplete combustion. Appl. Geochem. 2002, 17, 129–162. [Google Scholar] [CrossRef]
- Aggarwal, S.G.; Kawamura, K.; Umarji, G.S.; Tachibana, E.; Patil, R.S.; Gupta, P.K. Organic and inorganic markers and stable C-, N-isotopic compositions of tropical coastal aerosols from megacity Mumbai: Sources of organic aerosols and atmospheric processing. Atmos. Chem. Phys. 2013, 13, 4667–4680. [Google Scholar] [CrossRef] [Green Version]
- Bikkina, S.; Kawamura, K.; Sarin, M. Stable carbon and nitrogen isotopic composition of fine mode aerosols (PM2.5) over the Bay of Bengal: Impact of continental sources. Tellus B Chem. Phys. Meteorol. 2016, 68, 31518. [Google Scholar] [CrossRef] [Green Version]
- Boreddy, S.K.R.; Parvin, F.; Kawamura, K.; Zhu, C.; Lee, C.T. Stable carbon and nitrogen isotopic compositions of fine aerosols (PM2.5) during an intensive biomass burning over Southeast Asia: Influence of SOA and aging. Atmos. Environ. 2018, 191, 478–489. [Google Scholar] [CrossRef]
- Cao, F.; Zhang, S.C.; Kawamura, K.; Zhang, Y.L. Inorganic markers, carbonaceous components and stable carbon isotope from biomass burning aerosols in Northeast China. Sci. Total Environ. 2016, 572, 1244–1251. [Google Scholar] [CrossRef]
- Martinelli, L.A.; Camargo, P.B.; Lara, L.B.L.S.; Victoria, R.L.; Artaxo, P. Stable carbon and nitrogen isotopic composition of bulk aerosol particles in a C4 plant landscape of southeast Brazil. Atmos. Environ. 2002, 36, 2427–2432. [Google Scholar] [CrossRef]
- Mkoma, S.L.; Kawamura, K.; Tachibana, E.; Fu, P. Stable carbon and nitrogen isotopic compositions of tropical atmospheric aerosols: Sources and contribution from burning of C3 and C4 plants to organic aerosols. Tellus B Chem. Phys. Meteorol. 2014, 66, 20176. [Google Scholar] [CrossRef]
- Kawichai, S.; Prapamontol, T.; Cao, F.; Liu, X.Y.; Song, W.H.; Kiatwattanacharoen, S.; Zhang, Y.L. Significant contribution of C3—Type forest plants’ burning to airborne PM2.5 pollutions in Chiang Mai Province, Northern Thailand. Chiang Mai Univ. J. Nat. Sci. 2021, 20, 16. [Google Scholar] [CrossRef]
- Kawichai, S.; Prapamontol, T.; Chantara, S.; Kanyanee, T. Seasonal variation and sources estimation of PM2.5 bound PAHs from the ambient air of Chiang Mai City: An All-year-round Study in 2017. Chiang Mai J. Sci. 2020, 47, 958–972. [Google Scholar]
- Khamkaew, C.; Chantara, S.; Janta, R.; Pani, S.K.; Prapamontol, T.; Kawichai, S.; Wiriya, W.; Lin, N.H. Investigation of biomass burning chemical components over Northern Southeast Asia during 7-SEAS/BASELInE 2014 campaign. Aerosol Air Qual. Res. 2016, 16, 2655–2670. [Google Scholar] [CrossRef]
- Kiatwattanacharoen, S.; Prapamontol, T.; Singharat, S.; Chantara, S.; Thavornyutikarn, P. Exploring the sources of PM10 burning-season haze in Northern Thailand using nuclear analytical techniques. Chiang Mai Univ. J. Nat. Sci. 2017, 16, 307–325. [Google Scholar] [CrossRef]
- Punsompong, P.; Chantara, S. Identification of potential sources of PM10 pollution from biomass burning in northern Thailand using statistical analysis of trajectories. Atmos. Pollut. Res. 2019, 9, 1038–1051. [Google Scholar] [CrossRef] [Green Version]
- Thepnuan, D.; Chantara, S.; Lee, C.T.; Lin, N.H.; Tsai, Y.I. Molecular markers for biomass burning associated with the characterization of PM2.5 and component sources during dry season haze episodes in Upper South East Asia. Sci. Total Environ. 2019, 658, 708–722. [Google Scholar] [CrossRef]
- Hegde, P.; Kawamura, K.; Joshi, H.; Naja, M. Organic and inorganic components of aerosols over the central Himalayas: Winter and summer variations in stable carbon and nitrogen isotopic composition. Environ. Sci. Pollut. Res. 2016, 23, 6102–6118. [Google Scholar] [CrossRef]
- Sharma, S.K.; Mandal, T.K.; Shenoy, D.M.; Bardhan, P.; Srivastava, M.K.; Chatterjee, A.; Saxena, M.; Saraswati; Singh, B.P.; Ghosh, S.K. Variation of stable carbon and nitrogen isotopic composition of PM10 at urban sites of Indo Gangetic Plain (IGP) of India. Bull. Environ. Contam. Toxicol. 2015, 95, 661–669. [Google Scholar] [CrossRef] [PubMed]
- Fu, P.Q.; Kawamura, K.; Chen, J.; Li, J.; Sun, Y.L.; Liu, Y.; Tachibana, E.; Aggarwal, S.G.; Okuzawa, K.; Tanimoto, H.; et al. Diurnal variations of organic molecular tracers and stable carbon isotopic composition in atmospheric aerosols over Mt. Tai in the North China Plain: An influence of biomass burning. Atmos. Chem. Phys. 2012, 12, 8359–8375. [Google Scholar] [CrossRef] [Green Version]
- Jung, J.; Kawamura, K. Springtime carbon emission episodes at the Gosan background site revealed by total carbon, stable carbon isotopic composition, and thermal characteristics of carbonaceous particles. Atmos. Chem. Phys. 2011, 11, 10911–10928. [Google Scholar] [CrossRef] [Green Version]
- Widory, D. Combustibles, fuels and their combustion products: A view through carbon isotopes. Combust. Theory Model. 2006, 10, 831–841. [Google Scholar] [CrossRef]
- Widory, D. Nitrogen isotopes: Tracers of origin and processes affecting PM10 in the atmosphere of Paris. Atmos. Environ. 2007, 41, 2382–2390. [Google Scholar] [CrossRef]
- Kundu, S.; Kawamura, K.; Andreae, T.; Hoffer, A.; Andreae, M. Diurnal variation in the water-soluble inorganic ions, organic carbon and isotopic compositions of total carbon and nitrogen in biomass burning aerosols from the LBA-SMOCC campaign in Rondonia, Brazil. J. Aerosol Sci. 2010, 41, 118–133. [Google Scholar] [CrossRef] [Green Version]
- Sharma, S.K.; Mandal, T.; De, A.K.; Deb, N.; Jain, S.; Saxena, M.; Pal, S.; Choudhuri, A.K.; Yadav, S. Carbonaceous and inorganic species in PM10 during wintertime over Giridih, Jharkhand (India). J. Atmos. Chem. 2018, 75, 219–233. [Google Scholar] [CrossRef]
- Turekian, V.C.; Macko, S.; Ballentine, D.; Swap, R.J.; Garstang, M. Causes of bulk carbon and nitrogen isotopic fractionations in the products of vegetation burns: Laboratory studies. Chem. Geol. 1998, 152, 181–192. [Google Scholar] [CrossRef]
- Bond, T.C.; Streets, D.G.; Yarber, K.F.; Nelson, S.M.; Woo, J.H.; Klimont, Z. A technology-based global inventory of black and organic carbon emissions from combustion. J. Geophys. Res. Atmos. 2004, 109, D14203. [Google Scholar] [CrossRef] [Green Version]
- Chen, J.; Li, C.; Ristovski, Z.; Milic, A.; Gu, Y.; Islam, M.S.; Wang, S.; Hao, J.; Zhang, H.; He, C.; et al. A review of biomass burning: Emissions and impacts on air quality, health and climate in China. Sci. Total Environ. 2017, 579, 1000–1034. [Google Scholar] [CrossRef] [Green Version]
- Johnston, H.J.; Mueller, W.; Steinle, S.; Vardoulakis, S.; Tantrakarnapa, K.; Loh, M.; Cherrie, J.W. How harmful is particulate matter emitted from biomass burning? A Thailand Perspective. Curr. Pollut. Rep. 2019, 5, 353–377. [Google Scholar] [CrossRef] [Green Version]
- Grieshop, A.; Logue, J.; Donahue, N.; Robinson, A. Laboratory investigation of photochemical oxidation of organic aerosol from wood fires 1: Measurement and simulation of organic aerosol evolution. Atmos. Chem. Phys. 2009, 9, 9951–9963. [Google Scholar] [CrossRef] [Green Version]
- Kawashima, H.; Haneishi, Y. Effects of combustion emissions from the Eurasian continent in winter on seasonal δ13C of elemental carbon in aerosols in Japan. Atmos. Environ. 2012, 46, 568–579. [Google Scholar] [CrossRef]
- Zhang, F.; Xu, L.; Chen, J.; Chen, X.; Niu, Z.; Lei, T.; Li, C.; Zhao, J. Chemical characteristics of PM2.5 during haze episodes in the urban of Fuzhou, China. Particuology 2013, 11, 264–272. [Google Scholar] [CrossRef]
- Sullivan, A.; Frank, N.; Onstad, G.; Simpson, C.; Collet, J.L., Jr. Application of high-performance anion-exchange chromatography-pulsed amperometric detection for measuring carbohydrates in routine daily filter samples collected by a national network: 1. Determination of the impact of biomass burning in the upper Midwest. J. Geophys. Res. 2011, 116, D08302. [Google Scholar] [CrossRef] [Green Version]
- Urban, R.C.; Lima-Souza, M.; Caetano-Silva, L.; Queiroz, M.E.C.; Nogueira, R.F.P.; Allen, A.G.; Cardoso, A.A.; Held, G.; Campos, M.L.A.M. Use of levoglucosan, potassium, and water-soluble organic carbon to characterize the origins of biomass-burning aerosols. Atmos. Environ. 2012, 61, 562–569. [Google Scholar] [CrossRef]
- Wu, S.P.; Dai, L.H.; Zhu, H.; Zhang, N.; Yan, J.P.; Schwab, J.J.; Yuan, C.S. The impact of sea-salt aerosols on particulate inorganic nitrogen deposition in the western Taiwan Strait region, China. Atmos. Res. 2019, 228, 68. [Google Scholar] [CrossRef]
- Naksen, W.; Kawichai, S.; Srinual, N.; Salrasee, W.; Prapamontol, T. First evidence of high urinary 1-hydroxypyrene level among rural school children during smoke haze episode in Chiang Mai Province, Thailand. Atmos. Res. 2016, 8, 418–427. [Google Scholar] [CrossRef]
- Phornwisetsirikun, W.; Prapamontol, T.; Rangkakulnuwat, S.; Chantara, S.; Tavornyutikarn, P. Elevated ambient PM10 levels affecting respiratory health of schoolchildren in Chiang Mai, Thailand. Chiang Mai Univ. J. Nat. Sci. 2014, 13, 345–354. [Google Scholar] [CrossRef] [Green Version]
- Kawamura, K.; Kobayashi, M.; Tsubonuma, N.; Mochida, M.; Watanabe, T.; Lee, M. Organic and Inorganic Compositions of Marine Aerosols from East Asia: Seasonal Variations of Water-Soluble Dicarboxylic Acids, Major Ions, Total Carbon and Nitrogen, and Stable C and N Isotopic Composition; Elsevier: Amsterdam, The Netherlands, 2004; Volume 9, pp. 243–265. [Google Scholar]
- Vodička, P.; Kawamura, K.; Schwarz, J.; Kunwar, B.; Ždímal, V. Seasonal study of stable carbon and nitrogen isotopic composition in fine aerosols at a Central European rural background station. Atmos. Chem. Phys. 2019, 19, 3463–3479. [Google Scholar] [CrossRef] [Green Version]
- Martinsson, J.; Andersson, A.; Sporre, M.K.; Friberg, J.; Kristensson, A.; Swietlicki, E.; Olsson, P.A.; Stenström, K.E. Evaluation of δ13C in Carbonaceous aerosol source apportionment at a rural measurement site. Aerosol Air Qual. Res. 2017, 17, 2081–2094. [Google Scholar] [CrossRef] [Green Version]
- López-Veneroni, D. The stable carbon isotope composition of PM2.5 and PM10 in Mexico City metropolitan area air. Atmos. Environ. 2009, 43, 4491–4502. [Google Scholar] [CrossRef]
- Das, O.; Wang, Y.; Hsieh, Y.-P. Chemical and carbon isotopic characteristics of ash and smoke derived from burning of C3 and C4 grasses. Org. Geochem. 2010, 41, 263–269. [Google Scholar] [CrossRef]
- Krull, E.S.; Skjemstad, J.O.; Graetz, D.; Grice, K.; Dunning, W.; Cook, G.; Parr, J.F. 13C-depleted charcoal from C4 grasses and the role of occluded carbon in phytoliths. Org. Geochem. 2003, 34, 1337–1352. [Google Scholar] [CrossRef]
- Kunwar, B.; Kawamura, K.; Zhu, C. Stable carbon and nitrogen isotopic compositions of ambient aerosols collected from Okinawa Island in the western North Pacific Rim, an outflow region of Asian dusts and pollutants. Atmos. Environ. 2016, 131, 243–253. [Google Scholar] [CrossRef] [Green Version]
- Liu, X.; Li, X.; Bai, H.; Mu, L.; Li, Y.; Zhang, D. Stable carbon isotopic compositions and source apportionment of the carbonaceous components in PM2.5 in Taiyuan, China. Atmos. Environ. 2021, 261, 118601. [Google Scholar] [CrossRef]
- Bender, M.M. Variations in the 13C/12C ratios of plants in relation to the pathway of photosynthetic carbon dioxide fixation. Phytochemistry 1971, 10, 1239–1244. [Google Scholar] [CrossRef]
- Smith, B.N.; Epstein, S. Two categories of c/c ratios for higher plants. Plant Physiol. 1971, 47, 380–384. [Google Scholar] [CrossRef] [Green Version]
- Kawamura, K.; Sakaguchi, F. Molecular distributions of water soluble dicarboxylic acids in marine aerosols over the Pacific Ocean including tropics. J. Geophys. Res. Atmos. 1999, 104, 3501–3509. [Google Scholar] [CrossRef]
- Kelly, S.; Stein, C.; Jickells, T. Carbon and nitrogen isotopic analysis of atmospheric organic matter. Atmos. Environ. 2005, 39, 6007–6011. [Google Scholar] [CrossRef]
- Widory, D.; Javoy, M. The carbon isotope composition of atmospheric CO2 in Paris. Earth Planet Sci. Lett. 2003, 215, 289–298. [Google Scholar] [CrossRef]
- Pavuluri, C.M.; Kawamura, K.; Tachibana, E.; Swaminathan, T. Elevated nitrogen isotope ratios of tropical Indian aerosols from Chennai: Implication for the origins of aerosol nitrogen in South and Southeast Asia. Atmos. Environ. 2010, 44, 3597–3604. [Google Scholar] [CrossRef] [Green Version]
Publisher’s Note: MDPI stays neutral with regard to jurisdictional claims in published maps and institutional affiliations. |
© 2022 by the authors. Licensee MDPI, Basel, Switzerland. This article is an open access article distributed under the terms and conditions of the Creative Commons Attribution (CC BY) license (https://creativecommons.org/licenses/by/4.0/).