Abstract
Walnut shell is a very potential biochar precursor because of its wide source, low cost, and easy structure modification. In this paper, the co-activation method of FeCl3, ZnCl2 and H2O(g) was adopted to prepare walnut shell-based biochar with high microporosity and the effect of pore structure on CO2 adsorption performance at different temperatures was investigated. The prepared biochar had a larger specific surface area (2647.8 m2 g−1), satisfactory micropore area (2008.7 m2 g−1) and high total pore volume (2.58 cm3 g−1). At 273 K and 298 K, its CO2 adsorption capacity was 4.79 mmol g−1 and 3.20 mmol g−1, respectively. Particularly, CO2 adsorbed uptake on biochar was strongly sensitive to their narrow micropore volume, instead of the total specific surface area, total pore volume, and micropore specific surface area. The optimal pore size beneficial for CO2 adsorption was 0.33–0.82 nm at 273 K, but the optimal pore size was 0.33–0.39 nm at 298 K. It provides theoretical guidance for future material preparation and selection, and FeCl3, ZnCl2 and H2O(g) may be effective biochar activators.
1. Introduction
CO2 emissions are increasing year by year due to the advancement of industrialization and the massive consumption of fossil fuels, resulting in an increasingly severe greenhouse effect and frequent extreme weather events [1]. Countries have gradually begun to pay attention to CO2 emissions and jointly adopted the Paris Agreement in 2015, aiming to restrain carbon emissions of all countries and achieve global carbon neutrality at an early date. Although renewable energy is a very potential replacement for fossil energy, the disadvantages of low energy efficiency and uneven distribution in time and space greatly limit its large-scale application. Currently, CO2 capture and storage technologies (CCS) are probably the most valuable methods for reducing CO2 emissions [2]. Among them, CO2 capture by adsorption has the benefits of low energy usage, low cost, simple process route, convenient operation, and environmental friendliness, which has led to adsorption becoming the most promising way for wide application.
The development of high-efficiency and cost-effective adsorbents is the most important problem to be solved for CO2 adsorption and separation engineering. These days, common CO2 solid adsorbents include molecular sieve [3,4], carbon materials [5,6,7], metal oxide [8], metal–organic frameworks (MOFs) [9,10], etc. Among them, activated carbon with the advantages of the wide source of raw materials, excellent pore structure and easy preparation are the most prospective and efficient CO2 adsorbents.
Biochar derived from sources such as agricultural waste [11], nut shells [12,13], and minerals [3] not only has the same advantages as activated carbon, but also has the benefits of rich surface functional groups, improved resource reuse, and relief of pressure on waste disposal. However, the conventional biochar obtained by direct high-temperature pyrolysis of biomass has many deficiencies, so it needs to be modified to optimize the structure of biochar. Chemical and physical activation methods can be used to prepare biochar by changing the activator, activation conditions, and activator/precursor ratio to regulate the pore structure. H2O(g) is the green activator that can make biochar materials obtain new pore structures and expand pores. However, it is difficult to control the pore structure and activation efficiency of activated carbon when only steam is used for activation [13]. Metal salt activators (ZnCl2 [14], FeCl3 [15], MgCl2 [13]), have the advantages of low corrosiveness, environmental friendliness and reusability compared to disposable activators (KOH [12], HNO3 [16], H3PO4 [17]). Meanwhile, metal salts can enhance the graphitization and increase the porosity of biochar. Yan et al. [14] found that the ZnCl2-activated biochar had an abundant micropores structure and high specific surface area. Theydan et al. [18] concluded that after activation by FeCl3, the biochar material had a rich pore structure, the volume of micropores and mesopores increased, and the micropore size was about 0.8 nm. The synergistic effect of the activation of the two salts will be better than the activation of a single salt. Perondi et al. [15] co-activated biochar with ZnCl2 and FeCl3. They found that FeCl3 promoted graphene-like structure generation through the formation of a complex carburized phase during pyrolysis, and ZnCl2 promoted the carbon to form a micropores structure. Ultimately, ZnCl2 led to a 40% increase in total pore volume, and the carbon material was dominated by micropores and narrow mesopores.
Walnut shells are excellent biochar precursors because of their high volatile content and pore structure that can be easily modified. In addition, walnuts are very popular nuts, with a global production of 3.7 million tons in 2019, of which China accounts for 1.06 million tons [19]. Additionally, 60% of the mass of walnut fruit is the walnut shells [20]. However, most walnut shells can only be discarded and finally disposed of by incineration, which greatly increases the burden on the environment. Based on the above reasons, this paper prepares a CO2 adsorbent with walnut shells as a precursor.
In this paper, biochar was prepared using the walnut shells as a precursor and ZnCl2, FeCl3, and H2O(g) as activators. In addition, the pore structures and carbon structure of biochar were characterized and analyzed, and CO2 adsorption performance was tested at 298 K and 273 K. Finally, the impact of pore structure on the CO2 adsorption capability for biochar was explored, and the optimal pore size ranges of biochar materials for adsorption at different temperatures were determined.
2. Experimental Section
2.1. Materials and Chemicals
Walnut shells were purchased from the local bazaar (Yinchuan, China), and their proximate analysis and ultimate analysis are shown in Table 1. ZnCl2·6H2O (AR) and FeCl3·6H2O (AR) were acquired from Sigma-Aldrich (St. Louis, MO, USA). Hydrochloric acid (AR, HCl, 36.0 wt.%) was purchased from Sinopharm Chemical Reagent Co. High purity CO2 (99.999%) and high purity N2 (99.999%) were bought from Ningxia Guangli Gas Company (Ningxia, China).

Table 1.
Industrial analysis and elemental analysis of walnut shell.
2.2. Synthesis of Micropores Biochar
The walnut shells should be rinsed with DI water and dried at 373 K. Crush the walnut shells and sieve them to make 50~100 mesh particles. Samples with mass ratios of 5:1:3, 5:1.5:1.5, 5:3:1, 5:3:0 and 5:0:3 were prepared for walnut shell, FeCl3·6H2O and ZnCl2·6H2O, respectively. The specific operation is as follows: weigh a certain mass of FeCl3·6H2O and ZnCl2·6H2O into 500 mL of DI water and mix until well dispersed; then add 5 g biomass to the metal salt solution for impregnation with heating at 423 K and stirring at 400 r/min until the solution is completely volatilized. The experimental setup for pyrolysis and activation is shown in Figure 1. The sample was first purged by passing 300 mL/min N2. Then, the sample was heated to 1173 K at a heating rate of 10 K/min in an inert atmosphere (N2 200 mL min−1) and kept for 100 min until the biomass was pyrolyzed. At the end of the experiment, water was turned off and the samples were removed after the device had cooled to room temperature. The pyrolyzed biochar samples were washed with 0.3 M HCl for 6 h to eliminate metal oxides and a tiny amount of ash, then washed with DI water continuously to neutralize. The final products were dried for 12 h at 373 K. Micropores biochar samples were obtained and named by the impregnated mass ratio, respectively. The prepared micropores biochar samples were named by the metal salt impregnation mass ratio (for example, a sample with 5 g walnut shell, 3 g FeCl3·6H2O and 1 g ZnCl2·6H2O was named WS-5-3-1).

Figure 1.
Schematic diagram of activation experimental device.
The effect of H2O(g) on the pyrolysis process of walnut shells was investigated. The activation of WS-5-3-1 and WS-5-1.5-1.5 was carried out by adjusting the amount of H2O(g) (adjusting the flow rate of water entering the steam generator to 0.1, 0.15, 0.2, 0.25 mL min−1). The samples were named by the metal salt impregnation ratio and water intake (for instance, a sample with 5g walnut shell, 3g FeCl3·6H2O and 1g ZnCl2·6H2O and 0.25 mL min−1 H2O(g) flow rate was named as WS-5-3-1-0.25).
2.3. Characterization
The crystalline phase of samples was tested by X-ray diffractometer (XRD, Bruker, Germany) at Cu radiation, 40 kV, 40 mA, and 2θ range of 3°–85°. The degree of graphitization of the adsorbents was detected by Raman spectroscopy (DXR2xi Raman, Waltham, MA, USA). The adsorbent’s surface functional groups were examined by FTIR (TENSOR II, Bruker, Germany). Industrial analysis and elemental analysis of walnut shells by the elemental analyzer (Vario EL cube, Pavia, Italy). The 50–60 mmg sample was weighed in the sample tube and degassed at 573 K. The pore structure parameters of the adsorbent were characterized by N2 adsorption and desorption curves at 77 K measured by automatic physical–chemical adsorption instrument (Conta autosorb IQ, Boynton Beach, FL, USA). The 50–60 mmg sample was weighed in the sample tube and degassed at 573 K. SBET (specific surface area) was obtained by the BET method. VT (total pore volume) was calculated by adsorbed amount at P/P0 = 0.99. SMic (microporous surface area) and VMic (microporous pore volume) were acquired by the t-plot method. Additionally, the analysis software is NOVAWin (NOVAwin2 v.2.1, Boynton Beach, FL, USA).
2.4. CO2 Adsorption Performance Evaluation
CO2 adsorption test on biochar at 273 K and 298 K by automatic physical–chemical adsorption instrument (Conta autosorb IQ, Boynton Beach, FL, USA). The nonlocal density functional theory (NLDFT) model provided by the Autosorb instrument software (NOVAwin2 v.2.1) was applied to calculate the size distribution (NMPSD) and volume of micropores (<1.5 nm). After obtaining the CO2 adsorption isotherm on activated carbon at 273 K, we only need to select the NLDFT model and type at the CO2 saturation vapor pressure of 273 K. Then, the software can give the distribution of micropores and the accumulated volume of all pores in the range of 0.33–1.50 nm. Finally, in a certain range, we correlated the CO2 adsorption of all biochar with their micropore volumes and found the best linear relationship between them.
3. Biochar Characterization
Figure 2 shows the SEM images of biochar with different metal salt weight ratios and different amounts of H2O(g). As shown in Figure 2a, only a small number of macropores and low porosity existed on the surface of raw materials (the direct pyrolysis walnut shells). Figure 2c–f show the biochar prepared by co-activation using FeCl3 and ZnCl2, whose pore structure became developed, but the surface was still dominated by macropores. The main reasons for the pore formation are the volatilization of ZnCl2 during the pyrolysis, the reaction of FeCl3 with surface carbon, and the removal of ZnO and Fe3O4 particles by acid washing. The amount of FeCl3·6H2O had a more significant modulating effect on the surface morphology of biochar. As the FeCl3·6H2O dosage increased, the size of the pores on the biochar surface increased, and its ablation of carbon on the surface of biochar became more significant (Figure 2b,c), which was caused by the reaction between iron oxides and carbon. The number of pores on the biochar surface increased when the amount of ZnCl2·6H2O was increased (Figure 2c,d). When ZnCl2·6H2O and FeCl3·6H2O were used together, the pore size on the surface of biochar decreased, the reaction between Fe and its surrounding char reduced, and the degree of etching on the surface of biochar declined (Figure 2d,e).
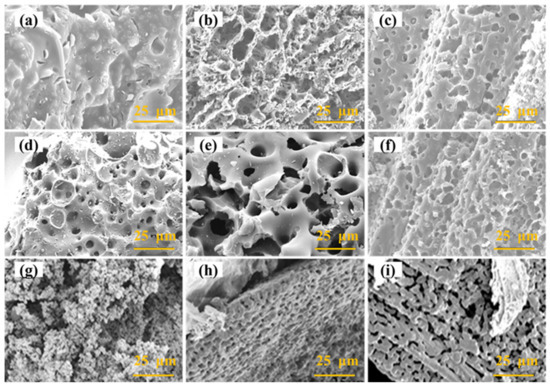
Figure 2.
SEM images of (a) raw materials, (b) WS-5-3-0, (c) WS-5-3-1, (d) WS-5-1.5-1.5, (e) WS-5-1-3, (f) WS-3-1-0.1, and (g–i) WS-5-3-1-0.2.
When H2O(g) was added for activation, the apparent morphology of the biochar was altered. As illustrated in Figure 2f, the surface of WS-5-3-1-0.25 showed a larger number and a more uniform pore size structure. When FeCl3·6H2O and H2O(g) were used as activators, carbon deposition and growth appeared on the surface of biochar (Figure 2g). Activation with metal salts effectively stripped the lignin layer on the surface of walnut shells, allowing the internal structure to be revealed, which was honeycomb-like (Figure 2h,i).
Metal salts accelerate the rate of biomass pyrolysis, reduce the pyrolysis time of biomass, decrease the energy required for pyrolysis and can change the crystalline phase of carbon. The graphitization and orderliness analysis of the biochar were characterized by XRD, and the results are shown in Figure 3. The XRD patterns of biochar all show a strong peak at about 25°, which is the (002) peak of graphite, representing the degree of graphitization of biochar. Additionally, the peak at 44° is the (100) peak of carbon, which represents the orderliness of biochar [21,22]. Figure 3a shows the XRD patterns of the biochar prepared by adjusting the ratio of ZnCl2·6H2O and FeCl3·6H2O. With the ratio of metal salts, the half-peak widths, and peak intensities of the (100) and (002) crystal plane diffraction peaks of carbon do not change significantly, indicating that metal salts dosage has no significant effect on the graphitization and the ordering degree of biochar. Figure 3b and Figure S1 (Supplementary Material) show the XRD patterns of biochar prepared by co-activation with ZnCl2 and FeCl3 by adjusting the ratio of water vapor. When the amount of H2O(g) increases, the intensity of the (002) peak of carbon continuously decreases or even disappears. This is mainly attributed to the fact that the reaction between H2O(g) and carbon makes the pores of biochar more developed and destroys the structure of the graphite layer, thus the biochar structure behaves more disordered.
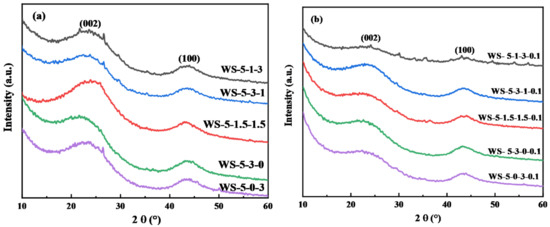
Figure 3.
The XRD spectra of biochar prepared by (a) different ratios of metal salts and (b) different ratios of metal salts and 0.1 mL min−1 H2O(g) activation.
Raman spectroscopy was used to further analyze the degree of carbon defects in the biochar structure, and the characterization results are shown in Figure 4 and Figure S2. All biochar samples have typical characteristic peaks D at 1358 cm−1 and G peaks at 1596 cm−1, which correspond to disordered carbon atom structures with defects and graphene layers with sp2 hybridization of carbon atoms, respectively [23,24]. In general, the higher the intensity ratio of D and G peaks (ID: IG), the higher the disorder of carbon in the biochar [25]. Additionally, the ratio of FeCl3·6H2O and ZnCl2·6H2O has a more obvious effect on the intensity ratio of D and G peaks. It was found that the intensity ratios were between 0.99–1.02, when the ratios of metal salts were changed, and the ratios of metal salts slightly changed the degree of ordering of biochar. When H2O(g) was added during the activation process, the biochar had sharp D-peaks, G-peaks, and 2D-peaks. The appearance of the 2D-peaks represents an increase in the number of carbon layers in the biochar. After calculation, the ID: IG increased to between 1.01–1.06. The increase in the intensity ratio between the D and G peaks of the biochar prepared by comparing the adjusted amount of H2O(g) indicates that the intensity of the G peak in the biochar is enhanced, which is mainly attributed to the increasing of graphite layers in the biochar after adding H2O(g). Increasing the structural defects of carbon materials is beneficial to enhancing the CO2 adsorption performance [26].
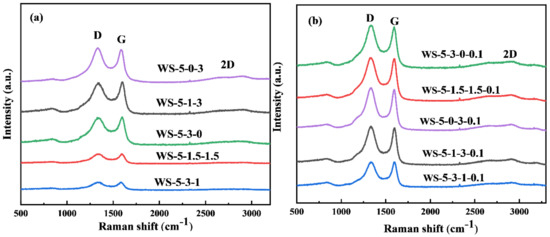
Figure 4.
The Raman spectra of biochar prepared by (a) different ratios of metal salts and (b) different ratios of metal salts and 0.1 mL min−1 H2O(g) activation.
The functional groups on the surface of biochar were characterized using FTIR as shown in Figure 5. All samples showed the stretching vibrational peaks of -OH/-NH at wave numbers of 3426 cm−1. All samples also showed the stretching vibrational peaks of C=O and the bending vibrational peaks of -NH bonds at wave numbers of 1630 cm−1, which indicated the presence of oxygen-containing functional groups and amino functional groups [27,28]. In addition, the stretching vibrational peaks of -OH functional group at 3426 cm−1 may originate from H2O in air. WS-5-1-3 and WS-5-3-1-0.2 showed a C-H stretching vibrational peak at 2974 cm−1. Meanwhile, WS-5-3-1-0.2 showed the stretching vibrational peaks of C-O at 1087 and 1043 cm−1, respectively. The presence of -OH/-NH basic groups in biochar contributes to the enhancement of CO2 adsorption [4,5]. Furthermore, the type and number of functional groups on the surface of biochar were low, which was mainly due to the catalytic decomposition and volatilization of organic matter on the surface of biochar activated by metal salts and H2O(g) at 900 °C.
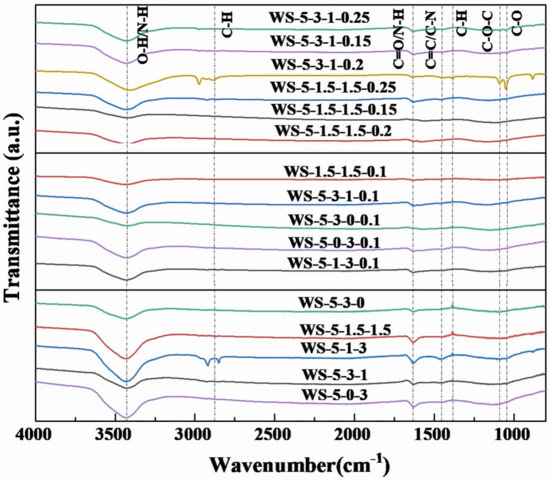
Figure 5.
FT−IR spectra of biochar.
The pore size distribution of biochar refers to the graded pores present in the biochar, and the percentage of different size pores is obtained by number or volume. In this study, the static capacity method was used to obtain the pore size distribution in biochar by testing the partial pressure and the adsorption capacity of the corresponding pore levels. Figure 6 shows the N2 adsorption–desorption isotherms and pore size distribution of the biochar prepared by using different ratios of metal salts and H2O(g) activation. Figure 6a illustrates that the isothermal adsorption curves of the biochar samples prepared by activation of FeCl3·6H2O and ZnCl2·6H2O were all class I adsorption curves [29,30]. The biochar obtained by direct pyrolysis without activator was a class IV isothermal adsorption curve, and the N2 adsorption region was mainly concentrated in the smaller pore size range, thus still dominated by microporosity. In Figure 6b, the pore size of biochar samples is mainly micropores. Among them, when the proportion of ZnCl2·6H2O was high, it helps the formation of micropores with about 0.5 nm in the biochar. When the proportion of FeCl3·6H2O was higher, the effect on the pore size of biochar was not prominent. When FeCl3·6H2O and ZnCl2·6H2O were used together, the proportion of pores between 1–2 nm in biochar can be increased. Compared with the raw materials, the pore structure of the co-activated biochar is more developed. As shown in Figure 6c, when H2O(g) and metal salts were used as activators at the same time, the isothermal adsorption curves of biochar showed a class IV isothermal adsorption curve with a hysteresis loop, indicating that some mesopores existed in biochar, but most of the pores in the carbon are still dominated by micropores, so the prepared biochar is still micropores biochar.
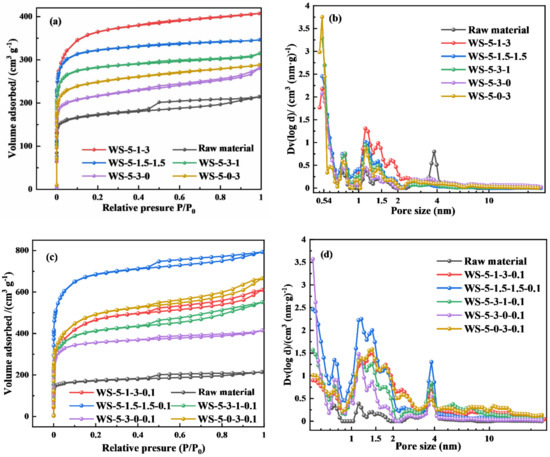
Figure 6.
N2 adsorption–desorption isotherms of (a) different ratios of metal salts activation and (c) different ratios of metal salts and 0.1 mL min−1 H2O(g) activation. Pore size distribution of (b) different ratios of metal salts activation and (d) different ratios of metal salts and 0.1 mL min−1 H2O(g) activation.
Figure 6d shows that when H2O(g) was added, the pore size of biochar shifted from 0.5 nm to the range of 1~4 nm, indicating that H2O(g) has a more obvious effect on micropores expansion. The amount of H2O(g) was adjusted for WS-5-1.5-1.5 and WS-5-3-1 to observe the pore structure changes of biochar (Figure S3). The micro-pores distributed around 0.5 nm decreased significantly with the increase of H2O(g) dosage, while the pores between 1 and 4 nm increased significantly, but the changes of pores >4 nm were not obvious. Therefore, it can be concluded that H2O(g) can be used to regulate the pore size distribution ratio between 0.5 and 4 nm in biochar.
Table 2 shows that the biochar prepared with different metal ratios has larger specific surface area and micropores surface area. Raw materials had a poor specific surface area (667.42 m2/g), and total pore volume (0.33 m3/g) because direct-pyrolysis walnut shells had undeveloped porosity, but the specific surface area and pore volume were significantly enhanced after modification with metal salts and water. WS-5-3-1 had the largest specific surface area and total pore volume of 1370.4 m2 g−1 and 0.63 cm3 g−1, respectively. The specific surface area and pore volume of biochar prepared by co-activation with two metal salts were found to be larger than those prepared by activation with a single metal salt. The specific surface area of biochar increased substantially when FeCl3 and ZnCl2 and H2O(g) were co-activated. The amount of H2O(g) had a more significant effect on the specific surface area and pore volume of biochar. This is because the addition of H2O(g) increases the number of layers of biochar, resulting in an improvement in specific surface area. It was found that WS-5-1.5-1.5-1.5 had the maximum specific surface area (2647.8 m2 g−1) and maximum micropore-specific surface area (2008.7 m2 g−1). WS-5-1.5-1.5-2.0 had the largest pore volume of 2.58 cm3 g−1. However, as the dosage of H2O(g) continued to increase, the specific surface area and pore volume of biochar decreased, due to the excessive reaction between H2O(g) and biochar resulting in the pore size of biochar being larger and the pores merged. The average pore size increased with the increase in H2O(g) dosage (Table S1). The use of metal salts and H2O(g) was able to prepare micropores biochar with excellent structure, but the excessive use of H2O(g) was not conducive to increasing the surface area and porosity of biochar.

Table 2.
The effect of the activation ratio of biomass, metal salts and H2O(g) on the surface properties of biochar, and CO2 adsorption capacities of adsorbents at different temperatures.
4. CO2 Adsorption Performance
As shown in Table 2, WS-5-3-1-0.25 had the best CO2 adsorption capacity of 4.79 mmol g−1 at 273 K and WS-5-1.5-1.5 had the best CO2 adsorption capacity of 3.20 mmol g−1 at 298 K. Compared with the CO2 adsorption capacity of biochar adsorbents in the past literatures (Table 3), it is found that WS-5-1.5-1.5 and WS-5-5-3-1-0.25 have excellent CO2 adsorption capacity. The CO2 adsorption capacity of WS-5-3-1 (4.61 mmol g−1) at 273K is lower than that of WS-5-3-0.25 (4.79 mmol g−1), but the CO2 adsorption capacity of WS-5-3-1 (3.02 mmol g−1) at 298 K is higher than that of WS-5-3-0.25 (2.58 mmol g−1). This observation indicates that the addition of an appropriate amount of H2O(g) changes the pore structure of the biochar, which promotes the CO2 adsorption at 273 K, but inhibits the CO2 adsorption at 298 K. All the adsorption of biochar decreased after the increase of temperature. A more interesting phenomenon is that the samples with high adsorption at 298 K are not so high at 273 K. For example, WS-5-3-1-0.25 had the highest adsorption capacity at 273 K, but the adsorption capacity at 298 K was only 2.58 mmol g−1. To investigate this observation, a comparison of specific surface area, pore volume, micropores specific surface area and micropores pore volume on CO2 adsorption from Table 2 revealed that these factors did not directly correlate with CO2 adsorption. Deng et al. found that CO2 adsorption is an exothermic process, and the temperature has a great influence on the amount of CO2 adsorption. Additionally, the sensitivity of different carbon materials to the temperature at atmospheric pressure is different, which depends on the number of narrow micropores in the adsorbent [31,32,33,34]. The effect of this narrow micropore size pore effect on CO2 adsorbent was further investigated.

Table 3.
Comparison with CO2 adsorption from past research work.
The N content of the walnut shell was only 0.26% as shown in Table 1, N-containing functional groups have less effect on adsorption, which indicates that the pore-filling plays a dominant role in CO2 adsorption. The narrow micropore size distribution (NMPSD) of biocarbon (<1 nm) was precisely obtained using the CO2 adsorption isotherm at 273 K. Combining Figure 7 with the CO2 adsorption capacity of the samples, it is found that the amount of CO2 adsorption at 273 K is closely related to the pore volume between 0.35–0.82 nm. As shown in Figure 7d, WS-5-3-1-0.25 has the largest micropore volume in the pore size range of 0.35–0.82 nm among the four samples, and its CO2 adsorption capacity at 273 K is also the best among the four samples. On the contrary, WS-5-3-1-0.15 and WS-5-3-1-0.2 have smaller micropore volumes in the pore size range of 0.35–0.82 nm, making their CO2 adsorption capacity at 273 K unsatisfactory. However, when the temperature was increased to 298 K, the CO2 adsorption amount of all samples showed a significant decrease. Additionally, the CO2 adsorption at 298 K for the samples fed with water decreased more than that for the samples not fed with water at 298 K. This is because the large pore volume between 0.35–0.82 nm is higher for the samples fed with water than for the samples not fed with water, and the large pores are ineffective for CO2 adsorption.
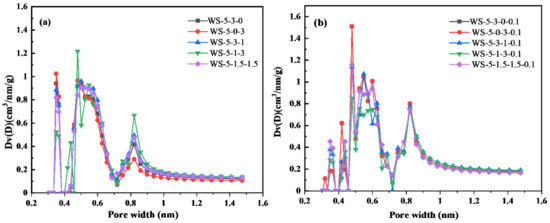
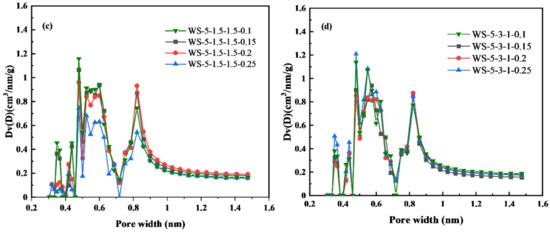
Figure 7.
NMPSD plot of (a) biochar with different amounts of metal salts activation, (b) biochar with different amounts of metal salts and 0.1 mL min−1 H2O(g) activation, (c) WS-5-1.5-1.5 with different amounts of H2O(g) activation, and (d) WS-5-3-1 with different amount of H2O(g) activation. The pore sizes were from 0.3 nm to 1.0 nm.
Figure 7 shows the presence of four peaks at 0.35, 0.48, 0.55 and 0.82 nm for all NMPSD curves, representing different narrow micropore volumes (V0.35, V0.48, V0.55, and V0.82, respectively). Biochar activated by water produces a new peak at 0.44 nm (pore volume at 0.44 nm is denoted by V0.44). This is due to the pore-expanding effect of H2O(g), which enlarges part of the 0.35 nm pore to 0.44 nm. After water activation, V0.82 increases significantly (Figure S4). This indicates that the addition of H2O(g) increased the pore size of the micropores. Figure 7a shows that the volume of narrow micropores within 0.35–0.82 nm of biochar after single salt activation is smaller than that of double salt activation, which results in better CO2 adsorption performance of the double salt activated biochar. Figure 7a,b show that V0.35 decreased by half after the sample was passed through water, but V0.82 and V0.47 also increased substantially, and the amount of CO2 adsorbed lost more, which indicates that the amount of CO2 adsorbed at 298 K may be correlated with V0.35. Figure 7c shows that the narrow micropore volume of WS-1.5-1.5-2.5 is much smaller than that of the other samples, which is because the passage of excess H2O(g) would block the narrow micropores of the biochar material, thus leading to a substantial decrease in the narrow micropore volume. In summary, different ratios of metal salts and water activation have a strong correlation with the NMPSD of biochar materials and CO2 adsorption at different temperatures.
It was found that the correlation between narrow micropores and CO2 adsorption for biochar materials changed with the adsorption temperature. To quantitatively confirm the exact micropore range for CO2 adsorption at different temperatures, the relationship between different narrow micropore (0.33–0.99 nm) volumes and CO2 adsorption capacity at 273 K and 298 K was established (Figure 8 and Figure 9). At 273 K, the correlation coefficient (R2) showed a trend of increasing and then decreasing with the increase of the upper limit of the pore size range (Figure 8). Additionally, the highest R2 = 0.99 was shown in the pore size range of 0.33–0.82 nm (Figure 8d), which indicates that the pore size of 0.33–0.82 nm plays a major role in the adsorption of CO2 at 273K. This result is in line with the literature, implying that this result might be applied to any carbon materials [40,41,42]. Figure 8a–c demonstrate a surge in R2 values when the upper pore size increases from 0.46 nm to 0.72 nm, which indicates an important effect on CO2 adsorption when the pore size range is 0.46–0.72 nm. This is because micropores between 0.46–0.72 nm can provide more rooms for carbon dioxide to adjust its position in the pore wall [43,44]. Figure 8d–f demonstrate that R2 gradually decreases when the upper limit of pore size is higher than 0.82 nm, indicating that the contribution of >0.82 nm pore size to CO2 adsorption gradually decreases.
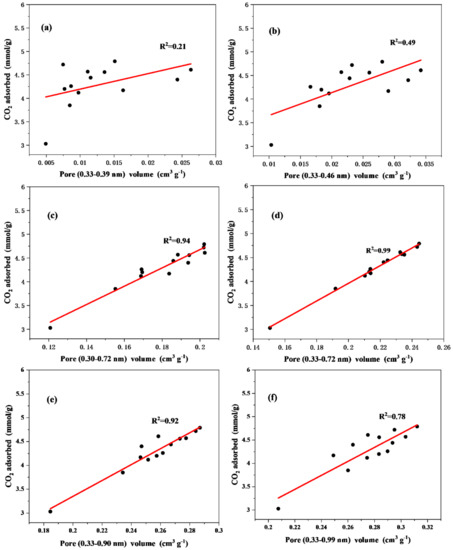
Figure 8.
Relationship between CO2 adsorption at 273 K and the volume of micropores in the range of (a) 0.33−0.39 nm, (b) 0.33−0.46 nm, (c) 0.33−0.72 nm, (d) 0.33−0.82 nm, (e) 0.33−0.90 nm, and (f) 0.33−0.99 nm.
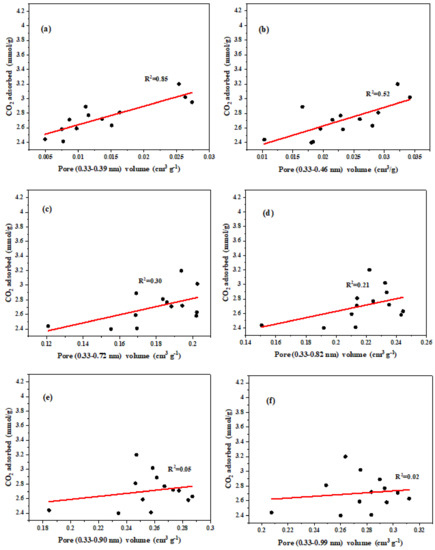
Figure 9.
Relationship between CO2 adsorption at 298 K and the volume of micropores in the range of (a) 0.33−0.39 nm, (b) 0.33−0.46 nm, (c) 0.33−0.72 nm, (d) 0.33−0.82 nm, (e) 0.33−0.90 nm, and (f) 0.33−0.99 nm.
At 298 K, R2 decreases with an increasing upper limit of pore size (Figure 9). The highest R2 was found in the pore size range of 0.33–0.39 nm (Figure 9a). This indicates that the pore size range of 0.33–0.39 nm at 298 K plays a major role in the adsorption of CO2. The addition of H2O(g) increases the pore size of the biochar, which adversely affects the adsorption of CO2 at 298 K. It can see that the R2 at 273 K (R2 = 0.99) is much larger than that at 298 K (R2 = 0.85). Firstly, this may be explained by the fact that most of the pore sizes are larger than 0.39 nm and these pores are less useful for CO2 adsorption at 298K. Additionally, these larger size micropores are too large to achieve a dense accumulation of CO2 molecules at 298 K, making the data points deviate from the linear regression severely [36]. Second, because larger pores in biochar contribute less to CO2 adsorption via the pore-filling mechanism at 298 K, the impact of CO2 molecules via surface physisorption on adsorbents could become considerable [31]. The effective adsorption pore size was greatly reduced when the adsorption temperature of 273 K was increased to 298 K, however, which could be the reason for the nearly 50% reduction in total adsorption.
5. Conclusions
In this paper, a new environmentally friendly and low-cost CO2 adsorbent with walnut shell as a precursor and FeCl2, ZnCl2 and H2O(g) as an activator was proposed. By controlling the number of metal salts and H2O(g), the adsorbent with excellent pore structure and superior specific surface area was obtained. The specific surface area of WS-1.5-1.5-0.15 was 2647.78 m2 g−1, and the micropore volume was up to 2008.72 m2 g−1. The total pore volume of WS-1.5-1.5-2.0 was up to 2.58 cm3 g−1. It makes this adsorbent modification method a guide in the fields of supercapacitors and adsorption of pollutants.
The adsorption of CO2 at 273 K and 298 K was found to be 4.79 mmol g−1 and 3.20 mmol g−1, respectively, and there was no correlation between the adsorption of CO2 and the specific surface area, total pore volume, and specific surface area of micropores. The adsorption of CO2 at different temperatures was related to the distribution of narrow micropores in the adsorbent. The optimum CO2 adsorption pore size was 0.33–0.82 nm for walnut shell-based biochar at 273 K and 0.33–0.39 nm for walnut shell-based biochar at 298 K.
Supplementary Materials
The following supporting information can be downloaded at: https://www.mdpi.com/article/10.3390/atmos13071110/s1, Figure S1. SEM spectra of (a) WS-5-1.5-1.5 and (b) WS-5-3-1 by different ratios of H2O (g) activation; Figure S2. Raman spectra of (a) WS-5-1.5-1.5 and (b) WS-5-3-1 by different ratios of H2O (g) activation; Figure S3. N2 adsorption-desorption isotherms (a,c) and pore size distribution curves (b,d) of biochar; Figure S4. NMPSD plot of (a) WS-5-1.5-1.5 and WS-5-1.5-1.5-0.1 and (b) WS-5-3-1 and WS-5-3-1-0.1; Table S1. The effect of the activation ratio of biomass, metal salts and H2O(g) on the surface properties of biochar.
Author Contributions
Conceptualization, T.G.; methodology, T.G. and W.T.; software, T.G.; validation, T.G., W.T. and Y.W.; formal analysis, T.G. and W.T.; investigation, T.G.; data curation, T.G. and W.T.; writing—original draft preparation, T.G.; writing—review and editing, Y.W.; visualization, T.G. and W.T.; supervision, Y.W.; project administration, Y.W.; funding acquisition, Y.W. All authors have read and agreed to the published version of the manuscript.
Funding
The Joint Funds of the National Natural Science Foundation of China (grant number U20A20124); Natural Science Foundation of Ningxia Province (No. 2022AAC03251); the Major Project of the Key Research and Development Program of Ningxia Province, China (grant number 2018BCE01002).
Institutional Review Board Statement
Not applicable.
Informed Consent Statement
Not applicable.
Data Availability Statement
Not applicable.
Acknowledgments
Many thanks to Qingjie Guo for allowing us to use the experimental equipment. I would also like to thank Mei An and Jian Hao for their academic suggestions.
Conflicts of Interest
The authors declare no conflict of interest.
References
- Gunathilake, C.A.; Ranathunge, G.; Dassanayake, R.S.; Illesinghe, S.D.; Manchanda, A.S.; Kalpage, C.S.; Rajapakse, R.M.G.; Karunaratne, D. Emerging investigator series: Synthesis of magnesium oxide nanoparticles fabricated on a graphene oxide nanocomposite for CO2 sequestration at elevated temperatures. Environ. Sci. Nano 2020, 7, 1225–1239. [Google Scholar] [CrossRef]
- Damartzis, T.; Papadopoulos, A.I.; Seferlis, P. Process flowsheet design optimization for various amine-based solvents in post-combustion CO2 capture plants. J. Clean. Prod. 2016, 111, 204–216. [Google Scholar] [CrossRef]
- Wang, X.; Zeng, W.L.; Song, M.J.; Wang, F.L.; Hu, X.D.; Guo, Q.J.; Liu, Y.Z. Polyetheramine improves the CO2 adsorption behavior of tetraethylenepentamine-functionalized sorbents. Chem. Eng. J. 2019, 364, 475–484. [Google Scholar] [CrossRef]
- Wang, X.; Guo, Q.J.; Kong, T.T. Tetraethylenepentamine-modified MCM-41/silica gel with hierarchical mesoporous structure for CO2 capture. Chem. Eng. J. 2015, 273, 472–480. [Google Scholar] [CrossRef]
- Wang, Y.; Hu, X.; Guo, T.; Hao, J.; Si, C.; Guo, Q. Efficient CO2 adsorption and mechanism on nitrogen-doped porous carbons. Front. Chem. Sci. Eng. 2021, 15, 493–504. [Google Scholar] [CrossRef]
- Wang, Y.X.; Hu, X.D.; Guo, T.; Tian, W.G.; Hao, J.; Guo, Q.J. The competitive adsorption mechanism of CO2, H2O and O2 on a solid amine adsorbent. Chem. Eng. J. 2021, 416, 129007. [Google Scholar] [CrossRef]
- Rehman, A.; Heo, Y.-J.; Nazir, G.; Park, S.-J. Solvent-free, one-pot synthesis of nitrogen-tailored alkali-activated microporous carbons with an efficient CO2 adsorption. Carbon 2021, 172, 71–82. [Google Scholar] [CrossRef]
- Othman, F.E.C.; Yusof, N.; Samitsu, S.; Abdullah, N.; Hamid, M.F.; Nagai, K.; Abidin, M.N.Z.; Azali, M.A.; Ismail, A.F.; Jaafar, J.; et al. Activated carbon nanofibers incorporated metal oxides for CO2 adsorption: Effects of different type of metal oxides. J. CO2 Util. 2021, 45, 101434. [Google Scholar] [CrossRef]
- Furukawa, H.; Cordova, K.E.; O’Keeffe, M.; Yaghi, O.M. The Chemistry and Applications of Metal-Organic Frameworks. Science 2013, 341, 1230444. [Google Scholar] [CrossRef] [Green Version]
- Li, J.-R.; Ma, Y.; McCarthy, M.C.; Sculley, J.; Yu, J.; Jeong, H.-K.; Balbuena, P.B.; Zhou, H.-C. Carbon dioxide capture-related gas adsorption and separation in metal-organic frameworks. Coord. Chem. Rev. 2011, 255, 1791–1823. [Google Scholar] [CrossRef]
- Feng, D.; Guo, D.; Zhang, Y.; Sun, S.; Zhao, Y.; Chang, G.; Guo, Q.; Qin, Y. Adsorption-enrichment characterization of CO2 and dynamic retention of free NH3 in functionalized biochar with H2O/NH3 center dot H2O activation for promotion of new ammonia-based carbon capture. Chem. Eng. J. 2021, 409, 128193. [Google Scholar] [CrossRef]
- Chen, J.; Yang, J.; Hu, G.; Hu, X.; Li, Z.; Shen, S.; Radosz, M.; Fan, M. Enhanced CO2 Capture Capacity of Nitrogen-Doped Biomass-Derived Porous Carbons. ACS Sustain. Chem. Eng. 2016, 4, 1439–1445. [Google Scholar] [CrossRef]
- Tian, W.; Wang, Y.; Hao, J.; Guo, T.; Wang, X.; Xiang, X.; Guo, Q. Amine-Modified Biochar for the Efficient Adsorption of Carbon Dioxide in Flue Gas. Atmosphere 2022, 13, 579. [Google Scholar] [CrossRef]
- Yan, L.; Liu, Y.; Zhang, Y.; Liu, S.; Wang, C.; Chen, W.; Liu, C.; Chen, Z.; Zhang, Y. ZnCl2 modified biochar derived from aerobic granular sludge for developed microporosity and enhanced adsorption to tetracycline. Bioresour. Technol. 2020, 297, 122381. [Google Scholar] [CrossRef]
- Perondi, D.; Bassanesi, G.R.; Manera, C.; Lazzari, L.K.; Godinho, M.; Zattera, A.J.; Dotto, G.L. From cellulose to graphene-like porous carbon nanosheets. Microporous Mesoporous Mater. 2021, 323, 111217. [Google Scholar] [CrossRef]
- Gao, C.; Vo, C.D.; Jin, Y.Z.; Li, W.W.; Armes, S.P. Multihydroxy polymer-functionalized carbon nanotubes: Synthesis, derivatization, and metal loading. Macromolecules 2005, 38, 8634–8648. [Google Scholar] [CrossRef]
- Nowrouzi, M.; Younesi, H.; Bahramifar, N. Superior CO2 capture performance on biomass-derived carbon/metal oxides nanocomposites from Persian ironwood by H3PO4 activation. Fuel 2018, 223, 99–114. [Google Scholar] [CrossRef]
- Theydan, S.K.; Ahmed, M.J. Adsorption of methylene blue onto biomass-based activated carbon by FeCl3 activation: Equilibrium, kinetics, and thermodynamic studies. J. Anal. Appl. Pyrolysis 2012, 97, 116–122. [Google Scholar] [CrossRef]
- Albatrni, H.; Qiblawey, H.; Al-Marri, M.J. Walnut shell based adsorbents: A review study on preparation, mechanism, and application. J. Water Process Eng. 2022, 45, 102527. [Google Scholar] [CrossRef]
- Jahanban-Esfahlan, A.; Amarowicz, R. Walnut (Juglans regia L.) shell pyroligneous acid: Chemical constituents and functional applications. RSC Adv. 2018, 8, 22376–22391. [Google Scholar] [CrossRef] [Green Version]
- Morales, L.F.; Herrera, K.; Lopez, J.E.; Saldarriaga, J.F. Use of biochar from rice husk pyrolysis: Assessment of reactivity in lime pastes. Heliyon 2021, 7, e08423. [Google Scholar] [CrossRef] [PubMed]
- Tagliaferro, A.; Rovere, M.; Padovano, E.; Bartoli, M.; Giorcelli, M. Introducing the Novel Mixed Gaussian-Lorentzian Lineshape in the Analysis of the Raman Signal of Biochar. Nanomaterials 2020, 10, 1748. [Google Scholar] [CrossRef] [PubMed]
- Xu, J.; Liu, J.; Ling, P.; Zhang, X.; Xu, K.; He, L.; Wang, Y.; Su, S.; Hu, S.; Xiang, J. Raman spectroscopy of biochar from the pyrolysis of three typical Chinese biomasses: A novel method for rapidly evaluating the biochar property. Energy 2020, 202, 117644. [Google Scholar] [CrossRef]
- Chia, C.H.; Gong, B.; Joseph, S.D.; Marjo, C.E.; Munroe, P.; Rich, A.M. Imaging of mineral-enriched biochar by FTIR, Raman and SEM-EDX. Vib. Spectrosc. 2012, 62, 248–257. [Google Scholar] [CrossRef]
- De Sousa, D.V.; Guimaraes, L.M.; Felix, J.F.; Ker, J.C.; Schaefer, C.E.R.G.; Rodet, M.J. Dynamic of the structural alteration of biochar in ancient Anthrosol over a long timescale by Raman spectroscopy. PLoS ONE 2020, 15, e0229447. [Google Scholar] [CrossRef]
- Srinivas, G.; Krungleviciute, V.; Guo, Z.-X.; Yildirim, T. Exceptional CO2 capture in a hierarchically porous carbon with simultaneous high surface area and pore volume. Energy Environ. Sci. 2014, 7, 335–342. [Google Scholar] [CrossRef] [Green Version]
- Yadav, T.K.; Abhishek; Prasad, B.; Singh, D.; Prasad, K.S. Calcium Pretreated Pinus Roxburghii Wood Biochar for Adsorptive Removal of Fluoride from Aqueous Solution. Biointerface Res. Appl. Chem. 2022, 12, 4307–4316. [Google Scholar] [CrossRef]
- Bashir, S.; Zhu, J.; Fu, Q.; Hu, H. Comparing the adsorption mechanism of Cd by rice straw pristine and KOH-modified biochar. Environ. Sci. Pollut. Res. 2018, 25, 11875–11883. [Google Scholar] [CrossRef]
- Rasa, K.; Vihera-Aarnio, A.; Rytkonen, P.; Hyvaluoma, J.; Kaseva, J.; Suhonen, H.; Jyske, T. Quantitative analysis of feedstock structural properties can help to produce willow biochar with homogenous pore system. Ind. Crops Prod. 2021, 166, 113475. [Google Scholar] [CrossRef]
- Schnee, L.S.; Knauth, S.; Hapca, S.; Otten, W.; Eickhorst, T. Analysis of physical pore space characteristics of two pyrolytic biochars and potential as microhabitat. Plant Soil 2016, 408, 357–368. [Google Scholar] [CrossRef] [Green Version]
- Deng, S.B.; Wei, H.R.; Chen, T.; Wang, B.; Huang, J.; Yu, G. Superior CO2 adsorption on pine nut shell-derived activated carbons and the effective micropores at different temperatures. Chem. Eng. J. 2014, 253, 46–54. [Google Scholar] [CrossRef]
- Sevilla, M.; Fuertes, A.B. Sustainable porous carbons with a superior performance for CO2 capture. Energy Environ. Sci. 2011, 4, 1765–1771. [Google Scholar] [CrossRef] [Green Version]
- Wickramaratne, N.P.; Jaroniec, M. Activated Carbon Spheres for CO2 Adsorption. ACS Appl. Mater. Interfaces 2013, 5, 1849–1855. [Google Scholar] [CrossRef]
- Dassanayake, R.S.; Gunathilake, C.; Abidi, N.; Jaroniec, M. Activated carbon derived from chitin aerogels: Preparation and CO2 adsorption. Cellulose 2018, 25, 1911–1920. [Google Scholar] [CrossRef]
- Igalavithana, A.D.; Choi, S.W.; Dissanayake, P.D.; Shang, J.; Wang, C.-H.; Yang, X.; Kim, S.; Tsang, D.C.W.; Lee, K.B.; Ok, Y.S. Gasification biochar from biowaste (food waste and wood waste) for effective CO2 adsorption. J. Hazard. Mater. 2020, 391, 121147. [Google Scholar] [CrossRef] [PubMed]
- Du, Y.; Fan, Z.; Guo, T.; Xu, J.; Han, Z.; Pan, Y.; Xiao, H.; Sun, Y.; Yan, Q. Characteristics of as-prepared biochar derived from catalytic pyrolysis within moderate-temperature ionic liquid for CO2 uptake. Can. J. Chem. Eng. 2020, 98, 690–704. [Google Scholar] [CrossRef]
- Zhou, Y.; Wang, J.; Sun, M.; Li, W.; Hu, X. Adsorption of CO2 by nitrogen doped corn straw based biochar. Arab. J. Geosci. 2021, 14, 1875. [Google Scholar] [CrossRef]
- Zubbri, N.A.; Mohamed, A.R.; Kamiuchi, N.; Mohammadi, M. Enhancement of CO2 adsorption on biochar sorbent modified by metal incorporation. Environ. Sci. Pollut. Res. 2020, 27, 11809–11829. [Google Scholar] [CrossRef]
- Huang, Y.-F.; Chiueh, P.-T.; Lo, S.-L. CO2 adsorption on biochar from co-torrefaction of sewage sludge and leucaena wood using microwave heating. Energy Procedia 2019, 158, 4435–4440. [Google Scholar] [CrossRef]
- Presser, V.; McDonough, J.; Yeon, S.H.; Gogotsi, Y. Effect of pore size on carbon dioxide sorption by carbide derived carbon. Energy Environ. Sci. 2011, 4, 3059–3066. [Google Scholar] [CrossRef]
- Wei, H.R.; Deng, S.B.; Hu, B.Y.; Chen, Z.H.; Wang, B.; Huang, J.; Yu, G. Granular Bamboo-Derived Activated Carbon for High CO2 Adsorption: The Dominant Role of Narrow Micropores. Chemsuschem 2012, 5, 2354–2360. [Google Scholar] [CrossRef] [PubMed]
- Zhang, Z.; Zhou, J.; Xing, W.; Xue, Q.; Yan, Z.; Zhuo, S.; Qiao, S.Z. Critical role of small micropores in high CO2 uptake. Phys. Chem. Chem. Phys. 2013, 15, 2523–2529. [Google Scholar] [CrossRef] [PubMed]
- Vishnyakov, A.; Ravikovitch, P.I.; Neimark, A.V. Molecular level models for CO2 sorption in nanopores. Langmuir 1999, 15, 8736–8742. [Google Scholar] [CrossRef]
- Vishnyakov, A.; Piotrovskaya, E.M.; Brodskaya, E.N. Monte Carlo Computer Simulation of Adsorption of Diatomic Fluids in Slitlike Pores. Langmuir 1996, 12, 3643–3649. [Google Scholar] [CrossRef]
Publisher’s Note: MDPI stays neutral with regard to jurisdictional claims in published maps and institutional affiliations. |
© 2022 by the authors. Licensee MDPI, Basel, Switzerland. This article is an open access article distributed under the terms and conditions of the Creative Commons Attribution (CC BY) license (https://creativecommons.org/licenses/by/4.0/).