Article

Effects of Winter Heating on Urban Black Carbon: Characteristics, Sources and Its Correlation with Meteorological Factors

1
School of Ecology and Environment, Zhengzhou University, Zhengzhou 450001, China
2
School of Environment, Beijing Normal University, Beijing 100875, China
3
Vehicle Emission Control Center, Chinese Research Academy of Environmental Sciences, Beijing 100012, China
4
Institute of Environmental Science, Zhengzhou University, Zhengzhou 450001, China
*
Author to whom correspondence should be addressed.
These authors contributed equally to this work.
Atmosphere 2022, 13(7), 1071; https://doi.org/10.3390/atmos13071071
Submission received: 13 May 2022 / Revised: 28 June 2022 / Accepted: 5 July 2022 / Published: 6 July 2022
(This article belongs to the Special Issue Characteristics and Control of Traffic-Related Emissions)

Abstract

:
Coal combustion for winter heating is a major source of heavy atmospheric pollution in China, while its impacts on black carbon (BC) are not yet clear. A dual-spot Aethalometer was selected to monitor the atmospheric BC concentration in Zhengzhou, China, during the heating season, which is from 15 November through 15 March of the following year, and the non-heating season (days other than heating season). The characteristics and sources of BC were analyzed, and a concentration weight trajectory (CWT) analysis was conducted. The results showed that the BC concentrations in the heating season were generally higher than those in the non-heating season. The diurnal variation in BC concentrations during heating season was bimodal, and that during the non-heating season was unimodal. The α-values in the heating and non-heating seasons indicated that combustion of coal and biomass and vehicle emissions were the major BC sources for the heating season and non-heating season, respectively. BC concentrations were positively correlated with PM2.5, PM10, CO, and NOX. There was a strong negative correlation between wind speed and BC concentrations, and that for relative humidity was the opposite. BC concentration during heating season was mainly influenced by the northwestern areas of China and the eastern part of Henan, and that in the non-heating season was mainly from the northeastern areas of China and southern Henan.

1. Introduction

Black carbon (BC), the best-known type of light-absorbing carbonaceous aerosol, has attracted much attention for several decades [1,2]. BC is mainly emitted from incomplete combustion of biomass, coal, and fossil fuel, including open biomass burning, mobiles, power, and cooking [3,4,5]. BC has received much attention in the past due to its climate effect. Previous references indicated that BC has the strongest light-absorbing ability in atmospheric particulate matter [6], and thus it has positive radiative forcing, which contributed to the rise in the earth’s surface temperature [7,8,9]. Atmospheric BC with a large surface area and porous structure can adsorb various toxic chemical compounds, such as semi-medium volatile organic compounds (VOCs) and polycyclic aromatic hydrocarbons (PAHs) [2]. In addition, BC can also deposit in weasands and lungs, causing severe diseases [10,11].
BC has a significant effect on climate, human health, and the surface environment, so it is necessary to investigate the emission characteristics of BC to reduce its adverse effects. Previous studies of carbonaceous aerosols mainly focused on their temporal variation, size distribution, optical properties, and emission inventory. Pakkanen et al. [12] measured BC concentrations near the city center of Helsinki and found that local BC concentrations had significant diurnal variations and weekend effects. Since the 1990s, many large-scale international aerosol observation experiments have investigated carbonaceous aerosols and studied their properties, processes, and effects, such as the International Global Atmosphere Chemistry Project (IGAC), the Radiative Aerosol Characterization Experiment (RACE), the Aerosol Characterization Experiment—I (ACE-I), the Aerosol Characterization Experiment—II (ACE-II), the India Ocean Experiment (INDOEX), and the Aerosol Characterization Experiment—Asia (ACE-Asia).
Many studies have reported that BC sources varied significantly depending on geographical location, meteorological condition, and regional structure [13,14,15]. Wang et al. [16] showed that there was a more significant “dome effect” in rural areas, which has a suppressive effect on vertical atmospheric dispersion. Zhang et al. [17] used the aethalometer model to investigate the concentrations and sources of BC in six megacities and found that the concentrations of BC were higher in northern cities than in southern cities. Ni et al. [18] studied atmospheric BC in Beijing and Xi’an by using the radiocarbon method and found that BC mainly originated from fossil fuel combustion, followed by biomass combustion during fog and haze days. Chen et al. [19] pointed out that the annual number of fog and haze days was higher in rural areas than in urban areas.
Henan province, with an emerging economy and industrial development, has become the core area of the Central Plains City Cluster. Winter heating in Henan is mainly based on coal combustion. A previous study has shown that the annual average PM2.5 concentration (80 μg/m3) in Henan exceeded the second grade of the Chinese Ambient Air Quality Standard (75 μg/m3), with Zhengzhou—the capital city of Henan—having the worst air quality [20]. In order to verify the effects of centralized urban heating on BC, this study took Zhengzhou, located in the center of several of the most polluted cities in Henan, as the study area.
Most of the previous studies on the influencing factors of BC were based on the impact of a single variable. Considering the limitation and uncertainty of the univariate analysis, more influencing factors need to be taken into account. Therefore, a multivariate correlation analysis was used in this study to investigate the relationship between the BC concentration, regulated pollutant concentrations, and meteorological factors. In addition, the effect of winter heating on BC is not clear yet. To research the extent of this effect, this study focused on a comparison of the BC characteristics between the heating and non-heating seasons.

2. Materials and Methods
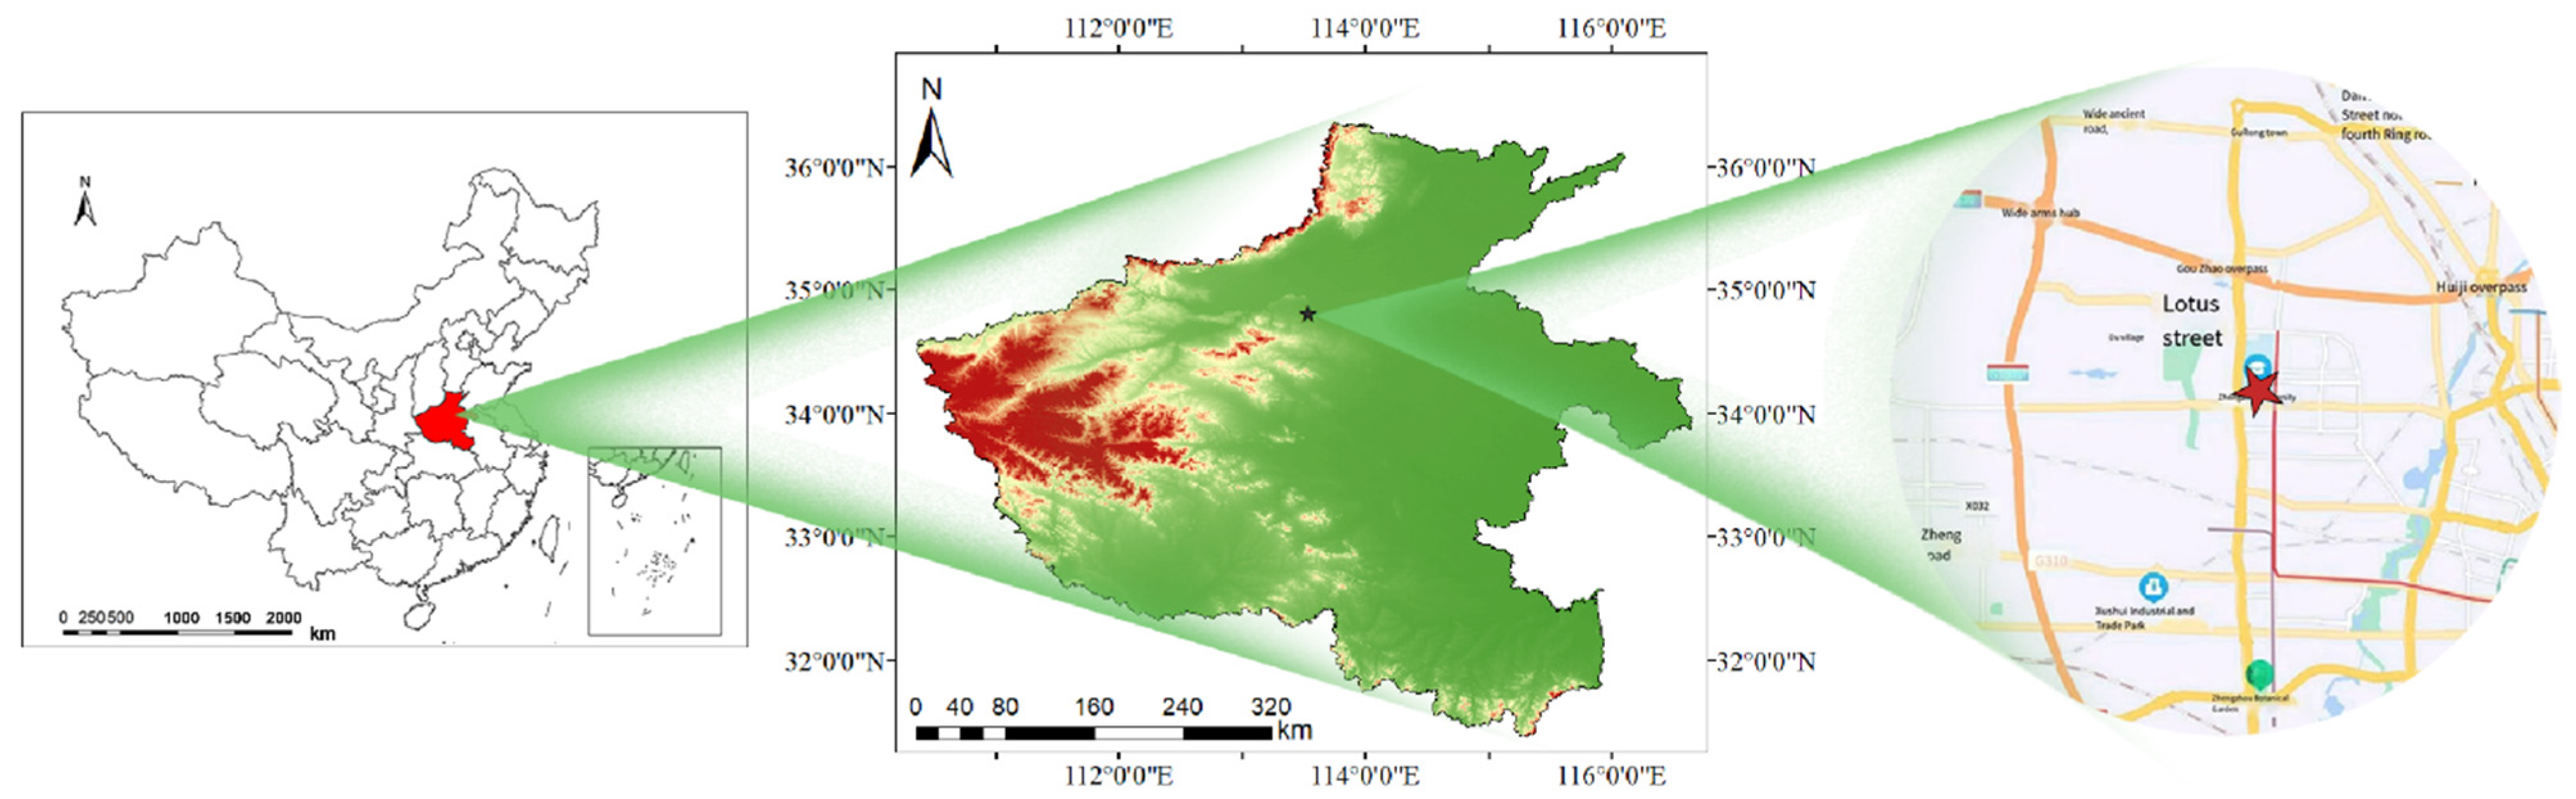
2.1. Sampling Site

The online air quality observation center (34°49′ N, 113°32′ E) at Zhengzhou University was selected as the sampling site for this study. BC concentrations were sampled at this site during the heating season (November-December 2021) and during the non-heating season (March 2022). In addition, the meteorological parameters and other atmospheric pollutant data, namely, SO2, PM2.5, PM10, NO, NO2, NOX, and O3, were also sampled and analyzed simultaneously at this observation center. The observation point was approximately 20 m above the ground. The sampling site was surrounded by various functional areas, such as schools, residential areas, commercial areas, main roads, and large factories, which is representative of BC monitoring. The location of the sampling point is shown in Figure 1.

2.2. Black Carbon Aerosol Measurements

BC was monitored by a Magee’s dual-spot Aethalometer Model AE33 (Magee Scientific, Berkeley, CA, USA). The absorption coefficient was referred to in the literature [21]. An Aethalometer simultaneously measures optical absorption at 7 wavelengths (i.e., 370, 470, 520, 590, 660, 880, and 950 nm), and values at 880 nm were the defining standard for reporting BC concentrations [22]. Actually, it should be referred to as equivalent BC (eBC) because BC was determined optically [23]. For simplicity, it was identified as BC in this study. Compared with the traditional single-point Aethalometer (AE22, AE31, AE42, etc.), however, the dual-spot Aethalometer (AE33) used in our study has modified the multiple scattering effects of the filter membrane and loading effects. The sampling frequency was set to 1 min, and the data were processed as 1-h averages to facilitate subsequent analysis. In addition, the data used for analysis and discussion did not contain significant outliers.
AE33 can measure ATN by BC particles on the filter and then calculates the light absorption coefficients (babs) for different wavelengths of BC, as follow:
ATN = 100 × ln ( I / I 0 )
where I refers to the spot signal, and I0 refers to the reference signal.
b abs = S · ( ATN / 100 ) F in · t · C
where S, Fin, ∆t, and C represent the spot area, time, flow, and multiple scattering parameters, respectively.
The concentration of BC can also be calculated from babs, as follow:
BC = b abs σ air
where σair represents the mass absorption cross-section, m2/g. σair is 18.47 m2/g, and 7.77 m2/g when the wavelength is 370 nm and 880 nm, respectively [22].
In this study, regarding the wavelength dependence analysis of BC, a wavelength near 880 nm is better for the calculation of Absorption Ångström Exponent (AAE), because BC dominated the light absorption in that wavelength range [24]. The calculation equation is as follows:
b abs , 880 ( BC ) = b abs , 880 ( BC liquid ) + b abs , 880 ( BC liquid )
The light absorption coefficients of BC at different wavelengths can be expressed by the following equation:
b abs ( λ ) = λ α
where babs(λ) refers to the light absorption coefficient of BC at wavelength λ. α refers to the absorption exponent, which is calculated with the BC concentration as a function of wavelength [25].
The absorption exponents for the liquid- and solid-fuel-sourced BC are as follow:
b abs , BC ( 370   nm ) liquid b abs , BC ( 880   nm ) liquid = ( 370 880 ) α liquid
b abs , BC ( 370   nm ) solid b abs , BC ( 880   nm ) solid = ( 370 880 ) α solid
where αliquid and αsolid represent the light absorption exponent for the liquid-source BC and solid-fuel-source BC, respectively.

2.3. Air Mass Backward Trajectories

The long-term transport of air masses from surrounding regions could also contribute to the BC concentration in the study area [26]. In order to investigate the possible potential areas of BC in Zhengzhou, a back-trajectory cluster analysis with air mass traced back by 24 h was performed each month, reaching an altitude of 700 m AGL. The meteorological data used in the calculation were downloaded from the global data assimilation system (GDAS) released by National Centers for Environmental Prediction (NCEP, College Park, MD, USA). In this study, the angle–distance algorithm of TrajStat (GIS-based software that uses various trajectory statistical analysis methods to identify potential sources from long-term air pollution measurement data) was used to cluster the trajectories (details given in Wang et al. 2009) [27].
Concentration Weighted Trajectory (CWT) [28] has been widely used to combine the statistical analysis of air mass back-trajectories with long-term ambient air pollution measurements for source identification [29,30]. In this model, the trajectories reaching the sampling site were weighted on the basis of the mean BC concentrations at the sampling site. The geographic regions covered by the air trajectories were divided into 1° × 1° grid cells and each grid point has a weighted value obtained by averaging the sample data observed at the sampling site [31,32]. The average concentration Cij of each gird (i,j) can be calculated by the following equation:
C ij = W ij · l = 1 M C l · τ ijl l = 1 M τ ijl
W ij = f ( x ) = { 1.00 ,     N ij > 80 0.70 ,     20 < N ij 80 0.42 ,     10 < N ij 20 0.05 ,     N ij 10
where Cij refers to the average weighted BC mass concentration in the grid cell (i,j), and Wij refers to the weighting factor. Nij refers to the total number of nodes of all tracks in the study period, and Cl refers to the BC mass concentration of trajectory (l) passing through the grid cell (i,j). τijl refers to the residence time of trajectory (l) at the grid cell (i,j).

3. Results and Discussion

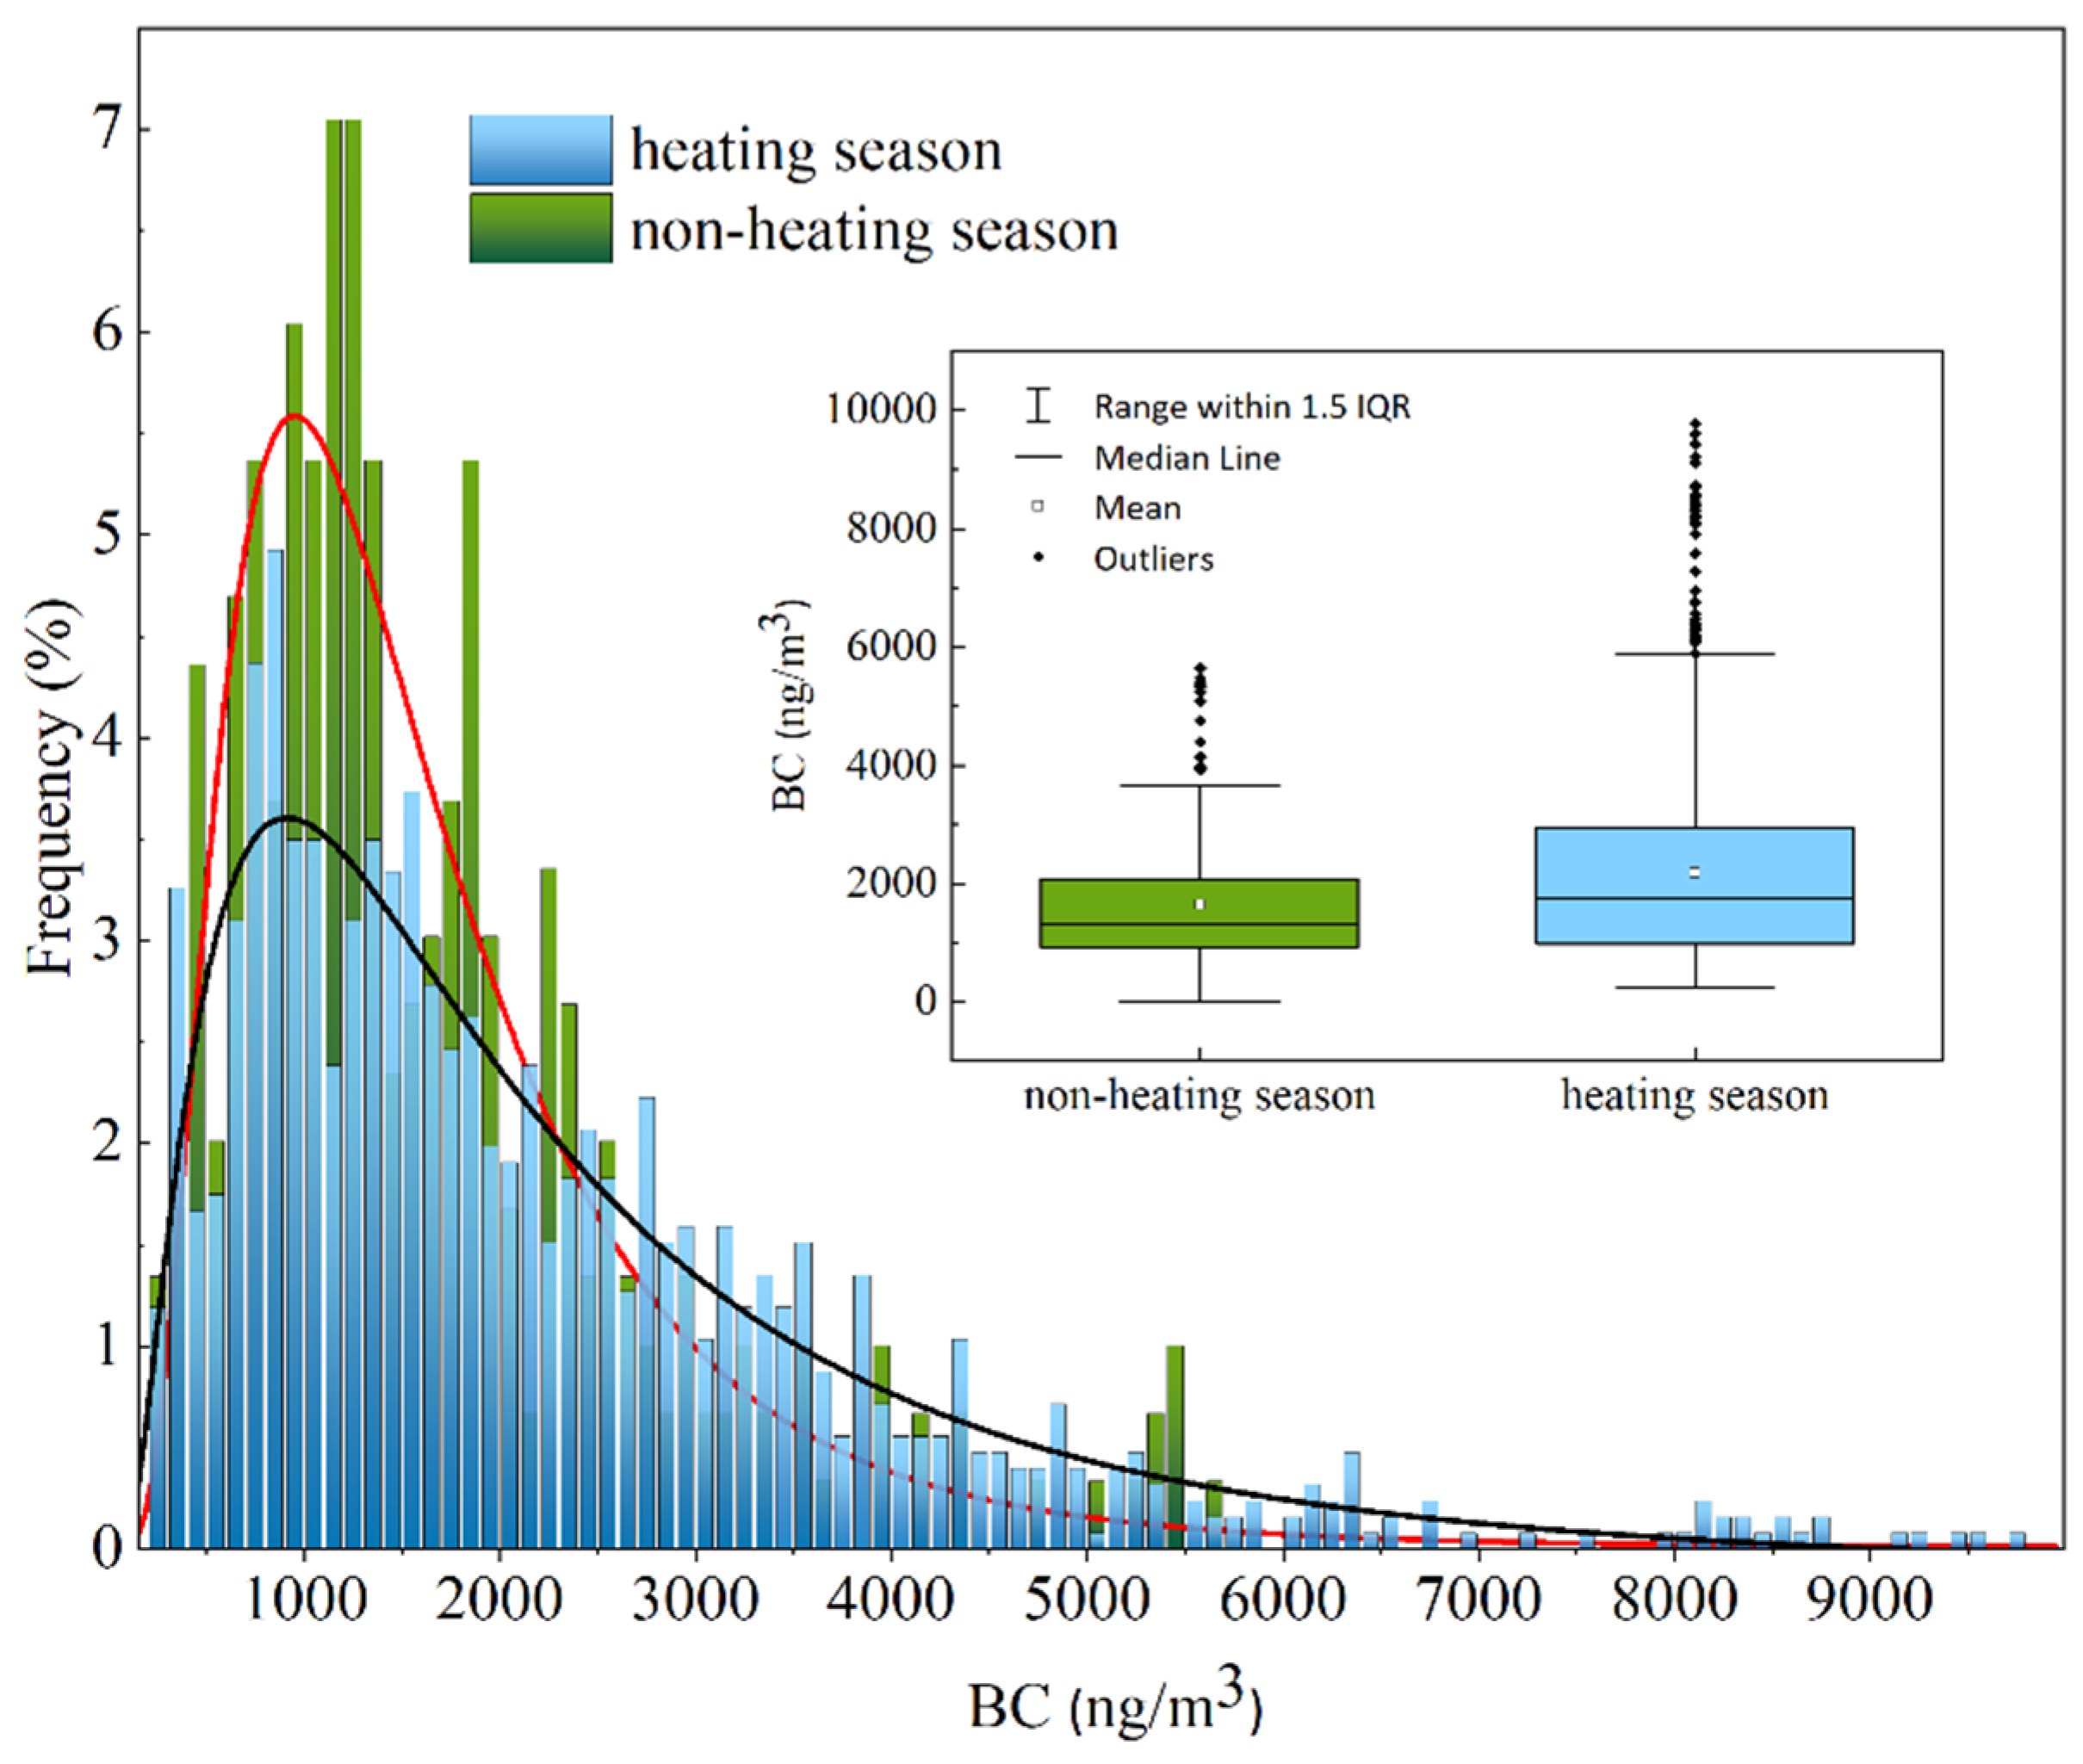
3.1. Black Carbon (BC) Characteristics in Heating and Non-Heating Seasons

The frequency distribution of hourly BC concentrations was analyzed for the heating and non-heating seasons with an interval of 100 ng/m3 and is shown in Figure 2. It was clear from the results that the concentration of BC in the heating and non-heating seasons were 2183 ng/m3 and 1652 ng/m3, respectively. When the BC concentration was relatively low (0–3000 ng/m3), the frequency in the non-heating season was significantly higher than in the heating season. It indicated that there were more clean days during the non-heating season. When the BC concentration was relatively high (>3000 ng/m3), the frequency of the heating season was significantly higher. It indicated that events with a higher BC concentration occurred more frequently in the heating seasons. This result indicated that centralized urban heating in winter increased the BC concentration. As shown in the statistical box, the high BC concentration outliers in the non-heating season were below 6000 ng/m3, while the outliers in the heating season were concentrated in the range of 6000–10,000 ng/m3, which indicated that centralized urban heating increased the number of days with high BC pollution. Zhang et al. measured the PM2.5 concentrations in different seasons in Wuhan and found that the PM2.5 concentrations were higher in winter than in spring [33]. BC, as a major component of the PM2.5, also showed the same characteristics, which presented a good consistency.
Figure 3 displayed the monthly variation in BC concentration in the heating and non-heating seasons. The number of days with high BC concentrations was obviously higher in the heating season as compared to the non-heating season. From Figure 3a, it was clear from the result that the morning and evening peaks in the heating season were mainly concentrated around 3500–5700 ng/m3, and the daily BC concentrations varied widely. Noteworthy, abnormally high BC concentrations were observed from 10 to 12 December 2021. The historical air quality data show that these three days in Zhengzhou were heavily polluted with the air-quality index (AQI) of 158, 245, and 168, respectively, and the PM values are abnormally high. There is a strong positive correlation between BC and PM, because BC is a major component of PM. As shown in Figure 3b, the variation in BC concentrations throughout the day was slight during the non-heating season, which was mainly concentrated between 1400 and 3700 ng/m3. In general, BC pollution was more severe in winter; meanwhile, the daily variation was more obvious.

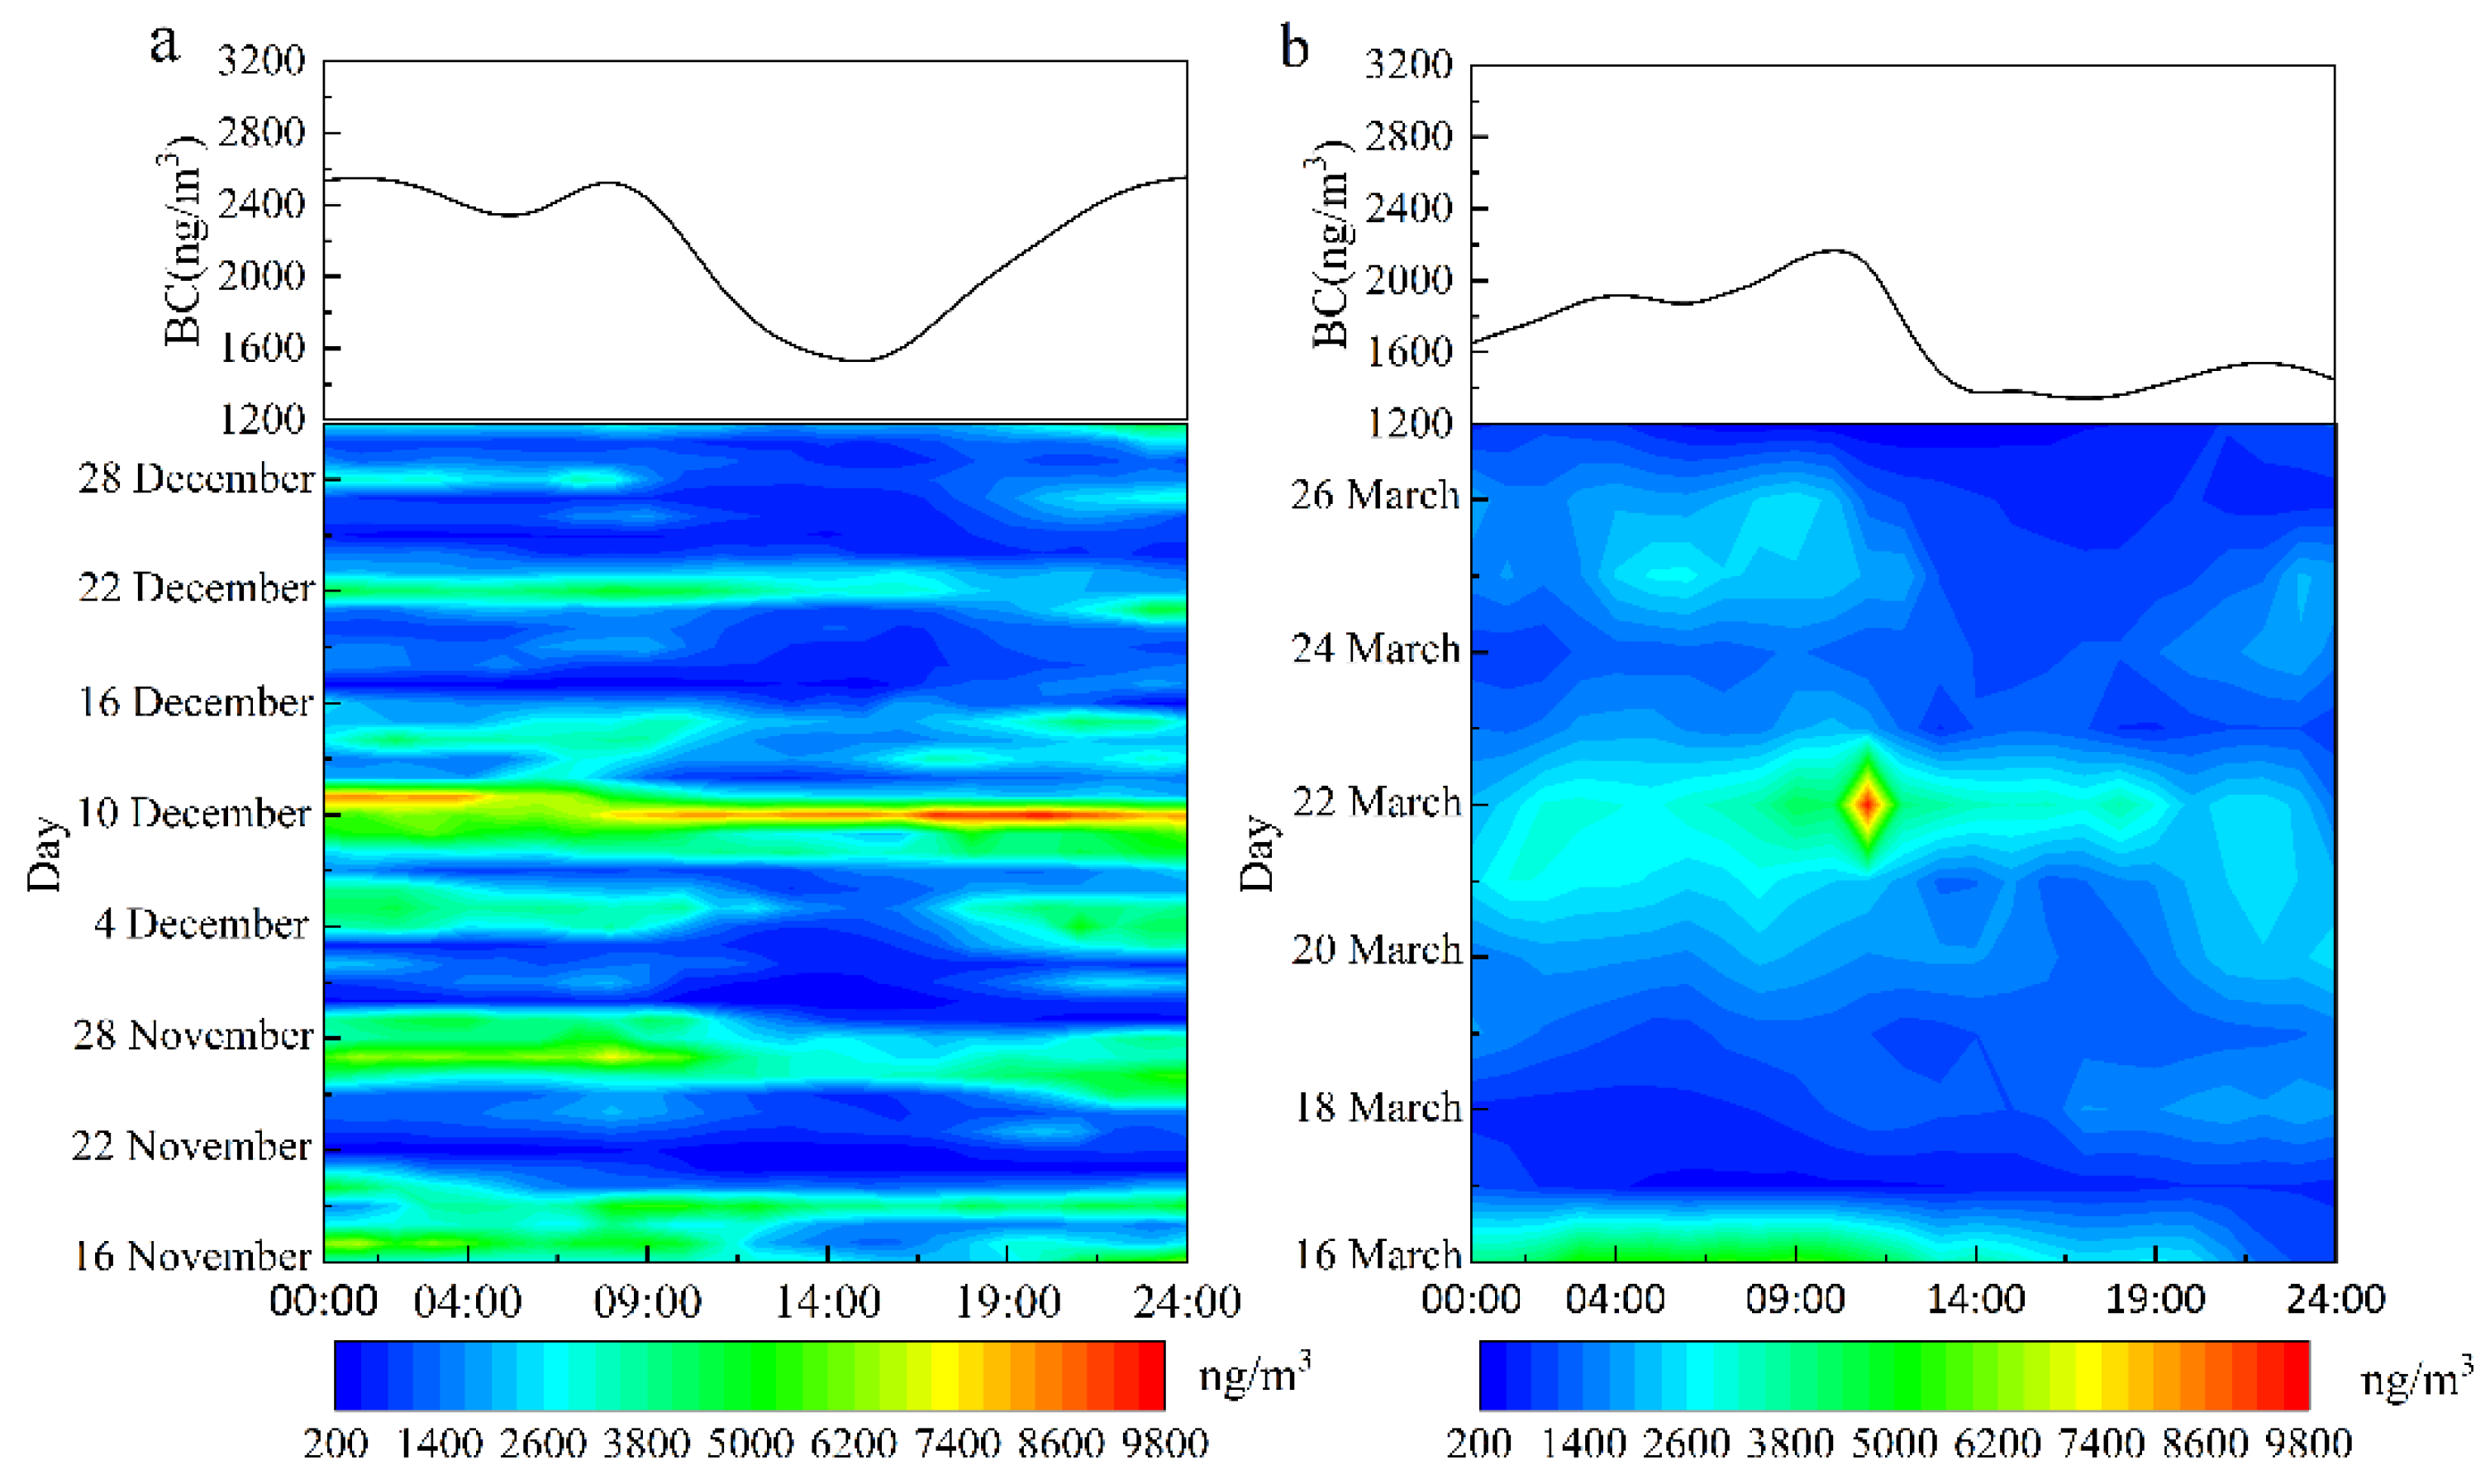
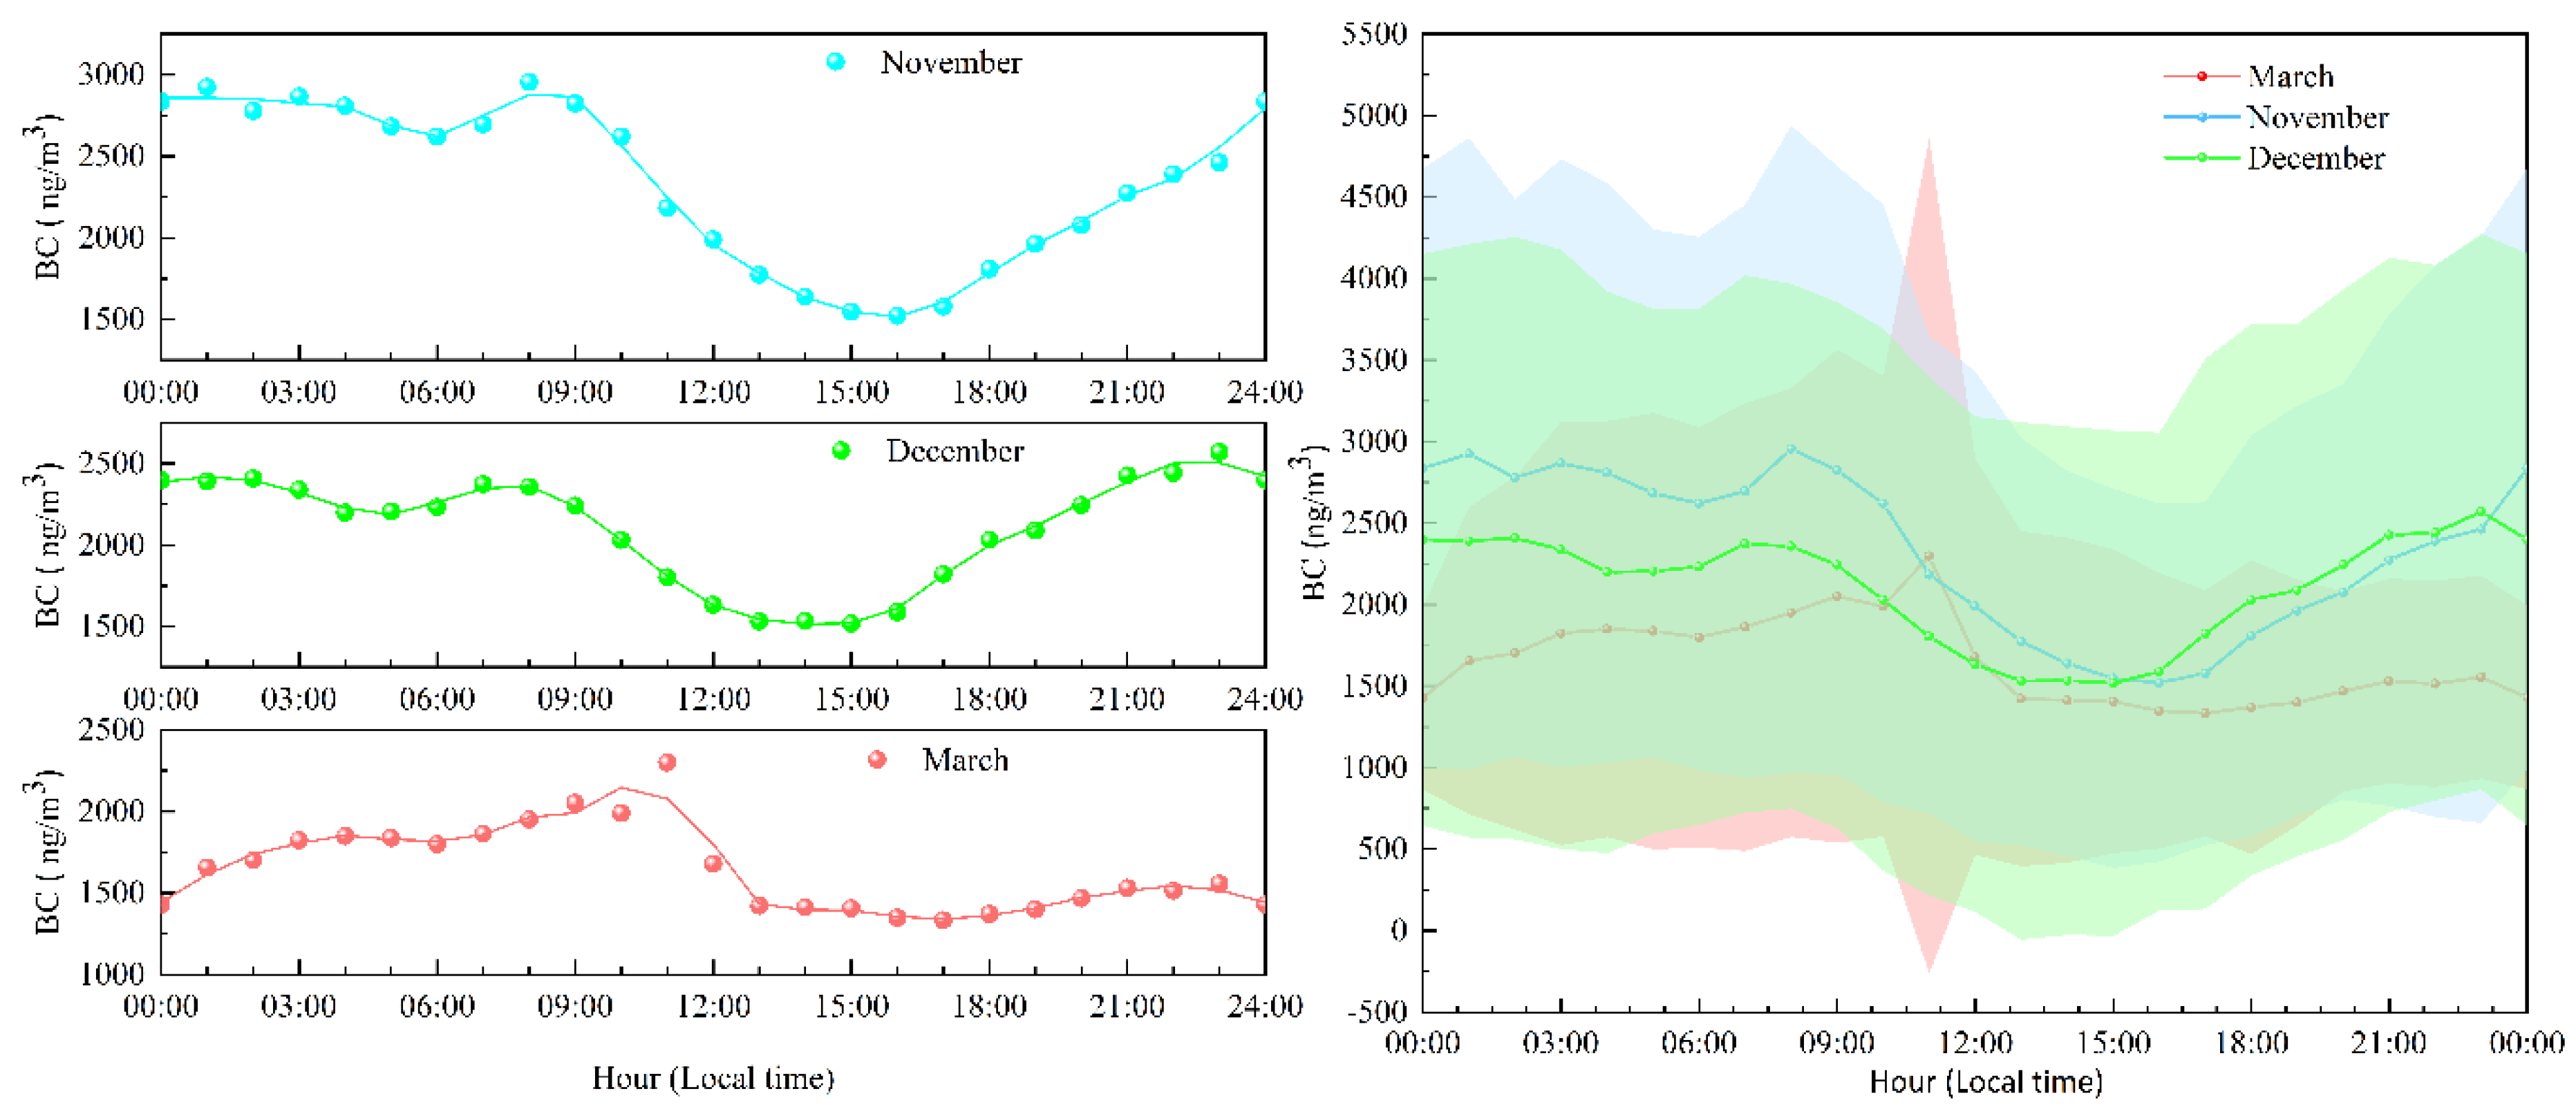
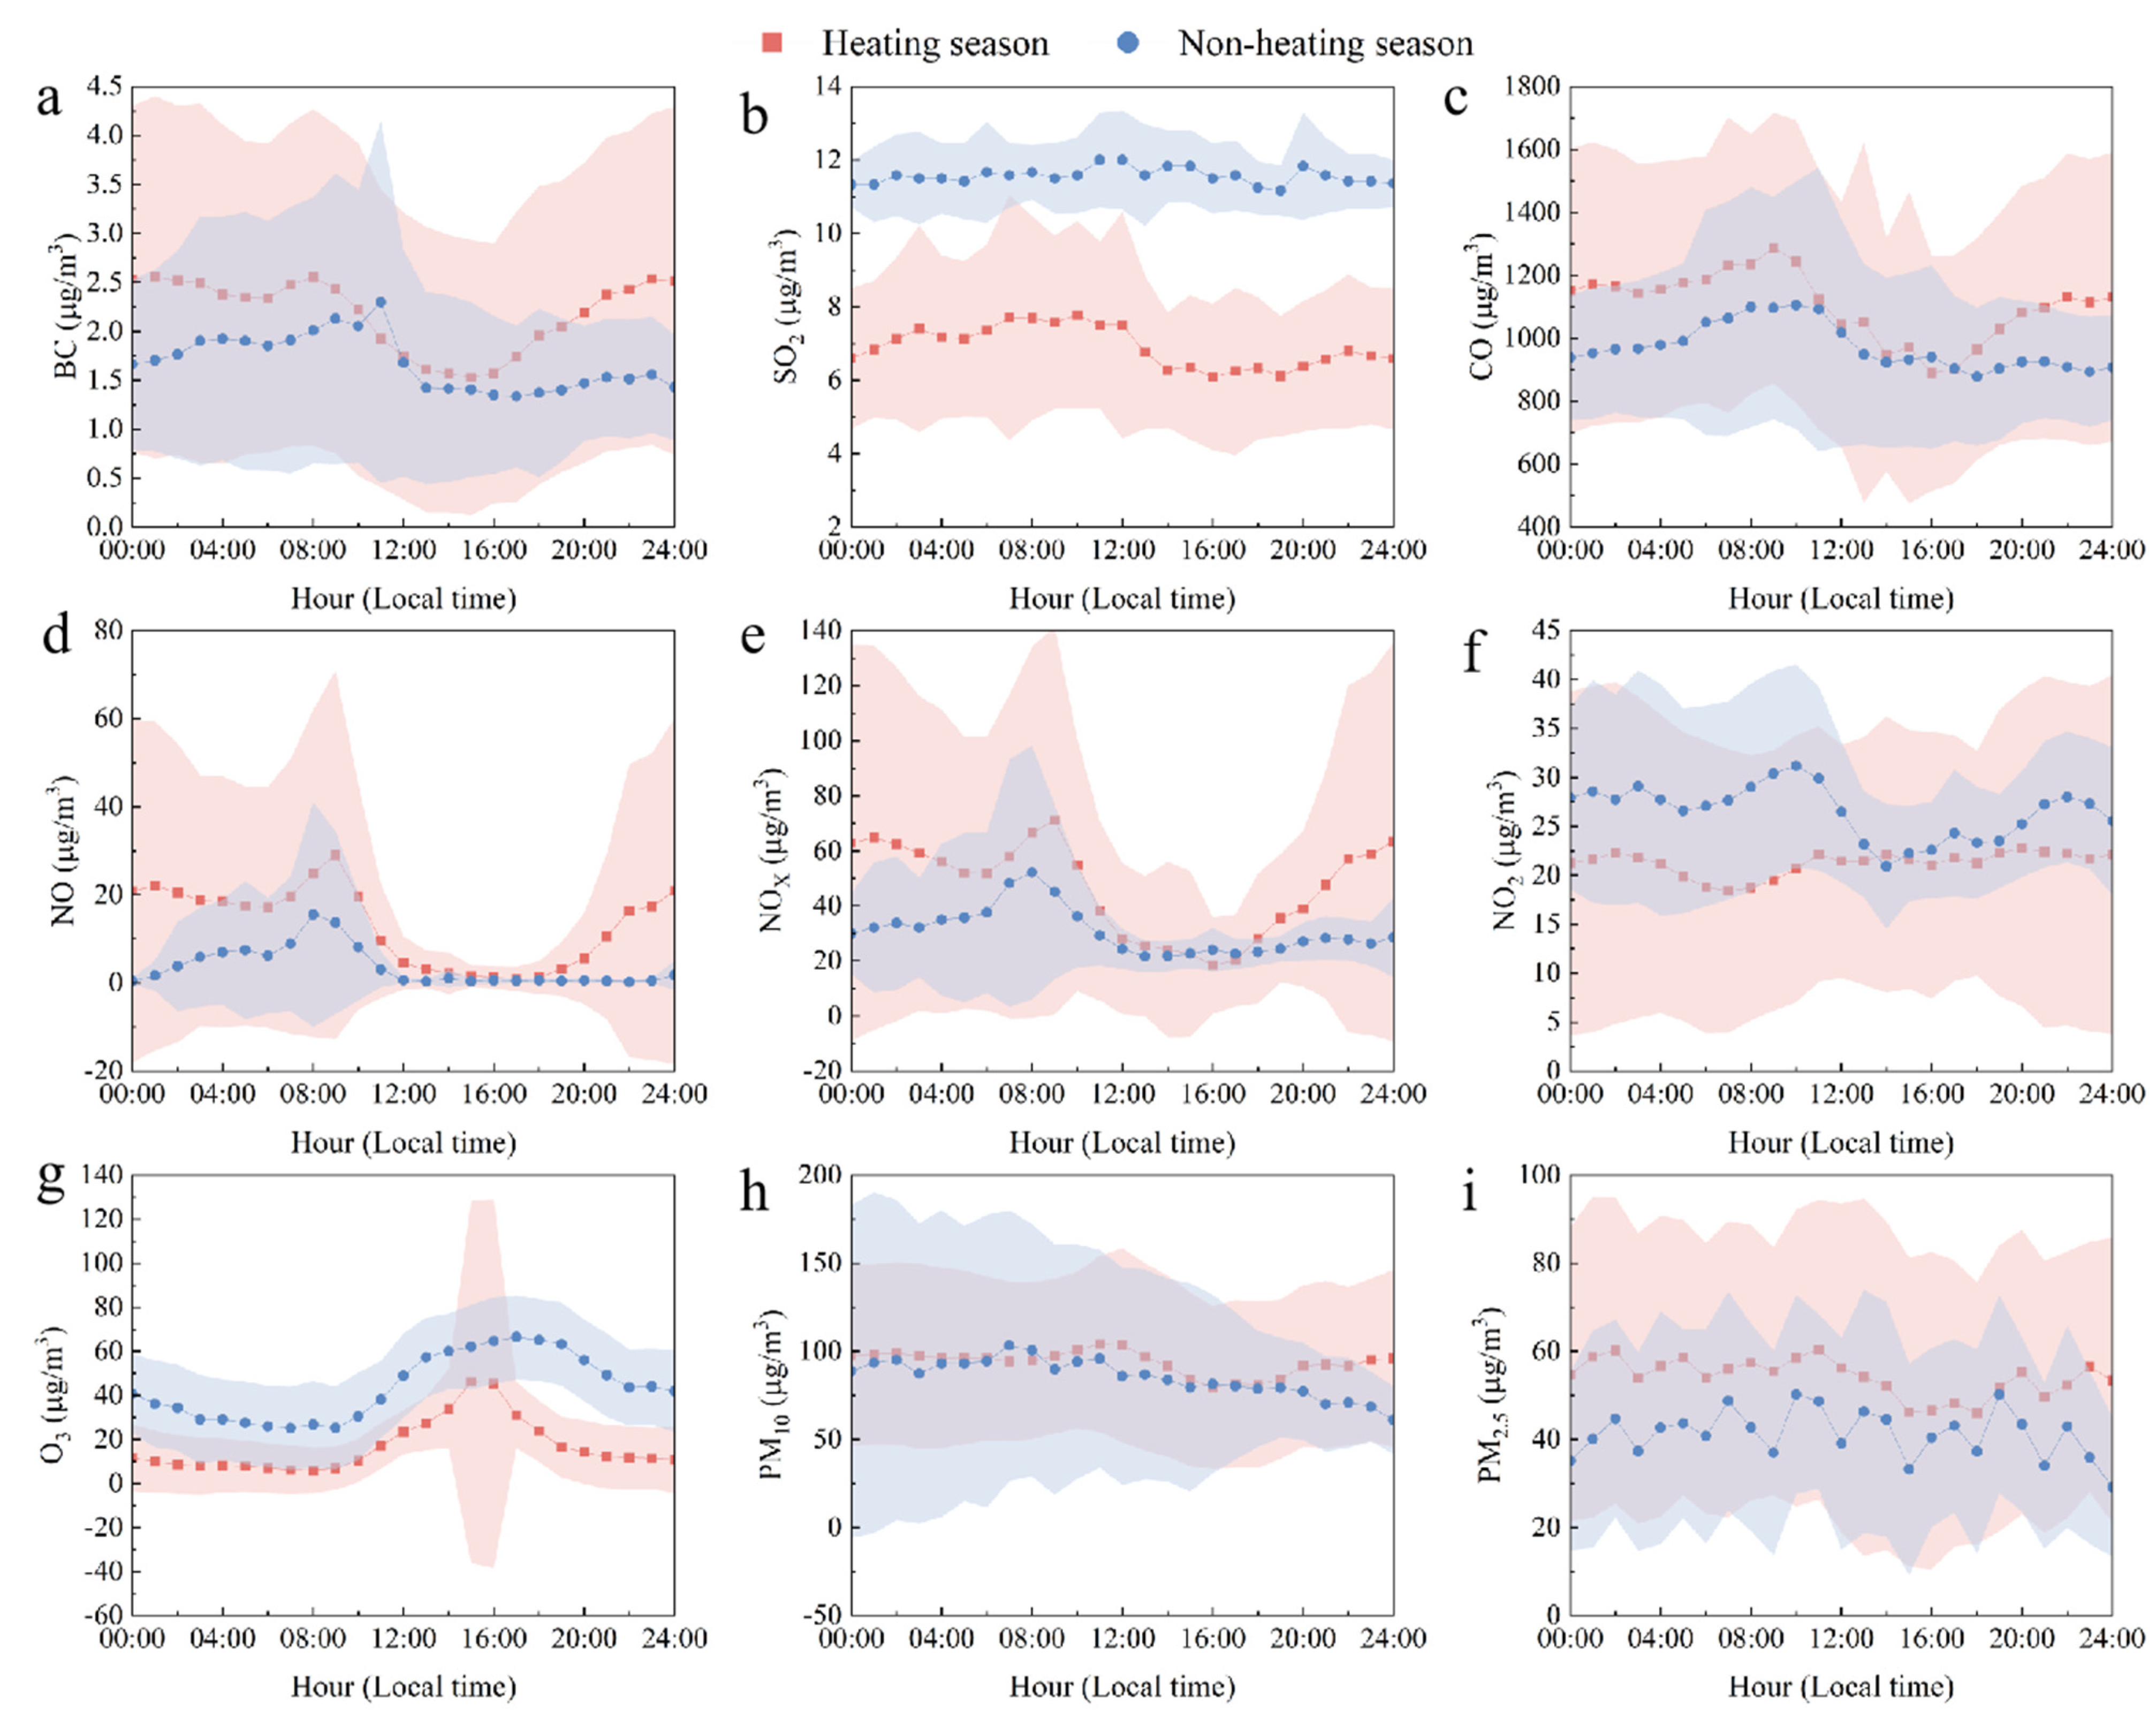
3.2. Diurnal Variations

The diurnal variation in BC roughly reflected the emission time of the source and the change in the atmospheric boundary layer (ABL). Figure 4 showed the diurnal variations of hourly mean concentrations of BC in Zhengzhou.
The concentrations of BC at the sampling site during the heating season (November and December) showed a “bimodal” distribution, which kept good consistency in many cities in northern China [2,34]. The morning peak value occurred between 7:00 and 9:00 a.m., which was mainly due to the heavy traffic and increased motor vehicle emissions (analyzed in detail in Section 3.3). In addition, near sunrise time, the stable boundary layer structure at night has not been completely destroyed and the atmospheric vertical dispersion conditions are relatively poor. Inferior atmospheric dispersion conditions led to the accumulation of BC, resulting in high concentrations. After 3:00 p.m., BC concentrations continued to rise, which was mainly caused by the increased use of electric heating equipment in the evening and the increased traffic volume. The second peak was at 00:00–2:00 a.m., which was mainly due to the implementation of the truck restriction policy in Zhengzhou. The policy regulated that diesel vehicles can only pass from 0:00 to 6:00 a.m., which resulted in emissions. The reduced height of the ABL at night also led to higher BC concentrations. The valley value occurred from 14:00 to 17:00, primarily attributed to the reduction in BC emissions from reduced traffic and other anthropogenic activities. The rise in the ABL in the afternoon was also conducive to the reduction in BC concentrations.
During the non-heating season (March), BC concentrations at the sampling site showed a “unimodal” distribution, and the peak occurred from 11:00 a.m. to 12:00 noon. This finding is different from the conclusion reached by Fang, C. et al. in Jilin [34]. It was speculated that a low background value in BC in the non-heating season increased the impact of concentrated cooking at noon more prominently (dense schools and cafeterias around the sampling site). The valley occurs from 16:00 to 17:00, similar to the heating season.

3.3. Explanation of BC Sources

In this study, the α-values at the sampling site ranged from 1.09 to 1.94, with a mean value of 1.50 ± 0.13 in the heating season, and those for the non-heating season were from 1.05 to 1.93, with a mean value of 1.31 ± 0.19. Day et al. [35] indicated that the α-values measured at distinct wavelengths were concentrated within the range of 0.8 to 2.2. According to traffic or diesel soot studies, an α-value closer to 1 indicated that BC was mainly derived from traffic exhaust emissions. Conversely, an α-value close to 2 indicated that BC was mainly derived from coal and biomass combustion [36,37]. Figure 5 shows the frequency of distribution of α-values during the heating and non-heating seasons. Based on the variation in α-values, the mean values, and Figure 5, the variation in BC was relatively large in both the heating and non-heating seasons. In addition, coal and biomass combustion sources accounted for a larger share in the heating season, while mobile emission sources occupied a larger share of the non-heating season. The α-value is closer to 2 in the heating season; it was assumed that BC in the heating season was mainly influenced by coal combustion [36,37]. In addition, residential areas and schools, etc., around the site could also account for the increase in α-values. In turn, in the non-heating season BC was more influenced by mobile sources. Compared to rural areas in Henan [38], the BC values in this study were higher during the heating season, indicating that cities have more robust heating systems than rural areas. BC in Beijing [2], Tianjin, and Hebei also presented the same trend in source variation as this study [39].
Figure 6 illustrates the daily average change in α-values between the heating and non-heating seasons. As shown in Figure 6, two distinct high values could be seen in the average daily trend in α-values in both the heating and non-heating seasons. In the heating season, it showed the first high value at 4:00–5:00 a.m. and the second high value at 19:00–20:00 p.m. In turn, the high values in the non-heating season occurred at 5:00–6:00 a.m. and 17:00–18:00 p.m., respectively. The reason for the high α-value in the early hours of the morning was the low volume of traffic. Moreover, BC from fossil energy combustion was not easy to disperse because of the atmospheric inversion layer deposited near the surface. In the early morning, high α-values occurred one hour later in the non-heating season than in the heating season, which was explained by the later sunrise in the non-heating season. At the same time, it supported the argument that the occurrence of high α-values in the morning was related to the height of the atmospheric inversion layer. The high α-value in the evening was presumed to be related to the residents’ cooking, while lower α-values compared to those in the morning were perhaps influenced by the increased traffic flow due to people leaving work. There was a significant drop in α-values from 7:00 to 9:00 a.m. in both heating and non-heating seasons, owing to the increase of the mobile sources caused by the morning rush hour of traffic flow. The decrease in α-values during 17:00–19:00 p.m. during the heating season could be attributed to the earlier darkness, which led to lower activity at night and earlier traffic peaks.

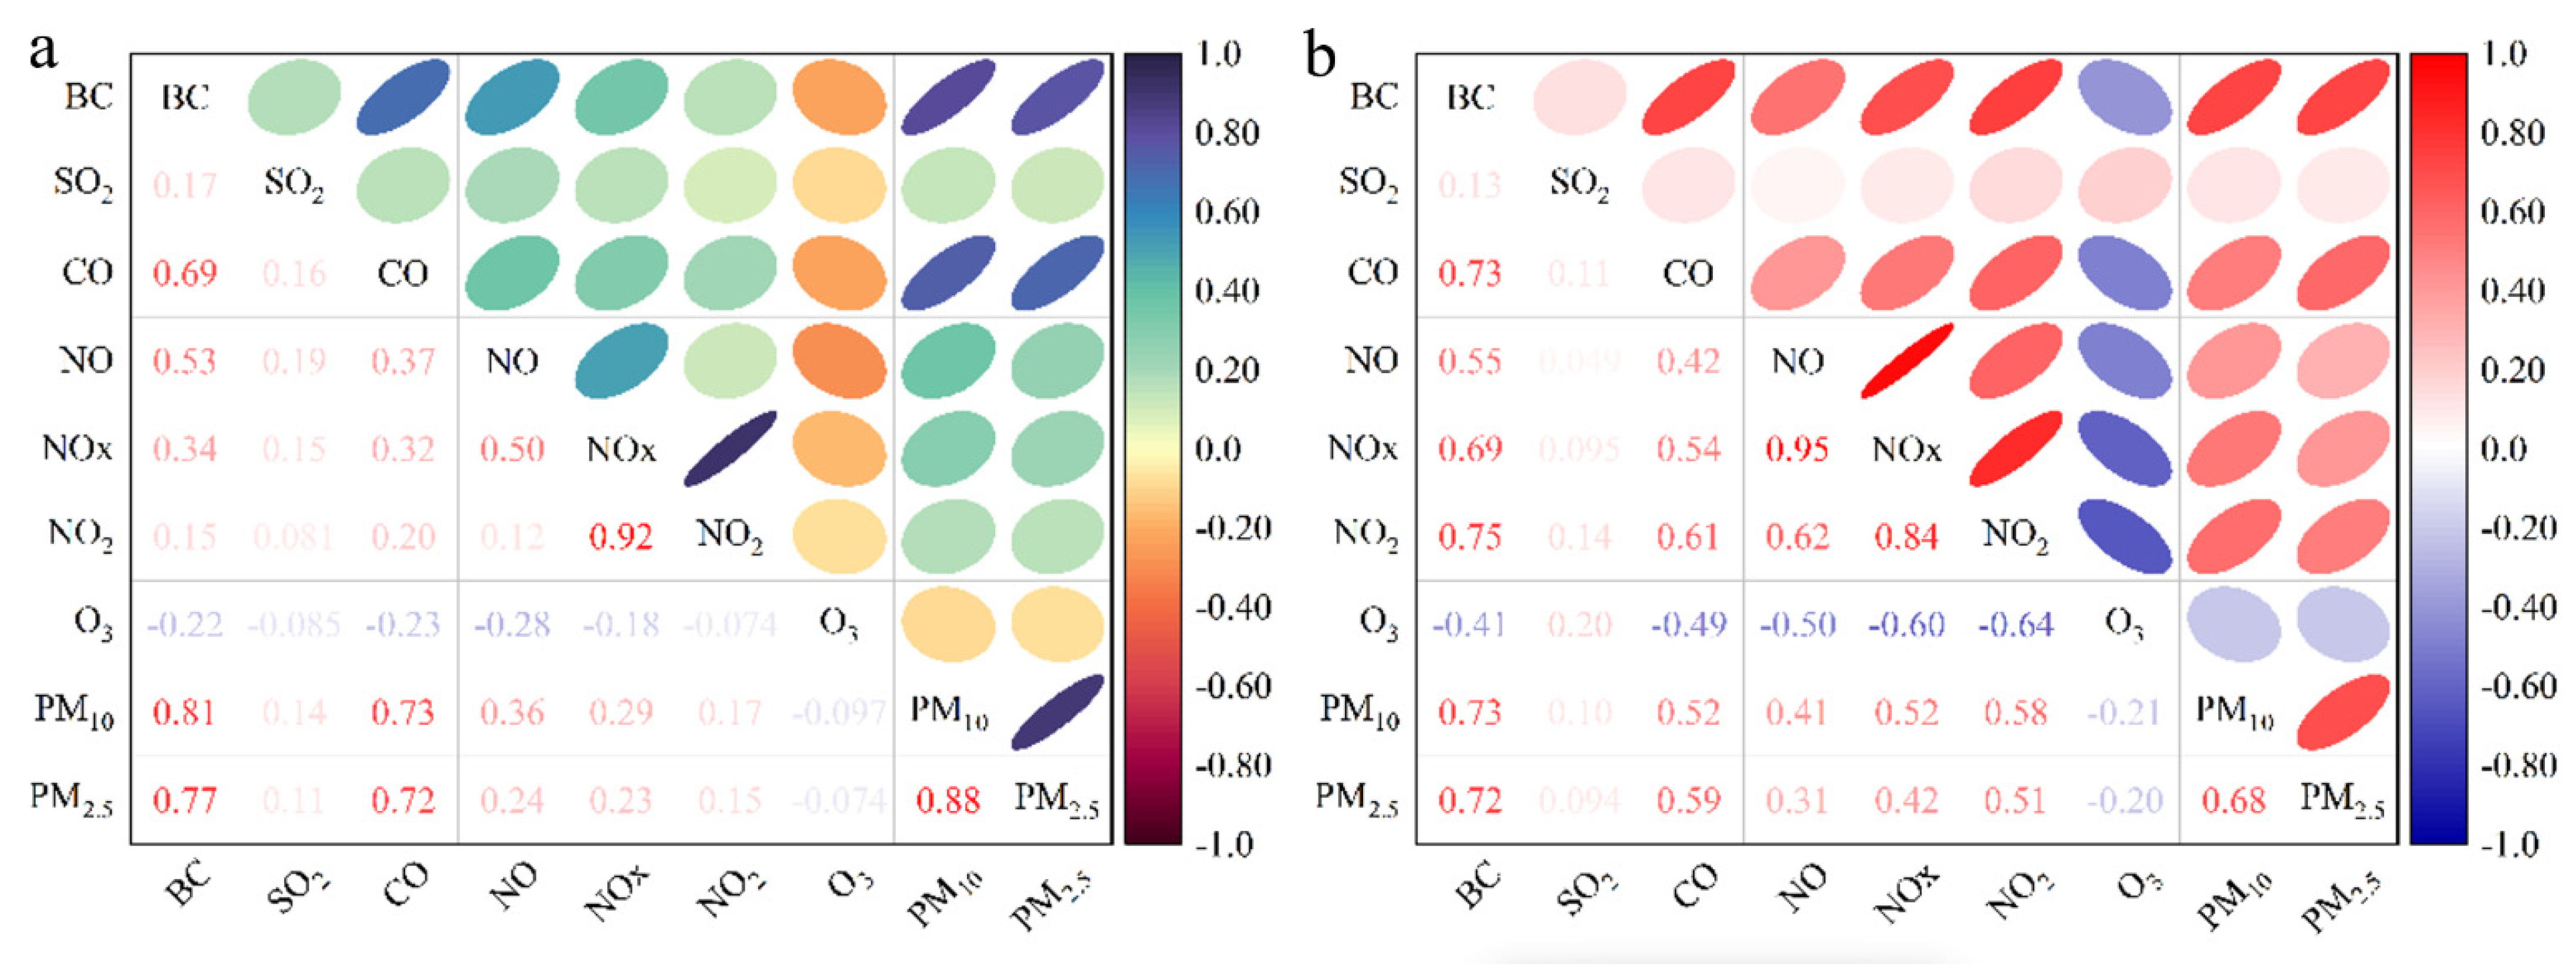
3.4. Correlation between BC and Common Pollutants in the Atmosphere

Figure 7 demonstrated the correlation analysis of SO2, CO, NO, NOX, NO2, O3, PM10, PM2.5, and BC for heating and non-heating seasons. BC concentrations showed a high positive correlation with the concentrations of CO, NO, PM10, PM2.5, and a certain negative correlation with the concentration of O3 in the heating season. While in the non-heating season, BC concentrations showed a strong positive correlation with the concentrations of NO2, CO, PM10, PM2.5, and a certain negative correlation with the concentration of O3. Moreover, the positive correlation between BC and NO2, NOX in the non-heating season has increased compared to the heating season, and the negative correlation between BC and O3 has also increased.
CO was primarily derived from the incomplete combustion of coal and gasoline [40]. In other words, it is influenced by both solid and liquid fuels. Therefore, the correlation between BC and CO remained high at 0.69 and 0.73, respectively, even though CO in the heating season and non-heating season may be derived from different sources. The majority of NO, NO2, and NOX originated from mobile emissions [41]. As can be seen from Figure 7, the correlation between NO remained at essentially the same level during the heating and non-heating seasons, with correlations of 0.53 and 0.55, respectively. However, the correlation between BC and NO2 was significantly higher in the non-heating season compared to the heating season. It could be explained by the fact that NO2 in the heating season came more from coal combustion, and NO2 in the non-heating season was more influenced by mobile emissions. The correlation between NO and NO2 also increased from 0.12 to 0.62, which can be interpreted that diesel vehicles have been required to use oxidation catalysts (DOC) and particulate matter traps (DPF) in recent years to facilitate the conversion of NO to NO2 at high temperatures. Furthermore, this also supported the finding that NO2 comes from different sources during the heating and non-heating seasons. One reason why the correlation between BC and NOX increased from 0.34 to 0.69 from the heating season to non-heating season was that BC was more affected by mobile emissions in the non-heating season.
Both PM10 and PM2.5 are composed of carbonaceous substances, water-soluble components, and inorganic elements. Due to the main components being identical, there is always a strong correlation between them. In addition, carbonaceous aerosols can reach even 20–30% of the PM2.5 mass concentration in urban areas of China [42], where the largest fraction is organic carbon (OC). In turn, BC accounts for a smaller percentage of the carbonaceous aerosol—about a few to a dozen percent [42]. The smallest is inorganic carbon (IC) [26,43]. Therefore, the correlation between BC and PM remained high in both the heating and non-heating seasons.
SO2 was primarily derived from gasoline and coal combustion. With China’s increasing efforts to protect the environment, the current sulfur content of gasoline is gradually transitioning from 150 ppm to 50 ppm, so the main sources collected in this study are industrial sources. As can be seen from Figure 7, the correlation between BC and SO2 has been at a low level. There were two explanations for this. One was that there were fewer industrial sources near the sampling site, and the other was that the treatment of industrial exhaust gases in China had been made more stringent and regulated in recent years. Furthermore, as solar radiation continues to increase, the height of the boundary layer rises. As a result, the atmospheric dispersion conditions were better, which was conducive to the reduction in the concentration of most air pollutants. As well, intense solar radiation promoted the formation of O3. Thus, O3 was inversely proportional to most pollutants, including BC.
Although, Figure 7 can present the correlation between BC and several common pollutants, it could not show specific changes in these pollutants. Therefore, Figure 8 was drawn to specifically present the link between BC and common pollutants.
Figure 8 presents the daily changes in hourly mean concentrations of SO2, CO, NO, NOX, NO2, O3, PM10, PM2.5, and BC during the heating and non-heating seasons. The overall daily trends in BC, CO, NO, and NOX were relatively similar, as can be seen in Figure 8, which also supported the view that BC was mainly influenced by mobile emissions and coal combustion. Early peaks were evident for both NO and NOX, and they were consistent with the peak concentration trend for BC, which demonstrated that the early peaks of BC are mainly caused by mobile emissions. In turn, NO2 showed a more distinct trend from NO and NOX. The hourly average concentrations of NO2 during the non-heating season were largely higher than during the heating season, which was associated with the sources of NO2.
There was a significant difference on the mean PM2.5 concentration in Zhengzhou during the heating and non-heating seasons, which were 54.12 ± 33.18 μg/m3 and 41.27 ± 22.46 μg/m3, respectively. Aslam et al. [44] have found that the average values of the total carbon concentration in Faisalabad were 119.16 ± 64.91 μg/m3 and 124.71 ± 64.38 μg/m3 for PM2.5 in the summer and winter seasons, respectively. No significant difference between the particulate concentration and weather parameters was observed in Faisalabad [44]. This finding differed from the current study. It was mainly due to the high overall particulate matter concentration caused by the abundance of industrial and anthropogenic sources in Faisalabad, which weakened the seasonal differences. Although the correlation between PM10 and PM2.5 has been maintained at a high level with BC, there were no obvious similarities from Figure 8. Meanwhile, it was difficult to analyze BC directly through the daily trends because BC was just one of the many particulate matters of PM10 and PM2.5.

3.5. Analysis of the Correlation between BC and Meteorological Conditions

Figure 9 indicated the correlation analysis of wind speed (WS), rainfall capacity (RC), pressure (P), air temperature (T), relative humidity (RH), and BC for the heating and non-heating seasons. According to Figure 9, BC had a strong negative correlation with WS and a strong positive correlation with RH in both the heating and non-heating seasons, while correlations between RC, P, T, and BC were weak.
Wind is one of the most significant meteorological factors affecting the dispersion and transport of air masses. With higher WS, there would be a higher dispersion of BC in the atmosphere and a greater range of BC concentrations. BC may influence climate through a surface-darkening effect [45], whereby BC absorbs more solar radiation and reduces the amount of radiation reaching the surface. It affected the formation process of cloud and rain, which may enhance stability by inhibiting convection by increasing cloud longevity, thus affecting atmospheric circulation and water vapor in the atmosphere. BC led to warming of the air, which was likely to increase the water vapor [46]; i.e., an increase in RH.
Rainfall plays an essential role in the wet removal of atmospheric particulate matter. Babu et al. [47] observed a negative correlation of −0.74 between monthly mean BC concentrations and RC in the coastal region of India, indicating that RC was one of the key factors influencing BC concentrations. Nevertheless, as this observation was made during the dry season with little rainfall, the relationship between BC concentration and RC could not be directly visualized, and the relationship between them needs to be further investigated.

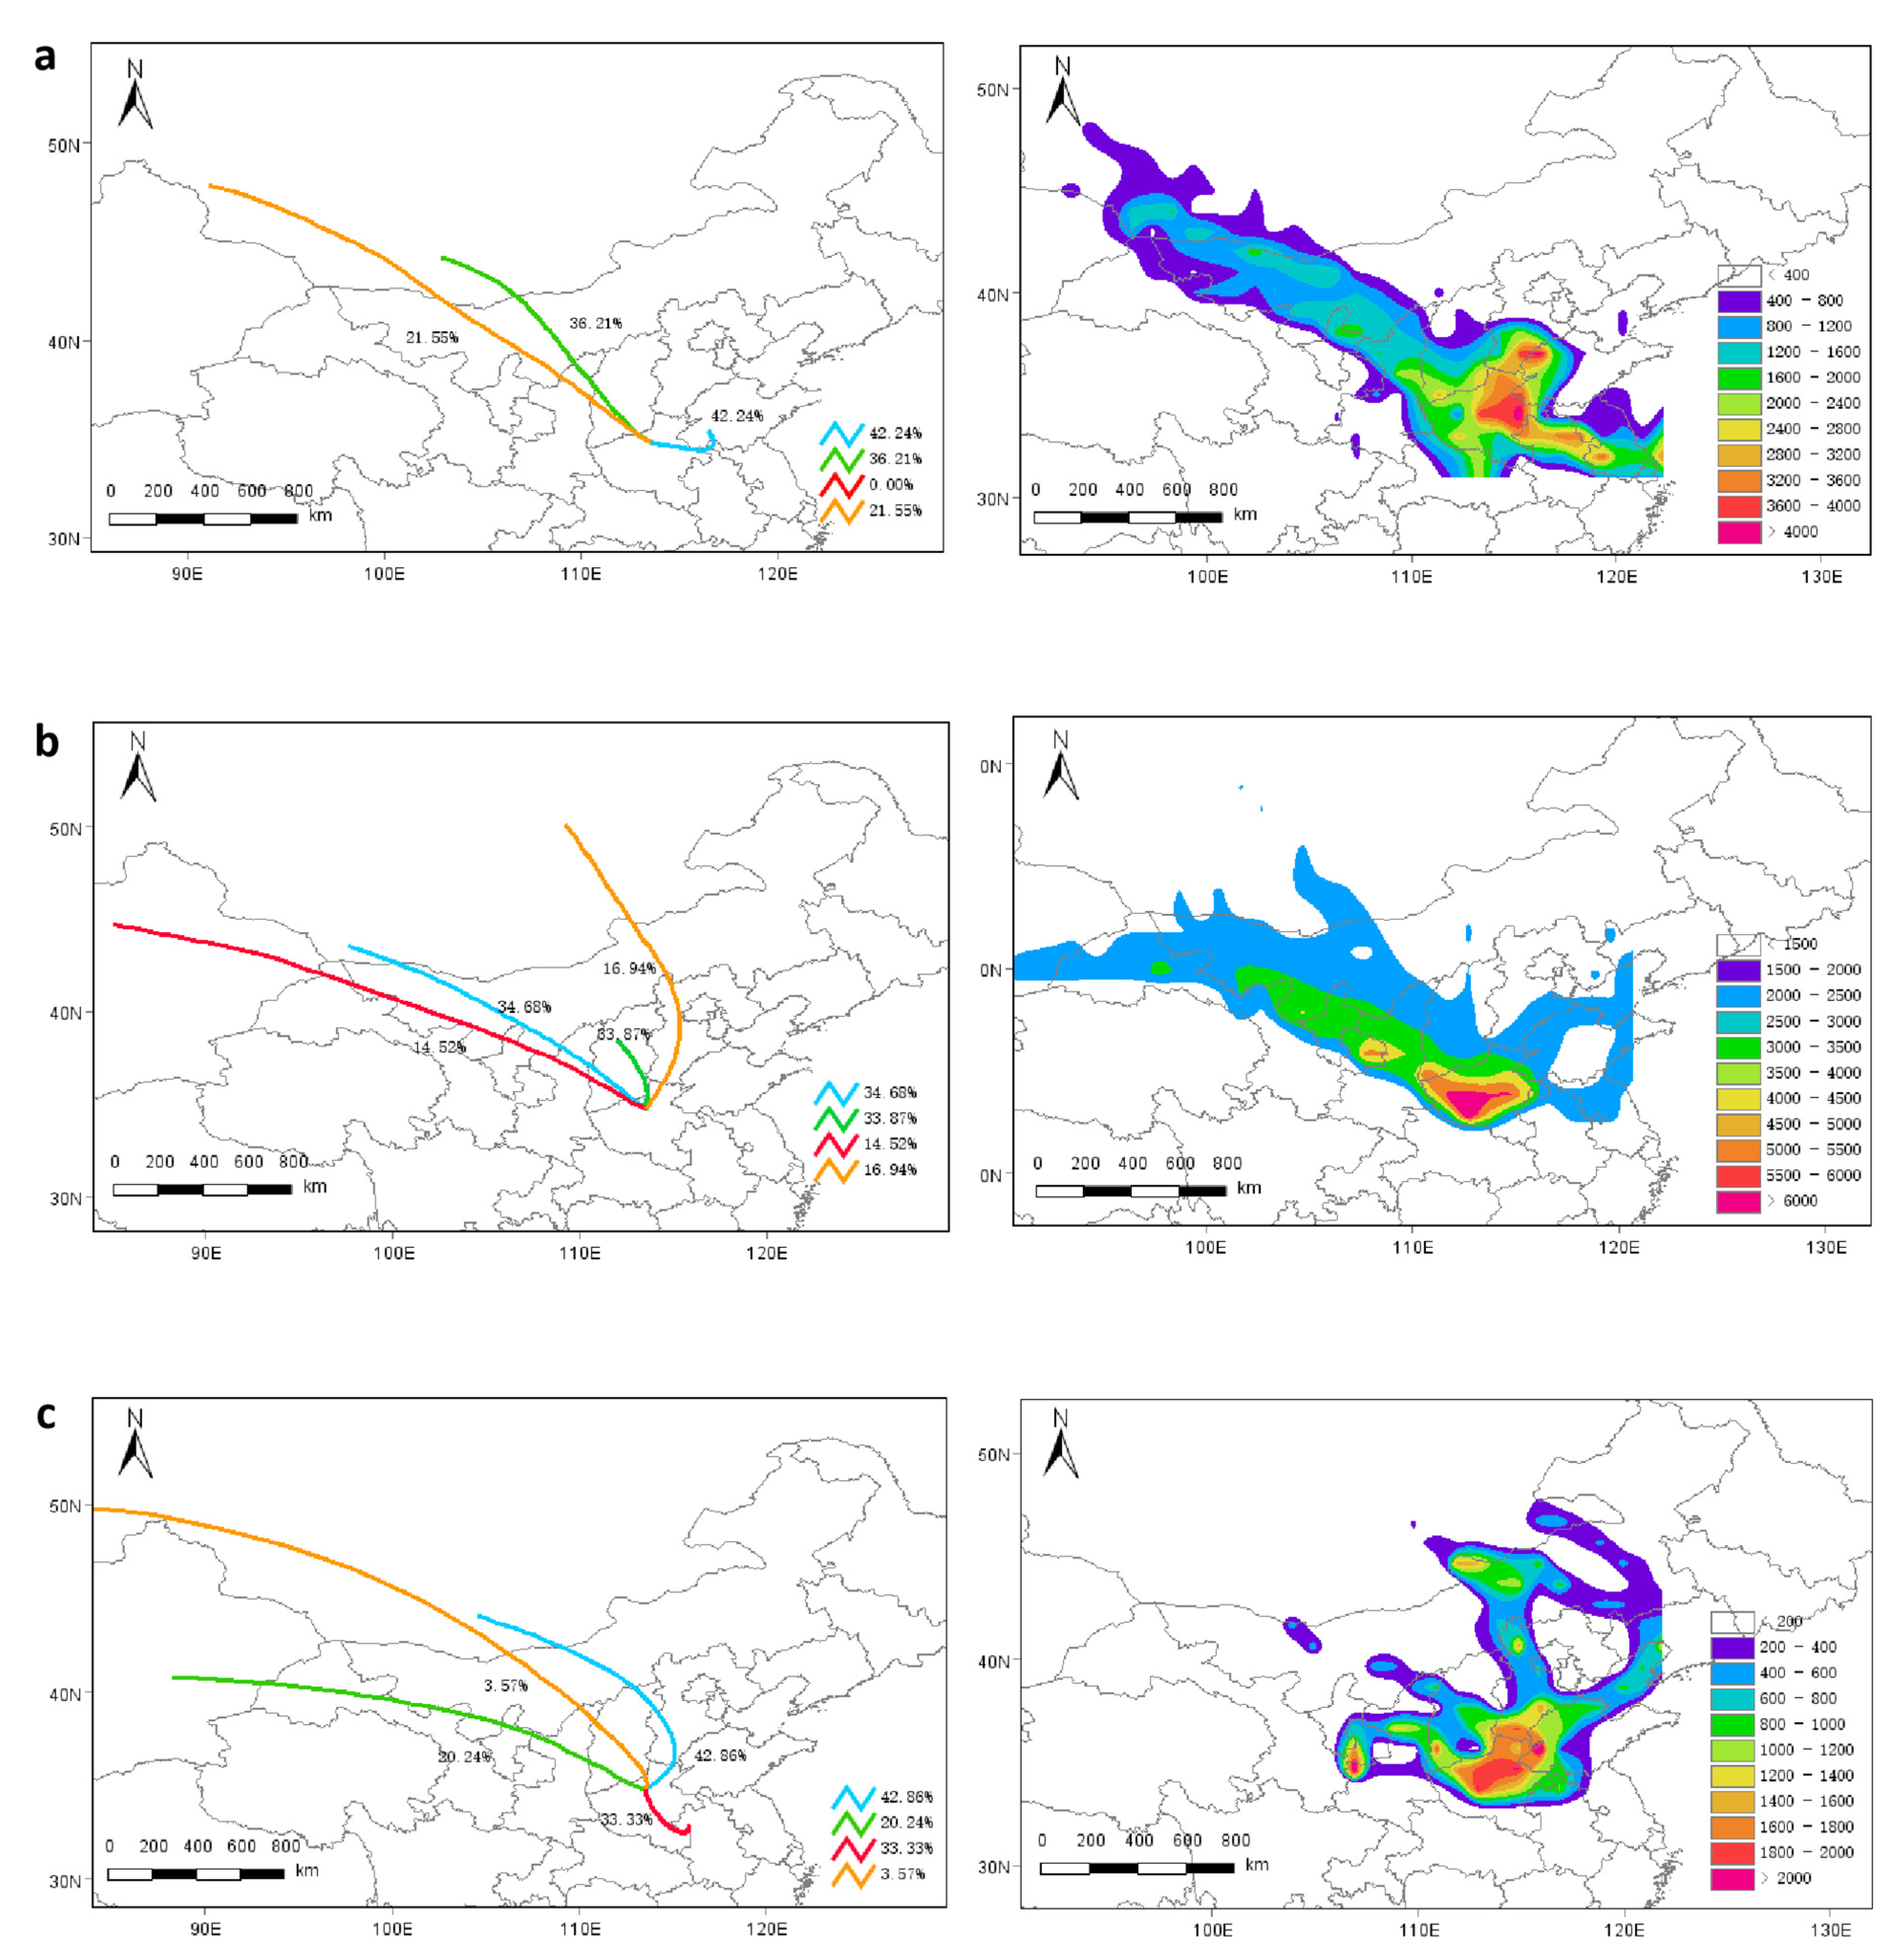
3.6. Back-Trajectory Cluster Analyses and Concentration Weighted Trajectory (CWT)

To investigate the effect of long-range transport of air mass on BC concentrations in Zhengzhou, this study used the angle–distance algorithm provided by TrajStat to cluster the 48 h backward trajectories of air mass moving at 700 m altitudes in each month. Then concentration weighted trajectory (CWT) analysis was performed in conjunction with the data of the BC concentrations at the sampling site [27,31].
The results of the back-trajectory cluster analyses and CWT are shown in Figure 10. The air masses from the eastern part of Henan Province accounted for the highest proportion in November (42.24%), followed by two trajectories from Shanxi and Shaanxi. In December, it was found that the trajectory with the most significant proportion was from Inner Mongolia to Shanxi, accounting for 34.68%. The trajectory from Shanxi accounted for the second-largest proportion, reaching 33.87%, and the other two track clusters accounted for less. The air masses trajectory from Inner Mongolia to Hebei contributed the highest percentage in March (42.86%), followed by those from southern Henan (33.33%). The trajectory from Shanxi and Shanxi in the northwest contributed a smaller percentage of 20.24% and 3.57%, respectively. Variations in the contribution of air masses in different regions led to differences in the potential geographical origin of BC.
The potential source area of BC was radiated, with Henan as the center. During the heating season, the potential source area was distributed with a long and narrow spatial range. The concentrations of BC at the sampling site were mainly influenced by the northwestern region of China and the eastern region of Henan Province. While, in the non-heating season, the distribution of potential source areas differed greatly from that in the heating season, mainly in the northeastern region of China and the southern Henan Province. The distribution of potential source areas was directly related to the long-range transport trajectories of the air masses during the sampling period. Thus, there are differences in potential source areas in various studies [2,34].

4. Conclusions

Through the comparative analysis of BC characteristics in the heating and non-heating seasons, this study has clarified the extent of winter heating’s impact on BC. The correlations between BC, regulated air pollutants, and meteorological factors were analyzed. The back-trajectory cluster analyses and CWT analysis were also conducted to verify the potential BC sources. The main findings are as follows.
(1)
The average BC concentrations during the heating season were 1.32 times higher than those during the non-heating season in Zhengzhou. This result indicated that centralized urban heating in winter increased the BC concentration. Therefore, it is recommended to optimize the energy structure and promote clean transformation for winter heating to decrease urban BC concentration. Moreover, the daily variation in BC concentration during the heating season was bimodal, and that for the non-heating season was unimodal.
(2)
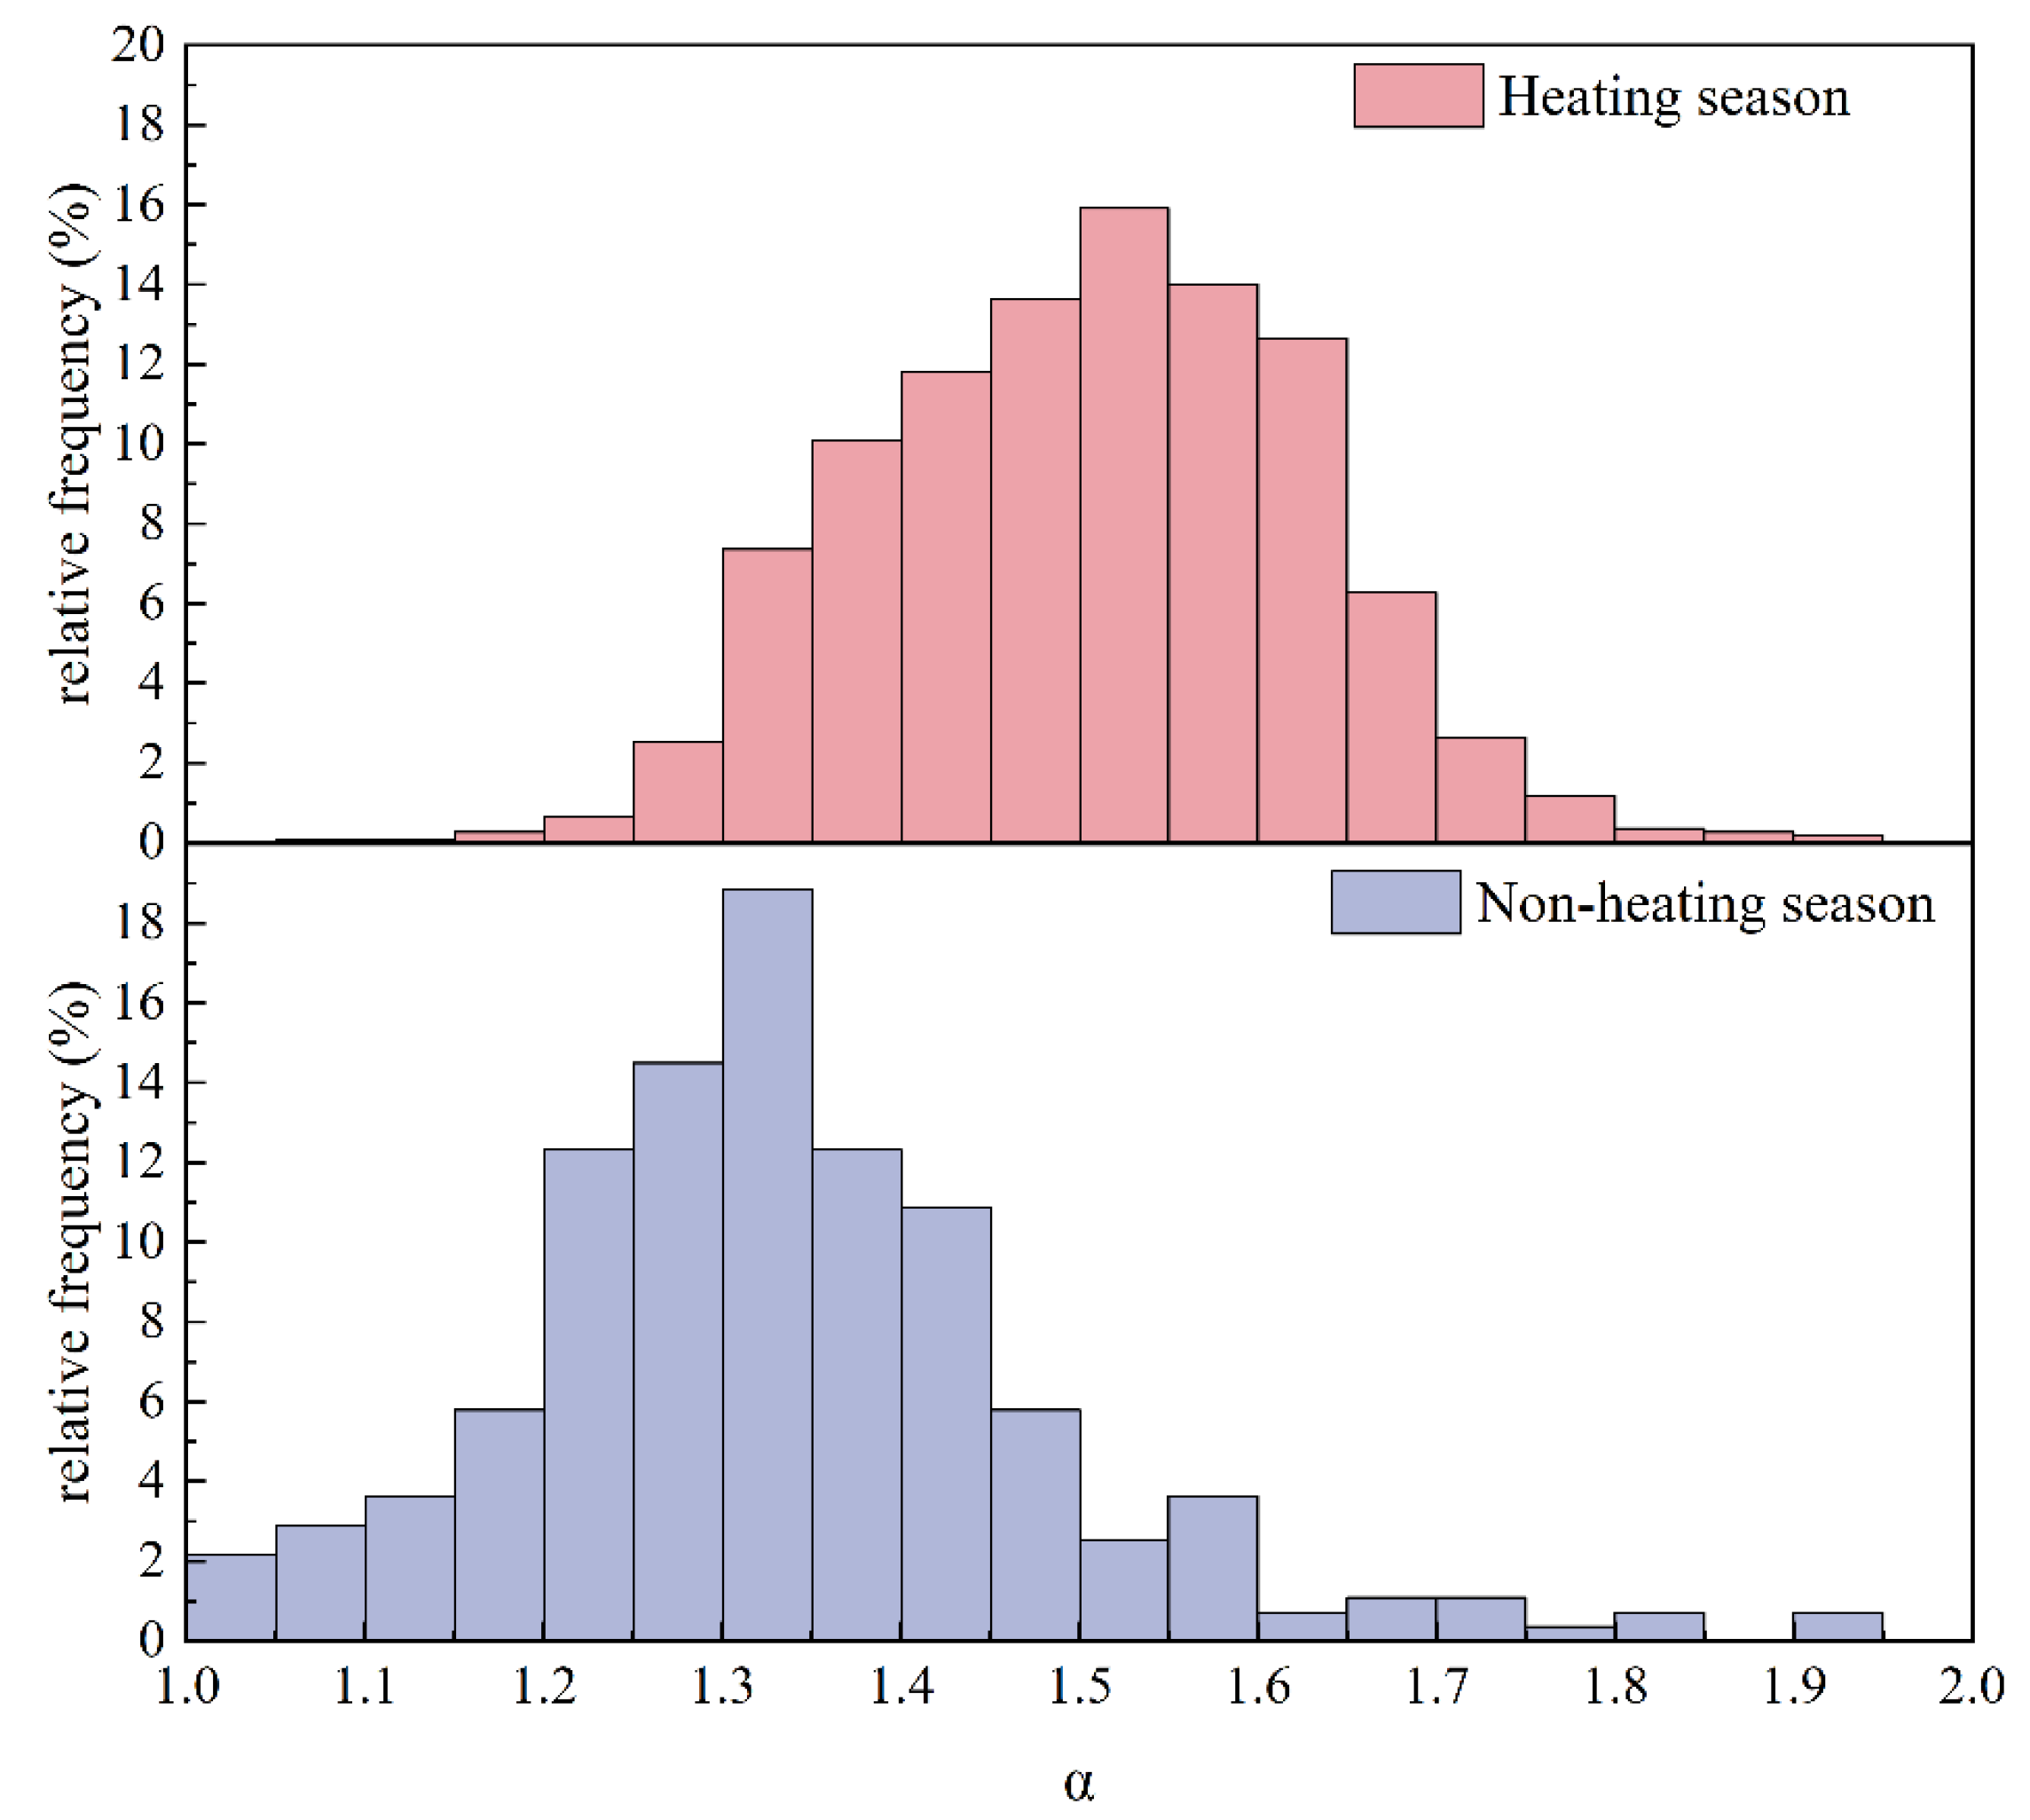
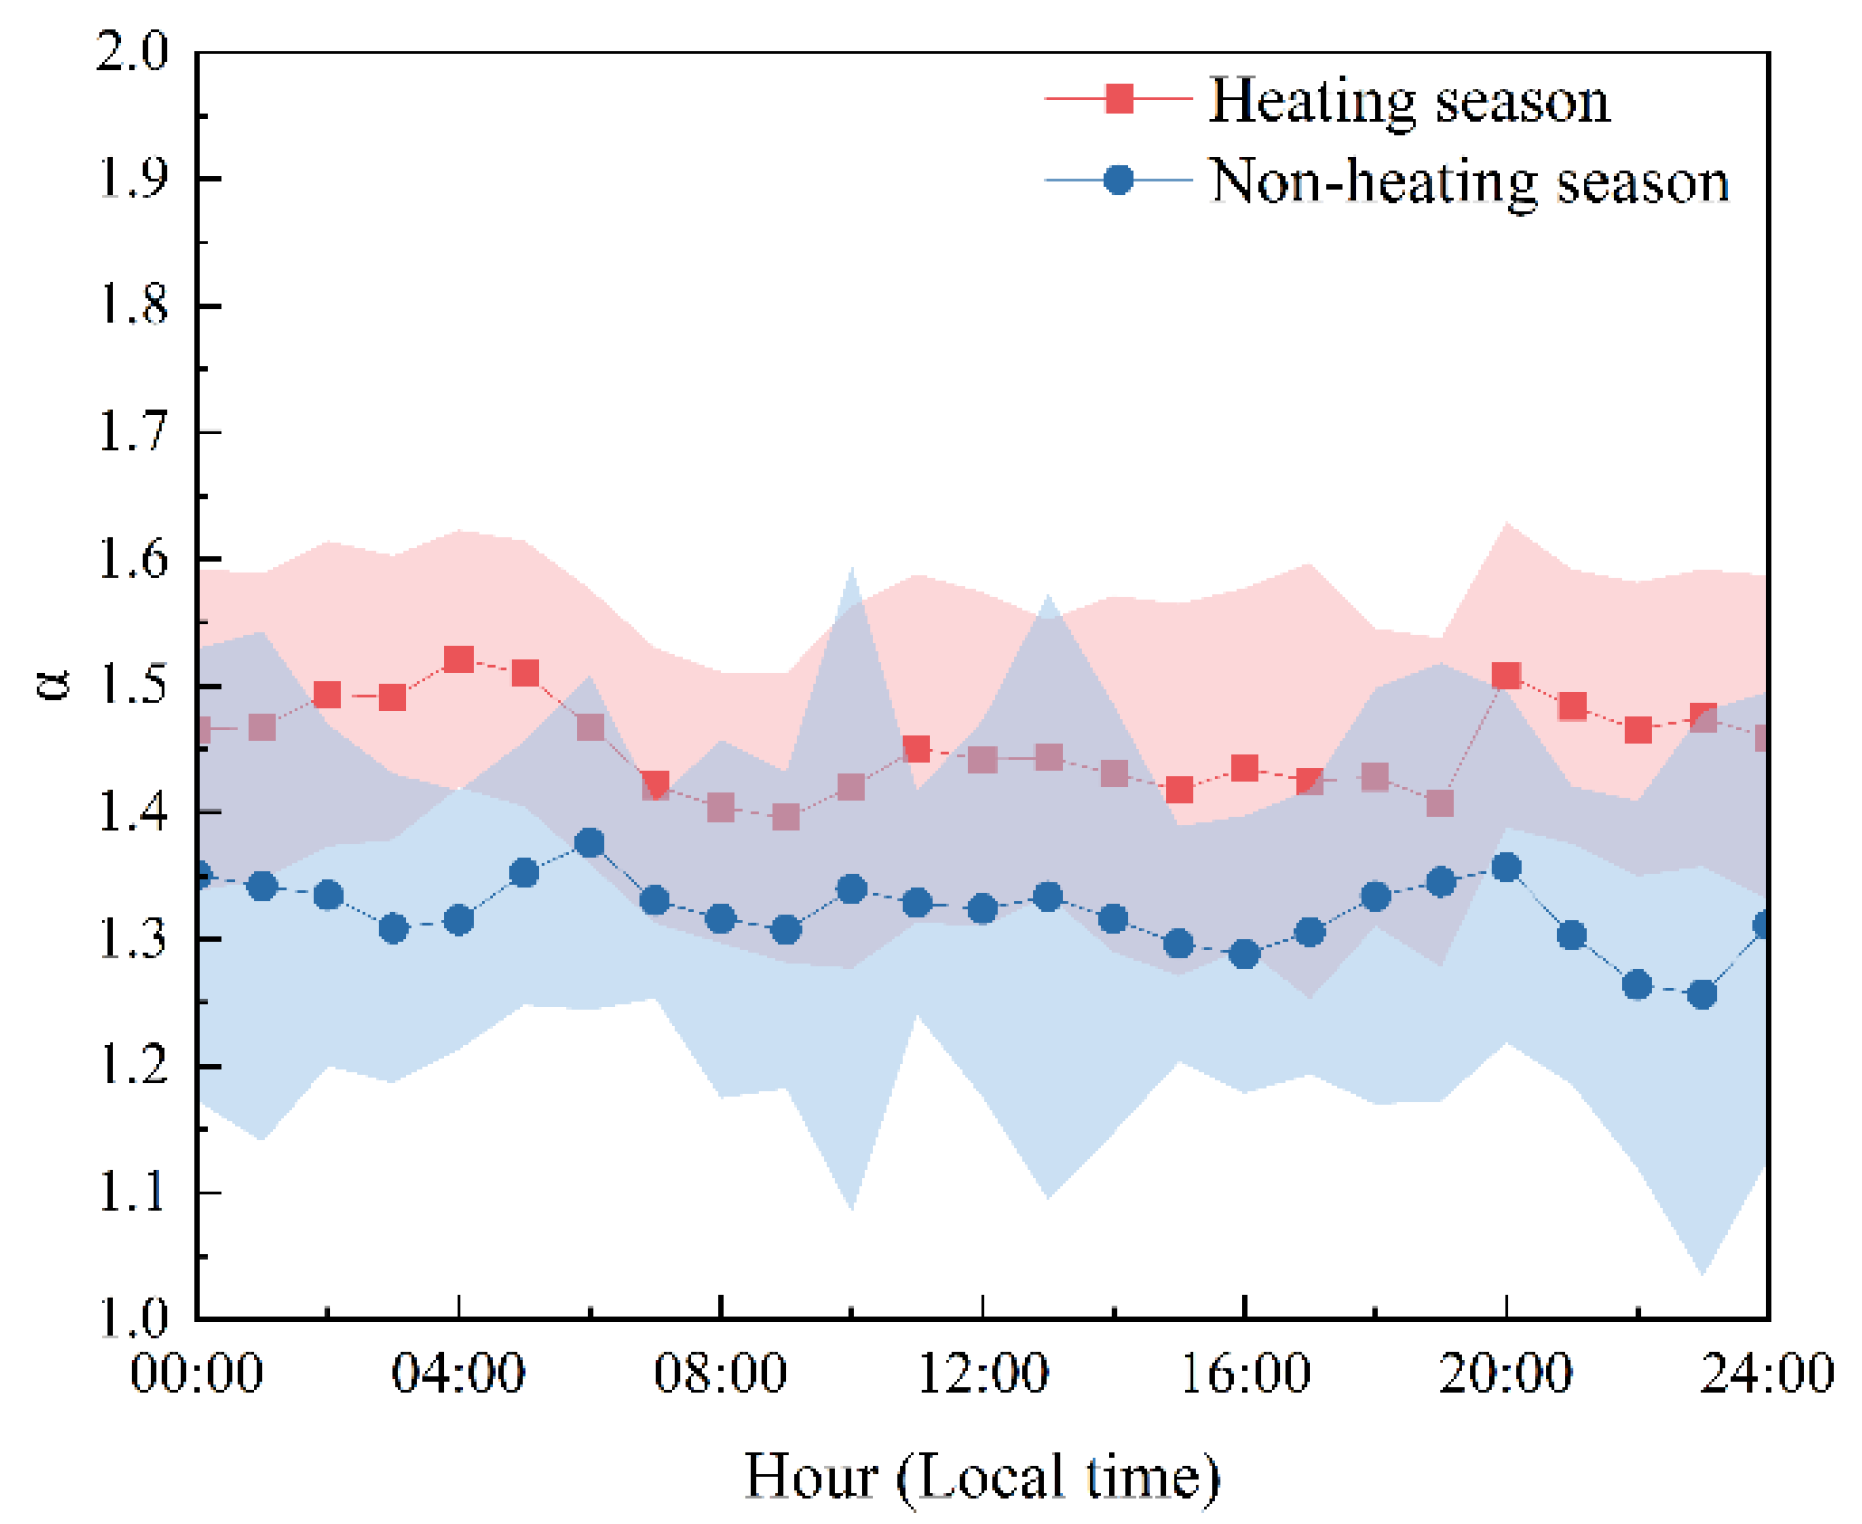
The α-values of the heating season ranged from 1.09 to 1.94, with an average value of 1.50 ± 0.13, and those in the non-heating season ranged from 1.05 to 1.93, with a mean value of 1.31 ± 0.19. This study focused on the comparison of α-values between the heating and non-heating seasons. The result indicated that biomass and coal combustion contributed more to the atmospheric BC in the heating season, while vehicle emissions contributed more in the non-heating season.
(3)
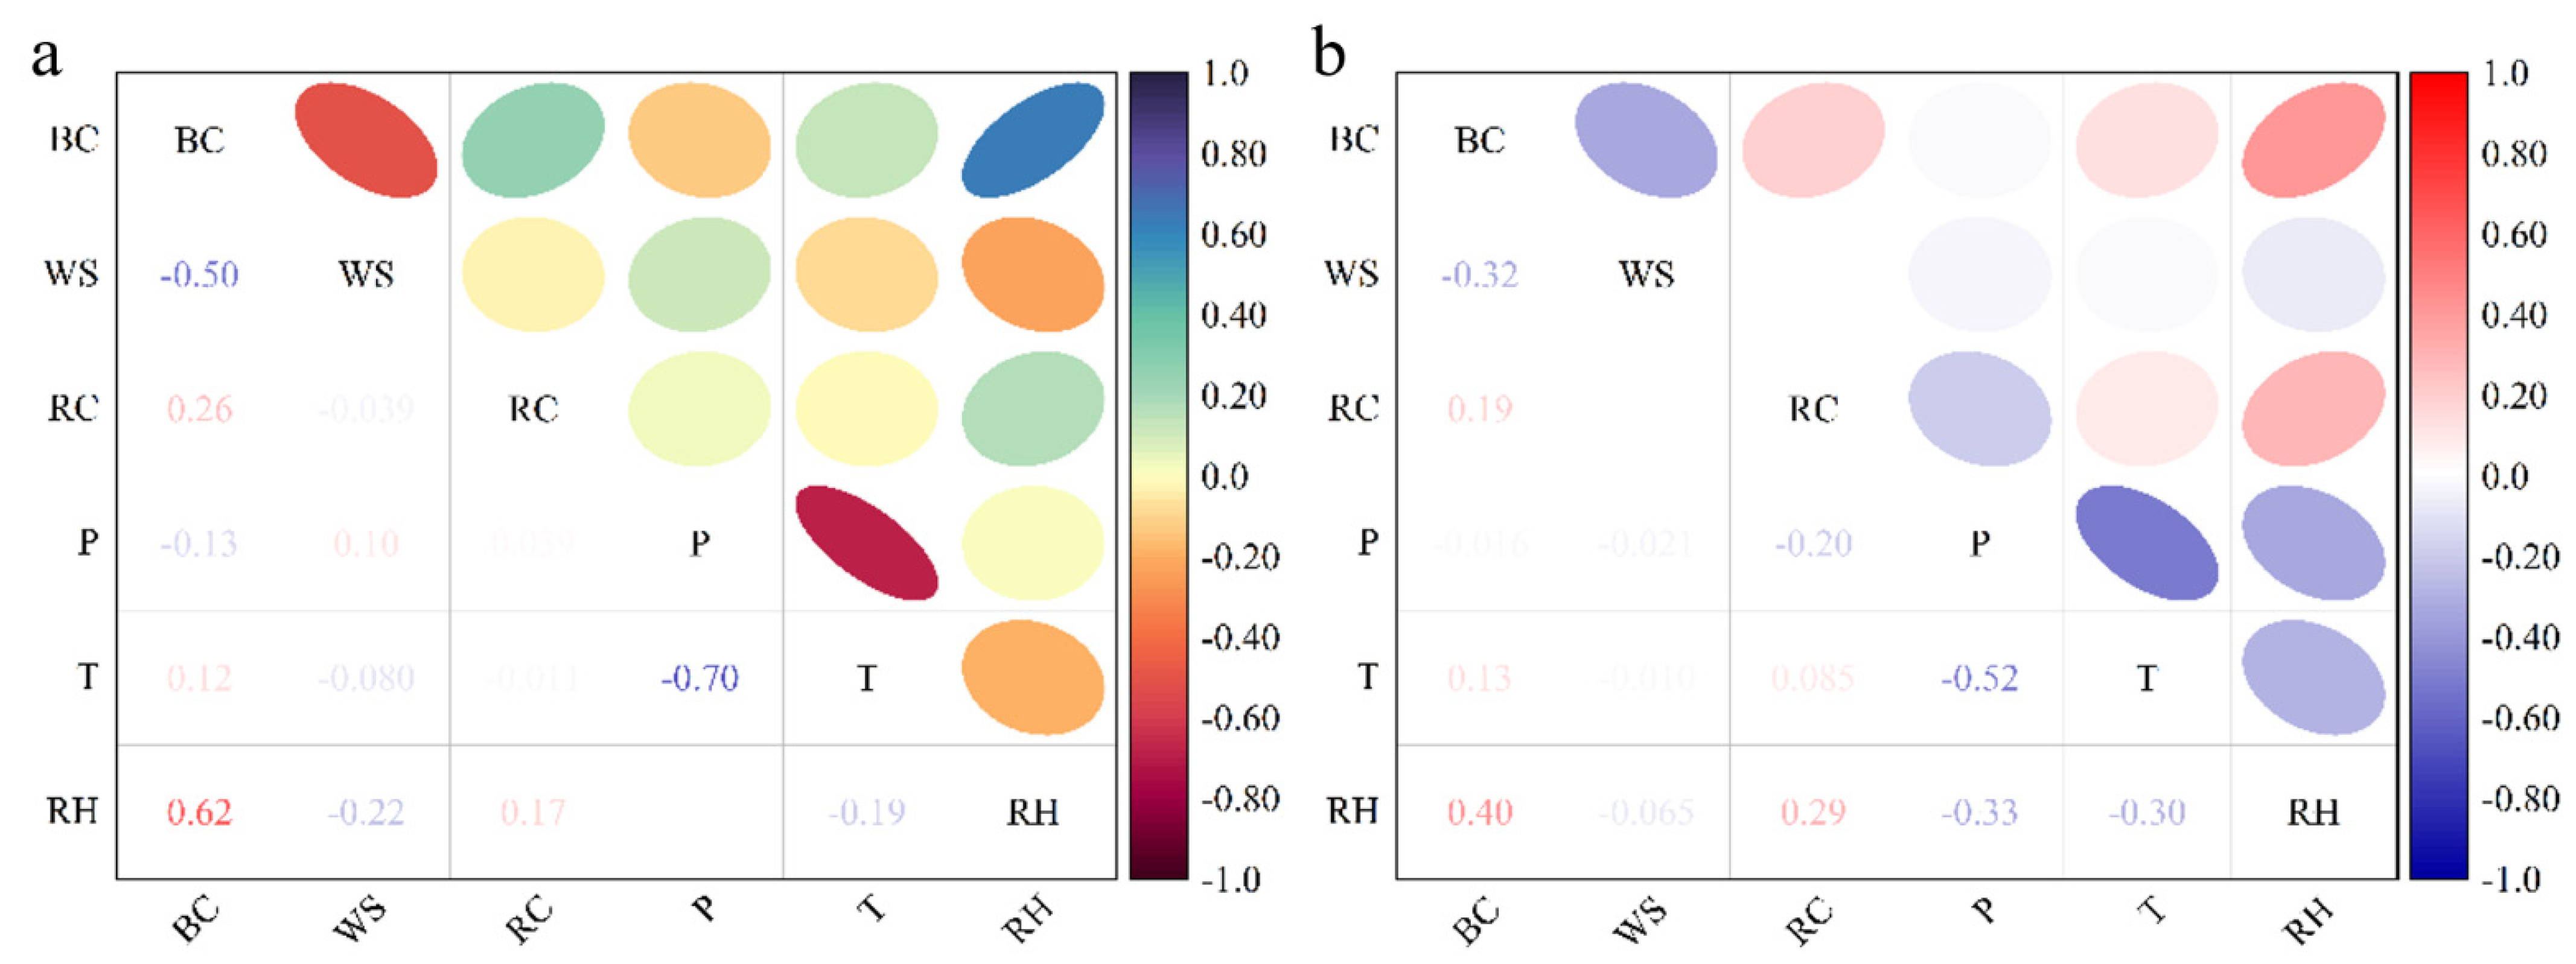
BC concentrations were positively correlated with PM2.5, PM10, CO, and NO in both the heating and non-heating seasons, while the correlation between BC and SO2 was poor. A more comprehensive analysis of correlations between BC and various contaminants in this paper provided a theoretical basis for the joint control of atmospheric contaminants. Moreover, wind speed presented a strong negative correlation with BC, while relative humidity showed a strong positive correlation. Rainfall, barometric pressure, and air temperature showed weak correlations with BC. The correlation between BC and meteorological factors reflected the influencing factors and served as a base for BC concentration prediction.
(4)
The distribution of the potential source area in the heating season was mainly distributed in the north-western region of China and the eastern region of Henan Province. In the non-heating season, it was mainly distributed in the north-eastern region of China and the southern region of Henan Province.

Author Contributions

Conceptualization, R.Z. (Rencheng Zhu), X.L. (Xinyu Liu) and Y.W.; methodology, R.Z. (Rencheng Zhu), X.L. (Xinyu Liu), Y.W. and S.W.; software, X.L. (Xinyu Liu), X.L. (Xinhui Liu) and Y.W.; formal analysis, R.Z. (Rencheng Zhu), R.Z. (Ruiqin Zhang) and B.W.; investigation, X.L. (Xinyu Liu), Y.W. and X.L. (Xinhui Liu); resources, R.Z. (Rencheng Zhu), R.Z. (Ruiqin Zhang), L.Z. and S.W.; data curation, Y.W. and B.W.; writing, X.L. (Xinyu Liu), Y.W. and R.Z. (Rencheng Zhu); visualization, X.L. (Xinyu Liu), Y.W., X.L. (Xinhui Liu) and B.W.; supervision, R.Z. (Rencheng Zhu), S.W. and L.Z.; project administration, R.Z. (Rencheng Zhu) and L.Z.; funding acquisition, R.Z. (Rencheng Zhu) and R.Z. (Ruiqin Zhang) All authors have read and agreed to the published version of the manuscript.

Funding

This work was supported by the National Natural Science Foundation of China (grant number 51808507), the National Key R&D Program of China (grant number 2017YFC0212401), the Collaborative Control Monitoring Project of PM2.5 and O3 in Zhengzhou (grant number 20210641A), and the Young Talent Enterprise Cooperation Innovation Team Support Program of Zhengzhou University (grant number 32320431-21). The contents of this paper are solely the responsibility of the authors and do not necessarily represent the official views of the sponsors.

Institutional Review Board Statement

Not applicable.

Informed Consent Statement

Not applicable.

Data Availability Statement

The data that support the findings of this study are in this paper.

Conflicts of Interest

The authors declare no conflict of interest.

References

  1. Laskin, A.; Laskin, J.; Nizkorodov, S.A. Chemistry of atmospheric brown carbon. Chem. Rev. 2015, 115, 4335–4382. [Google Scholar] [CrossRef] [Green Version]
  2. Liu, Y.; Yan, C.; Zheng, M. Source apportionment of black carbon during winter in Beijing. Sci. Total Environ. 2018, 618, 531–541. [Google Scholar] [CrossRef] [PubMed]
  3. Bond, T.C.; Zarzycki, C.; Flanner, M.G.; Koch, D.M. Quantifying immediate radiative forcing by black carbon and organic matter with the specific forcing pulse. Atmos. Chem. Phys. 2011, 11, 1505–1525. [Google Scholar] [CrossRef] [Green Version]
  4. Chan, C.K.; Yao, X. Air pollution in mega cities in China. Atmos. Environ. 2008, 42, 1–42. [Google Scholar] [CrossRef]
  5. Wang, R.; Tao, S.; Wang, W.; Liu, J.; Shen, H.; Shen, G.; Wang, B.; Liu, X.; Li, W.; Huang, Y.; et al. Black carbon emissions in China from 1949 to 2050. Environ. Sci. Technol. 2012, 46, 7595–7603. [Google Scholar] [CrossRef] [PubMed]
  6. Streets, D.G.; Gupta, S.; Waldhoff, S.T.; Wang, M.; Bond, T.C.; Yiyun, B. Black carbon emissions in China. Atmos. Environ. 2001, 35, 4281–4296. [Google Scholar] [CrossRef]
  7. Zhang, W.; Lu, Z.; Xu, Y.; Wang, C.; Gu, Y.; Xu, H.; Streets, D.G. Black carbon emissions from biomass and coal in rural China. Atmos. Environ. 2018, 176, 158–170. [Google Scholar] [CrossRef]
  8. Chung, C.E.; Ramanathan, V.; Carmichael, G.; Kulkarni, S.; Tang, Y.; Adhikary, B.; Leung, L.R.; Qian, Y. Anthropogenic aerosol radiative forcing in Asia derived from regional models with atmospheric and aerosol data assimilation. Atmos. Chem. Phys. 2010, 10, 6007–6024. [Google Scholar] [CrossRef] [Green Version]
  9. Bond, T.C.; Doherty, S.J.; Fahey, D.W.; Forster, P.M.; Berntsen, T.; DeAngelo, B.J.; Flanner, M.G.; Ghan, S.; Kärcher, B.; Koch, D.; et al. Bounding the role of black carbon in the climate system: A scientific assessment. J. Geophys. Res. Atmos. 2013, 118, 5065–5911. [Google Scholar] [CrossRef]
  10. Armstrong, B.; Hutchinson, E.; Unwin, J.; Fletcher, T. Lung cancer risk after exposure to polycyclic aromatic hydrocarbons: A review and meta-analysis. Environ. Health Perspect. 2004, 112, 970–978. [Google Scholar] [CrossRef]
  11. Abdel-Shafy, H.I.; Mansour, M.S.M. A review on polycyclic aromatic hydrocarbons: Source, environmental impact, effect on human health and remediation. Egypt. J. Pet. 2016, 25, 107–123. [Google Scholar] [CrossRef] [Green Version]
  12. Pakkanen, T.A.; Kerminen, V.M.; Ojanen, C.H.; Hillamo, R.E.; Aarnio, P.; Koskentalo, T. Atmospheric black carbon in Helsinki. Atmos. Environ. 2000, 34, 1497–1506. [Google Scholar] [CrossRef]
  13. Liu, D.; Li, J.; Zhang, Y.; Xu, Y.; Liu, X.; Ding, P.; Shen, C.; Chen, Y.; Tian, C.; Zhang, G. The use of levoglucosan and radio carbon for source apportionment of PM2.5 carbonaceous aerosols at a background site in east China. Environ. Sci. Technol. 2013, 47, 10454–10461. [Google Scholar] [CrossRef] [PubMed]
  14. Zhang, Y.L.; Huang, R.J.; El Haddad, I.; Ho, K.F.; Cao, J.J.; Han, Y.; Zotter, P.; Bozzetti, C.; Daellenbach, K.R.; Canonaco, F.; et al. Fossil vs. non-fossil sources of fine carbonaceous aerosols in four Chinese cities during the extreme winter haze episode of 2013. Atmos. Chem. Phys. 2015, 15, 1299–1312. [Google Scholar] [CrossRef] [Green Version]
  15. Li, C.; Bosch, C.; Kang, S.; Andersson, A.; Chen, P.; Zhang, Q.; Cong, Z.; Chen, B.; Qin, D.; Gustafsson, Ö. Sources of black carbon to the Himalayan–Tibetan Plateau glaciers. Nat. Commun. 2016, 7, 12574. [Google Scholar] [CrossRef]
  16. Wang, Z.; Huang, X.; Ding, A. Dome effect of black carbon and its key influencing factors: A one-dimensional modelling study. Atmos. Chem. Phys. 2018, 18, 2821–2834. [Google Scholar] [CrossRef] [Green Version]
  17. Zhang, Q.; Shen, Z.; Zhang, T.; Kong, S.; Lei, Y.; Wang, Q.; Tao, J.; Zhang, R.; Wei, P.; Wei, C.; et al. Spatial distribution and sources of winter black carbon and brown carbon in six Chinese megacities. Sci. Total Environ. 2021, 762, 143075. [Google Scholar] [CrossRef]
  18. Ni, H.; Huang, R.J.; Cosijn, M.M.; Yang, L.; Guo, J.; Cao, J.; Dusek, U. Measurement report: Dual-carbon isotopic characterization of carbonaceous aerosol reveals different primary and secondary sources in Beijing and Xi’an during severe haze events. Atmos. Chem. Phys. 2020, 20, 16041–16053. [Google Scholar] [CrossRef]
  19. Chen, H.; Wang, H. Haze days in north China and the associated atmospheric circulations based on daily visibility data from 1960 to 2012. J. Geophys. Res. Atmos. 2015, 120, 5895–5909. [Google Scholar] [CrossRef]
  20. Shen, F.; Ge, X.; Hu, J.; Nie, D.; Tian, L.; Chen, M. Air pollution characteristics and health risks in Henan Province, China. Environ. Res. 2017, 156, 625–634. [Google Scholar] [CrossRef]
  21. Drinovec, L.; Mocnik, G.; Zotter, P.; Prévôt, A.S.H.; Ruckstuhl, C.; Coz, E.; Rupakheti, M.; Sciare, J.; Müller, T.; Wiedensohler, A.; et al. The “dual-spot” aethalometer: An improved measurement of aerosol black carbon with real-time loading compensation. Atmos. Meas. Tech. Discuss. 2014, 7, 10179–10220. [Google Scholar] [CrossRef] [Green Version]
  22. Singh, S.; Tiwari, S.; Hopke, P.K.; Zhou, C.; Turner, J.R.; Panicker, A.S.; Singh, P.K. Ambient black carbon particulate matter in the coal region of Dhanbad, India. Sci. Total Environ. 2018, 615, 955–963. [Google Scholar] [CrossRef] [PubMed]
  23. Saarikoski, S.; Niemi, J.V.; Aurela, M.; Pirjola, L.; Kousa, A.; Rönkkö, T.; Timonen, H. Sources of black carbon at residential and traffic environments obtained by two source apportionment methods. Atmos. Chem. Phys. 2021, 21, 14851–14869. [Google Scholar] [CrossRef]
  24. Wang, J.; Nie, W.; Cheng, Y.; Shen, Y.; Chi, X.; Wang, J.; Huang, X.; Xie, Y.; Sun, P.; Xu, Z.; et al. Light absorption of brown carbon in eastern China based on 3-year multi-wavelength aerosol optical property observations and an improved absorption Ångström exponent segregation method. Atmos. Chem. Phys. 2018, 18, 9061–9074. [Google Scholar] [CrossRef] [Green Version]
  25. Sandradewi, J.; Prévt, A.S.H.; Alfarra, M.R.; Szidat, S.; Wehrli, M.N.; Ruff, M.; Weimer, S.; Lanzi, V.N.; Weingartner, E.; Perron, N.; et al. Comparison of several wood smoke markers and source apportionment methods for wood burning particulate mass. Atmos. Chem. Phys. 2008, 8, 8091–8118. [Google Scholar] [CrossRef] [Green Version]
  26. Prasad, P.; Raman, M.R.; Ratnam, M.; Chen, W.N.; Rao, S.V.B.; Gogoi, M.M.; Kompalli, S.K.; Sarat Kumar, K.; Babu, S.S. Characterization of atmospheric black carbon over a semi-urban site of southeast India: Local sources and long-range transport. Atmos. Res. 2018, 213, 411–421. [Google Scholar] [CrossRef]
  27. Wang, Y.; Zhang, X.; Draxler, R. TrajStat: GIS-based software that uses various trajectory statistical analysis methods to identify potential sources from long-term air pollution measurement data. Environ. Model. Softw. 2009, 24, 938–939. [Google Scholar] [CrossRef]
  28. Baltensperger, U.; Gäggeler, H.W.; Jost, D.T.; Schwikowski, M.; Seibert, P. 14.P.39 Aerosol measurements at high-alpine sites with the epiphaniometer. J. Aerosol Sci. 1994, 25, 185–186. [Google Scholar] [CrossRef]
  29. Kompalli, S.K.; Babu, S.S.; Moorthy, K.K.; Manoj, M.R.; Kumar, N.V.P.K.; Kannemadugu, H.B.S.; Joshi, A. Aerosol black carbon characteristics over central India: Temporal variation and its dependence on mixed layer height. Atmos. Res. 2014, 147–148, 27–37. [Google Scholar] [CrossRef]
  30. Hsu, Y.K.; Holsen, T.M.; Hopke, P.K. Comparison of hybrid receptor models to locate PCB sources in Chicago. Atmos. Environ. 2003, 37, 545–562. [Google Scholar] [CrossRef]
  31. Wang, Y. MeteoInfo: GIS software for meteorological data visualization and analysis. Meteorol. Appl. 2014, 21, 2. [Google Scholar] [CrossRef]
  32. Ashbaugh, L.; Malm, W.C.; Sadeh, W.Z. A residence time probability analysis of sulfur concentrations at grand Canyon National Park. Atmos. Environ. 1985, 19, 1263–1270. [Google Scholar] [CrossRef]
  33. Zhang, F.; Wang, Z.; Cheng, H.; Lv, X.; Gong, W.; Wang, X.; Zhang, G. Seasonal variations and chemical characteristics of PM2.5 in Wuhan, central China. Sci. Total Environ. 2015, 518–519, 97–105. [Google Scholar] [CrossRef] [PubMed]
  34. Fang, C.; Xue, K.; Li, J.; Wang, J. Characteristics and weekend effect of air pollution in eastern Jilin Province. Atmosphere 2022, 13, 681. [Google Scholar] [CrossRef]
  35. Day, D.E.; Hand, J.L.; Carrico, C.M.; Engling, G.; Malm, W.C. Humidification factors from laboratory studies of fresh smoke from biomass fuels. Geophys. Res. Atmos. 2006, 111, D22. [Google Scholar] [CrossRef] [Green Version]
  36. Schnaiter, M.; Horvath, H.; Möhlter, O.; Naumann, K.H.; Saafhoff, H.; Schöck, O.W. UV-VIS-NIR spectral optical properties of soot and soot-containing aerosols. J. Aerosol Sci. 2003, 34, 1421–1444. [Google Scholar] [CrossRef]
  37. Schnaiter, M.; Linke, C.; Möhler, O.; Naumann, K.H.; Saathoff, H.; Wagner, R.; Schurath, U.; Wehner, B. Absorption amplification of black carbon internally mixed with secondary organic aerosols. J. Geophys. Res. Atmos. 2005, 110, D19204. [Google Scholar] [CrossRef]
  38. Zhang, L.; Kong, S.F.; Zheng, H.; Hu, Y.; Zeng, X.; Cheng, Y.; Qi, S.H. Concentrations and sources of black carbon aerosols in rural areas of southern North China Plain. Environ. Sci. 2022, 43, 2363–2372. [Google Scholar] [CrossRef]
  39. Zhao, P.; Dong, F.; Yang, Y.; He, D.; Zhao, X.; Zhang, W.; Yao, Q.; Liu, H. Characteristics of carbonaceous aerosol in the region of Beijing, Tianjin, and Hebei, China. Atmos. Environ. 2013, 71, 389–398. [Google Scholar] [CrossRef]
  40. Gonzalez, A.; Millet, D.B.; Yu, X.; Wells, K.C.; Griffis, T.J.; Baier, B.C.; Campbell, P.C.; Choi, Y.; DiGangi, J.P.; Gvakharia, A.; et al. Fossil versus nonfossil CO sources in the US: New airborne constraints from ACT-America and GEM. Geophys. Res. Lett. 2021, 48, e2021GL093361. [Google Scholar] [CrossRef]
  41. Yin, M.; Guan, H.; Luo, L.; Xiao, H.; Zhang, Z. Using nitrogen and oxygen stable isotopes to analyze the major NOx sources to nitrate of PM2.5 in Lanzhou, northwest China, in winter-spring periods. Atmos. Environ. 2022, 276, 119036. [Google Scholar] [CrossRef]
  42. Cao, J.J.; Shen, Z.X.; Chow, J.C.; Watson, J.G.; Lee, S.C.; Tie, X.X.; Ho, K.F.; Wang, G.H.; Han, Y.M. Winter and summer PM2.5 chemical compositions in fourteen Chinese cities. Air Waste Manag. 2012, 62, 1214–1226. [Google Scholar] [CrossRef] [PubMed]
  43. Bisht, D.S.; Dumka, U.C.; Kaskaoutis, D.G.; Pipal, A.S.; Srivastava, A.K.; Soni, V.K.; Attri, S.D.; Sateesh, M.; Tiwari, S. Carbonaceous aerosols and pollutants over Delhi urban environment: Temporal evolution, source apportionment and radiative forcing. Sci. Total Environ. 2015, 521–522, 431–445. [Google Scholar] [CrossRef] [PubMed]
  44. Aslam, A.; Ibrahim, M.; Shahid, I.; Mahmood, A.; Irshad, M.K.; Yamin, M.; Ghazala; Tariq, M.; Shamshiri, R.R. Pollution characteristics of particulate matter (PM2.5 and PM10) and constituent carbonaceous aerosols in a South Asian future megacity. Appl. Sci. 2020, 10, 8864. [Google Scholar] [CrossRef]
  45. Moreno Ríos, A.L.; Tejeda-Benítez, L.P.; Bustillo-Lecompte, C.F. Sources, characteristics, toxicity, and control of ultrafine particles: An overview. Geosci. Front. 2022, 13, 101147. [Google Scholar] [CrossRef]
  46. Jacobson, M.Z. Short-term effects of controlling fossil-fuel soot, biofuel soot and gases, and methane on climate, arctic ice, and air pollution health. Geophys. Res. Atmos. 2010, 115, 1–24. [Google Scholar] [CrossRef]
  47. Babu, S.S.; Moorthy, K.K. Aerosol black carbon over a tropical coastal station in India. Geophys. Res. Lett. 2002, 29, 13-1–13-4. [Google Scholar] [CrossRef]
Figure 1. Location of the sampling point in this study.
Atmosphere 13 01071 g001
Figure 2. Frequency distribution histogram of the hourly mean concentration of black carbon (BC) in the heating and non-heating seasons.
Atmosphere 13 01071 g002
Figure 3. Monthly variation in BC concentration in the heating season and non-heating season ((a): heating season; (b): non-heating season).
Atmosphere 13 01071 g003
Figure 4. Diurnal variation in BC concentration during observations.
Atmosphere 13 01071 g004
Figure 5. Distribution of α-values frequency in the heating and non-heating seasons, respectively.
Atmosphere 13 01071 g005
Figure 6. Average daily change in α-values between the heating and non-heating seasons.
Atmosphere 13 01071 g006
Figure 7. Correlation analysis of SO2, CO, NO, NOX, NO2, O3, PM10, PM2.5, and BC for the heating and non-heating seasons ((a): heating season; (b): non-heating season).
Atmosphere 13 01071 g007
Figure 8. Daily changes in the hourly mean concentrations of (b) SO2, (c) CO, (d) NO, (e) NOX, (f) NO2, (g) O3, (h) PM10, (i) PM2.5, and (a) BC during the heating and non-heating seasons.
Atmosphere 13 01071 g008
Figure 9. Correlation analysis of wind speed (WS), rainfall capacity (RC), barometric pressure (P), air temperature (T), relative humidity (RH), and BC for the heating and non-heating seasons ((a): heating season; (b): non-heating season).
Atmosphere 13 01071 g009
Figure 10. Results of the back-trajectory cluster analyses and concentration weighted trajectory during November 2021 (a); December 2021 (b); and March 2022 (c).
Atmosphere 13 01071 g010
Publisher’s Note: MDPI stays neutral with regard to jurisdictional claims in published maps and institutional affiliations.

