Article

Spatialized Analysis of Air Pollution Complaints in Beijing Using the BERT+CRF Model

1
State Key Laboratory of Resources and Environmental Information System, Institute of Geographic Sciences and Natural Resources Research, Chinese Academy of Sciences, Beijing 100101, China
2
University of Chinese Academy of Sciences, Beijing 100049, China
3
Comprehensive Service Center, Beijing Municipal Ecology Environment Bureau, Beijing 100048, China
4
School of Earth Sciences, Yunnan University, Kunming 650500, China
5
Appraisal Center for Environment & Engineering, Ministry of Ecology and Environment, Beijing 100012, China
6
Information Research Institue of Emergency Management Department, Beijing 100029, China
*
Authors to whom correspondence should be addressed.
Atmosphere 2022, 13(7), 1023; https://doi.org/10.3390/atmos13071023
Submission received: 3 June 2022 / Revised: 22 June 2022 / Accepted: 23 June 2022 / Published: 27 June 2022

Abstract

:
(1) Background: To better carry out air pollution control and to assist in accurate investigations of air pollution, in this study, we fully explore the spatial distribution characteristics of air pollution complaint results and provide guidance for air pollution control by combining regional air monitoring data. (2) Methods: By selecting the air pollution complaint information in Beijing from 2019 to 2020, in this study, we extract the names and addresses of complaint points, as well as the complaint times and types by adopting the BERT (bidirectional encoder representations from transformers) + CRF (conditional random field) model deep learning method. Moreover, through further filtering and processing of the complaint points’ address information, we achieve address matching and spatial positioning of the complaint points, and realize the regional spatial representation of air pollution complaints in Beijing in the form of a heat map. (3) Results: The experimental results are compared and analyzed with the ranking data of total suspended particulate (TSP) concentration of townships (streets) in Beijing during the same period, indicating that the key areas of air pollution complaints have a high correlation with the key polluted township (street) areas. The distribution of complaints and the types of complaints in each township (street) differ according to the population density in each township (street), the level of education, and economic activity. (4) Conclusions: The results of this study show that the public, as the intuitive perceiver of air pollution, is sensitive to the air pollution situation at a smaller spatial scale; furthermore, complaints can provide guidance and reference for the direction of air pollution control and law enforcement investigations when coupled with geographical features and economic status.

1. Introduction

Air pollution control is a common concern of all countries in the world. It is of great significance to achieve the goals of peak global carbon emissions and carbon neutrality, effectively curbing global warming and promoting sustainable development. Law enforcement investigations of air pollution incidents is an important means of air pollution control, and accurate detection of air pollution is an essential part of this. Currently, the detection of air pollution mainly relies on satellite remote sensing monitoring, ground monitoring, and other means. These technical means require a certain amount of labor cost and economic cost, and in some areas they cannot achieve complete coverage and timely detection of air pollution. However, with the development of economies and societies, increased public awareness of air protection, and the application of the internet and smart phones, public complaints have become the main source of air pollution clues. The public is the direct perceiver of air quality [1], and their feelings about air pollution are directly reflected in their complaints about air pollution phenomena. Through timely and effective acquisition of statistics on public air pollution complaints, it is helpful to detect air pollution at a smaller spatial scale. Due to differences in the cognition and educational backgrounds of the public, air pollution complaint texts often contain issues such as ambiguous expressions and vague positioning. Currently, a lot of manpower and material resources are needed to obtain and confirm the time, address, and other information related to air pollution complaints, as well as spatial investigation and analysis, and therefore, it is impossible to identify air pollution through spatial analysis of public complaint data. By spatializing air pollution complaint information and combining it with regional air quality monitoring data, it is possible to effectively analyze the type and distribution of air pollution, to find frequent air pollution events in the region, and to provide guidance for the direction of air pollution investigation, thus, improving the efficiency of air pollution law enforcement and improving air pollution control methods. GIS technology can efficiently visualise multi-source spatio-temporal data and has been widely used in natural ecological environment [2]. It is of great significance to use GIS technology to realize the spatialization of air pollution complaints.
Realizing the extraction and analysis of air pollution public complaints information is the basis for the spatialization of air pollution complaints. Scholars have carried out extensive studies on public participation in information extraction and spatialization of specific topics. Some studies have taken the administrative districts as the analysis unit, and used the positioning data in the social media data released by users to complete the sentiment spatio-temporal analysis research. Zhang et al. [3] used municipal administrative districts as the unit of analysis to explore and analyze the sentiment value and severity of the disaster in each city of Guangdong Province during the landfall of Typhoon “Mangkhut”. Chen et al. [4] extracted the public opinion information of COVID-19 epidemic based on micro-blog data, and visualized the distribution of sentiment and the number of micro bloggers in each province and municipality using provincial administrative regions as the spatial analysis unit. Wang et al. [5] used micro-blog data with GPS information to analyze the “Beijing rainstorm event” and studied the spatial distribution of different topics for the event based on the LDA model to find the location of the disaster and did not reflect the aggregation degree of the topics. Since the above studies used the users’ network location information directly for the analysis, which is often incomplete, the results are highly biased.
Therefore, some studies have used machine learning and deep learning to extract the address and other main information from the text content of the public option, thus, obtaining more enriched and complete information. Alves et al. [6] used the GeoSEn geoparser method to extract geographic information from text and convert it to geographic coordinates for sentiment spatial analysis, but the analysis results were biased due to inaccurate monitoring locations. Chen Zhang et al. [7] realized sentiment tendency extraction of micro-blog comment text by natural language processing tools, and the research results reflected the attention of different regions to the COVID-19 epidemic and sentiment state distribution. Han et al. [8] collected information related to the COVID-19 epidemic from micro-blog data and improved the BTM subject word extraction algorithm based on BERT word vector. Through subject word extraction and spatial clustering methods, the analysis of hot spots and sentiment spatial distribution characteristics was realized, and the changes of public sentiment in different regions were displayed. The above studies based on machine learning or deep learning have achieved the extraction of subject words and information, as well as the extraction of public attention and sentiment values for specific topics and the analysis of the sentiment spatial distribution characteristics. Nevertheless, such studies have been mainly based on provincial and municipal administrative area scales, which are not refined to smaller scales. Moreover, there are relatively few studies on information extraction and text classification from the analysis of the text content and spatial distribution features of public complaints against air pollution.
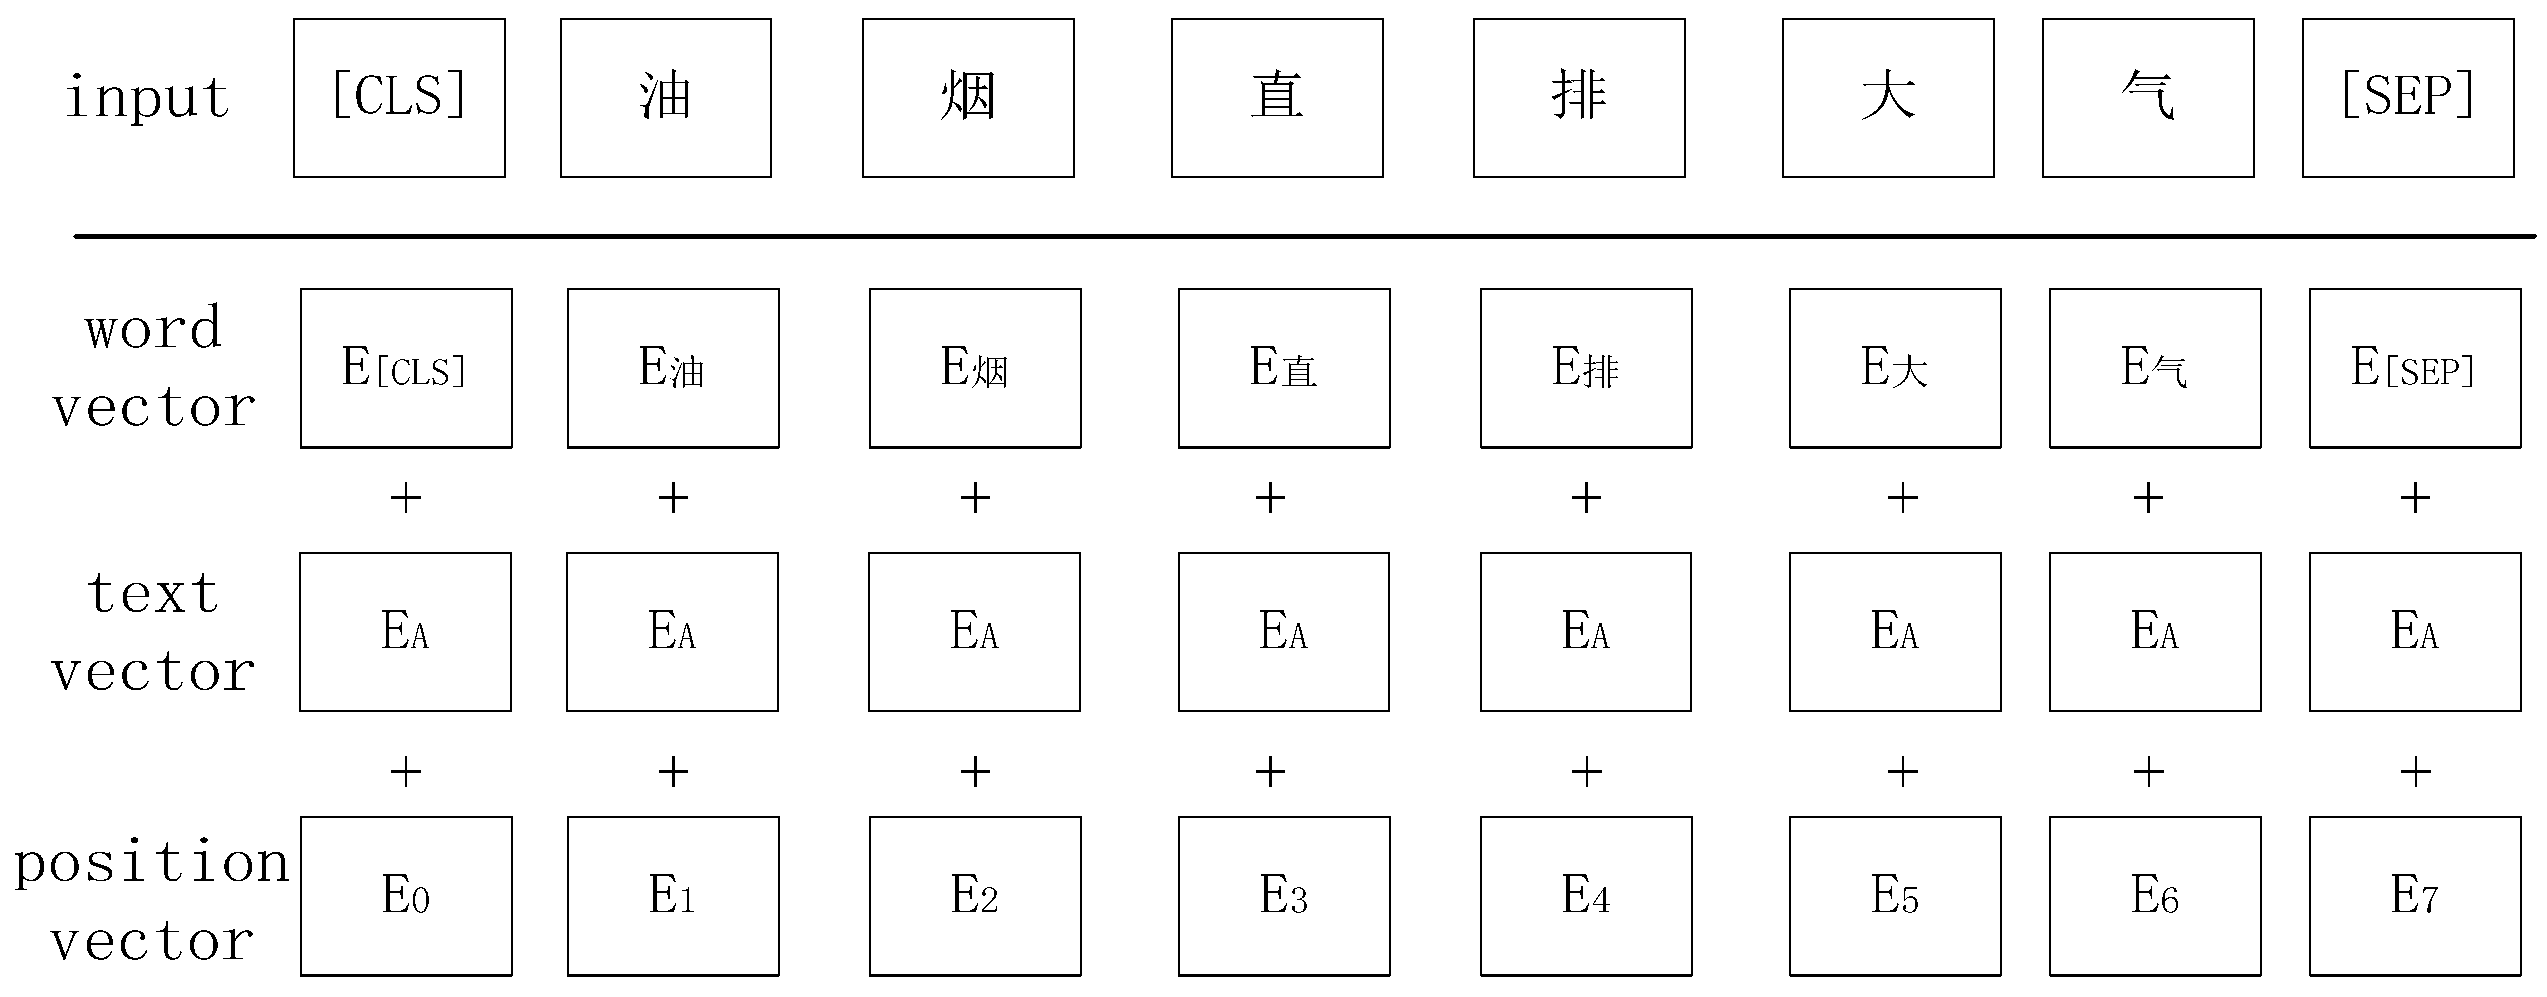
As an advanced pretrained word vector model, the BERT model can further enhance the generalization ability of the word vector model to fully describe the character-level, word-level, sentence-level, and inter-sentence relationship features, and better characterize the syntactic and semantic information in different contexts [9]. The BERT model has the ability to characterize multiple meanings of a word, and the word vector is trained by the BERT model, based on which the CRF model is applied to decode and predict the best sequence. Since the air pollution complaint text has a specific sentence pattern and contains complex information content, the BERT+CRF model can be used to better classify complaints and extract relevant information from the air pollution complaint text.
Air quality is one of the most critical environmental issues in Beijing, China [10]. Therefore, this study selects the text data of Beijing air pollution complaints from 2019 to 2020 to extract more accurate air pollution complaint information. The BERT+CRF model is used to extract the names, addresses, and time of complaint points in the text, to classify the air pollution complaint text, and to obtain the types of air pollution complaints, and then through address matching, spatialize the expression of air pollution complaint to obtain a more accurate spatial and temporal distribution of air pollution complaints at the township (street) level in Beijing. Combined with the comparative analysis of the ranking data of total suspended particulate (TSP) concentrations of townships (streets) in Beijing, it can be observed that there is a high degree of overlap between the key areas of public complaints about air pollution and the key pollution areas. This study shows that the type of air pollution public complaint and other main information, combined with spatial analysis results of regional air monitoring data, can reflect the causes and pollution conditions of regional air pollution, and provide guidance for the direction of air pollution law enforcement investigations.
The remainder of the paper is structured as follows: In Section 2, we describe the experimental data sources and deep learning complaint text classification and information extraction methods; in Section 3, we introduce the experimental parameter settings, experimental results, and evaluation; in Section 4, we illustrate the spatial relation verification between complaints and polluted areas by using regional air monitoring data, and the complaint characteristics of the main complaint-intensive areas are analyzed; finally, several conclusions are given in Section 5.

2. Materials and Methods

2.1. Data Sources

The data of air pollution complaints come from the Beijing Complaint and Reporting Information Platform, where the public provides complaint information in three ways: WeChat, telephone reporting, and online reporting. The content of the responses to air pollution public complaints on the platform can provide verified public complaint information, therefore, we selected, it as the data research object. Responses to air pollution complaints are saved in text form, which can be analyzed and processed to extract accurate semantic information, such as the name and address of the complaint point, complaint time and complaint type.

2.2. Air Pollution Complaint Information Extraction and Complaint Classification Method

A combined model based on BERT+CRF was used to extract air pollution complaint investigation information and to obtain complaint point names, addresses, and types of air pollution complaints.
The bidirectional encoder representations from transformers model (BERT model) is able to form contextual bidirectional linguistic representations proposed by Google in October 2018. The goal of the BERT model is to use large-scale unlabeled corpus training to obtain a representation of text containing rich semantic information, that is, the semantic representation of the text, and then fine-tune the semantic representation of the text in specific natural language processing tasks (NLP tasks), and finally apply it to the NLP tasks.
The BERT model is a natural language processing pretrained language representation model [11], which uses a bidirectional or multi-layer transformer encoder as a text feature extractor [12]. The transformer encoder can explicitly represent the dependencies among words, combine contextual information, extract words, and parallelize them to obtain information of each layer such as sentence and semantics [13]. The input to the BERT model is based on character-level embedding linear sequences, where the first token of each sequence is a special categorical recognition symbol (CLS), and the sequences are segmented by a splitter (SEP) between them. Each character includes three embeddings, which are word vector, text vector, and position vector. The problem of multiple meanings of a word can be solved by generating word vectors that can be fused with contextual information by a bidirectional transformer encoder. In addition, the model inputs sentence vectors and position vectors to generate word vectors superimposed by the three vectors. Among them, the sentence vector can represent the textual information of the sentence in which the word is located, and the position vector can represent the semantic information of the words in different positions in the sentence [14], and the three embeddings are superimposed to form the final input content of the BERT model, as shown in Figure 1 below.
The BERT model consists of two pretraining tasks, i.e., masked LM and next sentence prediction, where the former is a random selection of 15% of words as the input training set, of which 80% are replaced with mask, 10% are replaced with other arbitrary words, and 10% are kept as current words. In this way, the selected words are predicted. The next sentence prediction task is to learn the relationship between sentences by predicting the contextual information, replacing some sentences randomly, and predicting whether the two texts are consecutive or not; both types of tasks are trained simultaneously to calculate the total loss value and make it decrease to complete the training process and obtain the word and sentence features to complete the text classification and information extraction.
The conditional random field (CRF) model is used to segment and label sequence data [15] and predict the optimal state sequence from the input sequence and the neighboring label relationships. The CRF model, set to P(y|x) representation, can be used to compensate for the inability of the BERT model to handle the neighboring label dependencies. A linear chain conditional random field is used, where x is the input variable, representing the labeled input sequence, and y is the output sequence, which is the sequence of labels corresponding to the sequence x one-to-one. The core principle is represented by Equation (1) as follows:
p ( y | x ) exp [ k = 1 K W k f k ( y ,   x ) ]
where f represents the feature function and W represents the corresponding weight of the feature function.

3. Results

This study used the text data from the response to air pollution public complaints in Beijing from 2019 to 2020, which was a total of 3304 items. The experimental process included data labeling; complaint text classification; extraction of complaint point names, addresses, and complaint times; address matching; and the spatialization process.

3.1. Data Labeling

This study extracted the names, addresses, and complaint times of air pollution complaint points from the text content of air pollution complaints, and completed the classification of the complaints. The types of air pollution complaints in Beijing were classified into dust, restaurant fumes, odor, mobile sources, waste gas, and garbage disposal pollution complaints, among which the garbage disposal pollution was included as a separate category because it generated comprehensive pollution such as dust, waste gas, and odor. This experiment selected 900 data from the training set, 120 data from the test set, and 120 data from the validation set in the ratio of 8:1:1 from the complaint text. The names, addresses, and complaint times of the complaint points were labeled in the selected sample data.

3.2. Complaint Text Classification and Information Extraction

The BERT+CRF model was used to achieve the classification of complaints and to extract the names, addresses, and complaint times of the complaint points from the complaint text. The parameter configurations used in the training process are shown in Table 1 below.
In this study, the accuracy A, precision P, recall R, and F-value were used to evaluate the accuracy of text classification and information extraction [16], with the following equation:
A = (TP + TN)/(TP + TN + FP + FN)
P = TP/(TP + FP)
R = TP/(TP + FN)
F = (2 × P × R)/(P + R)
where TP and FP are the number of correctly and incorrectly identified samples, respectively, and TN and FN are the number of identified and unidentified samples, respectively.
The BERT+CRF combination model was used to classify the complaint texts and to extract the names, addresses, and complaint times of the complaint points. The accuracy A was used to evaluate the text classification accuracy, and the precision P, recall rate R, and F-values were used to evaluate the extraction accuracy of the name, address and complaint time of a complaint point. In the experiment, the pretraining step is performed first, and then the text classification prediction and information extraction model are created. The experimental results are shown in Table 2 below.
After the pretraining step, the predicted results of the complaint text classification and information extraction are as follows:
  • 06/18/202217:14:50-INFO—trainer-***** Eval results *****
  • 06/18/202217:14:50-INFO—trainer-intent_acc = 0.9421487603305785
  • 06/18/202217:14:50-INFO—trainer-loss = 65.15423583984375
  • 06/18/202217:14:50-INFO—trainer-slot f1 = 0.7665505226480838
  • 06/18/202217:14:50-INFO—trainer-slot_precision = 0.7272727272727273
  • 06/18/202217:14:50-INFO—trainer-slot_recal1 = 0.8103130755064457
In the experiment, the classification of air pollution complaints was achieved by classifying the text of air pollution complaints. The distribution of classification results are shown in Figure 2 below. In the figure, Class 1, Class 3, Class 5, Class 7, and Class 9 are the types of complaints that generate waste gas.
After completing the automatic text classification, the results were filtered and reprocessed by manual means and the complaint types that produce the same pollutant were merged. The statistical results of air pollution complaint classification are shown in Table 3 below.
The experimental statistics revealed that the main types of complaints in Beijing were complaints about restaurant fumes, waste gas, and dust pollution, as well as garbage disposal pollution, etc. In the follow-up research, by calculating the proportion of each complaint type in the total number of complaints, the distribution of the main complaint types in different complaint-intensive areas was analyzed. The statistical results of complaints showed a greater correlation with the form of economic activities in each district of Beijing.

3.3. Spatialization of Air Pollution Complaint Extraction Results

After extracting the names, addresses and complaint times of the complaint points, the spatial positioning of the complaint information was realized according to the extracted names and addresses, i.e., address matching. The extracted address information was saved in the format of “municipality/province + administrative district + township (street) + organization/door number + marker”, and the extracted results needed to be filtered and supplemented manually.
The processed address information was converted into latitude and longitude coordinates by geocoding method to complete address matching. The address matching results were positioned on the map, and the GIS kernel density analysis function was used to produce a heat map to realize the spatialization of air pollution complaint information in Beijing for 2019~2020, as shown in Figure 3 below.
The spatialization results shown in Figure 2 indicate that the overall trend of air pollution complaints in Beijing spreads from the city center to the periphery. The main reason is that the distribution of air pollution complaints is closely related to the distribution of population, economic activities, etc. The central city is a densely populated area with high economic activities and is more responsive to air pollution. The areas with the most intensive complaints are mainly distributed in Chaoyang and Haidian Districts, the junction area of Chaoyang, Tongzhou and Daxing Districts, parts of Chaoyang, northern Fengtai and eastern Changping Districts, as well as parts of Fangshan, Daxing, and Shunyi Districts.

4. Discussion

Total suspended particulate (TSP) matter represents particulate matter with particle size less than 100 microns. The larger the particle size, the shorter the residence time in the air and the closer the transmission distance, therefore, the TSP concentration in Beijing can reflect the local environmental pollution situation.
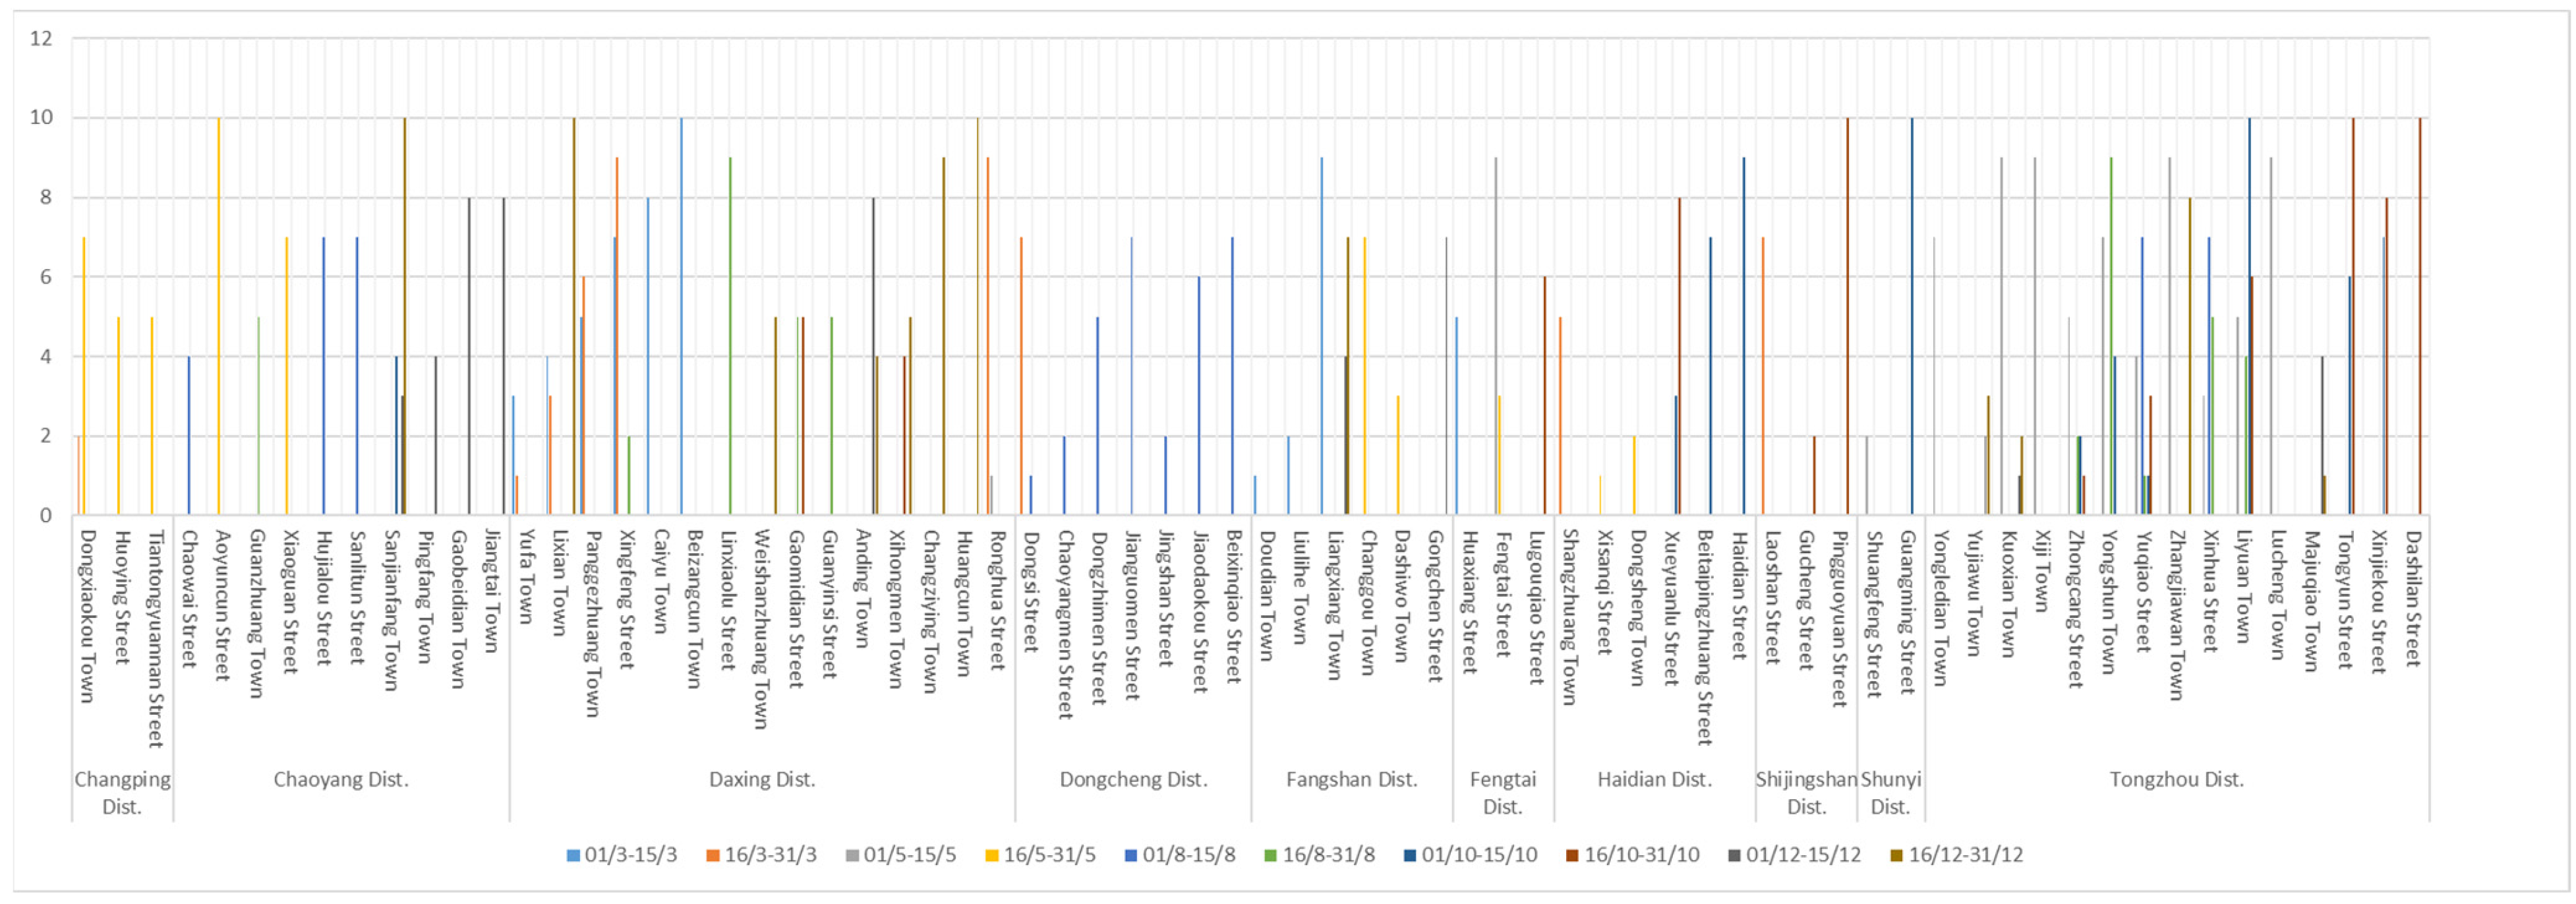
In this study, the top 10 townships (streets) in the TSP ranking in the plain area of Beijing in the months with distinct seasonal characteristics in 2019 and 2020 were selected for statistical analysis, as shown in Figure 4 below. The TSP concentration ranking in Beijing was counted every half month, and the data of the first and second half of March, May, August, October, and December 2019 were selected to complete the analysis study.
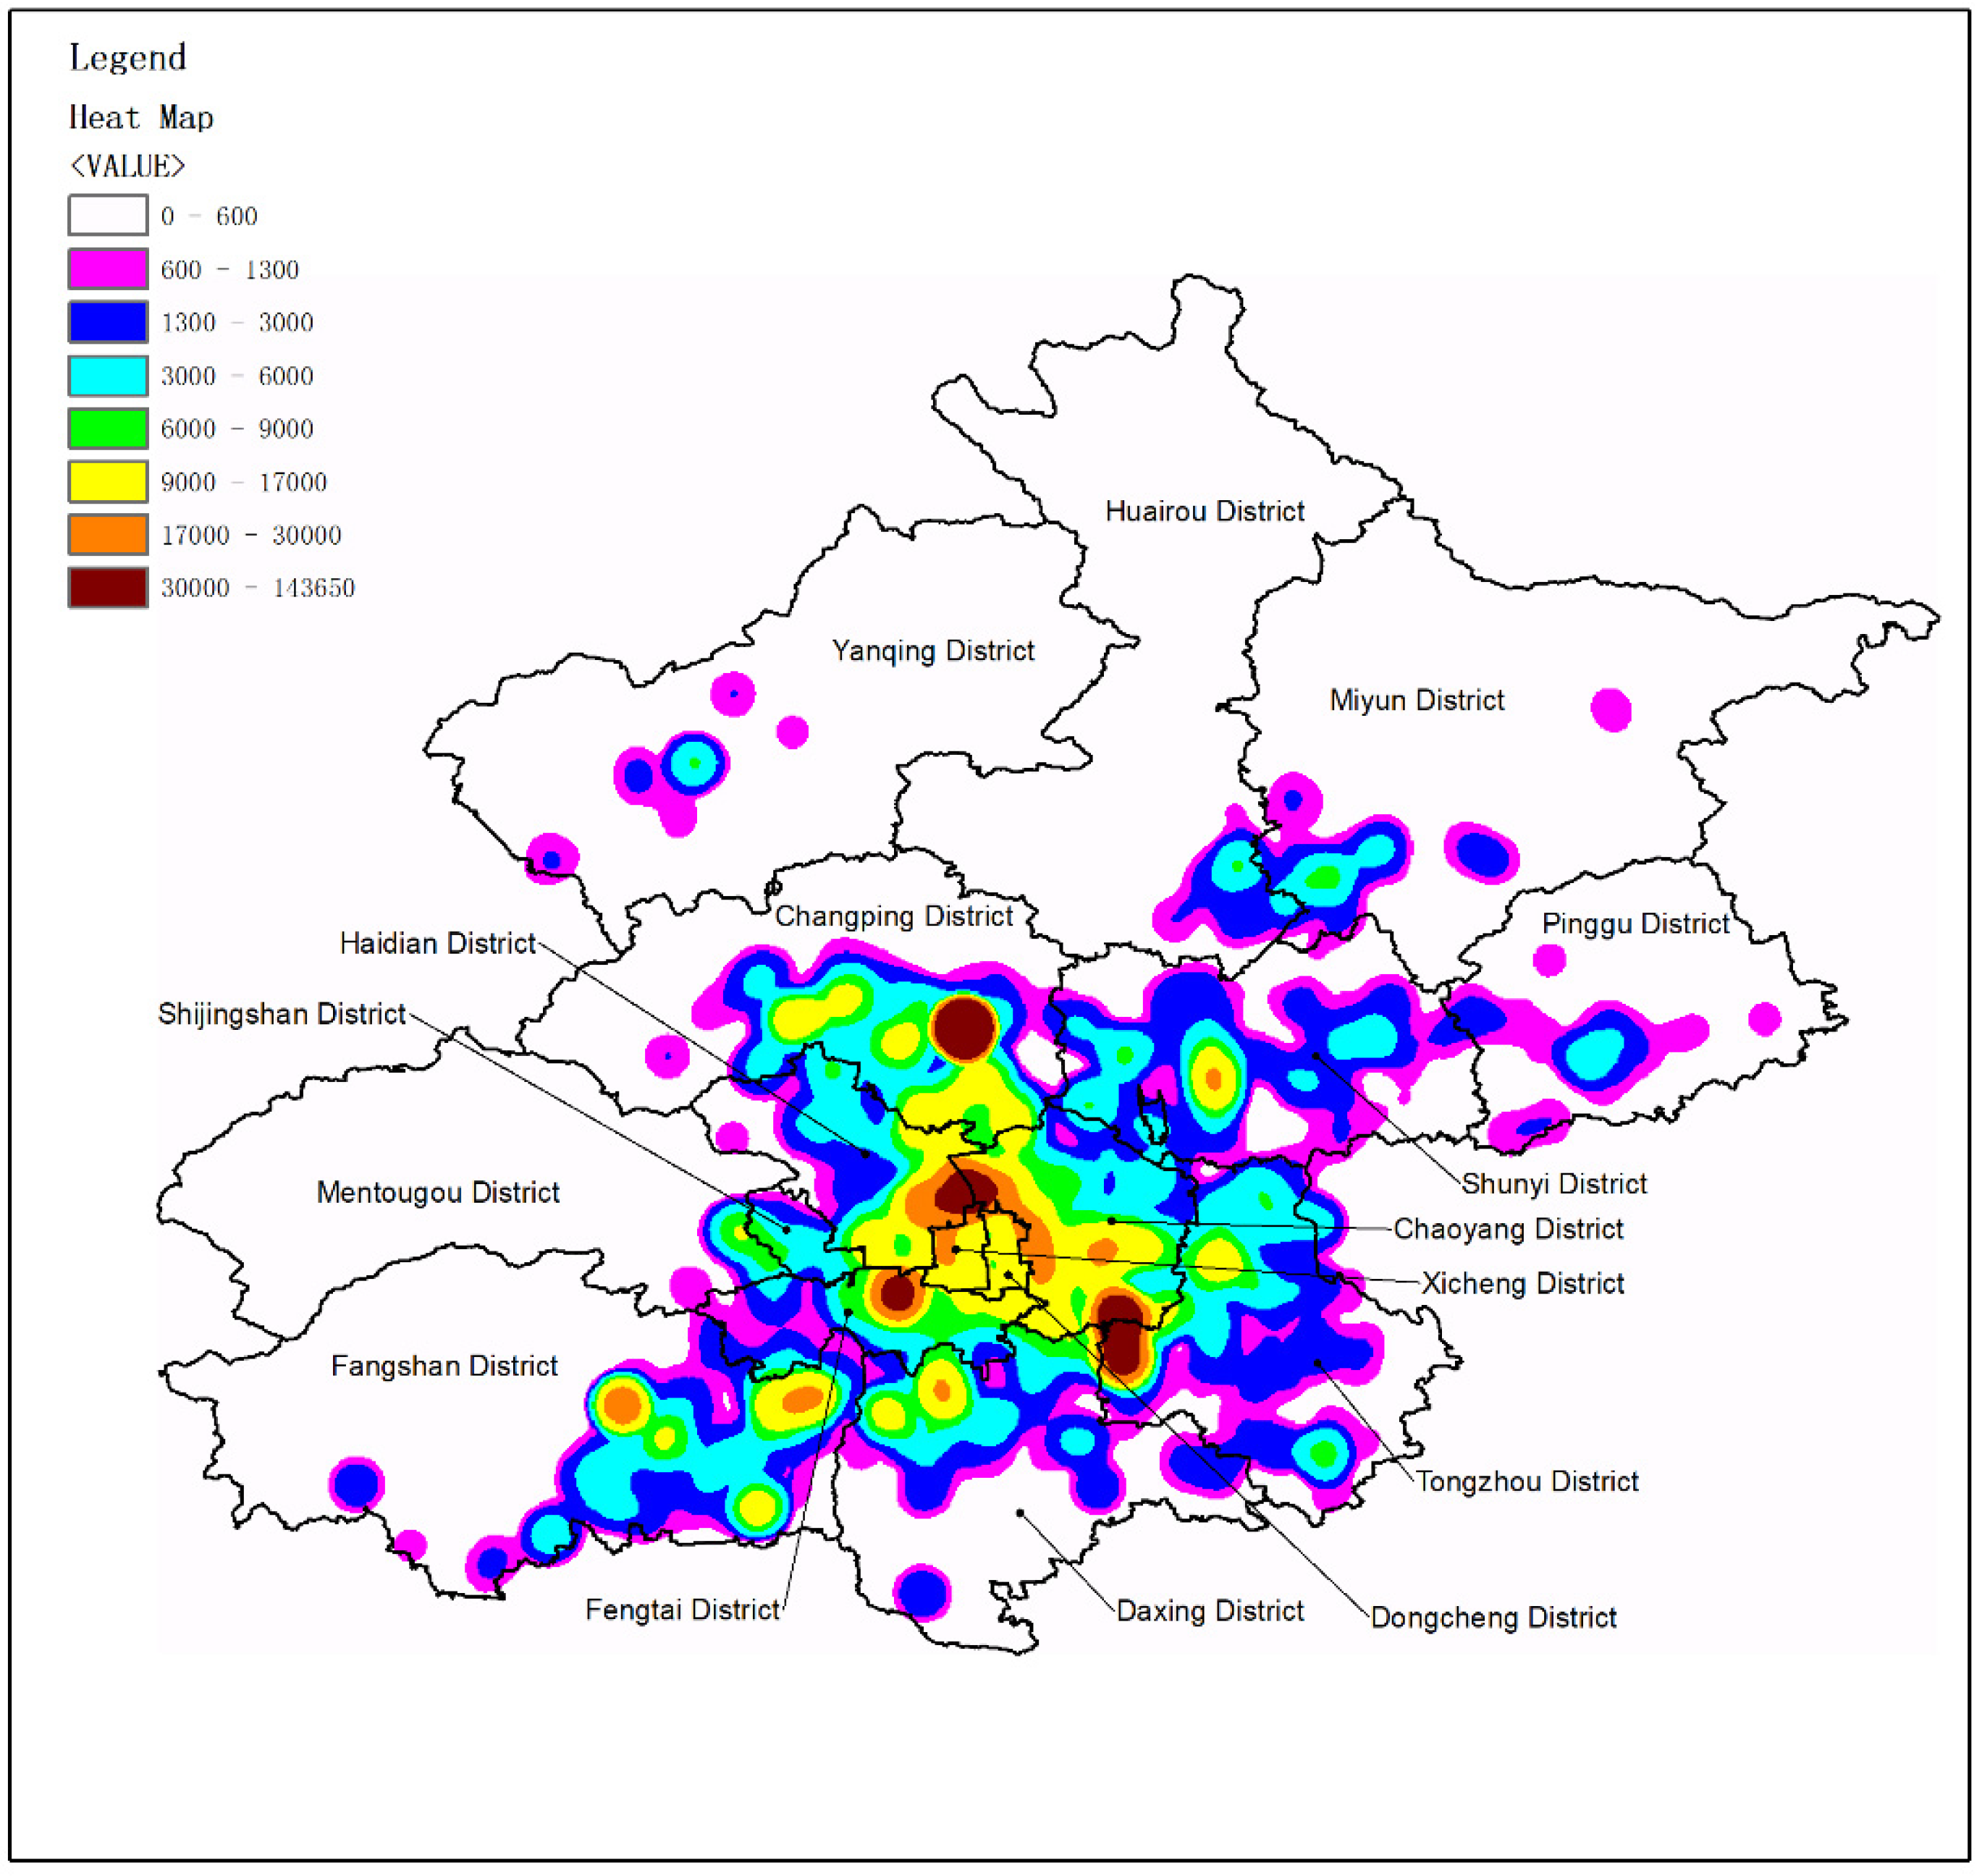
The figure shows that 15 townships (streets) in the Daxing District, 13 townships in the Tongzhou District, and 10 townships in the Chaoyang District are the districts with the highest number of listed complaints and the most intensive distribution of ranking in each statistical month, proving that these three districts have the source of regular air pollution. Therefore, in this study, we verified the relationships between changes in regional air environment quality and complaints by further analyzing the types of complaints and differences in complaint distribution among the listed townships (streets) in these three districts and exploring the main causes affecting the regional air environment.
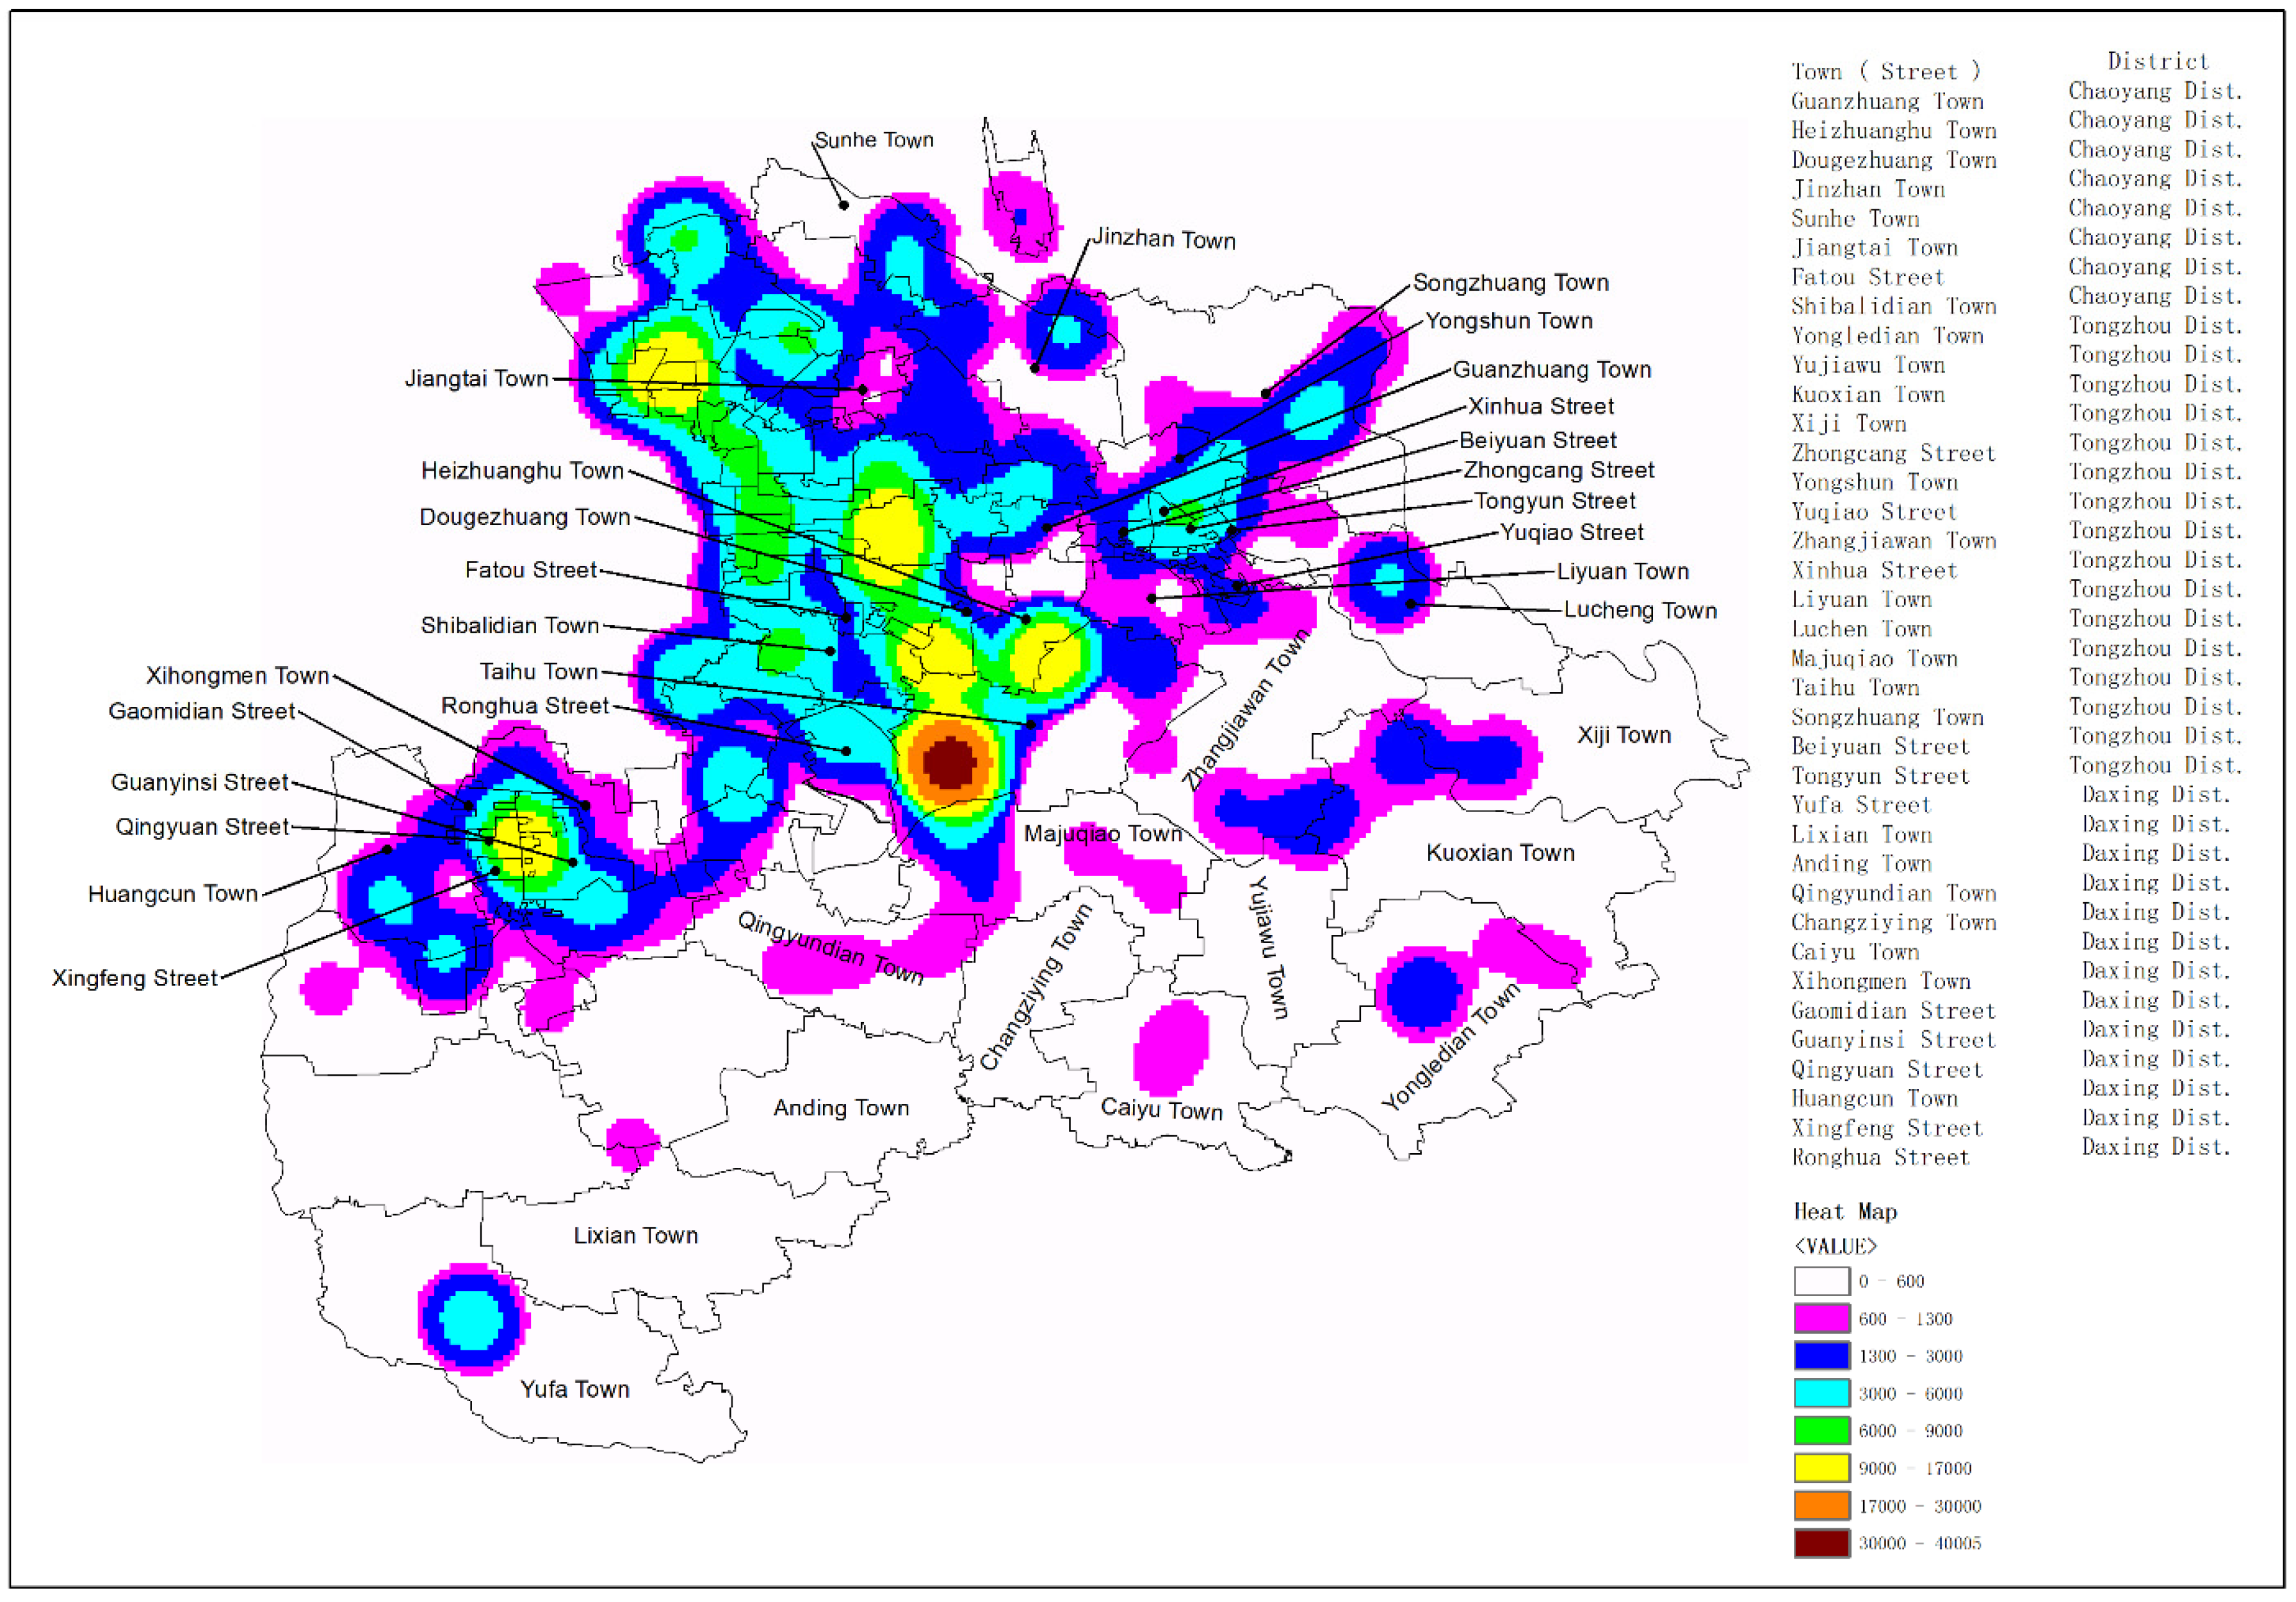
Using the kernel density analysis function of GIS, in this study, we combined the complaint time and extracted complaint information in the data to produce a heat distribution map of air pollution complaints in the Daxing, Tongzhou, and Chaoyang Districts in 2019, and marked the top ten townships (streets) in these three districts on the 2019 Beijing TSP concentration ranking list on the map.
As shown in 
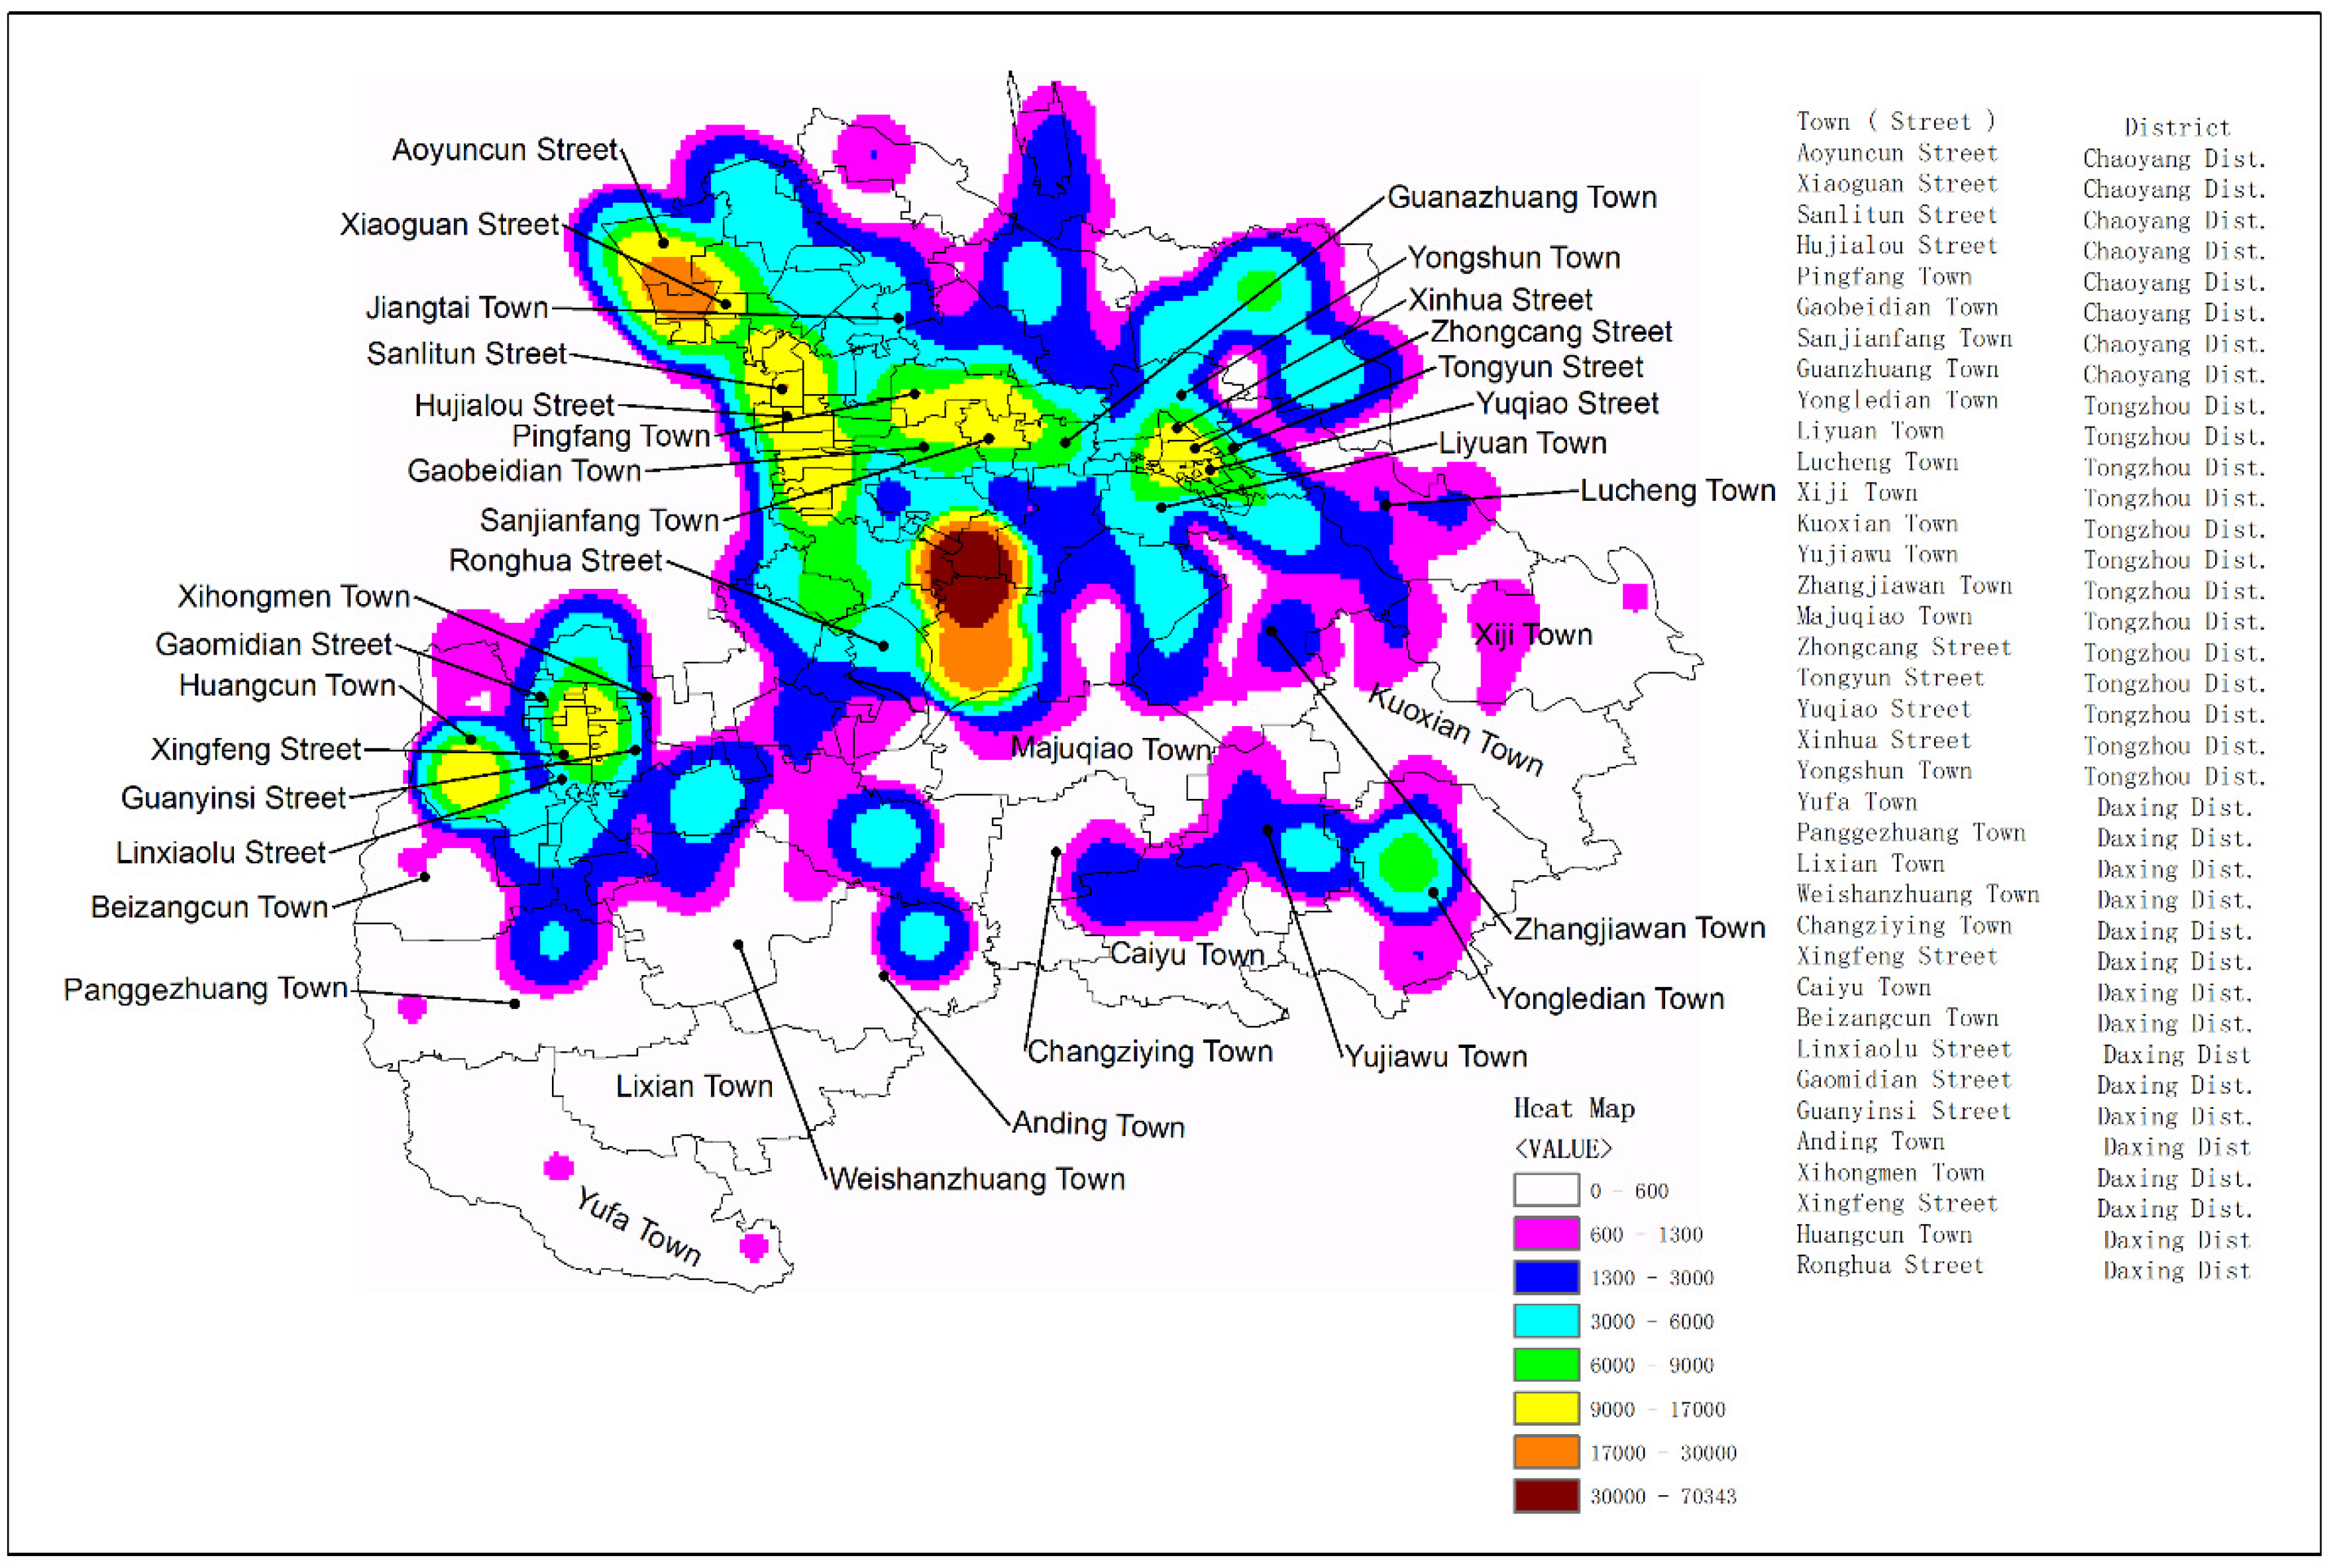
Figure 5 below, the distribution trend of complaint-intensive areas is reflected in three areas from the Chaoyang District to the northwestern Tongzhou District including the Ronghua Street area in the Daxing District Economic Development Zone, Caiyu town, and Changziying Town in the Daxing District, Yujiagou Town and Yongledian Town area in the Tongzhou District, and the Daxing District from Gaomidian Street in the north to Panggezhuang Town area in the south.
In the intensive complaint area from the Chaoyang District to the northwest of Tongzhou District, including Ronghua Street in the Daxing Economic Development Zone, the top 10 townships (streets) in terms of TSP concentration ranking list with more intensive complaints include Olympic Village Street, Xiaoguan Street, Sanlitun Street, and Hujialou Street in the Chaoyang District; Pingfang Town; Gaobeidian Town; Sanjianfang Town and Guanzhuang Town in the Chaoyang District; and six streets including Xinhua Street, Zhongcang Street, and Yuqiao Street in the Tongzhou District. In these densely populated and economically active complaint-intensive areas, 43% of the complaints were about restaurant fume pollution, 21% were about waste gas pollution and 17% were about mobile source pollution. The above three categories were the top three complaint types, which mainly encompassed the catering, urban heating, auto repair, and domestic service industries. In Ronghua Street, Daxing Economic and Technological Development Zone, the number of complaints about waste gas pollution accounted for 50% of the total number of complaints, mainly for the manufacturing industry. The southern part of the area has some areas of intensive complaints due to the construction of a general waste treatment plant and landfill site there, which has been repeatedly complained about by the affected residents in the vicinity.
Caiyu Town and Changziying Town in the Daxing District, and Yujiawu Town and Yongledian Town in the Tongzhou District are the areas where complaints about dust pollution and waste disposal pollution are mainly concentrated, accounting for 70% of the total number of complaints. The intensive complaint area within the Daxing District from Gaomidian Street in the north to Panggezhuang Town in the south is a densely populated area, yet its type of economic activities is different from that of the city center, with 96% of the complaints about restaurant fume pollution and waste gas pollution, mainly concentrated in the catering, auto repair, printing, and some small manufacturing industries.
In contrast, other areas, including the Tongzhou District, have only a sporadic distribution of complaints on its list of towns and streets, mainly due to the distribution of the production of waste gas and dust pollution of small manufacturing enterprise, and part of the production of odor pollution farms in this area. Numerous pollution complaints within Anding Town in the Daxing District were mostly about the landfill site within the town. Yufa Town and Lixian Town in the Daxing District had fewer complaints, mainly due to the distribution of active activities such as construction works and dust-generating sites, straw burning, etc.
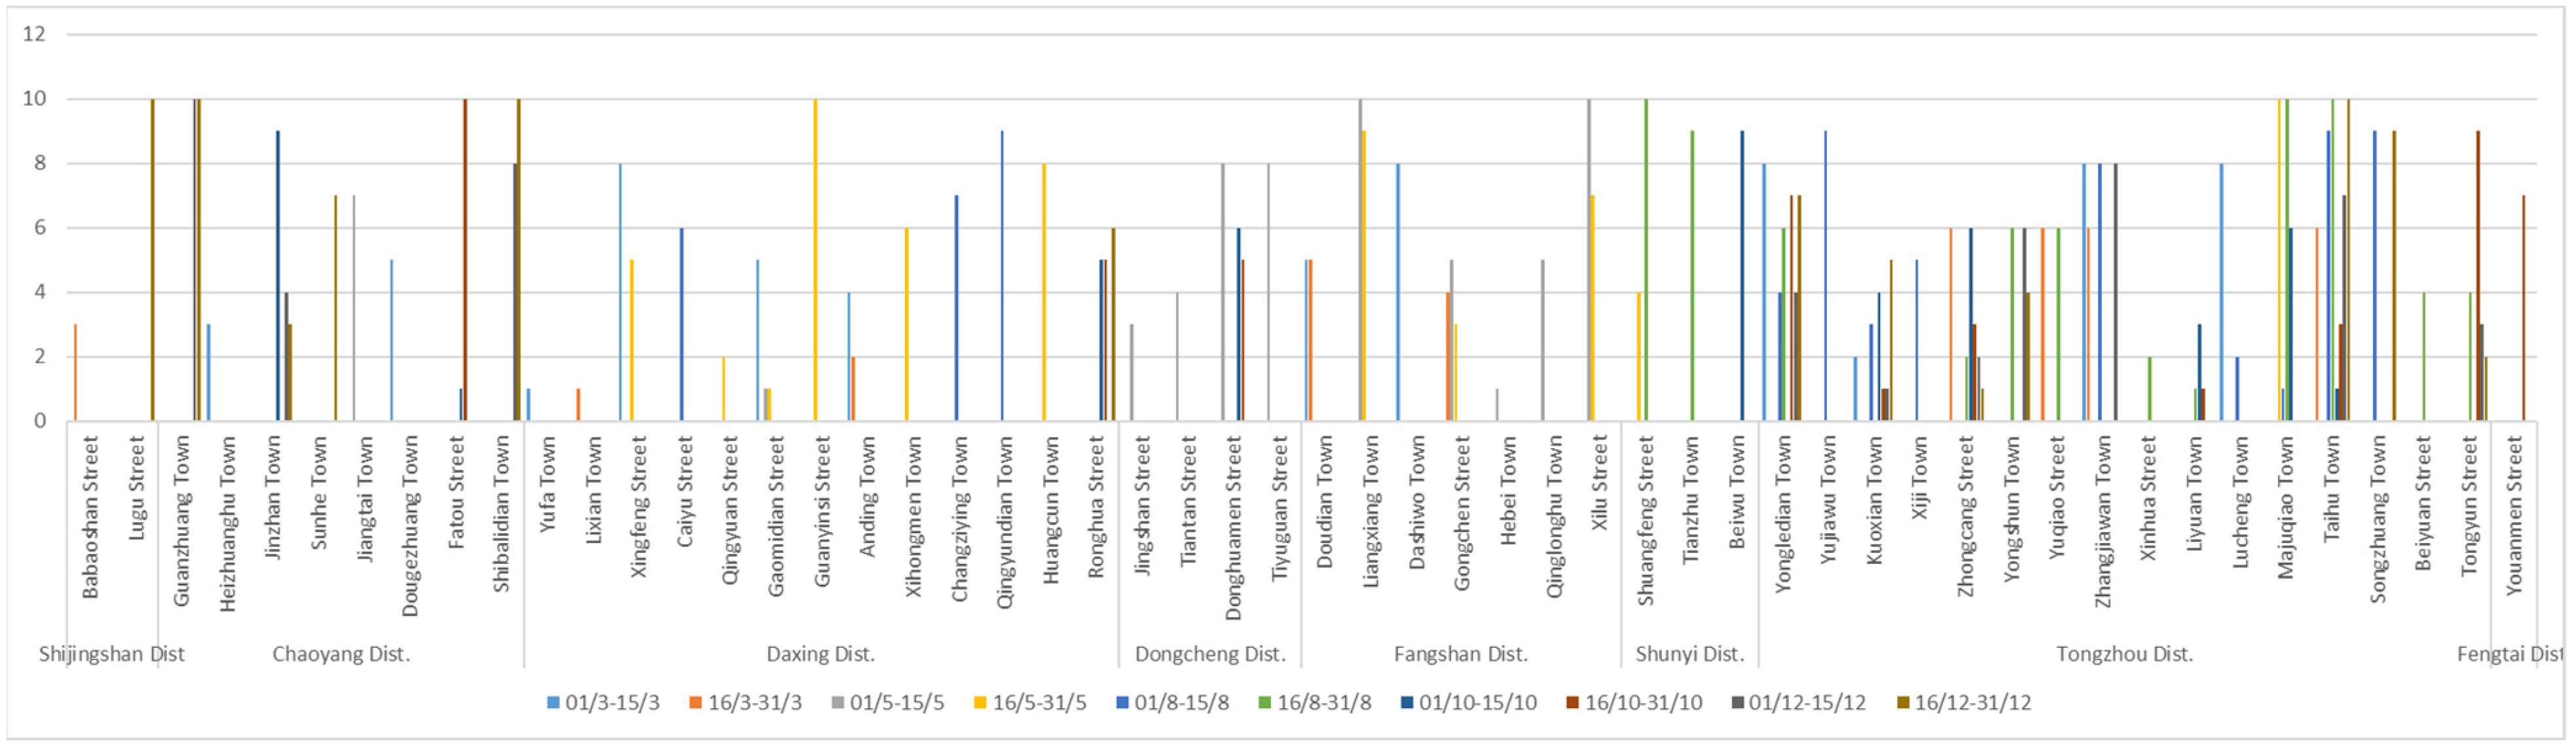
Analysis of the data for the first and second half of March, May, August, October, and December of 2020 indicates that the Daxing, Tongzhou, and Chaoyang Districts have 13, 16, and 8 townships (streets) on the list, respectively, and the three aforementioned districts are also the districts with the highest number on the list (Figure 6). As compared with the data for 2019, the Tongzhou District has the most intensive distribution of ranking data among the statistical months. The overall ranking shows similar distribution characteristics of TSP concentration as in 2019. Taking into account the characteristics of the TSP concentration ranking list, we further analyzed the differences in the types of complaints and specific situations in the townships (streets) in the three districts.
Using the kernel density analysis function of GIS, the heat distribution maps of air pollution complaints in the Daxing, Tongzhou and Chaoyang Districts in 2020 were produced, and the top 10 townships (streets) of these three districts on the ranking list of TSP concentration in Beijing in 2020 are marked on the map. As shown in Figure 7 below, the intensity of economic activities in Beijing is lower in 2020 due to the COVID-19 epidemic, and the number of complaints is lower as a consequence. Therefore, the intensity of air pollution complaints in 2020 is weaker than in 2019, but there is little change in the overall distribution trend.
The distribution trend of the complaint-intensive area is reflected in the northwest of the Chaoyang District to the Tongzhou District, including the Ronghua Street area of the Daxing District Economic Development Zone, some townships (streets) in the northern part of the Daxing District, and townships in the Tongzhou District, such as Xiji Town, Kuoxian Town, and Zhangjiawan Town. In addition, there are sporadic complaint areas in the Daxing District and the southern part of the Tongzhou District.
It can be seen from the map that intensive complaint area extends from the Chaoyang District to the northwest of the Tongzhou District, including Ronghua Street in the Daxing District Economic Development Zone; in this area, Heizhuanghu Town, Dougezhuang Town, and Guanzhuang Town, in the Chaoyang District, and Taihu Town, Zhongcang Street, and Xinhua Street, in the Tongzhou District are listed in the top 10 townships (streets) of the TSP concentration ranking list. The proportion of complaint types in the area is distributed as follows: 40% of complaints about dust pollution, and 54% of complaints about garbage disposal pollution, waste gas pollution, and restaurant fumes pollution.
The listed township (street) intensive complaint area is mainly located in the junction area of the Chaoyang District and Tongzhou District, where the main economic activities are catering, urban heating, auto repair and painting, garbage disposal, domestic services, and other pollution industries. Among the complaints from Rong Hua Street, in the Daxing Economic Development Zone and from Taihu Town, in the Tongzhou District, 43.5% were about waste gas pollution, 22.3% were about dust pollution, and 18.8% were about odor pollution, with the above complaints mainly targeting manufacturing, landfill and resource recycling treatment, and farming.
The intensive complaint area in the northern part of the Daxing District includes six townships (streets) on the TSP concentration ranking list, such as Gaomidian Street and Qingyuan Street. In these areas, complaints about restaurant fumes, dust, and waste gas pollution accounted for 79% of the total complaints, which were mainly from catering, auto repair, printing, and some small manufacturing industries.
Other areas in the intensive complaint areas included Xiji Town, Kuoxian Town and Zhangjiawan Town of the Tongzhou District. Complaints in these areas were mainly concentrated on waste gas, dust, and odor pollution generated by the processing and manufacturing industries. In Yongledian Town of the Tongzhou District and Qingyundian Town of the Daxing District, complaints were mainly about waste gas and odor pollution from waste disposal.
There were also sporadic complaints against villages in townships (streets) on the TSP concentration ranking data list, such as Lucheng Town and Majuqiao Town in the Tongzhou District and Caiyu Town and Yufa Town in the Daxing District, which were mainly about waste gas, dust, and odor pollution generated by small- and medium-sized manufacturing, farming, and catering industries.
There were fewer complaints in 2020 from Anding Town, Changziying Town, and Lixian Town in the Daxing District, Yujiawu Town in the Tongzhou District, and several other townships (streets) on the list, which were mainly polluted by waste gas, dust, and odor from manufacturing, construction projects, and aquaculture in the area. Furthermore, the abovementioned area is also vulnerable to cross-regional pollution as it borders on Hebei Province. Nevertheless, due to the sparse distribution of the population in the area and the lack of rights protection awareness among local residents, the number of complaints in the area is low despite the poor environmental quality.
On the basis of analysis of the TSP concentration ranking data and complaint hotspots in major townships (streets) in 2019 and 2020, most of the top 10 townships (streets) in terms of TSP concentration in these two years were located in areas with an intensive distribution of complaints, proving that the public was more sensitive to changes in regional environmental quality and prone to complain about conventional sources of pollution in their vicinity. However, due to different areas the public lived, their different levels of education, and awareness of rights, as well as the diffuse nature of air pollution, the density of complaints was unevenly distributed in different areas, with different distributions of complaints about different types of pollution.

5. Conclusions

To address the problem that existing air pollution investigations cannot discover the regional frequent air pollution events in a timely manner, in this study, we used the BERT+CRF model deep learning method to realize the classification of air pollution complaint text, by extracting names, addresses, and complaint times of air pollution complaint points in Beijing, to obtain the information of the names, addresses, and complaint times of complaint points and complaint types, and to spatialize and analyze the complaint information. Combined with the TSP concentration ranking of townships (streets) in Beijing in the same period, the analysis showed that the slightly poorer air environment quality of the region also has a slightly higher frequency of complaints. Taking into account the sensitivity of the public to air pollution sources, the differences in complaint types and distribution characteristics of complainants in different geographical areas, and the different forms of economic activities, the results of this study can provide direction for subsequent air pollution enforcement and improve the efficiency of law enforcement.

Author Contributions

Conceptualization, X.W. and Y.Z.; data curation, X.W.; funding acquisition, Y.Z., X.Z. and H.X.; investigate, X.W.; formal analysis, X.W., investigation, X.W.; methodology, X.W.; project administration, Y.Z.; resources, X.W. and H.X.; software, X.W., Q.C. and H.Z.; supervision, Y.Z., X.Z. and H.X.; validation, X.W.; visualization, X.W.; writing—original draft preparation, X.W.; writing—review and editing, Y.Z., H.Z. and T.Z. All authors have read and agreed to the published version of the manuscript.

Funding

This research was funded by the National Natural Science Foundation of China (grant number 42050101); the Strategic Pilot Science and Technology Project of Chinese Academy of Sciences (Class A) (grant number XDA23100100), and the Pre-research project of the Ministry of Ecology and Environmental of China for coordinated prevention and control for compound pollution of O3 and PM 2.5 (grant number DQGG202034).

Institutional Review Board Statement

Not applicable.

Informed Consent Statement

Not applicable.

Data Availability Statement

In this article, TSP concentration data and Beijing air pollution complaint data are downloaded from the website of the Beijing Municipal Ecology and Environment Bureau, http://sthjj.beijing.gov.cn/bjhrb/index/index.html (accessed on 29 April 2022).

Conflicts of Interest

The authors declare no conflict of interest.

References

  1. Pantavou, K.; Lykoudis, S.; Psiloglou, B. Air Quality Perception of Pedestrians in an Urban Outdoor Mediterranean Environment: A Field Survey Approach. Sci. Total Environ. 2017, 574, 663–670. [Google Scholar] [CrossRef] [PubMed]
  2. Zheng, X.; Wang, F.; Jiang, W.; Zheng, X.; Wu, Z.; Qiao, X.; Meng, Q.; Chen, Q. Construction and spatio-temporal derivation of hazardous chemical leakage disaster chain. Int. J. Image Data Fusion 2021, 12, 335–348. [Google Scholar] [CrossRef]
  3. Zhang, Y.; Li, Y.B.; Zheng, X. Spatial and temporal analysis of network public opinion evolution of typhoon “Mangkhut” based on Weibo data. J. Shandong Univ. (Eng. Sci.) 2020, 50, 118–126. [Google Scholar] [CrossRef]
  4. Chen, X.S.; Chang, T.Y.; Wang, H.Z.; Zhao, Z.L.; Zhang, J. Spatial and temporal analysis on public opinion of epidemic situation about novel coronavirus pneumonia based on micro-blog data. J. Sichuan Univ. (Nat. Sci. Ed.) 2020, 57, 409–416. [Google Scholar] [CrossRef]
  5. Wang, Y.; Li, H.; Wang, T.; ZHU, J. The Mining and Analysis of Emergency Information in Sudden Events Based on Social Media. Geomat. Inf. Sci. Wuhan Univ. 2016, 41, 290–297. [Google Scholar] [CrossRef]
  6. Alves, A.L.F.; de Souza Baptista, C.; Firmino, A.A.; de Oliveira, M.G.; de Paiva, A.C. A Spatial and Temporal Sentiment Analysis Approach Applied to Twitter Microtexts. J. Inf. Data Manag. 2015, 6, 118–129. [Google Scholar]
  7. Zhang, C.; Ma, X.Y.; Zhou, Y.; Guo, R. Analysis of Public Opinion Evolution in COVID-19 Pandemic from a Perspective of Sentiment Variation. J. Geo-Inf. Sci. 2021, 23, 341–350. [Google Scholar] [CrossRef]
  8. Han, K.; Xing, Z.; Liu, Z.; Liu, J.; Zhang, X. Research on Public Opinion Analysis Methods in Major Public Health Events: Take COVID-19 Epidemic as an Example. J. Geo-Inf. Sci. 2021, 23, 331–340. [Google Scholar] [CrossRef]
  9. Xie, T.; Yang, J.A.; Liu, H. Chinese Entity Recognition on BERT-BiLSTM-CRF Model. National University of Defense Technology. Comput. Syst. Appl. 2020, 29, 48–55. [Google Scholar] [CrossRef]
  10. Tian, Y.; Jiang, Y.; Liu, Q.; Xu, D.; Zhao, S.; He, L.; Liu, H.; Xu, H. Temporal and spatial trends in air quality in Beijing. Landsc. Urban Plan. 2019, 185, 35–43. [Google Scholar] [CrossRef]
  11. Devlin, J.; Chang, M.W.; Lee, K.; Toutanova, K. BERT: Pre-training of deep bidirectional transformers for language understanding. arXiv 2018, arXiv:1810.04805,2019. [Google Scholar]
  12. Chen, J.; He, T.; Wen, Y.Y.; Ma, L.T. Entity Recognition Method for Judicial Documents Based on BERT Model. J. Northeast. Univ. (Nat. Sci.) 2020, 41, 1382–1387. [Google Scholar] [CrossRef]
  13. Cai, W.X.; LI, X.D. Sentiment Analysis of Scenic Spot Comments Based on BERT. J. Guizhou Univ. 2021, 38, 57–60. [Google Scholar] [CrossRef]
  14. Wang, C.T.; Ding, L.K.; Yang, X.X.; Hu, Q. Recognition of named entity in Chinese e-resume based on BERT. China Sci. 2020, 39, 71–77. [Google Scholar]
  15. Lafferty, J.D.; McCallum, A.; Pereira, F.C.N. Conditional random fields: Probabilistic models for segmenting and labeling sequence data. In Proceedings of the 18th International Conference on Machine Learning, San Francisco, CA, USA, 28 June 2001; pp. 282–289. [Google Scholar]
  16. Wu, J.H.; Hu, L.Y.; Zhao, Y.; Dai, P.; Xiong, J.Q. Method of Finely Identifying Spatio-temporal Information of Emergencies from Weibo Based on BiLSTM-CRF and Classified-Hierarchical Annotation. Geogr. Geo-Inf. Sci. 2021, 37, 1–8. [Google Scholar] [CrossRef]
Figure 1. Input representation of the BERT model.
Atmosphere 13 01023 g001
Figure 2. ROC curve graph for the prediction classification of complaint text. (Class 0 is uncategorized, Class 1 is waste gas pollution, Class 2 is restaurant fumes, Class 3 is waste gas pollution, Class 4 is garbage disposal pollution, Class 5 is waste gas pollution, Class 6 is dust pollution, Class 7 is waste gas pollution, Class 8 is odor pollution, Class 9 is waste gas pollution, Class 10 is mobile source pollution).
Atmosphere 13 01023 g002
Figure 3. Heat distribution of air pollution complaints in Beijing from 2019 to 2020. (Data source: http://sthjj.beijing.gov.cn/bjhrb/index/12369z/tsjb93/index.html, accessed on 29 April 2022).
Atmosphere 13 01023 g003
Figure 4. Top 10 townships (streets) in Beijing in 2019 in terms of TSP concentration ranking list. (Data source: http://sthjj.beijing.gov.cn/bjhrb/index/ztzl/ycwrgk3/ycwrgk/index.html, accessed on 29 April 2022).
Atmosphere 13 01023 g004
Figure 5. Heat distribution of air pollution complaints in the Daxing, Tongzhou and Chaoyang township (street) in 2019. (Data source: http://sthjj.beijing.gov.cn/bjhrb/index/12369z/tsjb93/index.html, accessed on 29 April 2022).
Atmosphere 13 01023 g005
Figure 6. Top 10 townships (streets) in Beijing in 2020 in terms of TSP concentration ranking list. (Data source: http://sthjj.beijing.gov.cn/bjhrb/index/ztzl/ycwrgk3/ycwrgk/index.html, accessed on 29 April 2022).
Atmosphere 13 01023 g006
Figure 7. Heat distribution of air pollution complaints in townships (streets) in the Daxing, Tongzhou and Chaoyang Districts in 2020. (Data source: http://sthjj.beijing.gov.cn/bjhrb/index/12369z/tsjb93/index.html, accessed on 29 April 2022).
Atmosphere 13 01023 g007
Table 1. Parameter setting of BERT+CRF model.
ParameterValueParameterValue
Max length256Batch size64
Learning rate5 × 10−5Gradient_accumulation_steps1.0
Weight decay0.0Dropout rate0.1
Table 2. Results of the experiment.
ModelAPRF
BERT+CRF0.940.720.810.76
Table 3. Statistical results of air population complaint types (unit, case).
Complaint TypeValueComplaint TypeValue
Dust pollution628Odor pollution263
Waste gas pollution693Mobile source pollution 214
Restaurant fumes pollution 887Garbage disposal pollution 618
Publisher’s Note: MDPI stays neutral with regard to jurisdictional claims in published maps and institutional affiliations.

