Abstract
Aftertreatment technologies in Tier 4 off-road engines have resulted in significant emission reductions compared to older tier engines without aftertreatments. The appropriate characterization of Tier 4 engine emissions in consideration of aftertreatment operation is important for projecting emissions and developing mitigation strategies. The current method of aggregating emissions over an entire duty cycle and averaging them by engine load has a limitation in developing emission profiles over various duty cycles of Tier 4 engines, especially at low-load operations, where aftertreatment control for NOx may not be effective. In this study, an engine power binning method was developed to characterize emissions for Tier 4 construction equipment with aftertreatment systems, especially at low-power operating conditions. This binning method was applied to real-time emissions and activity data for four different types of Tier 4 construction equipment. Results show that low-power operations (<20% engine power) are responsible for 38–60% NOx and 11–51% of PM2.5 emissions depending on the equipment types. These results underscore the need for controlling NOx emissions during low-power operations. PM2.5 EFs for non-DPF backhoes were one to two orders of magnitude greater than all the other equipment due to the lack of a DPF, despite being certified to the same PM2.5 standard. This shows the benefits of DPFs on construction equipment and that they are substantial in reducing PM2.5 emissions. Estimated emission differences between using the binning and the averaging methods were 49–86% and 16–82% for NOx and PM2.5, respectively. These differences may change once the binning method is applied to larger emission datasets obtained from real-world vocational activities.
1. Introduction
Mobile sources are considered significant contributors to NOx and PM2.5 emissions in California [1], as well as nationwide [2]. A recent study has shown that an increase of 10 μg/m3 in PM2.5 concentration is associated with a 1% increase in the risk of death [3]. NOx is a strong oxidizing agent and contributes to ground-level ozone and secondary PM2.5 formation [4,5]. Epidemiological studies have shown that ground-level ozone causes a decrease in lung function and has been associated with adverse respiratory health effects [6,7,8]. It is critical to continue to control mobile source NOx and PM2.5 to reduce their adverse health effects.
Within the mobile source sector, off-road equipment contributes to a considerable portion of NOx and PM2.5. A recently released United States Environmental Protection Agency (US EPA) national emission inventory suggests that off-road diesel equipment is estimated to be the third largest source of NOx emissions and the second largest source of PM2.5 emissions, representing 14.5% and 24.3% of total mobile source emissions, respectively [2]. In California, the off-road sector accounted for 15% of NOx and 20% of PM2.5 emissions from mobile sources in 2020 [9]. Off-road engines also have relatively long lifespans compared to on-road engines, often related to rebuilding engines due to the high replacement cost, especially for specialized equipment types. It is also expected that the contribution of off-road sources will continue to increase as on-road emissions continue to decrease due to stricter on-road emission regulations, and the longer lifespan of off-road equipment. Thus, reducing off-road emissions is one of the crucial steps to improve national and regional air quality.
To control emissions from off-road equipment, the US EPA and the California Air Resources Board (CARB) have adopted and implemented various regulations and incentive programs for decades. For example, the most recent tier of off-road diesel engine emission standards (known as Tier 4) resulted in an approximately 90 percent emission reduction from the previous standards. Such emission reductions are due in part to the utilization of aftertreatment technologies with Tier 4 equipment, such as selective catalytic reduction (SCR) and diesel particulate filters (DPFs) for controlling NOx and PM2.5 emissions, respectively. The benefits of replacing older off-road engines with Tier 4 engines will likely result in significant emission reductions estimated at 738,000 tons for NOx and 129,000 tons for PM2.5 by 2030 nationwide [10]. Consequently, the US EPA has projected that 12,000 premature deaths could be prevented annually due to the implementation of the Tier 4 standards nationally [10].
Since Tier 4 off-road equipment is replacing older tier equipment, it is important to characterize their emissions properly to inform accurate emission reductions. Unlike the older tier engines that relied on engine control technologies only, Tier 4 engine emissions are controlled by both engine and aftertreatment control technologies. Therefore, the current emission estimation method of averaging emissions over an entire duty cycle would not reveal the characteristics of Tier 4 engine emissions that depend on both engine and aftertreatment operation conditions. NOx and PM2.5 emissions from off-road equipment depend on several factors, including engine size, fuel, operation type and hours, engine and aftertreatment control strategies, age, and maintenance practice. Additionally, engine population, activity, and fleet turnover rates influence the magnitude of NOx and PM2.5 emissions from off-road equipment. Incorporating those factors, the current emission inventory models (NONROAD and OFFROAD) employ equipment populations, the engine emission factors (EFs), engine operation hours, and load factors (LFs) (Equation (1)) to estimate off-road equipment emissions [11,12].
where:
Pop = equipment population;
HP = maximum rated horsepower (hp);
LF = engine load factor;
Activity = annual operation hours (hr);
EF = emission Factor (g/hp-hr).
Engine LFs and EFs, as shown in Equation (1), are important parameters in developing emission inventories. This currently used method employs average LF and EF values across the entire engine operation. This emission estimation method is referred to as the averaging method in this study. The averaging method may not accurately characterize emissions for Tier 4 construction equipment because the underlying assumption of this method is that emissions are linearly correlated with engine power. However, emissions for Tier 4 engines depend on both engine power and aftertreatment operating conditions. Tier 4 construction equipment with aftertreatment control can display different NOx and PM2.5 emission trends with engine power compared to older tier engines without aftertreatment controls [13]. An accurate characterization of emissions for Tier 4 construction equipment is necessary for projecting their emissions and developing emission mitigation strategies where needed. The goal of this study is to develop a new engine power binning method as an alternative approach to estimate emissions from Tier 4 construction equipment with aftertreatment systems. This alternative approach is especially important for low-power operations, where an ineffective SCR operation is reported for the NOx control due to the exhaust temperature being below the catalyst’s optimum range. This study also demonstrates the potential differences in NOx and PM2.5 emissions with a single emission factor using the averaging method compared to multiple emission factors using the new engine power binning method. It is also worth noting that the emission comparison is strictly between two estimation methods with the same real-world construction equipment activity data. This comparison is not comparable to current emission inventory models due to the lack of a myriad of modeling assumptions and corrections.
2. Data Collection and Method Development
2.1. PEMS Emissions Data for Tier 4 Construction Equipment
Instantaneous emissions and engine activity data were collected using portable emissions measurement systems (PEMS) from 12 pieces of Tier 4 construction equipment (Table 1) with aftertreatment controls: both DPF and SCR, or SCR only. These pieces of Tier 4 equipment were expected to have different emission trends than older tier equipment without DPF or SCR. The data were collected while the equipment was undergoing representative vocational activities in a yard [13,14]. Although these tests were not performed at real-world job sites, the performed duty cycles included every aspect of vocational activities that would be expected from each equipment type. Approximately 150 engine parameters and pollutant concentrations were measured, which included engine revolutions per minute (RPM), engine torque, engine power, fuel rate, exhaust temperature (measured after the aftertreatments), and NOx and PM2.5 emission data. Each piece of equipment was tested for 3 to 6 h with a PEMS, which did not obtain sufficient data points to reflect the operation cycle of the equipment. Therefore, engine activity and emissions data from three pieces of the same equipment type (backhoe, crawler dozer, excavator, or wheel loader) were combined for vocation-specific LF and ER calculations. For LFs, ECU-reported engine power data were divided by the rated engine power for each piece of equipment. PEMS data were combined for each equipment type, resulting in four datasets for the backhoe, crawler dozer, excavator, and wheel loader. PM2.5 emission data were combined for each equipment type that was equipped with a DPF. Since none of the backhoes were equipped with DPFs, it was expected that their PM2.5 emission factors would be significantly different from the other three equipment types.

Table 1.
Construction equipment for PEMS testing.
2.2. Real-World Engine Activity Data for Tier 4 Construction Equipment
Separately from the emissions data, real-world engine activity data were collected from eight pieces of Tier 4 construction equipment with DPF and SCR ([14,15]). HEM dataloggers (HEM Corp., Michigan, MI, USA) were used to collect 1 Hz data from the engine control module (ECM), including exhaust temperature, fuel consumption, engine load, and engine speed, as well as global positioning system (GPS) location data. Dataloggers were installed for 4 consecutive weeks for each piece of equipment. Engine activity data from the four types of equipment were selected for this study (Table 2). Using the engine power binning method, engine operation percentages for each bin were quantified and used for a subsequent emission distribution analysis over engine power bins.
Table 2.
Construction equipment for real-world engine activity data collection.
2.3. Engine Power Binning Method Development
An engine power binning method was proposed to characterize LFs and EFs for four types of Tier 4 construction equipment with aftertreatment (DPF + SCR or SCR only), including wheel loaders, excavators, crawler dozers, and backhoes. Second-by-second PEMS data were categorized into eleven engine power bins: ≤5%, 5–10%, 10–20%, 20–30%, 30–40%, 40–50%, 50–60%, 60–70%, 70–80%, 80–90%, and 90–100% engine power. The lowest engine power bin (≤5%) was defined as when the engine power was equal to or less than 5 percent, and the RPM was greater than 300 in this study. PM2.5 and NOx EFs for each bin were calculated based on the sum of emissions divided by the sum of engine power (Equation (2)).
The operation percentage was calculated using the activity data obtained from the real-world operations. NOx and PM2.5 EFs were calculated with the PEMS data for each bin (Equation (2)). For the emission distribution analysis over engine power bins, the operation percentage and EFs were combined using Equation (3).
Using the proposed engine power binning method, changes in emission estimates from the conventional averaging method were also assessed. For each vocational type, the LFs, EFs, and operation % were weighted in the binning-method-estimated emission (Equation (4)). The binning-method-estimated emissions were compared to the emissions estimated with the conventional averaging method (Equation (1)), which only used the average LFs and EFs. For this comparison, only the load factor, emission factor, and operation percentage varied due to different methods, while other parameters were kept constant between methods.
3. Results and Discussion
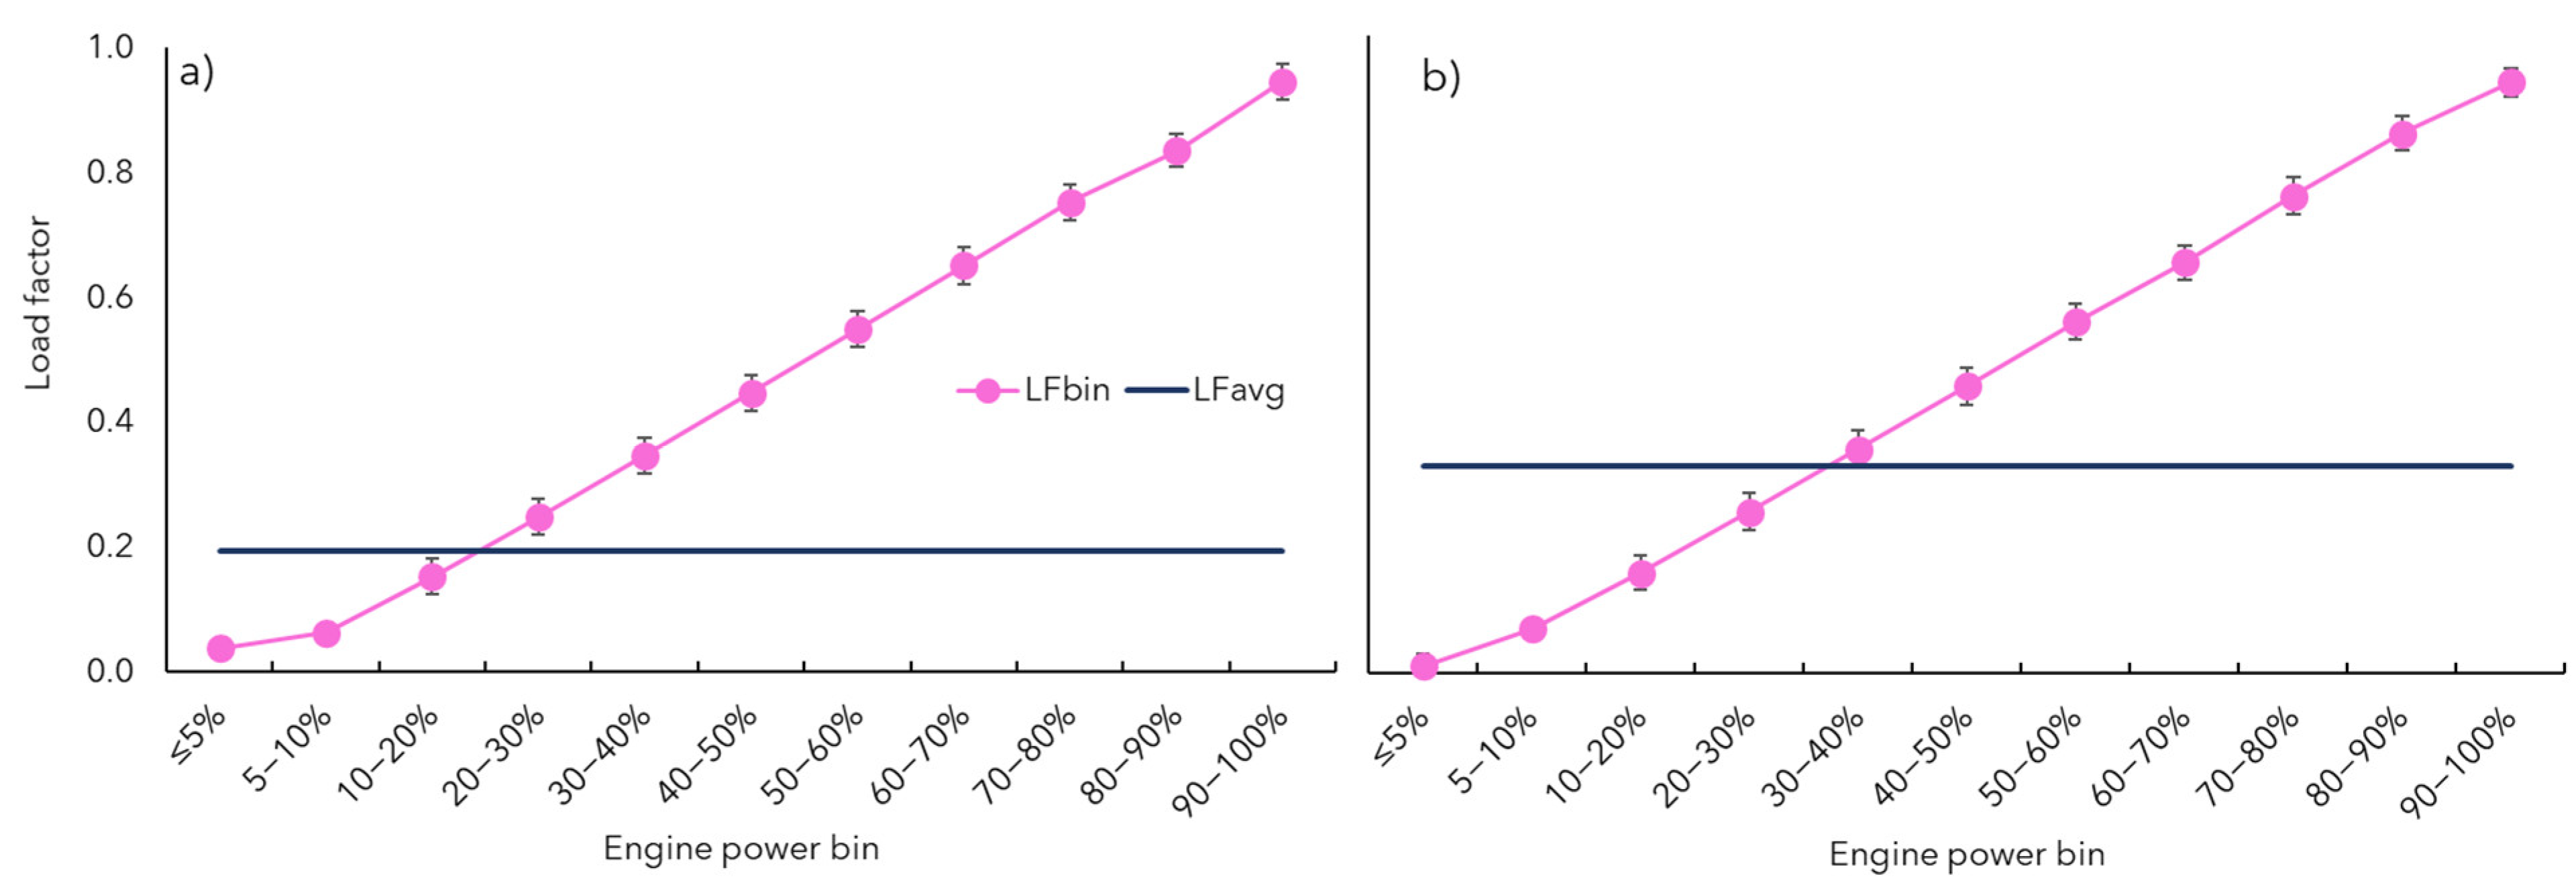
Figure 1 shows a comparison of characterized LFs using the engine power binning and averaging method for wheel loaders and excavators (Figure A1 in Appendix A shows LFs for crawler dozers and backhoes). Engine LFs obtained with engine power bin linearly correlated with engine power. As the engine power increased, it was expected that LFs would increase due in part to the increased fuel consumption (Figure 2a,b for wheel loaders and excavators, respectively). However, the LF produced by the averaging method was flat (navy line) across the changes of engine power and may not appropriately represent engine LFs when applied to Tier 4 equipment emissions.
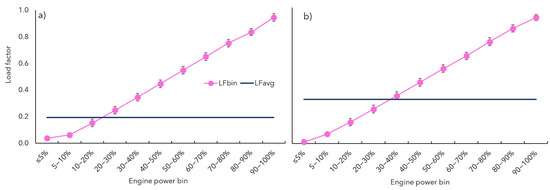
Figure 1.
(a) Wheel loader and (b) excavator load factors based on instantaneous engine power data (LFbin) for each engine power bin and averaged load factor (LFavg).
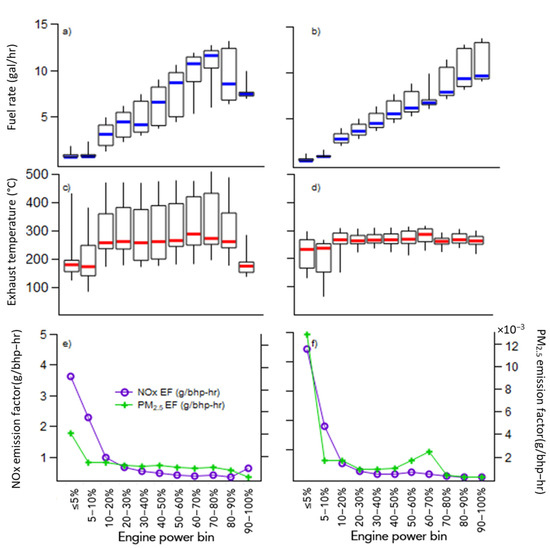
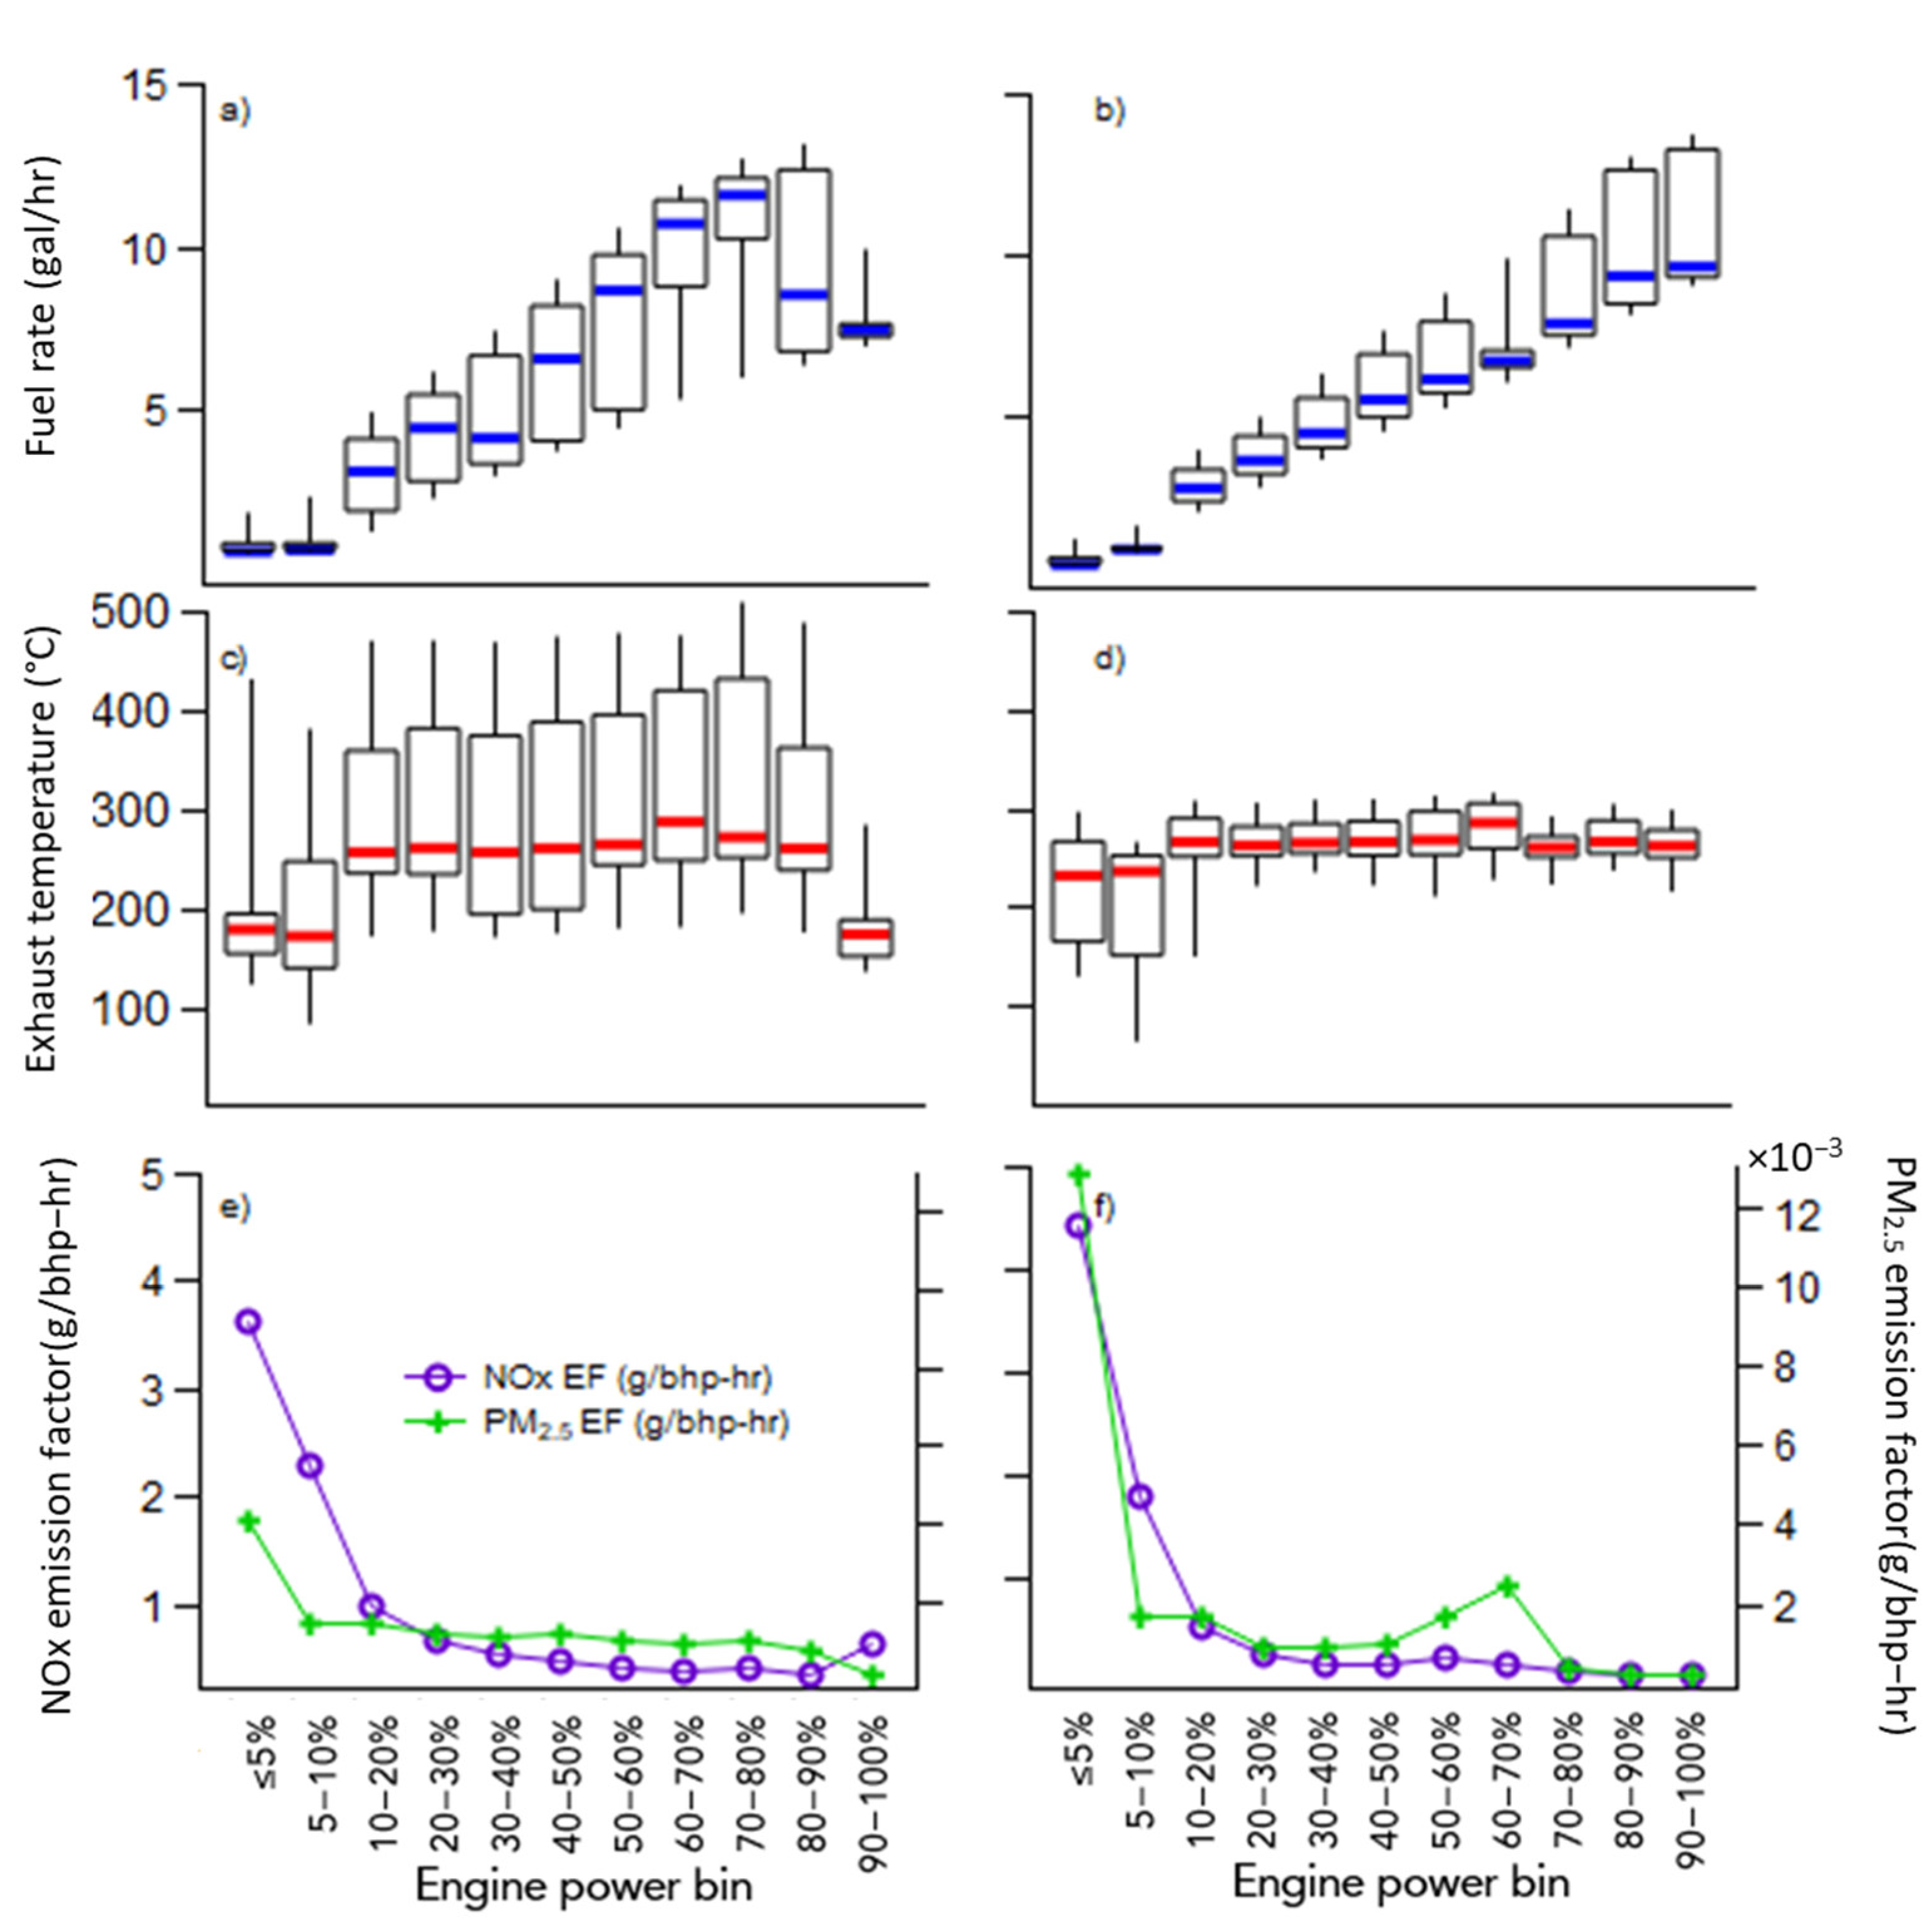
Figure 2.
(a,b) Wheel loader and excavator fuel rates (gal/hr), respectively; (c,d) wheel loader and excavator exhaust temperatures (°C) measured after the aftertreatments, respectively; (e,f) wheel loader and excavator NOx and PM2.5 emission factors, respectively.
The exhaust temperature is an indicator of the effectiveness of a catalyzed aftertreatment in controlling emissions. Hence, characterizing exhaust temperatures with the engine power bin is important to understand PM2.5 and NOx EFs at different engine operating conditions. The aftertreatment technologies for the Tier 4 equipment took the same technology pathway as on-road diesel aftertreatment technologies; therefore, it was expected that higher temperatures would tend to promote faster oxidation of PM2.5 in the diesel oxidation catalyst (DOC) and DPF. Exhaust temperatures over 250 °C would provide optimal conditions to decompose NOx into water and N2 based on the SCR [16]. Figure 2c,d present exhaust temperatures of engine power bins for wheel loaders and excavators, respectively. Red lines show the median temperature at each engine power bin, which maintained very well at a relatively constant temperature of approximately 250 °C. The exhaust temperature seen for these calibrations and activity was slightly lower at low-power conditions, which could lead to inefficient NOx control, especially when current dosing algorithms shut down the DEF injection.
NOx emissions from current Tier 4 control strategies (purple lines in Figure 2e,f) for wheel loaders and excavators, respectively, (Figure A2e,f in Appendix A show NOx EFs for crawler dozers and backhoes) were closely related to the corresponding exhaust temperatures, which were allowed to deviate from the range observed to have good control. NOx EFs were relatively lower when the exhaust temperature was maintained at approximately 300 °C, which indicated an effective SCR operation. As shown in Figure 2f, the excavators had the highest NOx EF at less than 5% engine power, which was more than five times greater than the emission factor at 90–100% engine power. Relatively small amounts of fuel and work associated with this low-power bin had an outsized impact on the inventory. The exhaust temperature at the ≤5% power period was higher than the 5–10% power period, but also had a higher NOx EF for the backhoe (Figure A2d in Appendix A). It may be due to the high RPM, resulting in power take-off (PTO) operations during the ≤5% power operating period. NOx EFs decreased dramatically when the engine power increased from 10% to 30%, and maintained relatively constant EFs between 30% and 100%. This trend was seen for all four types of tested equipment, indicating that these control strategy shortcomings were quite general across these Tier 4 implementations.
NOx emissions for all the tested Tier 4 equipment were expected to be on a similar scale, since all the equipment was equipped with SCR. The highest EFs occurred when the engine power was less than 10%, ranging between 5.5 and 16.5 g/bhp-hr for all the Tier 4 equipment, while NOx EFs maintained a range between 0.1 and 1 g/bhp-hr when the engine power was between 30% and 100%. During a ≤5% engine power period, NOx EFs were expected to be similar for all four types of equipment, given their similar control strategies. However, the crawler dozers had the highest NOx EFs, almost four times the EFs of the other three types of equipment, which could be due to the limited amount of data points (Table A1 in Appendix A) or their unique operating characteristics. The crawler dozers only had 81 seconds of data for the ≤5% engine power period.
PM2.5 emissions (green lines in Figure 2e,f, and Figure A2e,f in Appendix A) for DPF-equipped wheel loaders, excavators, crawler dozers, and non-DPF-equipped backhoes, respectively, were high at low-power operations. For all four types of equipment, PM2.5 EFs decreased an order of magnitude as the engine power increased from ≤5% to 30% and plateaued at an engine power over 30%. However, there was a slight increase in EFs for the excavators and crawler dozers at the 90% to 100% engine power period. The increase in PM2.5 could be associated with more frequent transient high medium- and high-power operations that substantially increased the engine-out PM2.5 and resulted in increased PM2.5 loading on the DPFs. However, this trend should be examined in more detail with a larger emissions dataset collected during real-world vocational activities. Regardless, it is important to note that the highest PM2.5 emissions were observed during low-load operations, with less than 20% engine power, for all equipment types equipped with DPFs.
PM2.5 EFs were expected to be similar for all the equipment that came with DPFs, and much lower than the PM2.5 EF of the equipment without DPFs. In this study, the non-DPF backhoes PM2.5 EFs were one to two orders of magnitude higher than all other equipment due to the lack of a DPF, despite being certified to the same PM2.5 standard. This shows that the benefits of DPFs on construction equipment would be substantial in reducing PM emissions. The highest PM2.5 EFs occurred when the engine power was less than 5%, ranging between 1.3 and 13 * 10−3 g/bhp-hr for all three types of Tier 4 equipment with DPFs. PM2.5 EFs showed lower levels, between 0.2 and 1.2 * 10−3 g/bhp-hr, for all three types of Tier 4 equipment with DPFs when the engine power was between 30% and 100%. More data points could potentially better define the actual distribution of individual PM2.5 EFs emitted while in use.
Figure 3a,b show real-world operation percentages obtained with the engine power bin for the wheel loaders and excavators, respectively (Figure A3 in Appendix A shows operation percentage profiles for crawler dozers and backhoes). Activity profiles were distinctively different between the wheel loaders and excavators.
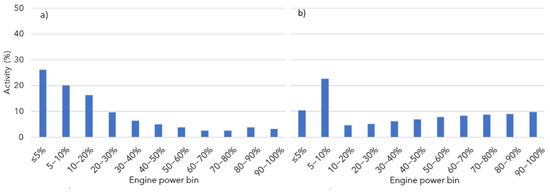
Figure 3.
(a) Wheel loader operation percentage; (b) excavator operation percentage obtained from real-world construction activity data.
Approximately 63% and 38% were low-power activities (<20% engine power) for the wheel loaders and excavators, respectively. Approximately 38% and 66% were low-power activities for the crawler dozers and backhoes, respectively. In general, the activity profiles for all four equipment types included a substantial fraction of activity at or below 20% engine power. When this was coupled with the higher EFs at these lower power periods, it was expected that significant emissions would be contributed during the low-power operations.
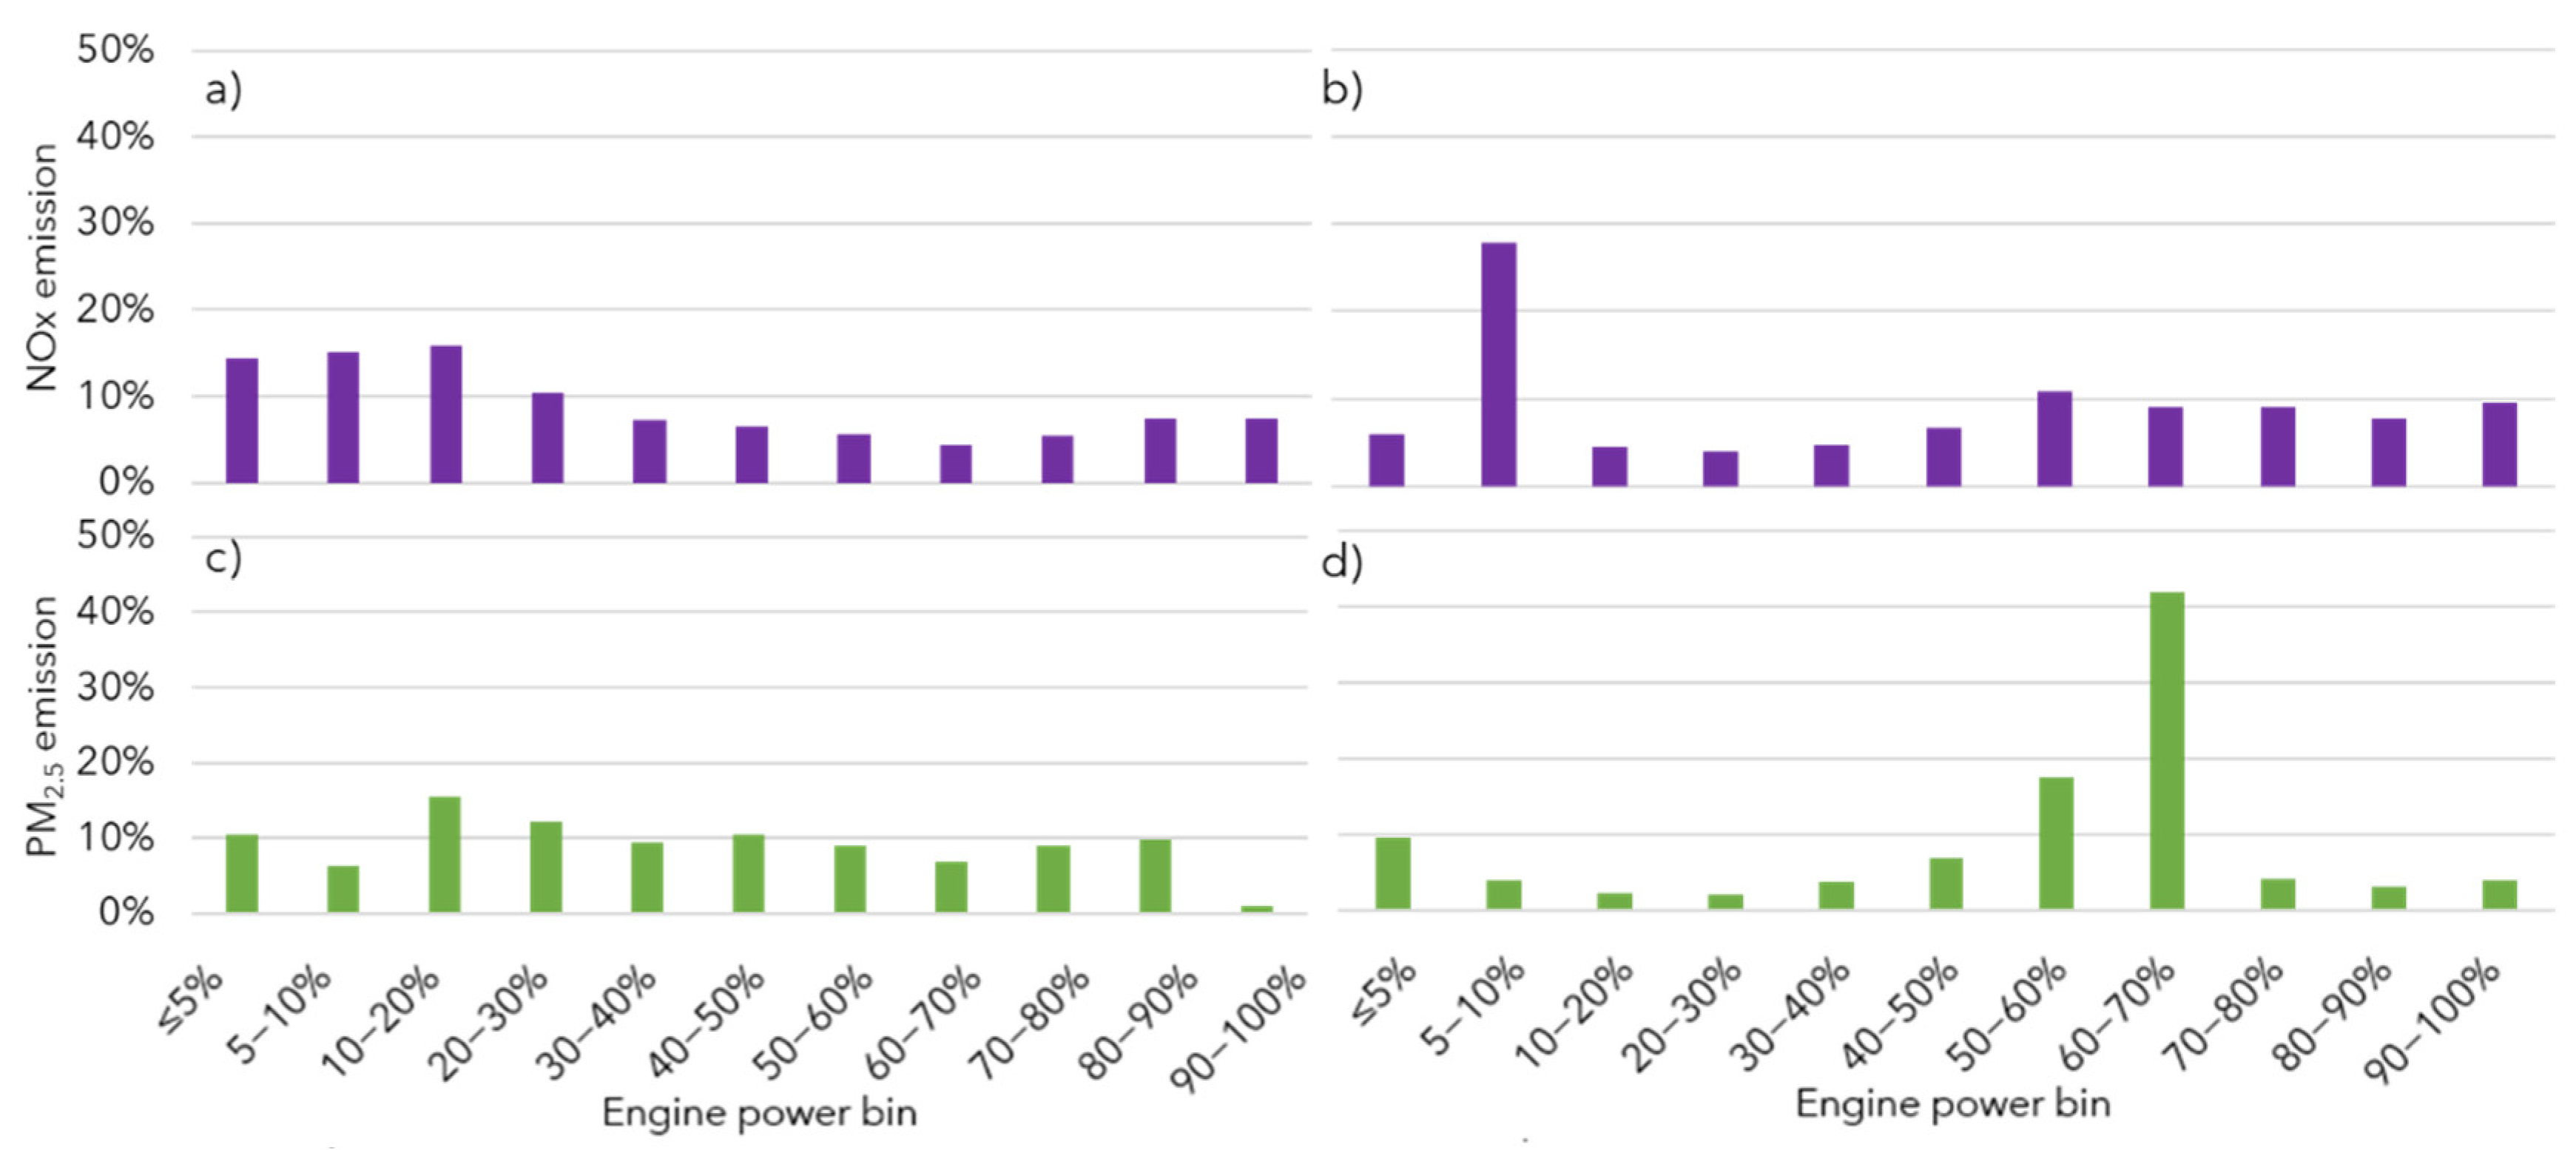
Figure 4 presents NOx (Figure 4a,b) and PM2.5 (Figure 4c,d) emission contributions by engine power for the wheel loaders and excavators, respectively (Figure A4 in Appendix A presents emission contributions for the crawler dozers and backhoes). The wheel loaders and excavators both emitted 45% and 38% of total NOx emissions and 32% and 16% of total PM2.5 emissions, respectively, during low-power operation (<20% engine power). Similarly, for the crawler dozers and backhoes, 48% and 60% of total NOx and 10% and 51% of total PM2.5, respectively, were emitted during the low-power operation. The emissions contributed during the low-power operations varied by a factor of three between equipment types. These differences between equipment types were well correlated with their proportional low-power activities, which was consistent with the equipment functionality. The wheel loaders and backhoes operated at low engine power for transporting and moving materials longer than the excavators and crawler dozers that operated at medium- (20–70% engine power) to high-power (70–100%) when performing work such as digging holes, lifting heavy loads, moving, and pushing soil. Due in part to these activities, the excavators and crawler dozers contributed the majority of NOx and PM2.5 emissions during the medium- and high-power operations.
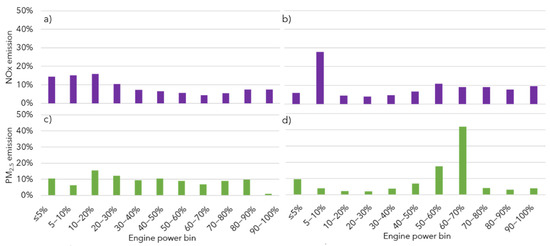
Figure 4.
NOx emission percentages obtained with engine power bin (purple bars) for (a) wheel loaders and (b) excavators; PM2.5 emission percentages obtained with engine power bin (green bars) for (c) wheel loaders and (d) excavators.
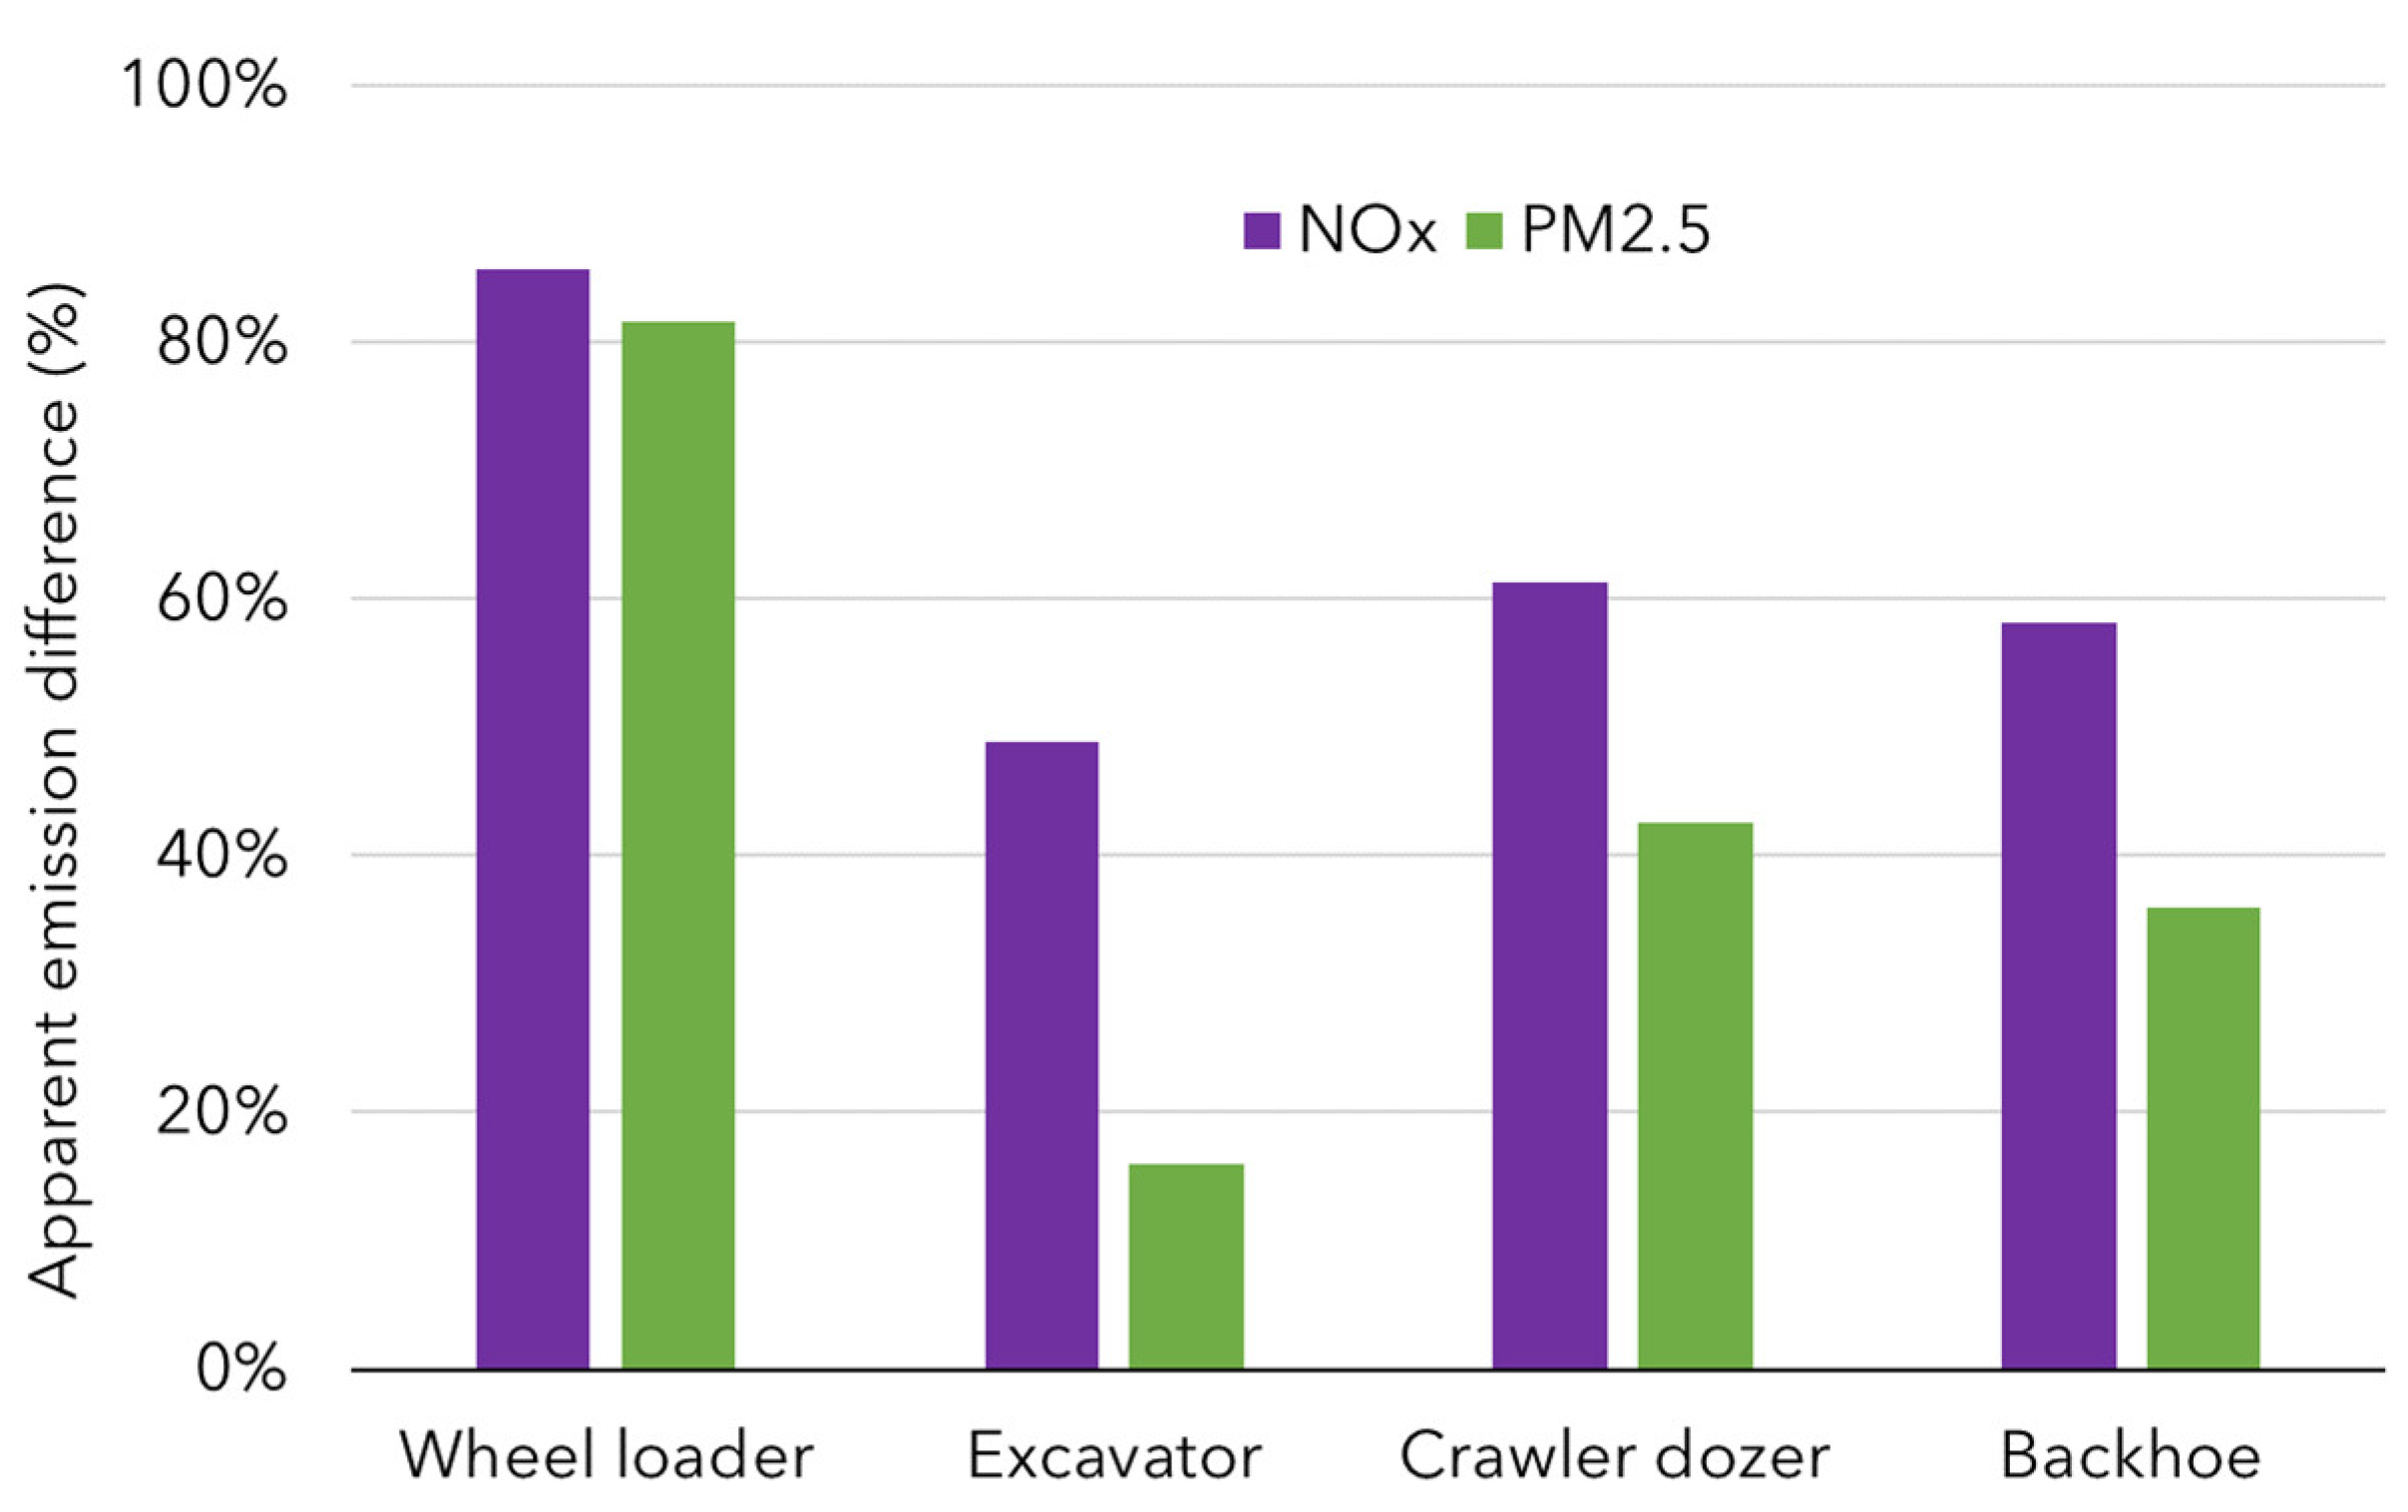
Figure 5 shows differences in NOx (purple bars) and PM2.5 (green bars) emissions estimated with the engine power binning method compared to the averaging method using the same activity data for the wheel loaders and excavators. A positive percentage difference indicated that the binning method estimated higher emissions than the averaging method at the same activity data. For all equipment types, the binning method estimated higher NOx and PM2.5 emissions than the averaging method. Differences in estimated emissions ranged from 49% to 86% and from 16% to 82% for NOx and PM2.5 emissions (Table A1 in Appendix A), respectively. The differences could be due to the fact that the averaging method was not designed to account for substantial emission contributions from low-power operations for Tier 4 construction engines with aftertreatment controls. The excavator had closer PM2.5 and NOx emission estimations from both methods, which could be the result of its lesser low-load operation emission contribution. Although we observed large differences in estimated emissions between the two methods, it should be noted that the differences may change when the binning method is applied to larger emissions data obtained from real-world vocational activities. The emissions data size from the present study may be adequate for the averaging methods, but the size after being distributed to engine power bins became substantially smaller, which would introduce potentially large uncertainties in the binning-method-estimated emissions (Table A2 in Appendix A). However, it is clear that today’s SCR engines and their calibrations allow for a low exhaust temperature and DEF dosing shutoffs, particularly at low-power operations, so the general effect seen is likely to remain as the dataset expands.

Figure 5.
NOx and PM2.5 emission differences for the binning method relative to the averaging method for Tier 4 construction equipment.
4. Conclusions
In this study, emissions from four types of Tier 4 construction equipment, wheel loaders, excavators, backhoes, and crawler dozers, with aftertreatment devices were characterized with a proposed engine power binning method. This binning method characterized Tier 4 equipment emissions considering their engine and aftertreatment operation conditions, which helped to identify NOx and PM2.5 emissions over various engine duty cycles. Notably, it was found that 38–60% NOx and 11–51% of PM2.5 emissions were contributed by low-power (<20% engine power) operations by the studied Tier 4 construction equipment. These results underscored the need to control NOx emissions during low-power operations. PM2.5 EFs for non-DPF backhoes were one to two orders of magnitude greater than all other equipment due to the lack of a DPF device, despite being certified to the same PM2.5 standard. This showed the benefits of DPFs on construction equipment that would be substantial in reducing PM2.5 emissions. Estimated emission differences between using the binning and the averaging methods were 49% to 86% and 16% to 82% for NOx and PM2.5, respectively. These differences may be due to the small emission sample sizes for engine power bins, and may change significantly once the binning method is applied to larger emission datasets obtained during real-world vocational activities.
Author Contributions
Conceptualization, Q.Y., S.Y., R.R. and H.Z.; methodology, Q.Y.; software, Q.Y.; validation, Q.Y., S.Y. and Y.T.; formal analysis, Q.Y.; investigation, Q.Y.; resources, T.D.; data curation, G.S., Q.Y. and Y.T.; writing—original draft preparation, Q.Y.; writing—review and editing, Q.Y., S.Y., Y.T., L.L. and J.H.; visualization, Q.Y. and S.Y.; supervision, J.H.; project administration, Q.Y.; funding acquisition, Y.T. All authors have read and agreed to the published version of the manuscript.
Funding
This research received no external funding.
Institutional Review Board Statement
Not applicable.
Informed Consent Statement
Not applicable.
Data Availability Statement
The data presented in this study will be openly available in report: https://ww3.arb.ca.gov/research/single-project.php?row_id=66537 (accessed on 30 March 2022) [dataset] Durbin, T.D.; Johnson, K.C.; Boriboonsomsin, K. Activity Data of Off-Road Engines in Construction; CARB: Sacramento, CA, USA, 2022. Under review.
Conflicts of Interest
The authors declare no conflict of interest.
Appendix A
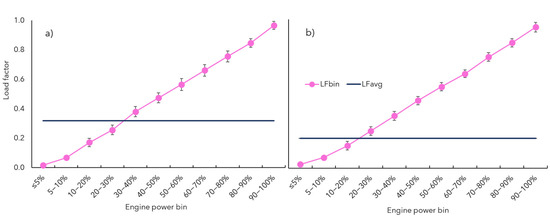
Figure A1.
Load factor based on instantaneous engine power data (LFbin) for each engine power bin and averaged load factor (LFavg) for crawler dozer (a) and backhoe (b).
Figure A1.
Load factor based on instantaneous engine power data (LFbin) for each engine power bin and averaged load factor (LFavg) for crawler dozer (a) and backhoe (b).
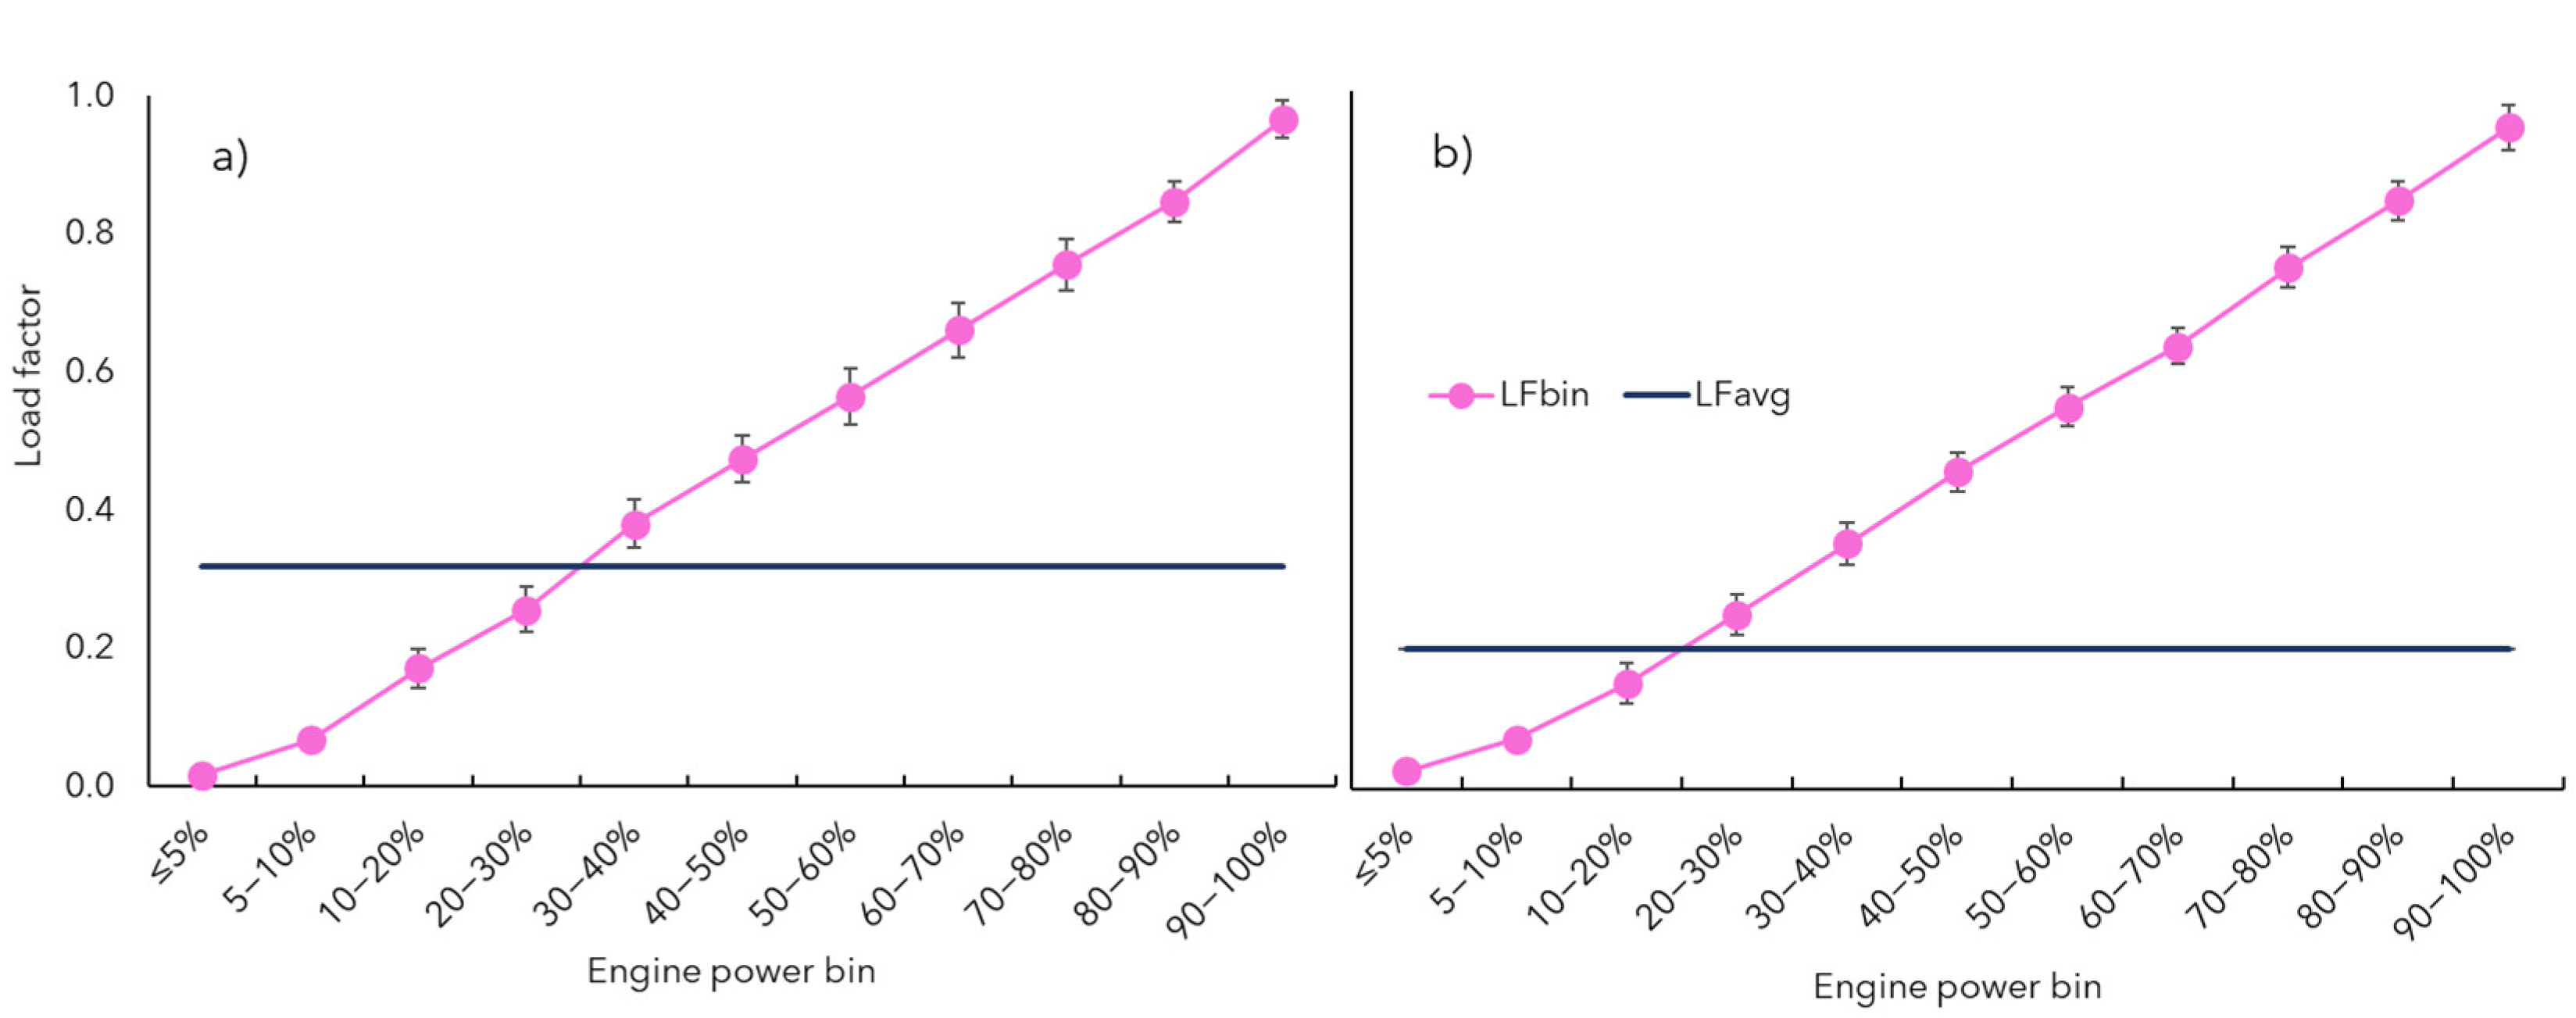

Figure A2.
(a,b) Crawler dozer and backhoe fuel rates (gal/hr), respectively; (c,d) crawler dozer and backhoe exhaust temperatures (°C), respectively; (e,f) crawler dozer and backhoe NOx and PM2.5 emission factors, respectively.
Figure A2.
(a,b) Crawler dozer and backhoe fuel rates (gal/hr), respectively; (c,d) crawler dozer and backhoe exhaust temperatures (°C), respectively; (e,f) crawler dozer and backhoe NOx and PM2.5 emission factors, respectively.
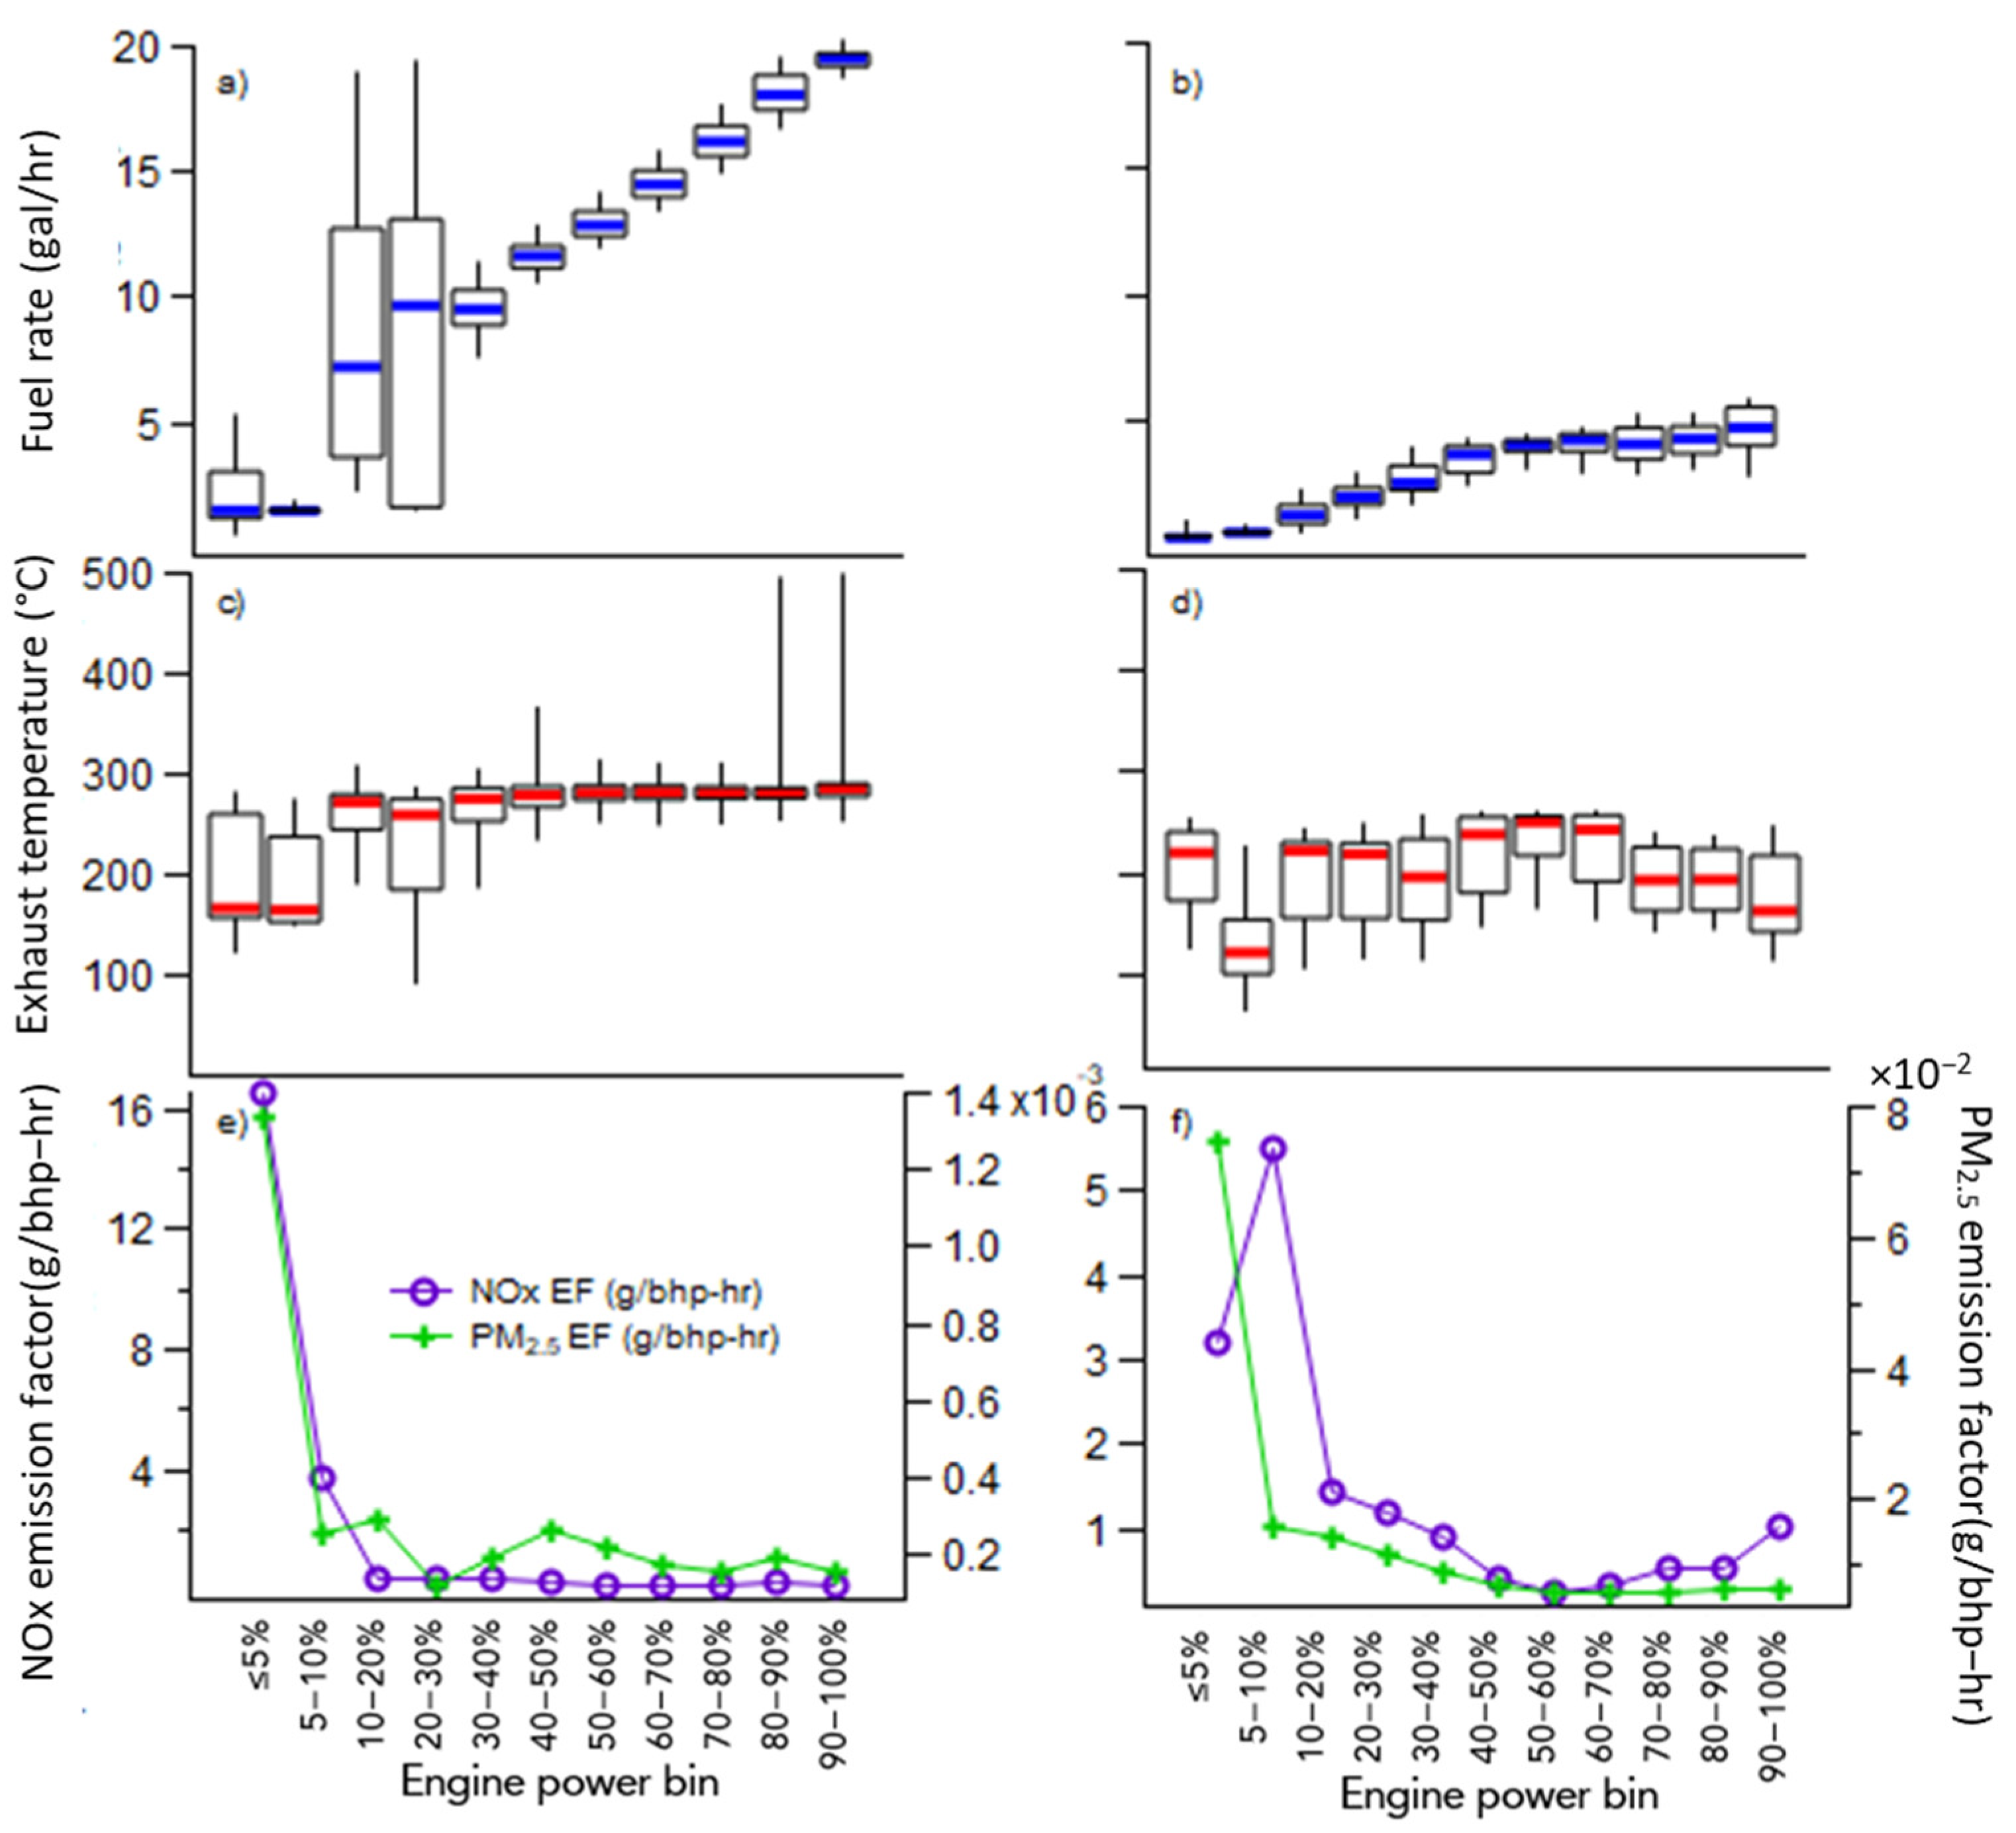
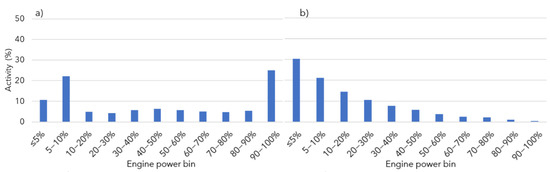
Figure A3.
(a) Crawler dozer operation percentage; (b) backhoe operation percentage based on real-world construction activity data.
Figure A3.
(a) Crawler dozer operation percentage; (b) backhoe operation percentage based on real-world construction activity data.
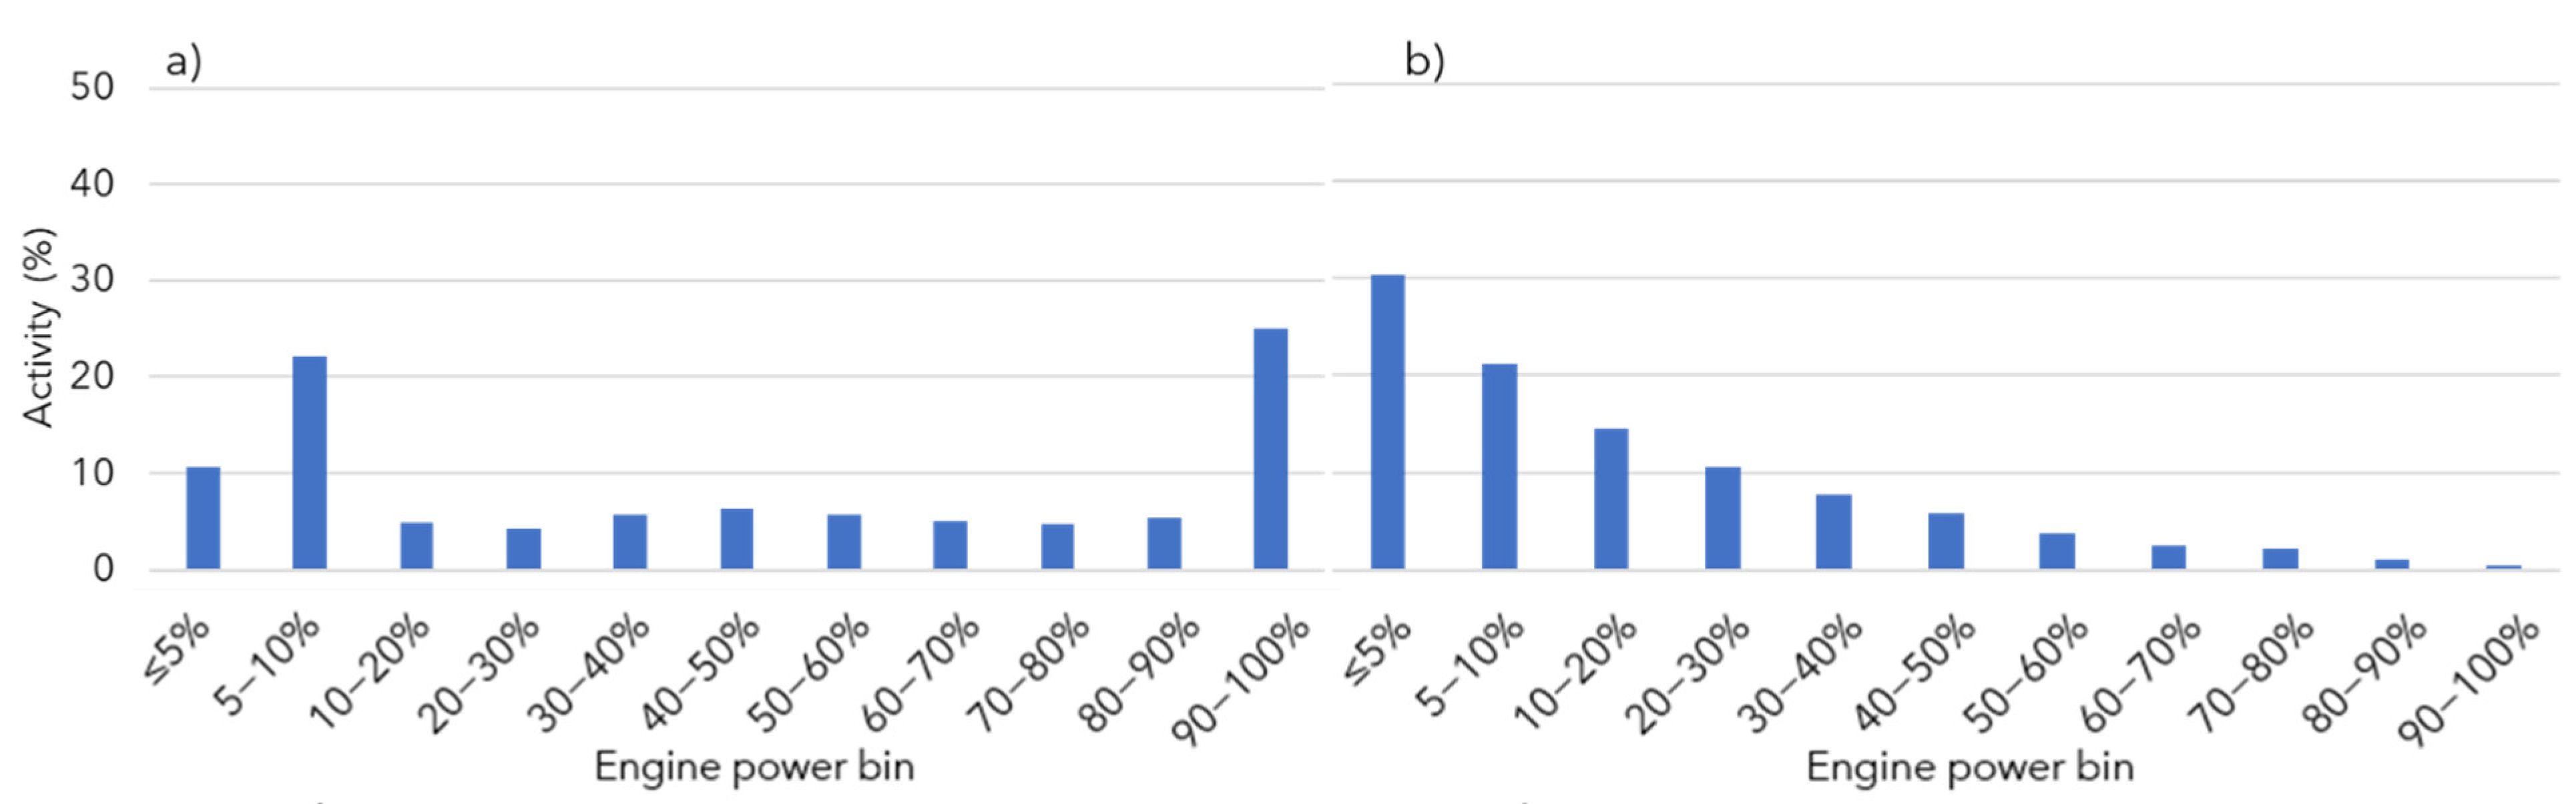

Figure A4.
NOx emission percentages obtained with engine power bin (purple bars) for (a) crawler dozers and (b) backhoes; PM2.5 emission percentages obtained with engine power bin (green bars) for (c) crawler dozers and (d) backhoes.
Figure A4.
NOx emission percentages obtained with engine power bin (purple bars) for (a) crawler dozers and (b) backhoes; PM2.5 emission percentages obtained with engine power bin (green bars) for (c) crawler dozers and (d) backhoes.
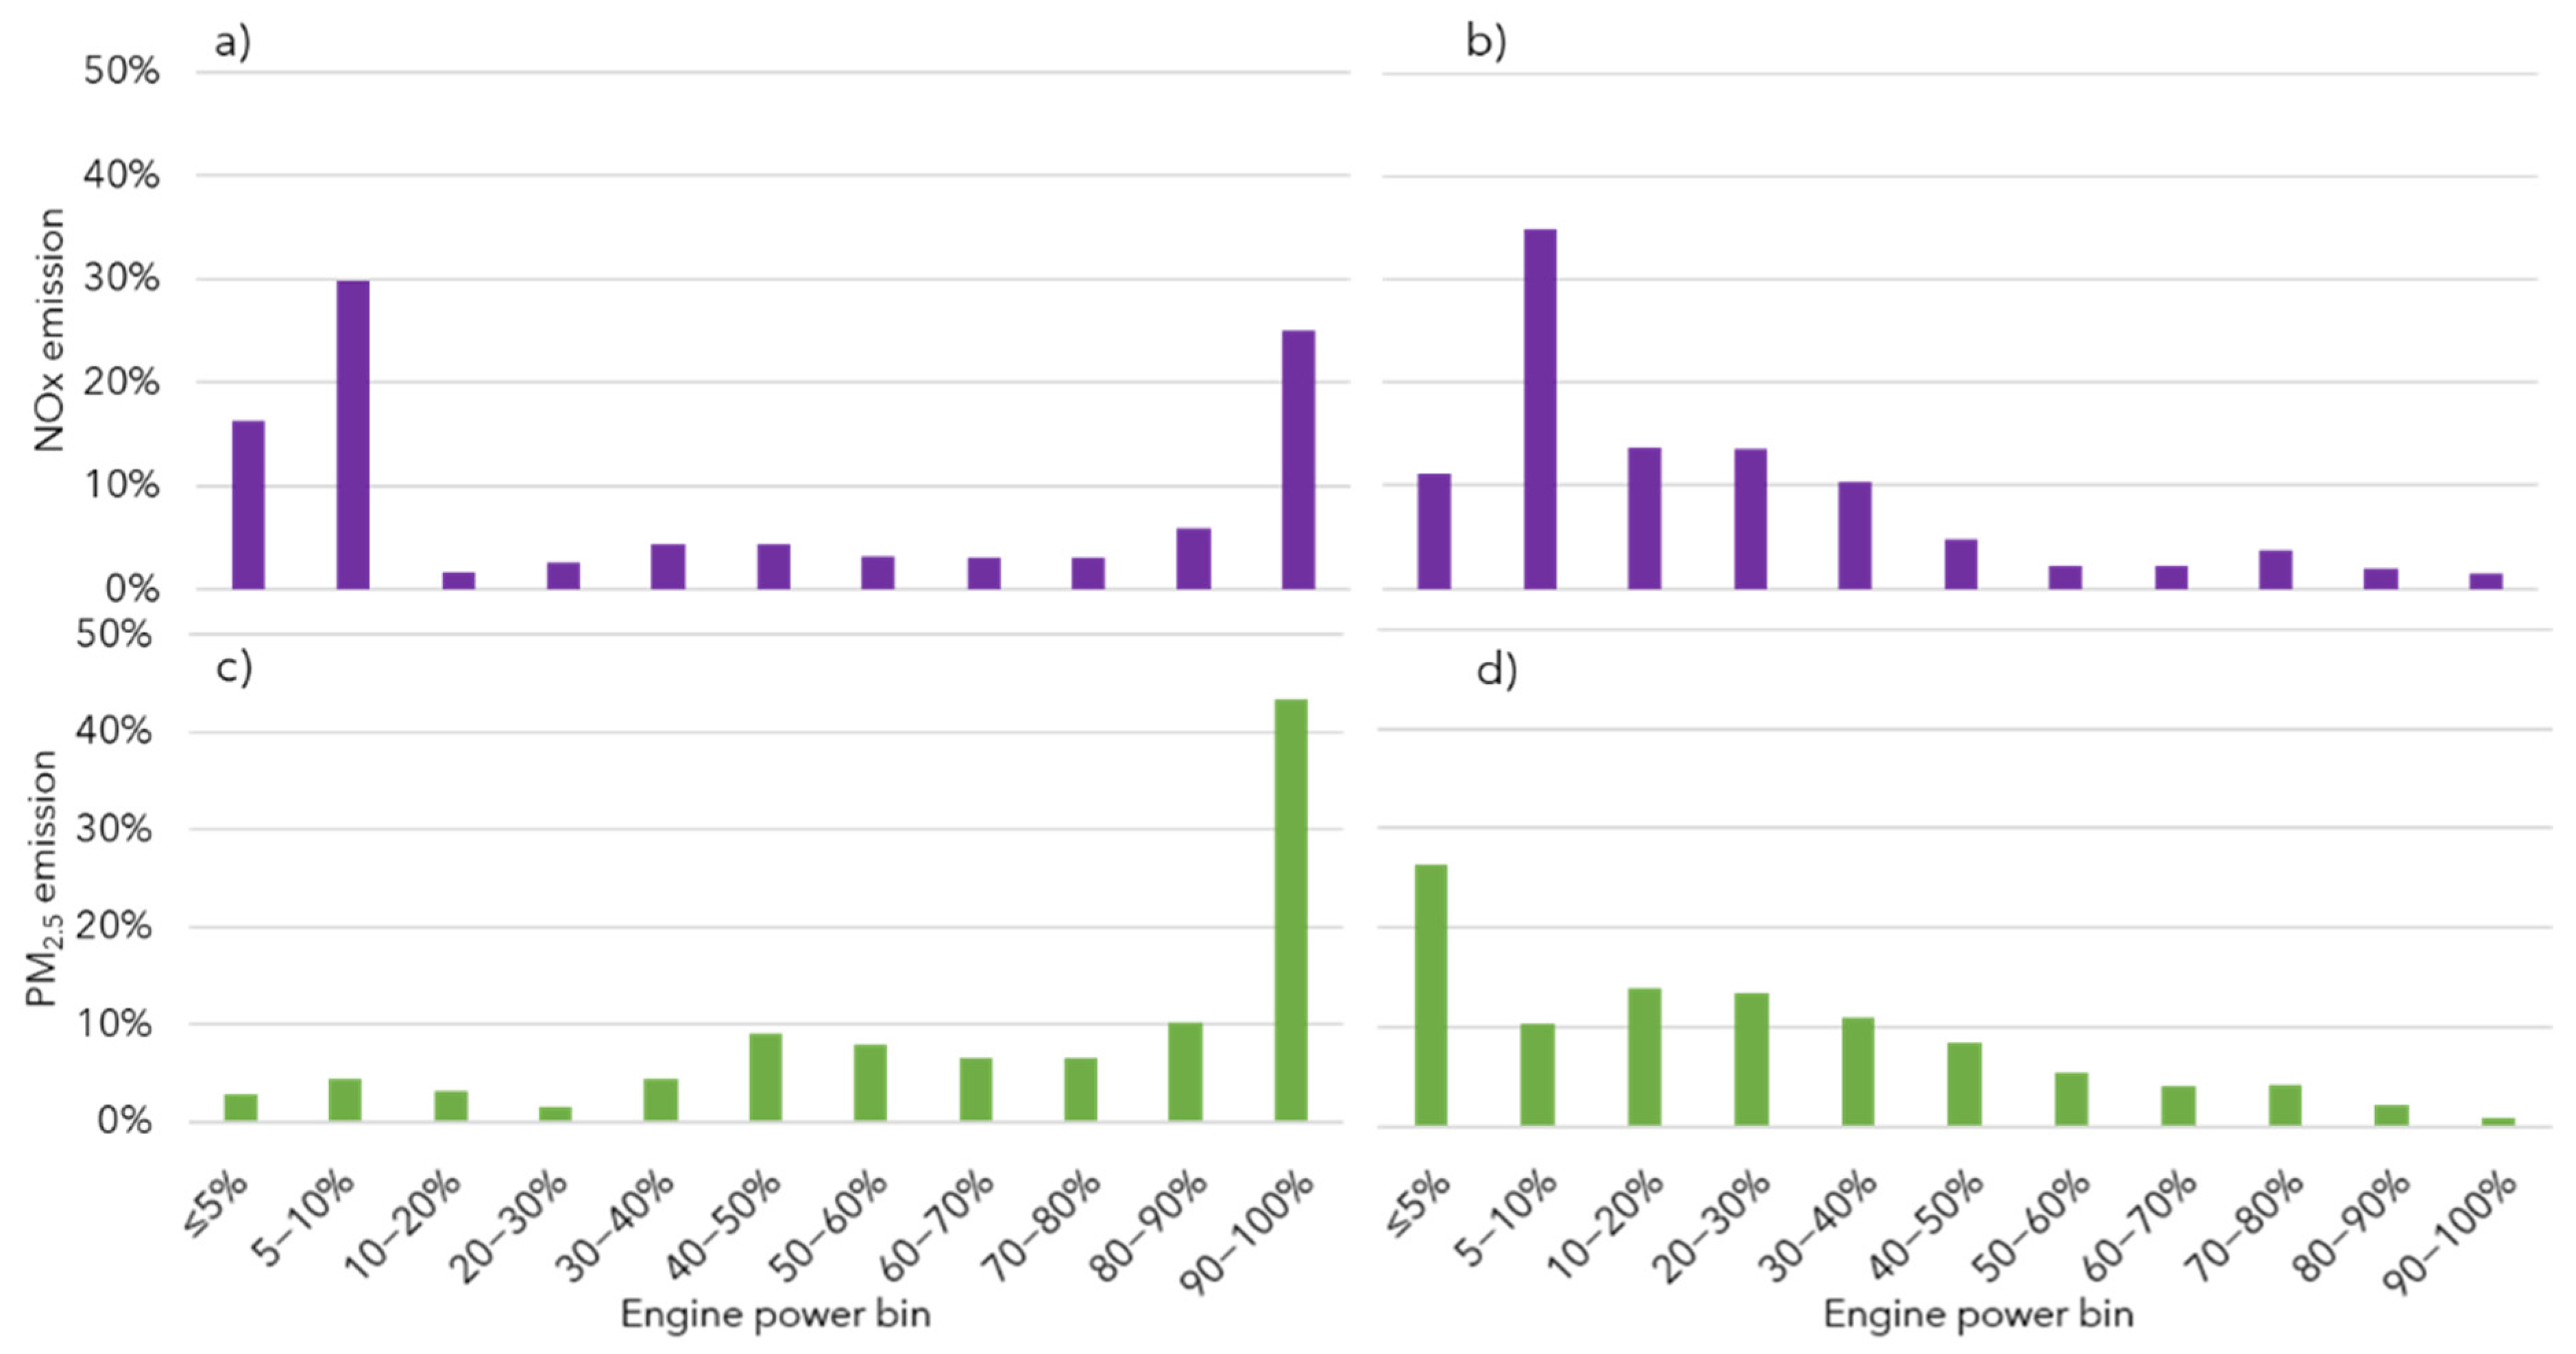
Table A1.
Emissions difference (%) between the binning method and the averaging method.
Table A1.
Emissions difference (%) between the binning method and the averaging method.
| Equipment | NOx Emission Difference | PM2.5 Emission Difference |
|---|---|---|
| Wheel loader | 86% | 82% |
| Excavator | 49% | 16% |
| Crawler dozer | 61% | 43% |
| Backhoe | 58% | 36% |
Table A2.
Emissions data size for eleven engine power bins.
Table A2.
Emissions data size for eleven engine power bins.
| Equipment | Data Size for Engine Power Bins | |||||||||||
|---|---|---|---|---|---|---|---|---|---|---|---|---|
| ≤5% | 5−10% | 10−20% | 20−30% | 30−40% | 40−50% | 50−60% | 60−70% | 70−80% | 80−90% | 90−100% | Total | |
| Wheel loader | 2604 | 6830 | 6262 | 7283 | 5337 | 3823 | 2873 | 2358 | 2623 | 1110 | 315 | 41,418 |
| Excavator | 6521 | 4016 | 2147 | 3529 | 4428 | 5544 | 6020 | 7046 | 3627 | 2819 | 485 | 46,182 |
| Crawler dozer | 81 | 8572 | 5788 | 9339 | 3963 | 4934 | 5533 | 3394 | 1890 | 1052 | 2591 | 47,137 |
| Backhoe | 4384 | 7059 | 3368 | 3922 | 3716 | 5910 | 7358 | 2267 | 598 | 323 | 73 | 38,978 |
References
- CARB. 2020 Mobile Source Strategy|California Air Resources Board. 2021. Available online: https://ww2.arb.ca.gov/resources/documents/2020-mobile-source-strategy (accessed on 24 September 2021).
- US EPA. 2017 National Emissions Inventory Report. 2020. Available online: https://gispub.epa.gov/neireport/2017/ (accessed on 25 March 2021).
- Atkinson, R.W.; Kang, S.; Anderson, H.R.; Mills, I.C.; Walton, H.A. Epidemiological time series studies of PM2.5 and daily mortality and hospital admissions: A systematic review and meta-analysis. Thorax 2014, 69, 660–665. [Google Scholar] [CrossRef] [PubMed] [Green Version]
- US EPA. Ozone Basics Ozone Pollution. 2016. Available online: https://www.epa.gov/ozone-pollution/ozone-basics#effects (accessed on 17 March 2017).
- US EPA. Basic Information about NO2. 2016. Available online: https://www.epa.gov/no2-pollution/basic-information-about-no2 (accessed on 31 March 2021).
- Sousa, S.I.V.; Alvim-Ferraz, M.C.M.; Martins, F.G. Health effects of ozone focusing on childhood asthma: What is now known—A review from an epidemiological point of view. Chemosphere 2013, 90, 2051–2058. [Google Scholar] [CrossRef] [PubMed]
- Lippmann, M. Health Effect of Ozone A Critical Review. JAPCA 1989, 39, 672–695. [Google Scholar] [CrossRef] [PubMed] [Green Version]
- Chen, T.M.; Gokhale, J.; Shofer, S.; Kuschner, W.G. Outdoor Air Pollution: Ozone Health Effects. Am. J. Med. Sci. 2007, 333, 244–248. [Google Scholar] [CrossRef] [PubMed]
- CARB. MSEI-Modeling Tools|California Air Resources Board. 2021. Available online: https://ww2.arb.ca.gov/our-work/programs/mobile-source-emissions-inventory/msei-modeling-tools (accessed on 20 October 2021).
- US EPA. Benefits and Costs of Five Important Clean Air Rules in 2030; US EPA: Washington, DC, USA, 2017. [Google Scholar]
- US EPA. >Median Life, Annual Activity, and Load Factor Values for Nonroad Engine Emissions Modeling; Report No. NR-005d (EPA420-R-10-016); US EPA: Washington, DC, USA, 2010. [Google Scholar]
- CARB. 2017 Off-Road Diesel Emission Factor Update for NOx and PM 2017 Off-Road Diesel Emission Factor Update for NOx and PM; CARB: Sacramento, CA, USA, 2017; Available online: https://www.arb.ca.gov/msprog/offroad/cert/cert.php (accessed on 31 March 2021).
- Cao, T.; Durbin, T.D.; Russell, R.L.; Cocker, D.R., III; Scora, G.; Maldonado, H.; Johnson, K.C. Evaluations of in-use emission factors from off-road construction equipment. Atmos. Environ. 2016, 147, 234–245. [Google Scholar] [CrossRef] [Green Version]
- Durbin, T.D.; Johnson, K.; Jung, H.; Russell, R.L. Study of In-Use Emissions from Diesel Off-Road Equipment Fax Study of In-Use Emissions from Diesel Off-Road Equipment; CARB: Sacramento, CA, USA, 2013. [Google Scholar]
- Durbin, T.D.; Johnson, K.C.; Boriboonsomsin, K. Activity Data of Off-Road Engines in Construction; CARB: Sacramento, CA, USA, 2022; under review. [Google Scholar]
- Sorrels, J.L. Selective Catalytic Reduction, Chapter 2; US EPA: Washington, DC, USA, 2019. [Google Scholar]

Publisher’s Note: MDPI stays neutral with regard to jurisdictional claims in published maps and institutional affiliations. |
© 2022 by the authors. Licensee MDPI, Basel, Switzerland. This article is an open access article distributed under the terms and conditions of the Creative Commons Attribution (CC BY) license (https://creativecommons.org/licenses/by/4.0/).