Abstract
Shale reservoirs are rich in nanoscale pore-microfractures, and generally contain water (especially inorganic pores) under reservoir conditions. Therefore, evaluating gas flow capacity under water-bearing conditions is of great significance for analyzing reservoir capacity and forecasting production. Based on the single-phase gas transfer theory in nanopores, we established a gas transport model in both circular pores and slit pores by considering pore-fracture patterns of actual samples. As will be shown, inorganic pore fractures are mostly slit-type, while organic pores are mostly circular. This gas transport model also uses weighting coefficients superimposed on slip flow and molecular free flow. Further, the effect of water saturation on gas flow is quantified by considering the distribution characteristics of inorganic and organic pores in shale and also by combining the pore distribution characteristics of actual samples. The flow characteristics of gas in organic and inorganic pores under water-bearing conditions in the reservoir are further compared. The study lays a theoretical foundation for the reasonable evaluation and prediction of shale gas well capacity under reservoir water conditions.
1. Introduction
Shale gas is a special unconventional resource, stores within the shale pore–fracture system, and exists in an adsorbed state, a free state, and, more minimally, in a dissolved state []. In general, a shale gas reservoir bears the characteristics of autogenous self-storage, no gas–water interface, large continuous reservoir formation, low porosity, and low permeability [,]. More importantly, under initial conditions, shale gas reservoirs also possess a variable degree of water saturation, as shown in Table 1 below, which highlights the water saturation levels of major shale gas reservoirs in America. In short, the presence of water saturation in a shale gas reservoir greatly affects gas adsorption and flow capacity, making it difficult to estimate total gas resources and to predict total gas production.

Table 1.
Water saturation of main shale strata in America.
Generally, shale is rich in nanoscale pores and microfractures. The experiments of Nelson (2009) [] showed that the minimum pore radius of shale is about 5 nm and the maximum pore radius is about 100 nm. Similarly, Yang Feng (2013) [] observed shale microfractures having widths between 50 and 200 nm by scanning electron microscopy. At the nanoscale, the gas velocity at the pore wall is no longer zero, and the classical Navier–Stokes equation cannot be used to describe the gas transport capacity [,]. Therefore, establishing a model that can characterize the gas transport properties of nanopores is important for the accurate prediction and evaluation of shale gas production. In 1934, Knudsen [] defined the Knudsen number as the ratio of the average free range of gas molecules to the scale of porous media. Later, based on the Knudsen number, Schaaf (1961) [] classified the gas transport mechanisms into four basic types, namely, continuous flow, slip flow, transition flow, and Knudsen diffusion, as shown in Figure 1.

Figure 1.
Knudsen number and gas flow regimes.
For single-gas cases, the analytical model proposed by Beskok and Karniadakis (2002) [] can describe all known mechanisms for gas transport through nanopores, including continuous flow, slip flow, transition flow, and molecular flow. One limitation of this model is that it contains multiple empirical coefficients and therefore cannot reduce to a traditional Knudsen flow model when the Knudsen number is high. As a result of this, Javadpour (2007; 2009) [,] obtained a new model based on Maxwell’s theory by linearly coupling both the slip flow and Knudsen diffusion. This proposed model is known as an “apparent permeability” model. Later, the research teams of Azom (2012) [], Darabi (2012) [], Singh (2014) [] and others further modified the “apparent permeability” model by considering the real gas effect and pore wall roughness.
Current theoretical and experimental studies on nanoscale flow mainly focus on single gas phase. However, actual logging data has shown that shale gas reservoirs (especially in the inorganic pores) usually have a certain degree of water saturation and, notably, the value is even higher than that of conventional gas reservoirs. Therefore, it can be seen that shale pores contain both gas and water phases under geologic conditions, and the presence of pore water (although it is mainly irreducible) will largely affect gas phase flow behavior and further affect actual gas well production.
Using experimental methods, Rushing (2003) [] and Li (2001, 2004) [,] studied gas-phase flow characteristics in sandstone rocks at different irreducible water saturations. Their results showed that water saturation significantly reduced gas-phase flow capacity by about 30–50% at the water saturation Sw ≈ 30%. It was also found that the effect of water saturation on flow is related to the gas-phase pressure: at low gas-phase pressure, the slip effect for gas-phase flow becomes significant, and the effect of irreducible water is weakened. Therefore, for gas flow in shale rocks, both water saturation and slip effect must be considered.
Han (2003) [] and Wang (2011) [] carried out flow experiments of helium and methane in water-bearing coal rocks, and their results showed that the matrix permeability of coal rocks will reduce by 1–2 orders of magnitude when given high water content. Pan (2010) [] studied the adsorption–diffusion characteristics of methane and carbon dioxide in dry coal rocks and moisture-equilibrium coal rocks, and their results showed that the gas diffusion rate in moisture-equilibrium coal rocks is more than 10 times lower than that of dry coal rocks. Similarly, Gensterblum (2014, 2015) [,] compared the permeability of dry and water-bearing kerogen based on experiments, and their results showed that adsorbed water reduces the permeability of kerogen by at least 20%. Further, Wu (2014) [] investigated the flow characteristics of gas and water phases in hydrophilic nanochannels (100 nm) based on visualization experiments. Taken altogether, their results showed that gas-phase pressure has a great influence on the distribution characteristics of water saturation and gas–water flow patterns in the pore.
Therefore, understanding gas diffusion and flow in shale nanopores with water saturation is important to evaluate and predict shale gas production under reservoir water conditions. In this work, based on the theory of single-phase gas transfer in nanopores, a gas transport model in circular pores and slit pores was established using the pore–fracture characteristics of shale. At the same time, the flow characteristics of gas in circular pores and slit pores were compared. Finally, based on the single-phase gas transport model, the influence of water film on gas flow was considered, and an apparent permeability model was established. Our present work demonstrates the effect of initial water on gas flow characteristics, and tries to pave a path for estimating the effective gas permeability in actual reservoir systems.
2. Gas Diffusion Flow Model in Nanopores
Considering that many pore-microfracture types exist for both organic and inorganic shales, this study simplifies them into either circular tubular pores or slit pores for study, as shown in Figure 2.
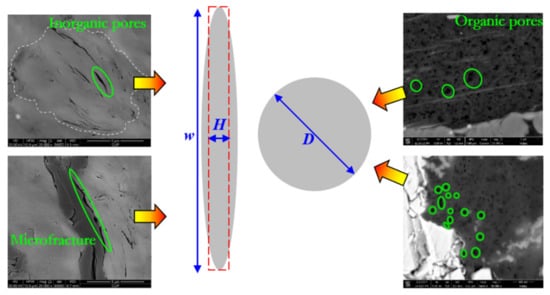
Figure 2.
Structures of nanopores and fractures in shale. (Orange arrows mean that the shale nanopores can be simplified as slit pores or circular pores).
2.1. Gas Transport Model in Circular Pores
For the flow of single-phase gas in nanopores, the Knudsen number is usually used as an important basis for flow division. For circular pores, the Knudsen number, Kn, can be expressed as:
where: Kn is the Knudsen number, factor less; λg is the molecular mean free range, nm; D is the characteristic scale of the flow field, i.e., the pore diameter, nm.
Considering the actual shale storage high-temperature and high-pressure system, the influence of gas intermolecular interaction forces on gas transport cannot be ignored. Moreover, the real gas effects (deviation coefficient, viscosity, average free range, etc.) are considered, so the real gas molecular average free range λg can be expressed as:
where: μg is the gas viscosity, mPa·s; Z is the gas deviation coefficient with zero dimension; P is the average gas pressure, MPa; T is the temperature, K; M is the gas molar mass, g/mol.
According to different Knudsen numbers, single-phase gas flows can be classified as continuous flow (Kn < 10−3), slip flow (10−3 < Kn < 10−1), transition flow (10−1 < Kn < 10), and free molecular flow (Kn > 10). Among these, continuous flow and slip flow can be characterized by Darcy’s formula, whereas a non-Darcy’s formula can be used to quantify the slip effect. Similarly, free molecular flow is characterized by Knudsen’s diffusion formula, and transition flow is the combined effect of Knudsen’s diffusion and slip effect, which is usually characterized by an empirical formula or weighted treatment.
In this study, the total mass flow rate of gas inside the pore, JT-tube, is obtained by superimposing the continuous flow and Knudsen diffusion based on the weighting factor proposed by Wu (2015, 2016) [,,]:
where: JT-tube is the total mass flow rate, kg/m2·s; Jslip-tube is the slip flow mass flow rate, kg/m2·s; JKn-tube is the Knudsen diffusion mass flow rate, kg/m2·s; fslip-tube is the weight coefficient of continuous slip flow, with zero dimension; fKn-tube is the weight coefficient of Knudsen diffusion with zero dimension.
When 10−3 < Kn < 10−1, the collision between gas molecules dominates, i.e., the internal friction between gas molecules dominates the flow; however, the collision between gas molecules and the wall cannot be neglected, i.e., the velocity of gas molecules at the wall is not 0, there is a slip-off effect, and the mass flow rate per unit area of ideal gas slip-off flow corrected by the Hua Tuo boundary conditions, Jslip, can be expressed as:
where: Jslip is the slip flow mass flow rate, kg/m2·s; φ is the porosity of porous medium, %; τ is the pore tortuosity, zero dimension; b is the slip boundary constant and if the boundary is a first-order slip condition, take b = 0; if the boundary is a second-order slip condition, take b = −1.
As the pore scale decreases, the nanoscale confinement effect increases and the viscosity of the gas within the nanopore decreases.
Equation (5) shows that gas viscosity decreases with an increase in Knudsen number. When Kn < 10−3 (continuous flow), the gas viscosity present within the pore is similar to the viscosity of the bulk phase, i.e., μg-eff ≈ μg where: α is the gas sparse effect coefficient, and is zero dimension, which can be expressed as:
where α0 is the sparse effect at Kn→∞ with zero dimension; α1 and β are both fitting coefficients with zero dimension. Based on the fitting results of Beskok (1999) [] and molecular simulation, the values of each parameter are: α0 = 1.19, α1 = 4.0, and β = 0.4.
Further, after considering the real gas rarefaction effect, the real gas slip flow mass flow rate Jslip can be expressed as:
where φ is the porosity of porous medium, %; τ is the pore tortuosity with zero dimension; for an ideal single circular pore, φ = 1, τ = 1; α is the gas sparsity effect coefficient with zero dimension; b is the slip boundary constant and if the boundary is a first-order slip condition, take b = 0; if the boundary is a second-order slip condition, take b = −1; in this study, b = −1.
When Kn > 10, the collision of the gas on the pore wall dominates, at which time the fluid viscosity has lost its physical meaning, and the gas transport within the pore can be described by Knudsen diffusion as:
where JKn is the Knudsen diffusion mass flow rate, kg/m2·s; DKn is the Knudsen diffusion coefficient, m2/s.
For an ideal gas in a circular pore, the Knudsen diffusion coefficient DKn is expressed as:
Combining Equation (8) with Equation (9), an ideal gas Knudsen diffusion mass flow rate can be expressed as:
For the real gas, after taking into consideration the gas deviation factor Z, there exists:
where Cg is the gas compression coefficient, MP−1.
Combining Equation (10) with Equation (11), the real gas Knudsen diffusion mass flow rate can be expressed as:
For a circular pore model, the slip flow weight coefficient fslip-tube as dominated by collisions between molecules and the Knudsen diffusion weight coefficient fKn-tube as dominated by molecule–pore wall collisions can be expressed as:
where ωm-m is the molecule–molecule collision frequency depending on the pore volume (cross-sectional area) and is zero dimension, and ωm-w is the molecule–wall collision frequency depending on the surface area (perimeter) of the pore and is zero dimension.
The slip flow weighting coefficients fslip-tube and Knudsen diffusion weighting coefficients fKn-tube calculated according to Equations (14) and (15) for different Kn numbers are shown in Figure 3. The calculation results show that: in the continuous flow region (Kn < 10−3), fKn is almost zero and Knudsen diffusion has almost no effect; in the slip flow region (10−3 < Kn < 10−1), with an increase in Kn number, the influence of Knudsen diffusion gradually increases. However, where the value of fKn is less than 0.1, the influence of Knudsen diffusion on the flow in this region is less than 10%. The gas mainly shows slip flow; in the transition flow region (10−1 < Kn < 10), the value of fKn and fslip change significantly with the number of Kn, and the influence of both Knudsen diffusion and slip flow on the flow in this region is more important; in the molecular flow region (Kn > 10), the weighting coefficient of slip flow is less than 0.1, and the gas mainly shows Knudsen diffusion. In summary, this weighting factor can characterize the flow state in the full Kn number range.
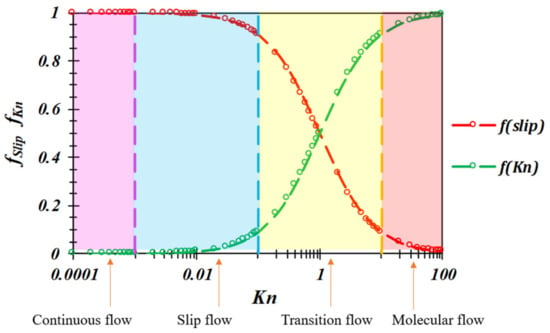
Figure 3.
Weight coefficients with different Kn in circular pores.
Further, by substituting Equations (7) and (5) into Equation (3), the total mass flow rate JT-tube of the gas phase in the circular pore can be expressed as:
According to the definition of apparent permeability, the relationship between the total mass flow rate JT and apparent permeability (kg)a can be expressed as:
Combining Equation (16) with Equation (17), the apparent permeability (kg)a-tube of the gas flowing in the circular pore space can be expressed as:
2.2. Gas Transport Model in Slit Pores
The flow of single-phase gas in an ideal circular pore is the simplest case, but the transport model becomes more complicated when different pore shape characteristics are considered, such as clay pores in shale or microfractures in quartz (as shown in Figure 2). Although these may have elliptical or rectangular cross-sections, such pore fractures can be simplified into a slit pore model. In this study, the aspect ratio ξ (ξ > 1) is used to characterize the shape factor of slit pores as follows:
where w is the height of the slit pore or microcrack, nm; H is the width (openness) of the slit pore or microcrack, nm.
In addition, the characteristic scale of the flow field in the slit pore is not in the diameter d of the pore, but the width (openness) H of the slit pore. Thus, the slit pore Knudsen number, Kn, can be expressed as:
Similarly, in this study, the total mass flow rate JT-slit of the gas in the slit pore is superimposed on the continuous flow and Knudsen diffusion based on the weighting coefficients:
Considering the real gas effect, the slip flow mass flow rate Jslip-slit inside the gas slit orifice can be expressed as:
where A(ξ) is the coefficient that describes the influence of the shape on the effect of the slip flow with zero dimension, and can be expressed as:
Moreover, for an ideal gas in a circular pore, the Knudsen diffusion coefficient DKn is expressed as:
Considering the real gas effect, the Knudsen diffusion mass flow rate JKn-slit in the gas slit pore can be expressed as:
where B(ξ) is the coefficient of influence of shape factor on molecular free flow, with zero dimension, and can be expressed as:
For the slit pore model, the slip flow weight coefficient fslip-slit dominated by collisions between molecules, and the Knudsen diffusion weight coefficient fKn-slit dominated by molecule–pore wall collisions, can be expressed as:
Considering the slit pore cross-sectional shape variation, the slip flow weight coefficients fslip and Knudsen diffusion weight coefficients fKn for different Kn numbers are calculated according to Equations (27) and (28) for the cases of ξ = 1.0 (minimum) and ξ = ∞ (maximum).
The calculation results are shown in Figure 4; the weight coefficients fslip and fKn of the slit pore model can also better describe the full Kn number range of the flow state, and the change in the shape factor ξ also affects the flow characteristics. Along with an increase in the aspect ratio ξ, it indicates that the difference between slit opening and height increases, and its perimeter is smaller for the same pore volume. Considering that Knudsen diffusion depends on the collision frequency of molecules with the wall, this should depend on the surface area of the pore. Therefore, under the same conditions, the larger the value of slit pore ξ, the lower the share of Knudsen diffusion and the smaller the fKn.
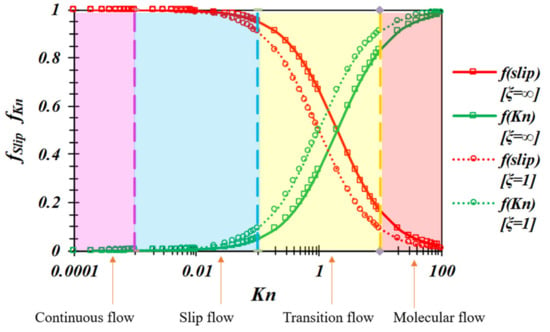
Figure 4.
Weight coefficients with different Kn in slit pores.
Further, by substituting Equations (22) and (28) into Equation (21), the total mass flow of gas JT-slit in the slit pore can be expressed as:
The apparent permeability (kg)a-slit of gas flow in the slit pore can be expressed as:
where in the range of aspect ratio ξ = 1.0~50, the shape factors A(ξ) and B(ξ) are shown in Figure 5, which can be directly used for the calculation of the apparent permeability (kg)a-slit of slit pores.
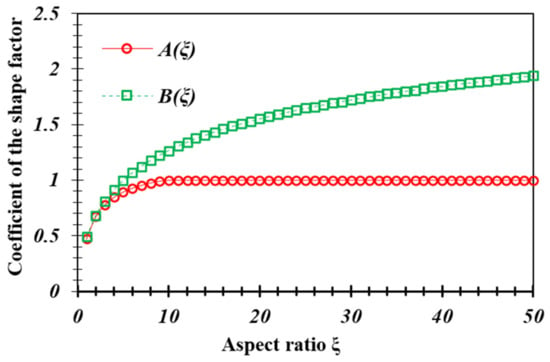
Figure 5.
The shape factors A(ξ) and B(ξ) with different aspect ratios.
3. Effect of Pore Shapes on Gas Flow in Nanopores
Considering that the shape of the pore can have an effect on gas transmission capacity, this study examines the flow characteristics of gas in two pore types: circular and slit pores. Indeed, in the analysis that follows circular, and slit pores having the same pore size (D = H) and the same pore cross-sectional area (πD2/4 = H·w) are compared.
3.1. Comparison with the Same Pore Scale
When slit pores and circular pores have the same pore scale (D = H) and different pressures are applied (P = 0.5 MPa, P = 1.0 MPa, P = 10 MPa, P = 50 MPa) the apparent permeability of the two types of pores was calculated and is shown in Figure 6. Comparing rectangular pores with different aspect ratios ξ, under different pressure and pore scale conditions, the permeability (kg)a of rectangular slit pores all increase with the value of ξ. When the slit pore widths H are the same, pores with higher aspect ratios ξ have higher pore cross-sectional area, so the pore transmission capacity is higher.
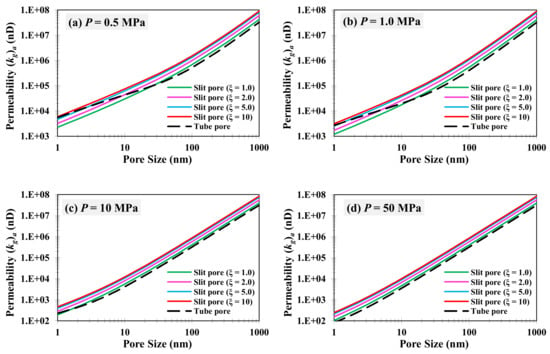
Figure 6.
Comparison of permeability between slit and circular pores with the same size.
Comparing rectangular pores with circular pores, the variation characteristics are more complicated. Under low-pressure conditions, especially for pores smaller than 10 nm, the permeability of circular pores can be larger than that of rectangular pores, whereas along with the increase in the pore scale and pore pressure, the permeability of circular pores will be smaller than that of rectangular pores.
In fact, under low-pressure and microporous conditions, gas molecules collide violently with the pore wall. The Knudsen diffusion, as dominated by molecule–wall collisions, will determine total gas transport capacity within the pore. Under the same scale conditions, however, the circular pore has a higher pore surface area. Therefore, the Knudsen diffusion in the circular pore will be more significant, and the gas transport capacity in the circular pore will be larger than that in the rectangular pore. Under high-pressure and large pore conditions, gas transport capacity will mainly be determined by the viscous flow (slip flow) of collision between gas molecules. Since the slit pore’s slit width H is the same as the diameter D of the circular pore, the slit pore cross-sectional area will always be larger than that of the circular pore, resulting in a higher transport capacity of the bulk phase fluid.
3.2. Comparison with the Same Cross-Sectional Area
Under the same cross-sectional area, the width H of the rectangular pore and the diameter D of the circular pore exist:
When the slit pore and the circular pore have the same cross-sectional area, the apparent permeability calculations of the two types of pores under different pressure conditions (P = 0.5 MPa, P = 1.0 MPa, P = 10 MPa, P = 50 MPa) are shown in Figure 7, where the horizontal coordinate is the diameter D of the circular pore.
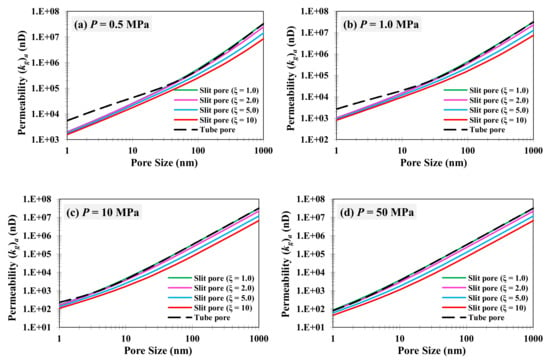
Figure 7.
Comparison of permeability between slit and circular pores with the same area.
Equation (31) shows that the slit width H of the rectangular pore is constantly smaller than the diameter D of the circular pore when the cross-sectional area is the same, whereas, the larger the aspect ratio ξ of the rectangular pore, the smaller the corresponding pore scale H. Under the same cross-sectional area condition, the pore characteristic scale of the circular pore is the largest and has the highest fluid transfer capacity, whereas the pore characteristic scale of the rectangular pore with ξ = 10 is the smallest and has the lowest fluid transfer capacity. It is worth noting that under low-pressure and microporous conditions, the Knudsen diffusion within the circular pore is significant and the apparent permeability is much larger than that of the rectangular pore case. Indeed, under these high-pressure and macroporous conditions, the gas flow within the pore is governed by viscous flow (slip flow), and the transport capacity of the circular pore is close to that of the rectangular pore. For the square pore at ξ = 1, its pore characteristic scale is close to the diameter of the circular pore; therefore, in the viscous flow (slip flow) stage, the gas transport capacity in both is basically the same.
3.3. Ratio of Apparent Permeability to Absolute Permeability
Under the condition of Knudsen number Kn < 10−3, the gas flow satisfies the continuity equation, and for the circular pore, its absolute permeability k∞-tube can be expressed by the Hagen–Poiseuille equation as:
where φ is the porosity of porous media, %; τ is the pore tortuosity with zero dimension; d is the average pore diameter, nm. For an ideal single circular pore, φ = 1 and τ = 1.
In combination with Equation (18), the permeability “enhancement factor” of gas flow in a circular pore can be expressed as:
Similarly, for slit pores, the absolute permeability k∞-slit can be expressed by the Hagen–Poiseuille equation as:
In combination with Equation (30), the permeability “enhancement factor” for gas flow in the slit pore can be expressed as:
At T = 80 °C, the permeability ratios of the circular pores and slit pores (ξ = 10) are calculated based on Equations (33) and (35), as shown in Figure 8. The results show that the permeability (kg)a of 1~10 nm pores is greater than the absolute permeability (kg)∞ by about 10–200 times under the low pressure (0.5 MPa) condition; even under the high-pressure case (10 MPa), the permeability (kg)a of 1~10 nm pores is greater than (kg)∞ by 2~8 times. Therefore, within the 1~10 nm nanopores, the increase in apparent gas permeability caused by Knudsen diffusion and slip cannot be neglected. The nanoscale effect (Knudsen diffusion and slip) gradually decreases as the pore scale increases. At the same time, the nanoscale effect is more significant in circular pores, and the permeability “enhancement factor” of the circular pore is larger than that of the slit pore. This phenomenon is due to the fact that the pore surface area of the circular pore is larger and the collision effect between molecules and the wall is more significant under the same scale conditions; therefore, the nanoscale effect is stronger.
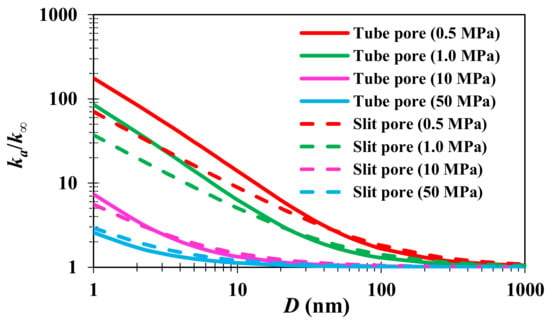
Figure 8.
Ratios of apparent permeability to intrinsic permeability.
4. Effect of Water Films on Gas Flow in Nanopores
Considering the prevalence of water in shale reservoirs under actual reservoir conditions, it is necessary to quantitatively characterize the gas flow characteristics in pore joints under water-bearing conditions. It is worth noting that not only the effect of liquid water (water saturation) on gas flow, but also the effect of gaseous water (gas-phase moisture) on gas-phase high-pressure physical properties, needs to be considered under reservoir water-bearing conditions. In this study, the shale gas is simplified to a methane–water vapor binary gas, and the gas high-pressure and high-pressure properties are corrected.
4.1. Gas-Phase Permeability in Circular Pores
There are two distribution states of water film or capillary water in the water-bearing state of the pore. For nanoscale pores, when the pore is blocked by capillary water, it is difficult for the gas phase to flow [,,]. Therefore, the gas phase can flow only when the pore is in the “water film gas core” state (in Figure 9).

Figure 9.
Effect of bound water on gas transport in circular pore.
Considering the effect of irreducible water film, the effective pore size D* of the circular pore can be expressed as:
At this time, the Knudsen number in the circular pore can be expressed as:
Substituting Equation (37) into Equation (18), the effective permeability of the circular pore under water-bearing conditions can be expressed as:
Further, the relative permeability in the circular pore can be expressed as the ratio of the apparent permeability (kg)*a-tube under water-bearing conditions to the apparent permeability (kg)a-tube under dry conditions as:
When the Knudsen number Kn < 10−3, the gas-phase flow is controlled by viscous flow and nanoscale effects can be neglected (diffusion and slip). The relative permeability in the circular pore can be expressed as:
The relative permeability curves in circular pores with diameters D = 10 and 50 nm at T = 80 °C and pressures P = 0.5, 1.0, 10, and 50 MPa are shown in Figure 10. The Knudsen number in different cases ranges from 0.007 to 1.342, which are in the slip-off and transition flow stages. The calculation results show that the phase permeability curve appears as a “convex” curve when the Kn is high, and becomes gradually more linear as the Kn decreases. Equation (40) shows that at low Kn (Kn~10−3), the phase percolation curve tends to be a “1 − Sw” straight line. Therefore, the “convex” curve in Figure 10 in fact shows the nanoscale effect on the phase permeation curve: the higher the Knudsen number, the more severe the “upward convexity” of the phase permeation curve, and the gas phase permeability is higher than the “1 − Sw” line. Therefore, the nanoscale effect will weaken the effect of irreducible water on gas-phase permeability to some extent; the smaller the pore size and lower the pressure, the more significant the nanoscale effect and the weaker the effect of irreducible water on permeability.
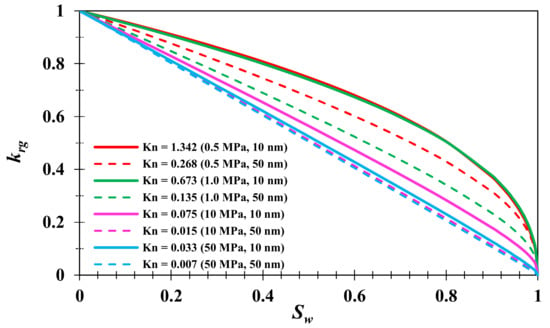
Figure 10.
Relative permeability curves with different Knudsen numbers (circular pore model).
Further, under the condition of water content saturation Sw = 30%, the relationship between Kn and the relative gas permeability krg is shown in Figure 11. It can be seen that in instances where Kn < 0.001, krg is close to 0.7, which is consistent with the prediction of “1 − Sw”. Similarly, with the increase in Kn, the value of krg gradually increases. Finally, when Kn~1.0, the value of krg tends to be constant at 0.86. In general, for the circular pore, the gas phase permeability decreases 14~30% at the water content saturation of 30% and the degree of reduction mainly depends on the gas flow state (temperature, pressure, pore scale, etc.)
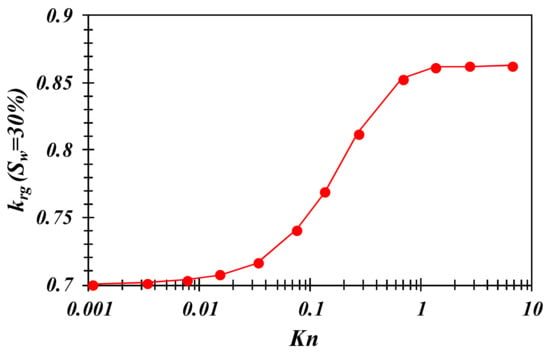
Figure 11.
Relationship between krg and Kn at Sw = 30% (circular pore model).
4.2. Gas-Phase Permeability in Slit Pores
Similarly, considering the effect of irreducible water film (as shown in Figure 12), the effective pore slit width H* of slit pores can be expressed as:
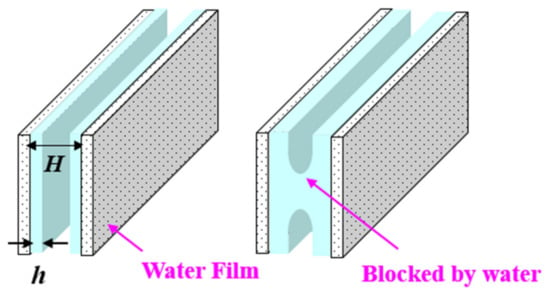
Figure 12.
Effect of bound water on gas transport in slit pores.
At this point, the Knudsen number in the slit pore can be expressed as:
Substituting Equation (42) into Equation (30), the effective permeability of the circular pore under water-bearing conditions can be expressed as:
Further, the relative permeability in the slit pore can be expressed as the ratio of the apparent permeability (kg)*a-slit under water-bearing conditions to the apparent permeabil-ity (kg)a-slit under dry conditions as:
Moreover, when the Knudsen number Kn < 10−3, the relative permeability in the slit pore can be expressed as:
The relative permeability curves of slit pores with pore diameters H = 10 and 50 nm at T = 80 °C and pressures P = 0.5, 1.0, 10, and 50 MPa are shown in Figure 13. The results show that the phase permeability curves of slit pores show a “concave” shape at low Kn. As the Knudsen number increases, the phase permeability curve becomes gradually more linear. It is not difficult to find that the “concave” curve in the slit pore is opposite to the “convex” curve in the slit pore, which is mainly due to the influence of the pore shape on the phase percolation curve. Comparing Equation (40) with Equation (45), the phase percolation curve of a circular pore is a “1 − Sw” straight line at Kn < 10−3, while the phase percolation curve of a slit pore is a “concave” curve of “(1 − Sw)2”. Therefore, the influence of the pore shape also needs to be considered when the two phases of gas-water percolate in clay slit pores or microfractures.
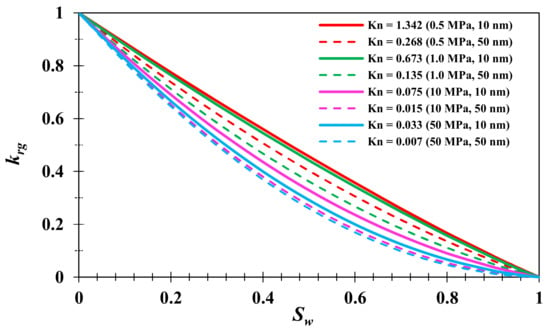
Figure 13.
Relative permeability curves with different Knudsen numbers (slit pore).
Further, under the condition of water saturation Sw = 30%, the relationship between slit pore Kn and gas relative permeability krg is shown in Figure 14. When Kn < 0.001, krg is close to 0.49, which is consistent with the prediction of “(1 − Sw)2”. Indeed, along with the increase in Kn, the value of krg increases gradually. When Kn~1.0, the value of krg tends to be constant at 0.67. Therefore, at water saturation of 30%, the gas phase permeability decreases 33~51%. Compared with a circular pore, the reduction in permeability is more significant under the same water-bearing saturation condition. In fact, shale reservoir water is mostly enriched in inorganic (clay, quartz) pores or microfractures, and shale inorganic pores mostly show slit pore characteristics. Thus, although the original water content of a shale reservoir is usually an irreducible water state, the influence of this irreducible water on gas flow capacity cannot be ignored.
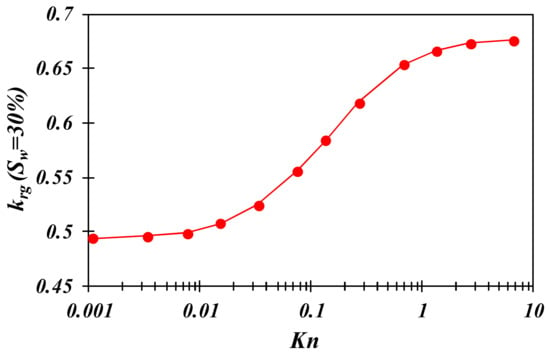
Figure 14.
Relationship between krg and Kn at Sw = 30% (slit pore model).
5. Model Application
In this section, we illustrate the application of our model to predict gas permeability tested in experimental conditions. In the work of Wu (2014) [], permeability for gas flow through nanochannels is tested under different bound water saturation (Swi = 0%, 15%, 19%, 30%, 42%) and different pressure conditions (from 0.245 to 0.63 MPa), and we use our model to compare the results with the experimental data.
The nanochannels in the work of Wu (2014) [] are mainly composed of quartz (which is strongly water wetted) with a pore width of ~100 nm (with roughness less than 1 nm). In the displacement process, bound water in the pores mainly exists in the form of water film bound on the pore wall, and gas mainly flows in the pore center (Figure 15). These assumptions are similar to those used in this work. In the calculation process, it is simplified as the parallel slit pores with the same width of H = 100 nm. The quantitative model (Equation (43)) of gas phase permeability of slit pores is used to calculate the gas apparent permeability (kg)* with bound water, and the relative permeability krg under different Sw conditions is further calculated using Equation (44).
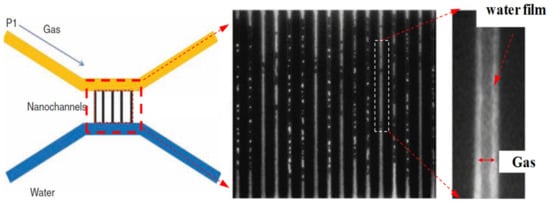
Figure 15.
Experiments of gas/water flow inside nanochannels.
Using our model in Equation (43), krg of gas phase permeability under P = 0.245 and 0.630 MPa was calculated and compared with experimental results (Figure 16). The results show that the gas phase permeability curve at low pressure is obviously higher than that at high pressure, which is because the effect of collisions between the gas and the wall is more significant at low pressures, and leads to the Knudsen diffusion or slip flow in nanopores. At the same time, the fitting of model calculation and experimental results looks good, which indicates that the proposed analysis model of gas flow in nanopores under bound water is reasonable in this work.
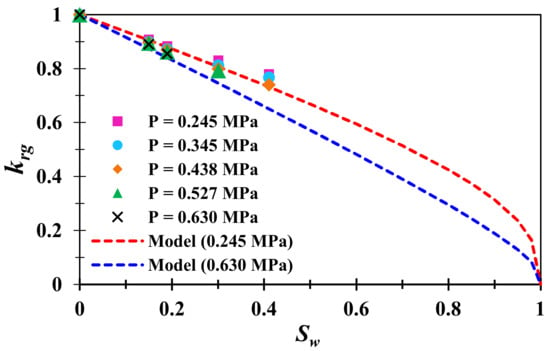
Figure 16.
Comparison between the calculated results and experimental data.
6. Future Study
In this work, we mainly focus on gas flow through two kinds of nanopores—circular and slit pores—and built related mathematical models. The models can be used to describe gas flow in homogeneous cases such as the experiments shown in Section 5. However, because of the complex heterogeneity of shale rocks in terms of both pore sizes and pore shapes, our proposed model is not enough to model gas flow in actual shale gas reservoirs. Therefore, more work is needed to “upscale” our single-pore model to a pore-network model.
In addition, the pathways for shale gas production are much more complex than shown in our assumptions. Generally, gas production pathways include not only micro processes for gas flow in inorganic pores, organic pores, and microfractures, but also macro processes for gas flow in hydraulic fractures and wellbores. The whole process is shown in Figure 17. In order to model these coupled gas flow pathways, specialized software, such as Petrol and Eclipse by Schlumberger, is needed to build the reservoir models and conduct the reservoir simulations.
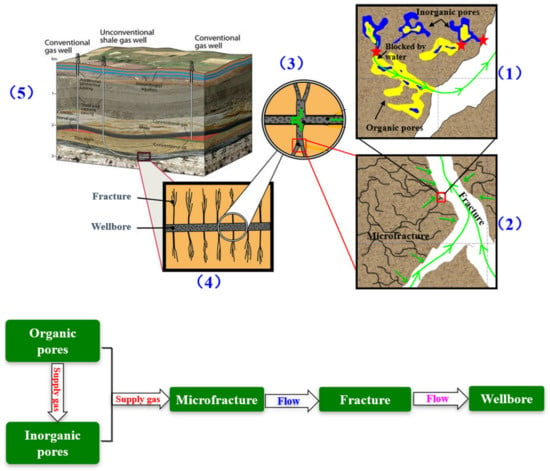
Figure 17.
Micro and macro pathways for gas production from reservoirs. (1) Gas flow in shale nanopore system; (2) gas flow in micro-fractures; (3) gas flow in the branches of hydraulic fractures; (4) gas flow in the main pathway of the hydraulic fractures; (5) gas flow in the well bore.
Overall, the main innovation point of this work is that we proposed a mathematical model to describe gas flow through nanopores by coupling Knudsen diffusion and slip flow; more importantly, the effects of bound water film on gas flow are considered in our model, which are neglected in most of the existing works. In this work, we can only use our model to simulate gas flow in experimental conditions. For modeling gas flow in actual shale rocks, more work is needed, such as experiments for characterizing shale pore sizes, pore shapes, and pore connections to rebuild a shale pore-network model, and real tests for gas flow using shale samples with water saturations or moistures rather than dry ones. These works will be conducted in the future to illustrate a further application of our model.
7. Conclusions
In this work, a model for gas-phase transport in shale nanoscale pores and microfractures under irreducible water conditions was developed. Based on the nanopore single-phase gas transport theory and the actual shale pore structures, and considering the effect of water saturation distribution on the effective pore scale, the gas transport models in the nanoscale circular pores and slit pores were developed. These models then provide a theoretical basis for the rational evaluation and prediction of shale gas well capacity under water-bearing conditions in the reservoir.
The coupling results of the nanoscale effect and pore water saturation on gas phase permeability were quantified. The calculations showed that the influence of water content saturation on gas flow capacity mainly depend on the Knudsen number (controlled by temperature, pressure, pore scale, etc.). The larger the Knudsen number, the more significant the nanoscale effect, and the reduction in gas flow capacity by pore water is weakened. In the case of slit pores, for example, the gas-phase flow capacity is reduced by approximately 51% when Kn < 0.001, and by about 33% when Kn > 1.0.
Therefore, the influence of reservoir bound water on flow capacity cannot be ignored. At the same time, it was shown that the influence of irreducible water on gas-phase flow gradually diminishes with reservoir development, thus ensuring the continued stable production characteristics of shale gas wells.
Author Contributions
Conceptualization, T.Z. and Y.J.; methodology, T.Z.; validation, Y.J.; writing, Y.J.; supervision, T.Z. All authors have read and agreed to the published version of the manuscript.
Funding
This research received no external funding.
Institutional Review Board Statement
Not applicable.
Informed Consent Statement
Not applicable.
Data Availability Statement
Not applicable.
Conflicts of Interest
The authors declare no conflict of interest.
References
- Curtis, J.B. Fractured shale-gas systems. AAPG Bull. 2002, 86, 1921–1938. [Google Scholar]
- Zou, C.; Dong, D.; Wang, S. Geological Characteristics, Formation Mechanism and Resource Potential of Shale Gas in China. Petrol. Explor. Dev. 2010, 37, 641–653. [Google Scholar] [CrossRef]
- Zhao, J.; Cao, Q.; Bai, Y.; Er, C.; Li, J.; Wu, W.; Shen, W. Petroleum accumulation: From the continuous to discontinuous. Pet. Res. 2017, 2, 131–145. [Google Scholar] [CrossRef]
- Nelson, P.H. Pore-throat sizes in sandstones, tight sandstones, and shales. AAPG Bull. 2009, 93, 329–340. [Google Scholar] [CrossRef]
- Yang, F.; Ning, Z.F.; Hu, C.; Wang, B.; Peng, K.; Liu, H. Characterization of microscopic pore structures in shale reservoirs. Acta Pet. Sin. 2013, 34, 301–311. [Google Scholar]
- Cercignani, C.; Daneri, A. Flow of a rarefied gas between two parallel plates. J. Appl. Phys. 1963, 34, 3509–3513. [Google Scholar] [CrossRef]
- Roy, S.; Raju, R.; Chuang, H.F.; Cruden, B.A.; Meyyappan, M. Modeling gas flow through microchannels and nanopores. J. Appl. Phys. 2003, 93, 4870–4879. [Google Scholar] [CrossRef]
- Knudsen, M. Die Gesetze der Molekularströmung und der inneren Reibungsströmung der Gase durch Röhren. Ann. Der Phys. 1909, 333, 75–130. [Google Scholar] [CrossRef] [Green Version]
- Schaaf, S.A.; Chambré, P.L. Flow of Rarefied Gases; Princeton University Press: Princeton, NJ, USA, 1961. [Google Scholar]
- Beskok, A.; Karniadakis, G.E. Report: A model for flows in channels, pipes, and ducts at micro and nano scales. Microscale Thermophys. Eng. 1999, 3, 43–77. [Google Scholar]
- Javadpour, F.; Fisher, D.; Unsworth, M. Nanoscale gas flow in shale gas sediments. J. Can. Pet. Technol. 2007, 46, 55–61. [Google Scholar] [CrossRef]
- Javadpour, F. Nanopores and apparent permeability of gas flow in mudrocks (shales and siltstone). J. Can. Pet. Technol. 2009, 48, 16–21. [Google Scholar] [CrossRef]
- Azom, P.N.; Javadpour, F. Dual-continuum modeling of shale and tight gas reservoirs. In Proceedings of the SPE Annual Technical Conference and Exhibition, San Antonio, TX, USA, 8–10 October 2012. [Google Scholar]
- Darabi, H.; Ettehad, A.; Javadpour, F.; Sepehrnoori, K. Gas flow in ultra-tight shale strata. J. Fluid Mech. 2012, 710, 641–658. [Google Scholar] [CrossRef]
- Singh, H.; Javadpour, F.; Ettehadtavakkol, A.; Darabi, H. Nonempirical apparent permeability of shale. SPE Reserv. Eval. Eng. 2014, 17, 414–424. [Google Scholar] [CrossRef]
- Rushing, J.A.; Newsham, K.E.; Van Fraassen, K.C. Measurement of the two-phase gas slippage phenomenon and its effect on gas relative permeability in tight gas sands. In Proceedings of the SPE Annual Technical Conference and Exhibition, Denver, CO, USA, 5–8 October 2003. [Google Scholar]
- Li, K.; Horne, R.N. Gas slippage in two-phase flow and the effect of temperature. In Proceedings of the SPE Western Regional Meeting, Bakersfield, CA, USA, 26–30 March 2001. [Google Scholar]
- Li, K.; Horne, R.N. Experimental study of gas slippage in two-phase flow. SPE Reserv. Eval. Eng. 2004, 7, 409–415. [Google Scholar] [CrossRef]
- Han, F.; Busch, A.; van Wageningen, N.; Yang, J.; Liu, Z.; Krooss, B.M. Experimental study of gas and water transport processes in the inter-cleat (matrix) system of coal: Anthracite from Qinshui Basin, China. Int. J. Coal Geol. 2010, 81, 128–138. [Google Scholar] [CrossRef]
- Wang, S.; Elsworth, D.; Liu, J. Permeability evolution in fractured coal: The roles of fracture geometry and water-content. Int. J. Coal Geol. 2011, 87, 13–25. [Google Scholar] [CrossRef]
- Pan, Z.; Connell, L.D.; Camilleri, M.; Connelly, L. Effects of matrix moisture on gas diffusion and flow in coal. Fuel 2010, 89, 3207–3217. [Google Scholar] [CrossRef]
- Gensterblum, Y.; Ghanizadeh, A.; Krooss, B.M. Gas permeability measurements on Australian subbituminous coals: Fluid dynamic and poroelastic aspects. J. Nat. Gas Sci. Eng. 2014, 19, 202–214. [Google Scholar] [CrossRef]
- Gensterblum, Y.; Ghanizadeh, A.; Cuss, R.J.; Amann-Hildenbrand, A.; Krooss, B.M.; Clarkson, C.R.; Harrington, J.F.; Zoback, M.D. Gas transport and storage capacity in shale gas reservoirs—A review. Part A Transp. Process. J. Unconv. Oil Gas Resour. 2015, 12, 87–122. [Google Scholar]
- Wu, Q.; Bai, B.; Ma, Y.; Ok, J.T.; Neeves, K.B.; Yin, X. Optic imaging of two-phase-flow behavior in 1D nanoscale channels. SPE J. 2014, 19, 793–802. [Google Scholar] [CrossRef]
- Wu, K.; Chen, Z.; Li, X. Real gas transport through nanopores of varying cross-section type and shape in shale gas reservoirs. Chem. Eng. J. 2015, 281, 813–825. [Google Scholar] [CrossRef]
- Wu, K.; Li, X.; Wang, C.; Chen, Z.; Yu, W. A model for gas transport in micro fractures of shale and tight gas reservoirs. AIChE J. 2015, 61, 2079–2088. [Google Scholar] [CrossRef]
- Wu, K.; Chen, Z.; Li, X.; Guo, C.; Wei, M. A model for multiple transport mechanisms through nanopores of shale gas reservoirs with real gas effect–adsorption-mechanic coupling. Int. J. Heat Mass Transf. 2016, 93, 408–426. [Google Scholar] [CrossRef]
- Li, J.; Li, X.; Wang, X.; Li, Y.; Wu, K.; Shi, J.; Yang, L.; Feng, D.; Zhang, T.; Yu, P. Water distribution characteristic and effect on methane adsorption capacity in shale clay. Int. J. Coal Geol. 2016, 159, 135–154. [Google Scholar] [CrossRef]
- Li, J.; Li, X.; Wu, K.; Wang, X.; Shi, J.; Yang, L.; Zhang, H.; Sun, Z.; Wang, R.; Feng, D. Water Sorption and Distribution Characteristics in Clay and Shale: Effect of Surface Force. Energy Fuels 2016, 30, 8863–8874. [Google Scholar] [CrossRef]
- Li, J.; Li, X.; Wu, K.; Feng, D.; Zhang, T.; Zhang, Y. Thickness and stability of water film confined inside nanoslits and nanocapillaries of shale and clay. Int. J. Coal Geol. 2017, 179, 253–268. [Google Scholar] [CrossRef]
Publisher’s Note: MDPI stays neutral with regard to jurisdictional claims in published maps and institutional affiliations. |
© 2022 by the authors. Licensee MDPI, Basel, Switzerland. This article is an open access article distributed under the terms and conditions of the Creative Commons Attribution (CC BY) license (https://creativecommons.org/licenses/by/4.0/).